


Características


¿Tienes alguna pregunta?
Recomendar


7 diapositivas
North America Population Infographic Presentation
North America is a continent located in the northern hemisphere of the Earth, bordered by the Pacific Ocean to the west. It includes countries such as the United States, Canada, Mexico, and several others in the Caribbean and Central America. This template can be a powerful tool to communicate information about the continent in an informative and engaging way. This can help people understand and appreciate the diversity and complexity of North America, and can be used for a variety of purposes, from education to marketing. This template is compatible with Powerpoint, Keynote and Google Slides.


4 diapositivas
User Base by Demographic Factors
Understand your audience at a glance with the User Base by Demographic Factors Presentation. This visual template displays gender-based or group-based demographic insights alongside bar chart statistics and percentages, making it ideal for marketing reports, pitch decks, or user research presentations. Fully customizable in PowerPoint, Keynote, and Google Slides.


28 diapositivas
Hawking Brand Strategy Report Presentation
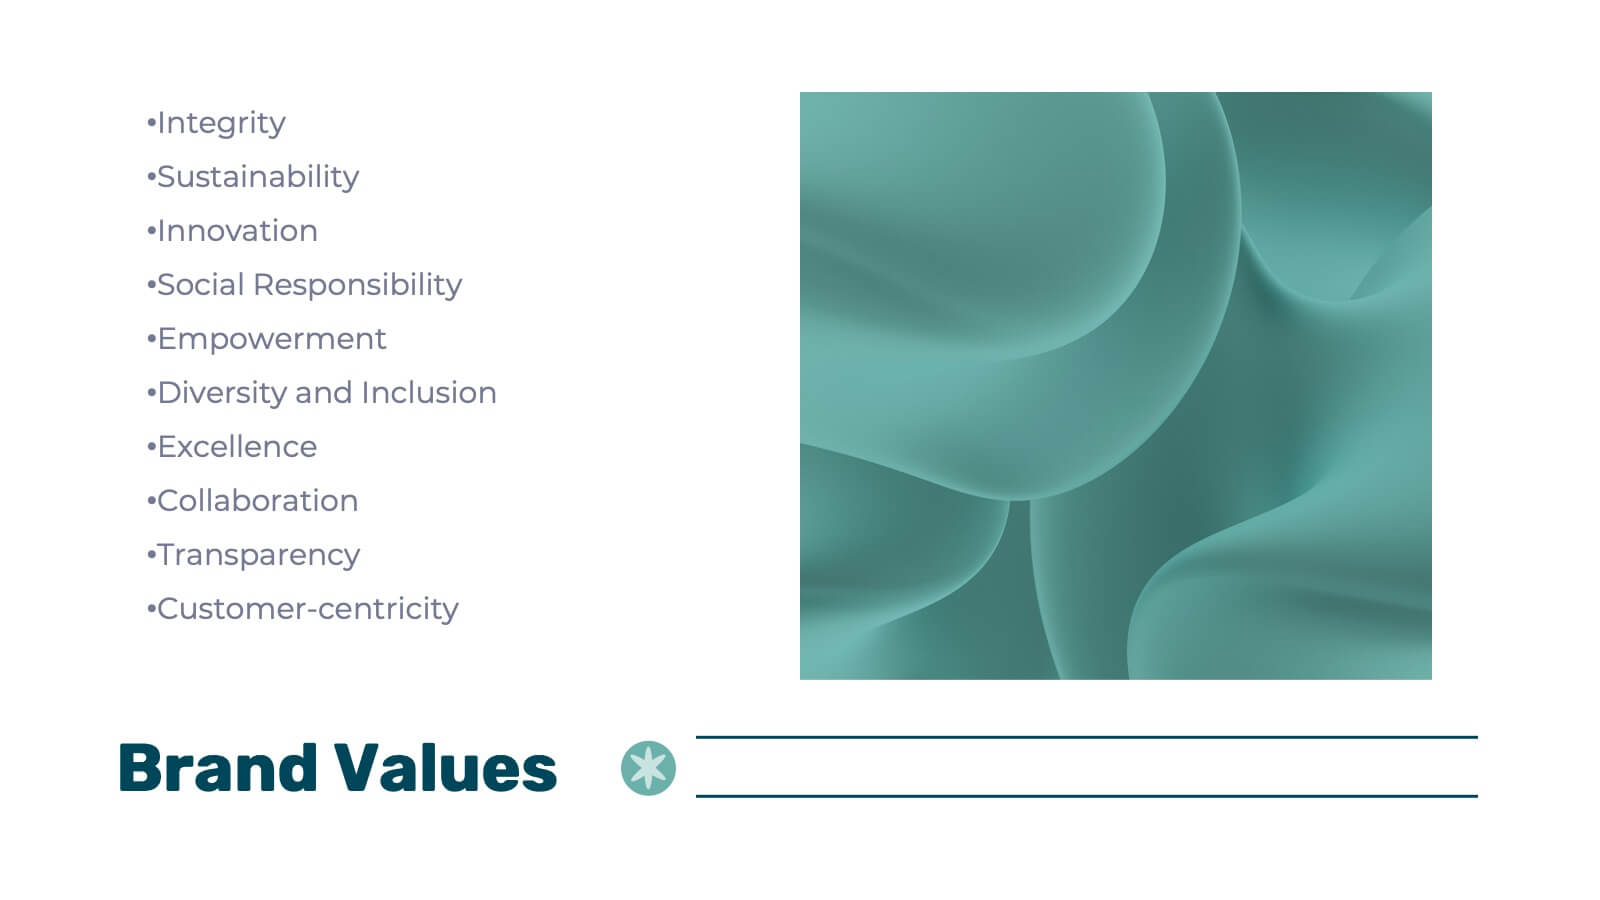
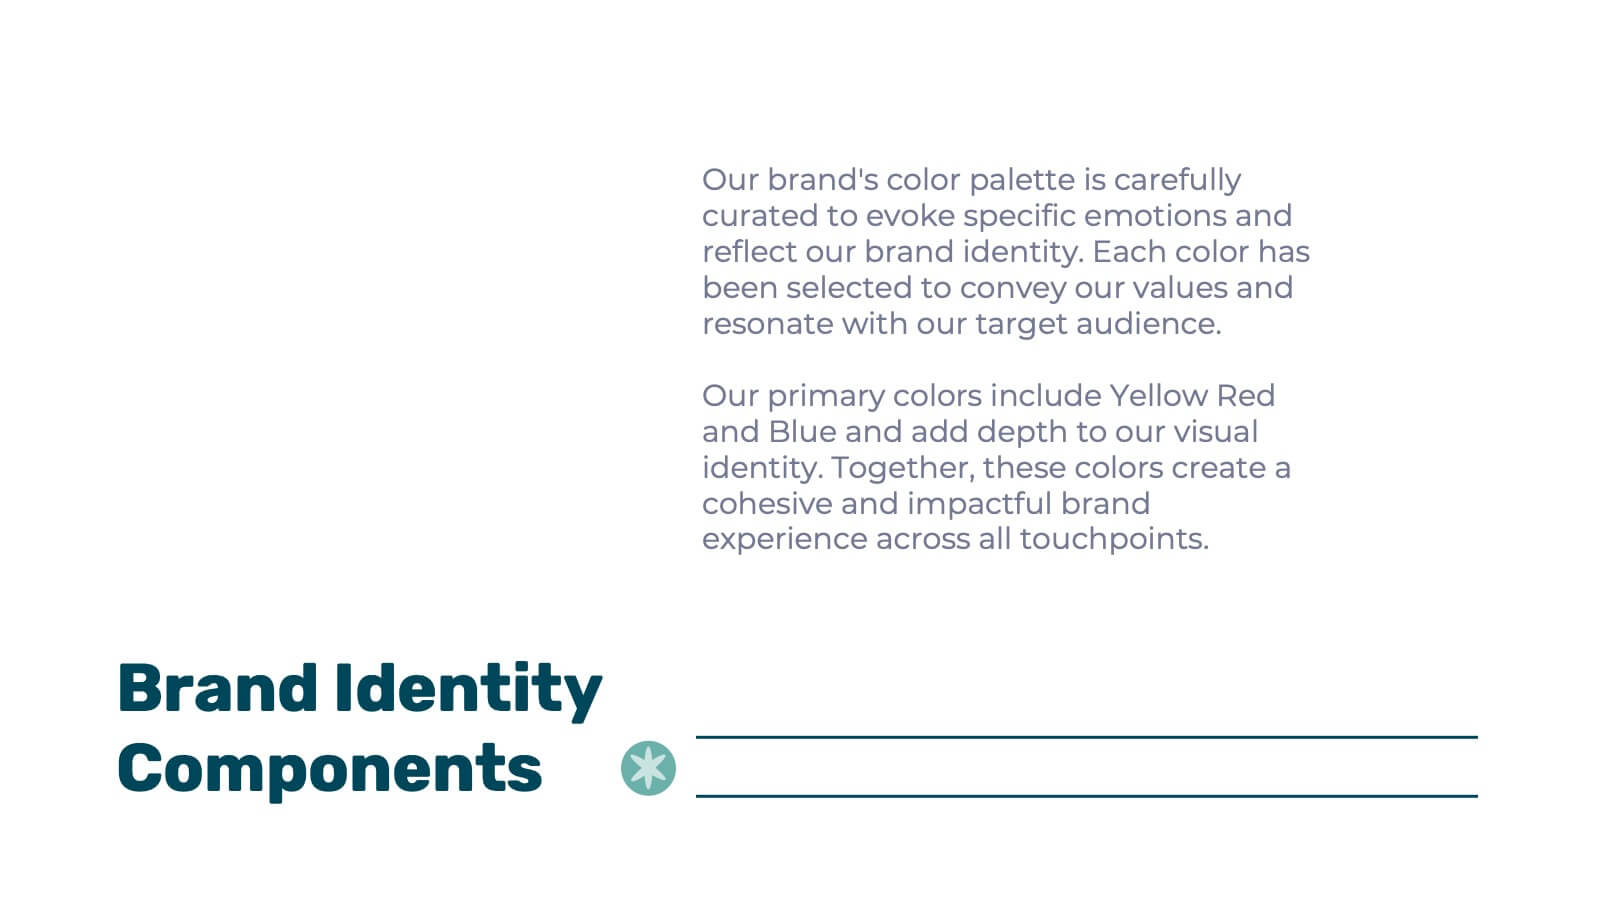
Introduce your brand's vision with this polished and professional strategy report presentation template. Designed for businesses, marketers, and branding agencies, it features comprehensive sections for communicating your brand identity, goals, and market positioning. This template highlights areas such as brand philosophy, target audience insights, competitive analysis, and visual identity systems. Showcase your brand’s unique selling proposition with engaging slides dedicated to colors, typography, logos, and packaging. With layouts tailored for presenting data, strategies, and case studies, you’ll ensure every aspect of your brand resonates clearly. Compatible with PowerPoint, Google Slides, and Keynote, this template is fully customizable to match your style and branding needs. Its clean, modern design and easy-to-edit structure make it a versatile choice for strategy reports, pitches, or team presentations. Elevate your branding efforts and communicate your story with confidence and clarity.


3 diapositivas
Workflow Improvement and Progress Chart Presentation
Folders aren't just for files—they’re perfect for ideas too. This visual chart maps out streamlined processes, making it easier to track progress and improve internal workflow. Great for managers and teams, this infographic presentation template is fully compatible with PowerPoint, Keynote, and Google Slides for effortless editing and sharing.


7 diapositivas
Root Cause Analysis Infographic Presentation Template
Root cause analysis is a method of problem solving that identifies the cause of an issue and tries to prevent similar issues from happening again. Root cause analysis can be used in any industry, including IT, manufacturing, telecommunications, industrial process control, accident analysis and healthcare to eliminate misunderstandings. This template is perfect if you need an essential problem-solving method. This root cause analysis template includes a helpful timeline to keep track of items that cross through each stage in the process, and a diagram of all the possible causes.


5 diapositivas
New Hire Onboarding Roadmap Presentation
Guide new employees with clarity using the New Hire Onboarding Roadmap Presentation. This visual roadmap features a timeline layout with icons resembling briefcases, each representing a stage in the onboarding process. Ideal for HR professionals or team leads, it helps outline milestones such as orientation, training, and integration steps. Fully editable in Canva, PowerPoint, Google Slides, and Keynote.


5 diapositivas
SEO and Funnel Tactics in Marketing Presentation
Showcase your digital strategy step-by-step with the SEO and Funnel Tactics in Marketing Presentation. Designed with a layered visual layout, this template helps you highlight up to five key stages of your marketing funnel—from awareness to conversion. Fully customizable in PowerPoint, Canva, Keynote, and Google Slides.


6 diapositivas
Customer Satisfaction Smile Chart Presentation
Bring your data to life with a slide that instantly shows how customers feel, blending clean visuals with an intuitive emotion scale. This presentation helps you communicate feedback trends, highlight satisfaction levels, and support decision-making with clarity. Ideal for reports, reviews, and strategy updates. Fully compatible with PowerPoint, Keynote, and Google Slides.


22 diapositivas
Inspirae Project Status Report Presentation
This sleek and modern project status report presentation template is designed to help you effectively communicate progress, challenges, and key insights. It covers essential sections such as performance metrics, sales performance, risk assessments, and strategic initiatives, ensuring a comprehensive overview. Compatible with PowerPoint, Keynote, and Google Slides for seamless customization.


8 diapositivas
Business Challenge & Solution Presentation
Address complex issues with clarity using this business challenges and solutions presentation. Featuring a chess knight visual, it helps outline problems and corresponding strategies. Ideal for strategic planning, risk management, and executive briefings. Fully customizable in PowerPoint, Keynote, and Google Slides to fit your corporate or consulting presentation needs.


4 diapositivas
Timeline of Business Achievements Presentation
Visualize progress with clarity using the Timeline of Business Achievements Presentation. This sleek template features both horizontal and vertical timeline formats to showcase yearly milestones, step-by-step phases, and key tasks. Ideal for project reporting, strategy rollouts, and roadmap updates. Fully editable and compatible with PowerPoint, Keynote, and Google Slides.


6 diapositivas
Safety Equipment Infographic
Safety equipment refers to various tools, devices, and gear that are designed to protect individuals from potential hazards and accidents in various environments and situations. This infographic involves presenting essential safety equipment, their uses, and benefits. With this template you can encourage your audience to prioritize the use of appropriate safety equipment. The combination of clear text, icons, and visuals will help viewers understand the significance of safety equipment and its role in preventing accidents and injuries. Compatible with Powerpoint, Keynote, and Google Slides. Choose a color scheme that aligns with safety and caution.


6 diapositivas
Fishbone Diagram
A fishbone diagram, also known as a cause-and-effect diagram or an Ishikawa diagram, is a visual tool used to identify and analyze the potential causes of a problem or an effect. This infographic template is designed to help you explore and understand the root causes of an issue by visually mapping out various contributing factors. This cause-and-effect diagram, provides a structured approach to identify and categorize the various factors contributing to a specific outcome. This template is fully customizable and compatible with Powerpoint, Keynote, and Google Slides making it easy to input your information.


8 diapositivas
Meet the Team Presentation
Showcase your team effectively with our "Meet the Team Presentation" template. This sleek design features personalized cards for each team member, displaying their photo, name, and contact details on a visually appealing, color-coded background. Perfect for onboarding, company introductions, or team-building presentations, this template enhances recognition and cohesion. The distinct colors can be used to signify different roles or departments, making it easy to identify team dynamics at a glance. Compatible with PowerPoint, Keynote, and Google Slides, it’s an essential tool for any organization aiming to present their team in a professional and engaging manner.


6 diapositivas
Workflow and Operations Flow Presentation
Optimize your operations with the Workflow and Operations Flow presentation. This structured and visually appealing template helps you map out workflows, streamline processes, and enhance team coordination. Perfect for project managers, business analysts, and operational leaders, these fully editable slides allow you to visualize key steps and dependencies with ease. Compatible with PowerPoint, Keynote, and Google Slides.


23 diapositivas
Skycrest Business Idea Pitch Deck Presentation
Present your innovative business idea with this bold pitch deck, featuring sections for problem statement, solution, business model, and financial projections. Ideal for capturing investor attention, this template supports PowerPoint, Keynote, and Google Slides, making it perfect for impactful presentations across multiple platforms.


6 diapositivas
IT Architecture Diagram Presentation
Turn complex system structures into clear visual stories with this professional presentation. Perfect for mapping processes, software layers, or organizational workflows, it helps communicate how technology components connect and operate. Fully editable and compatible with PowerPoint, Keynote, and Google Slides for seamless customization and engaging technical presentations.