


Características


¿Tienes alguna pregunta?
Recomendar


6 diapositivas
Hexagon Layout for Core Concepts Presentation
Present key concepts with impact using the Hexagon Layout for Core Concepts Presentation. This modular design highlights up to six core ideas in a clean, symmetrical grid—perfect for showcasing features, pillars, or foundational elements. Fully customizable and compatible with Canva, PowerPoint, Google Slides, and Keynote.


7 diapositivas
Transportation & Logistics Infographic PowerPoint Template and Google Slides Theme
A transportation & logistics infographic is a visual representation of information and data related to the movement of goods and people from one place to another. This template can be used to convey complex information about a variety of topics in the transportation and logistics industry. This template includes many graphics, images, and charts to help illustrate your data, and allows you to Input your shipping routes, delivery times, and flow of goods. This template can be used for various purposes, such as educating the public and promoting efficient transportation and logistics practices.


6 diapositivas
Agile Delivery Framework for Projects Presentation
Visualize agile project phases with this spiral delivery framework slide. Ideal for project managers and scrum teams to outline each step in a continuous delivery process. Features six clearly labeled stages, icons, and bold colors. Fully editable in PowerPoint, Keynote, and Google Slides for clear, structured agile workflow presentations.


8 diapositivas
Business Challenge and Issue Definition Presentation
Break down complex problems with clarity using this Business Challenge and Issue Definition presentation. Designed to highlight key issues step by step, this layout helps your audience follow your reasoning with ease. Ideal for internal reviews or strategy alignment, it’s fully editable in Canva, PowerPoint, and Google Slides.


5 diapositivas
Workplace Productivity Moments Presentation
Track progress and boost team performance with this clear and colorful productivity grid. Ideal for visualizing routines, task cycles, or time management strategies across a workweek or project phases. Each column and row is fully editable, making it easy to tailor the layout to your goals. Compatible with PowerPoint, Keynote, and Google Slides.


7 diapositivas
Goals Infographic Presentation Template
A goals infographic is a set of goals, objectives, or plans, often used for personal or organizational planning and development. This template allows you to include information about your specific goals, the steps required to achieve them, the timeline for completion, and any relevant metrics or targets. The purpose of our goals infographic is to help you provide a clear and concise overview of what is to be accomplished, and help you keep focus on achieving those goals. This well-designed infographic can help you prioritize and track progress, and can serve as a visual reminder.


5 diapositivas
Creative Bubble Map Infographic Presentation
Bring your ideas to life with dynamic visuals that make connections clear and storytelling effortless. This modern infographic presentation is perfect for showcasing relationships, categories, or data insights in a bold and engaging way. Fully editable and compatible with PowerPoint, Keynote, and Google Slides for seamless customization.


21 diapositivas
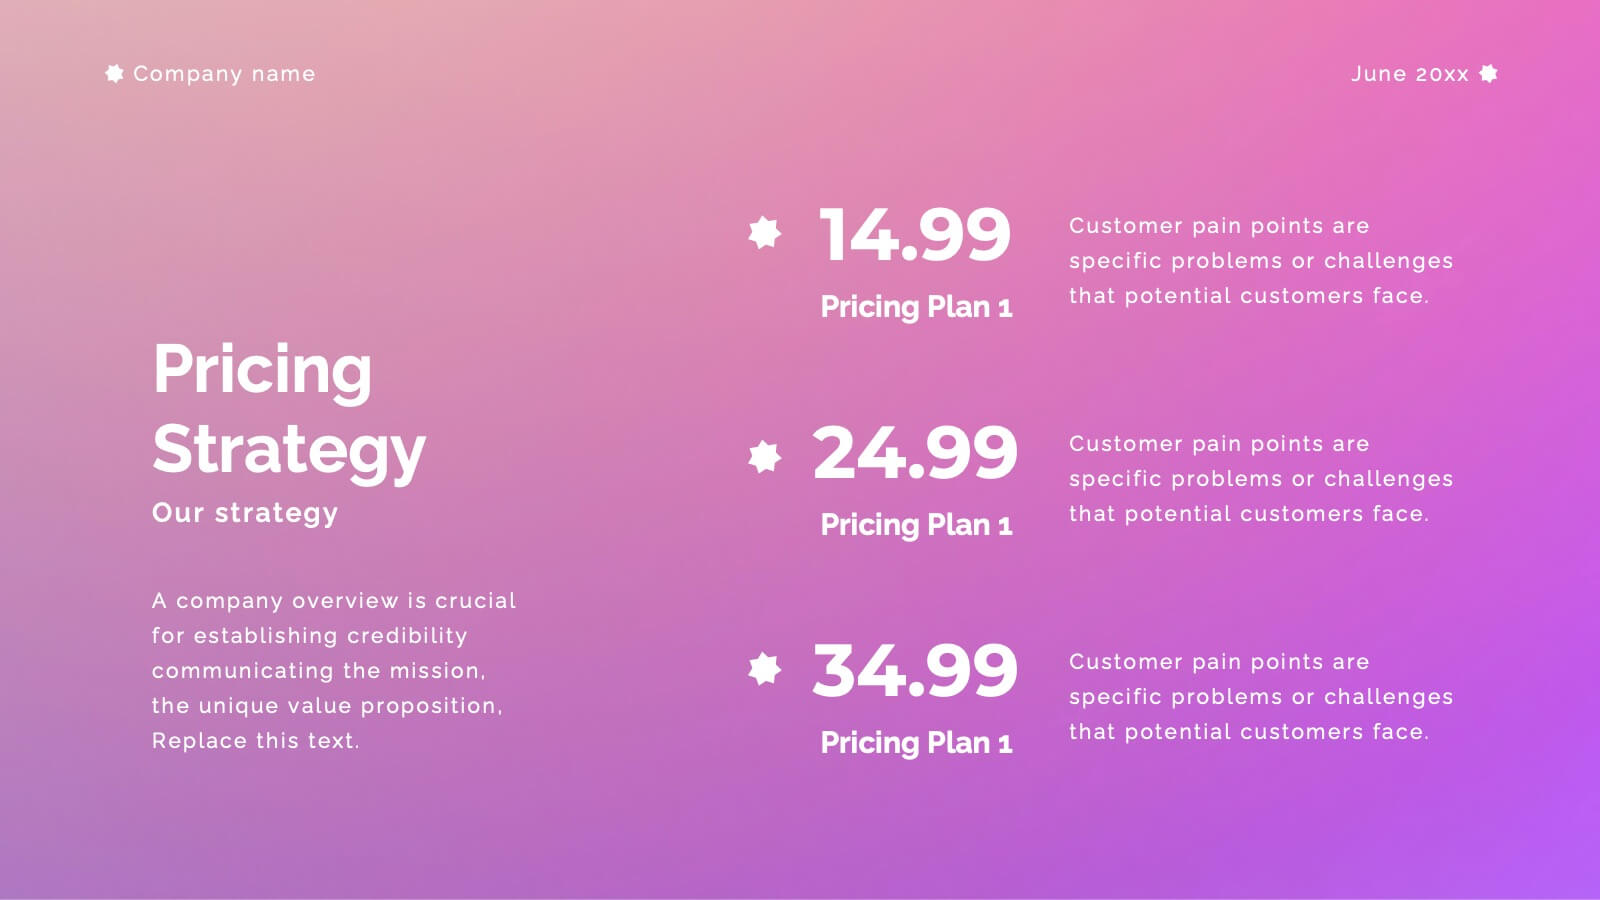
Aventurine New Product Proposal Presentation
Showcase your product in style with this vibrant and modern product proposal template! It covers everything from product features to target market, pricing strategy, and marketing plans. Designed for clarity and impact, it's perfect for pitching your product. Fully customizable, and compatible with PowerPoint, Keynote, and Google Slides for seamless presentations.


21 diapositivas
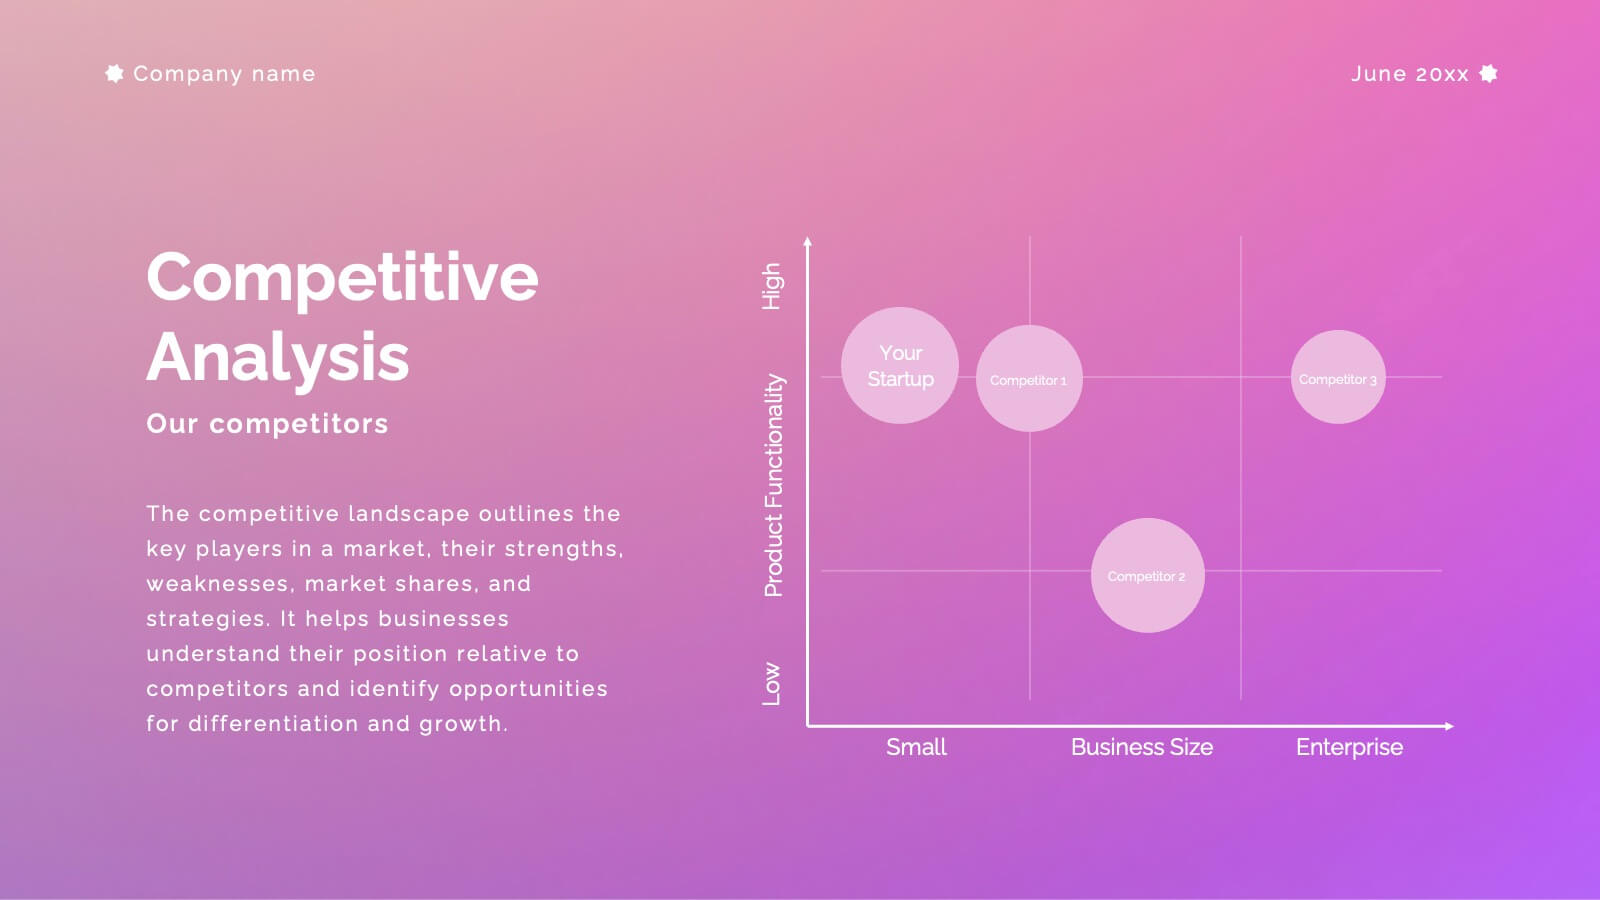
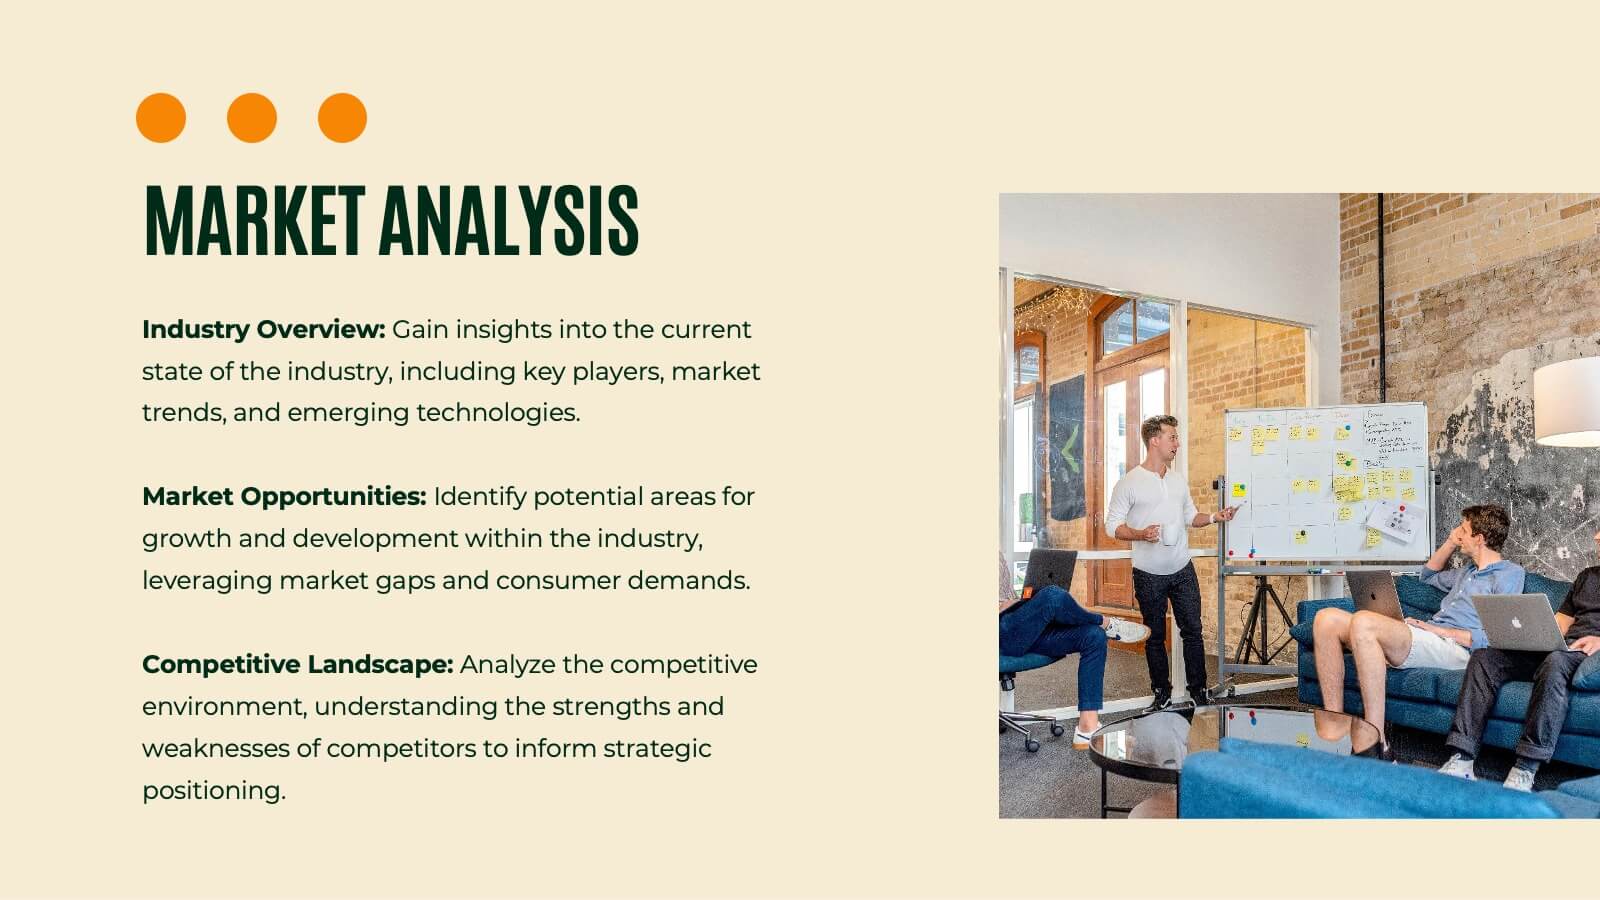
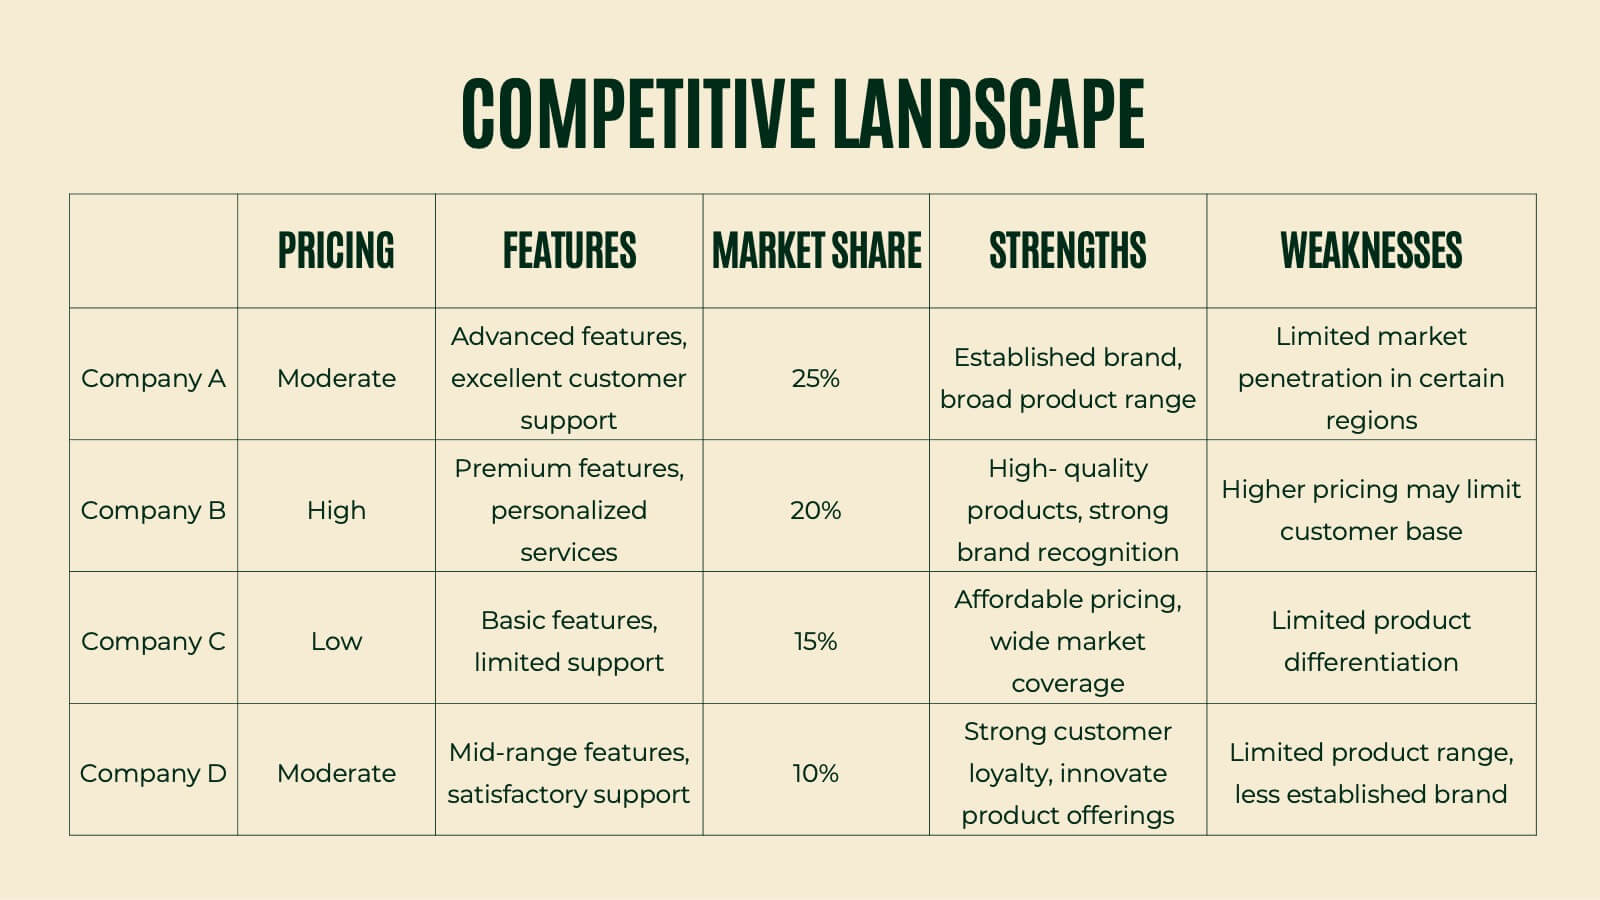
Ruby Startup Funding Proposal Presentation
Get ready to pitch your startup in style with this vibrant and engaging presentation template! Perfect for showcasing your startup’s founding story, business model, market analysis, and financial overview, this template ensures you’ll impress potential investors. Fully customizable and compatible with PowerPoint, Keynote, and Google Slides, it’s ideal for securing funding and support.


5 diapositivas
Stakeholder Mapping and Engagement Plan Presentation
Visualize stakeholder priorities with clarity using the Stakeholder Mapping and Engagement Plan Presentation. This slide features a 2x2 quadrant grid ideal for categorizing stakeholders by power and interest, helping you define appropriate engagement strategies. Great for project managers, corporate strategists, and communication teams. Fully editable in PowerPoint, Keynote, and Google Slides.


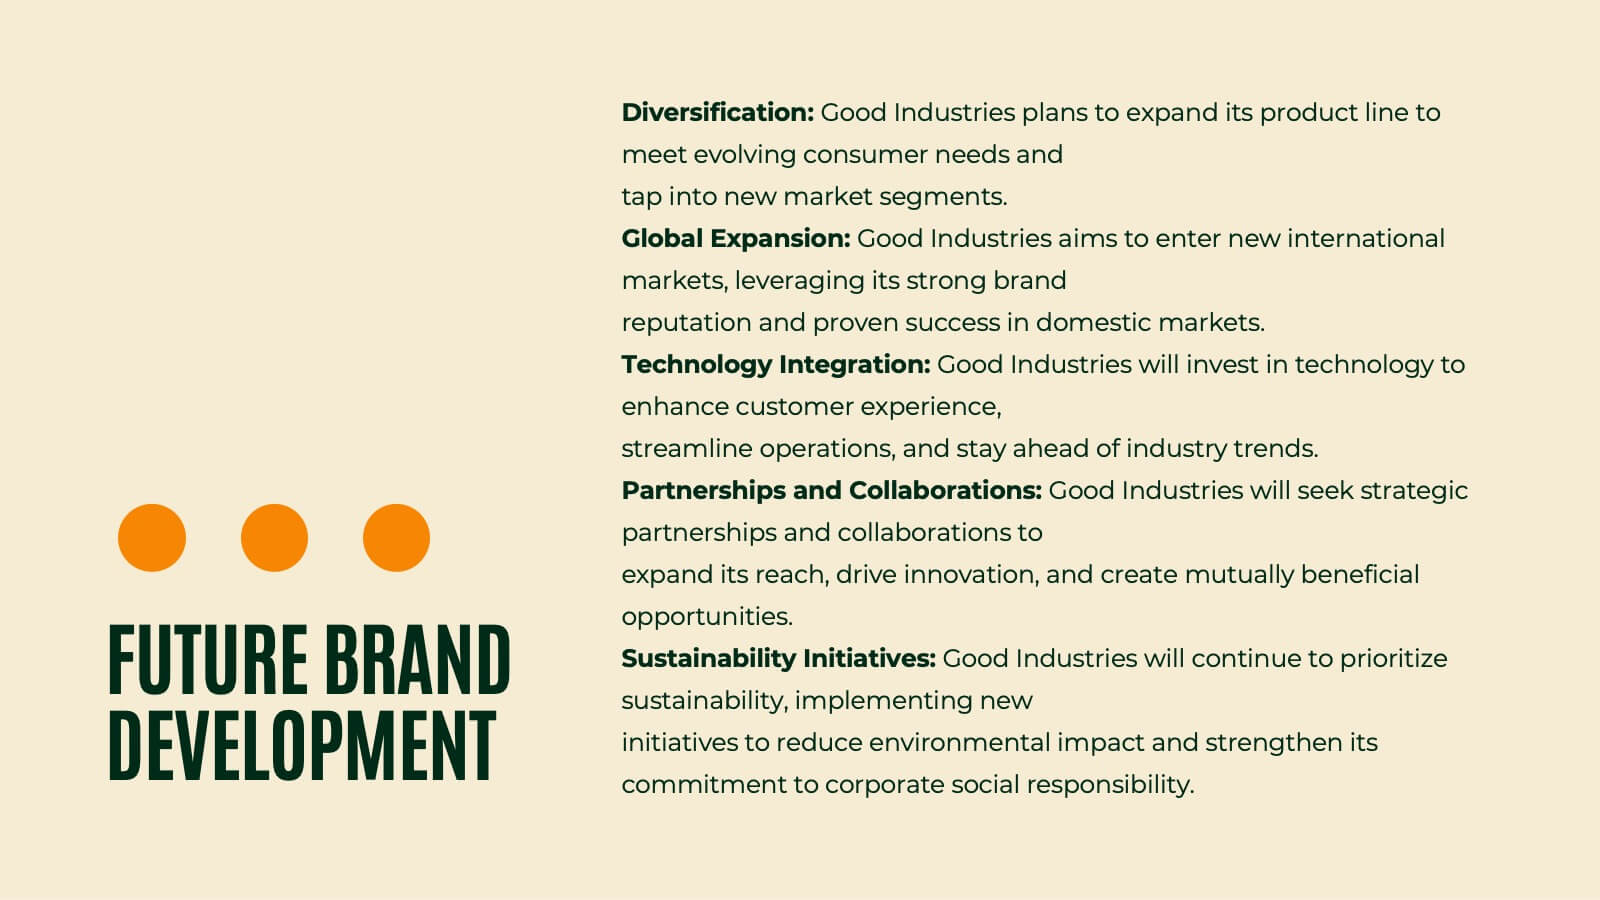

26 diapositivas
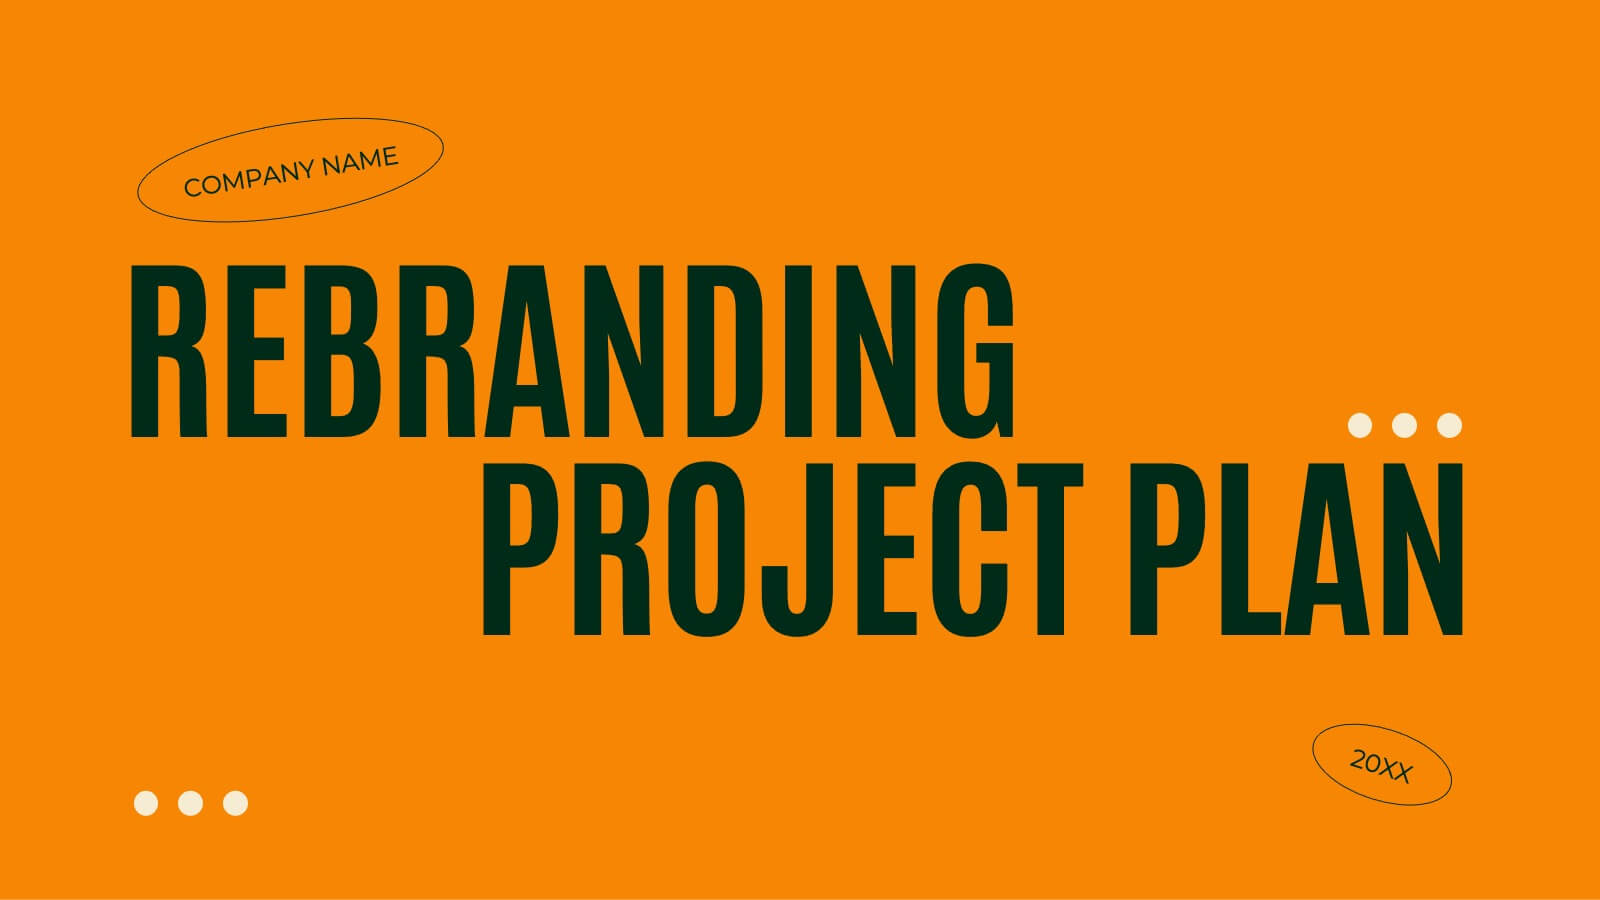
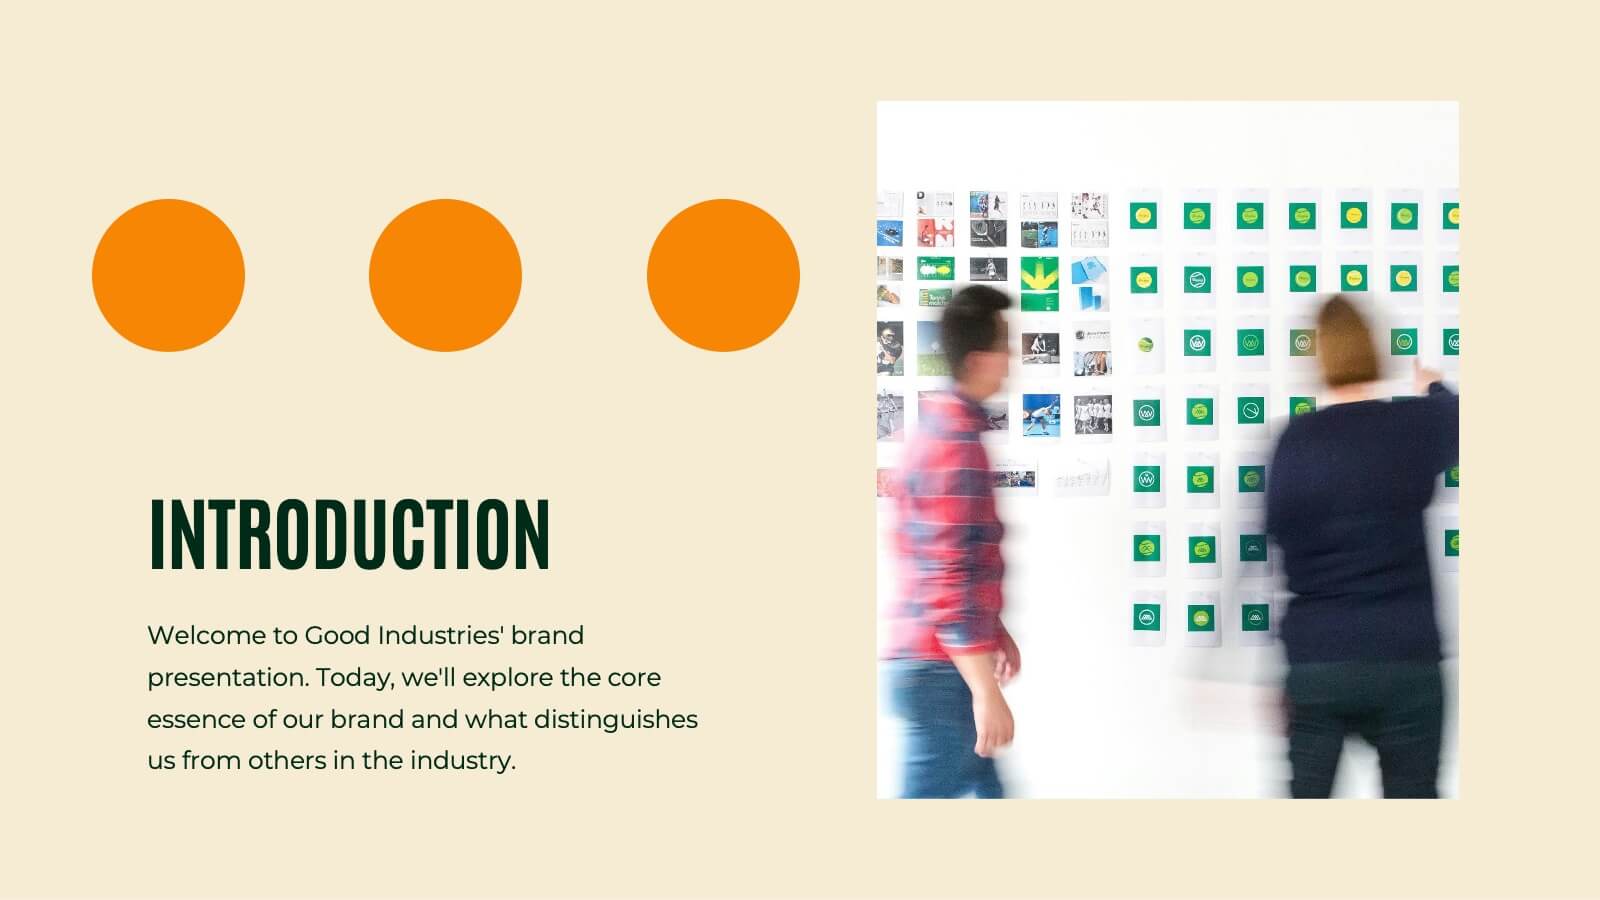
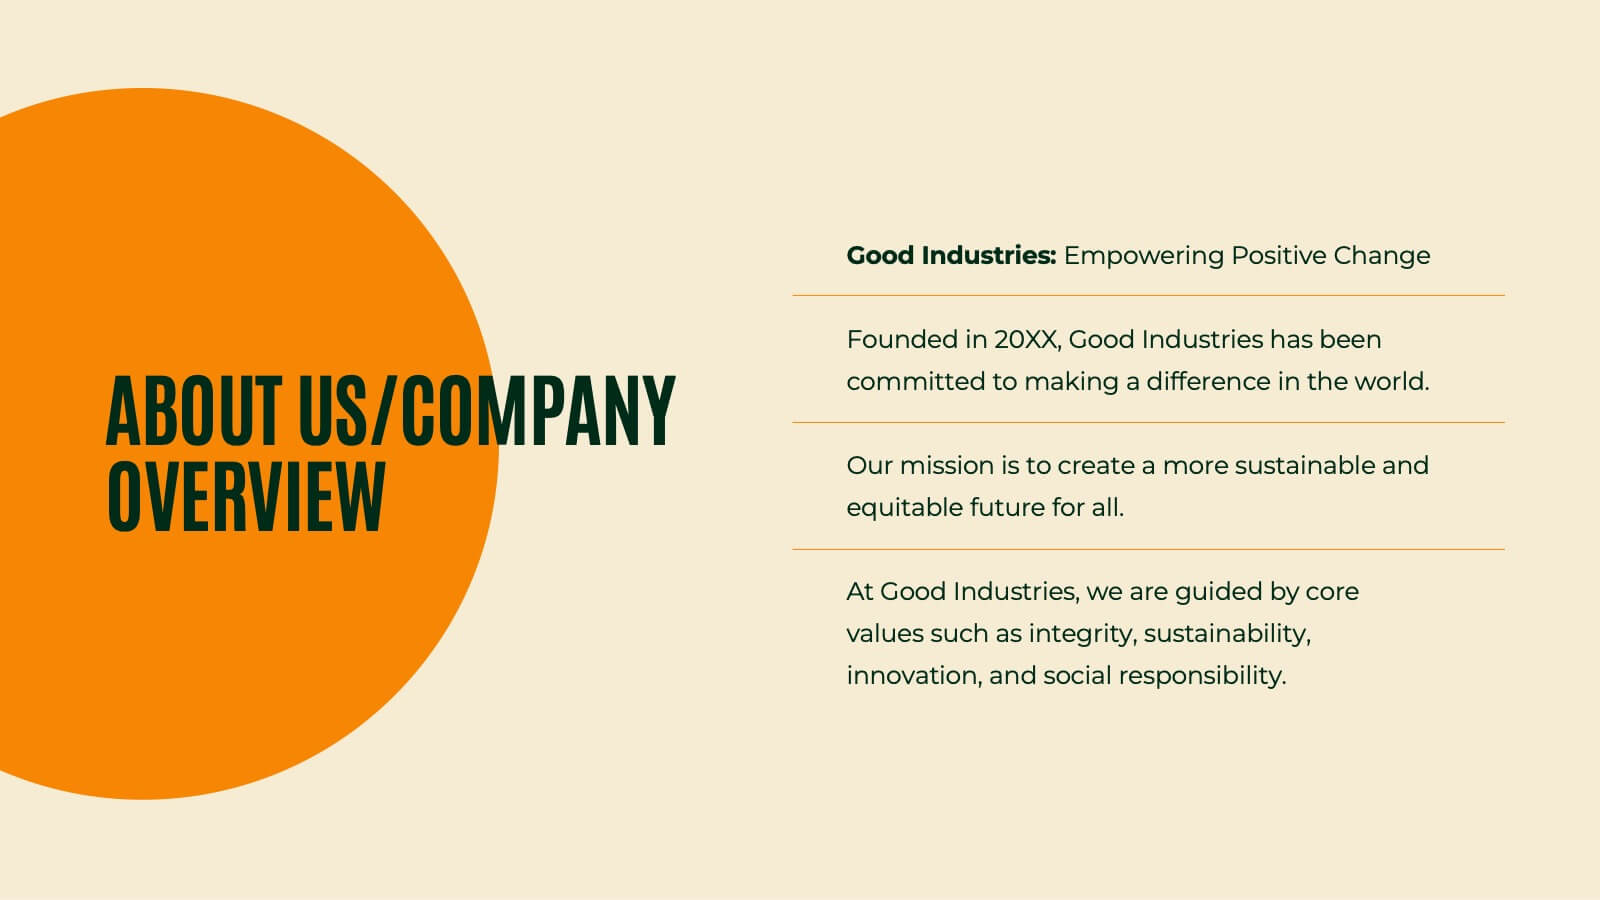
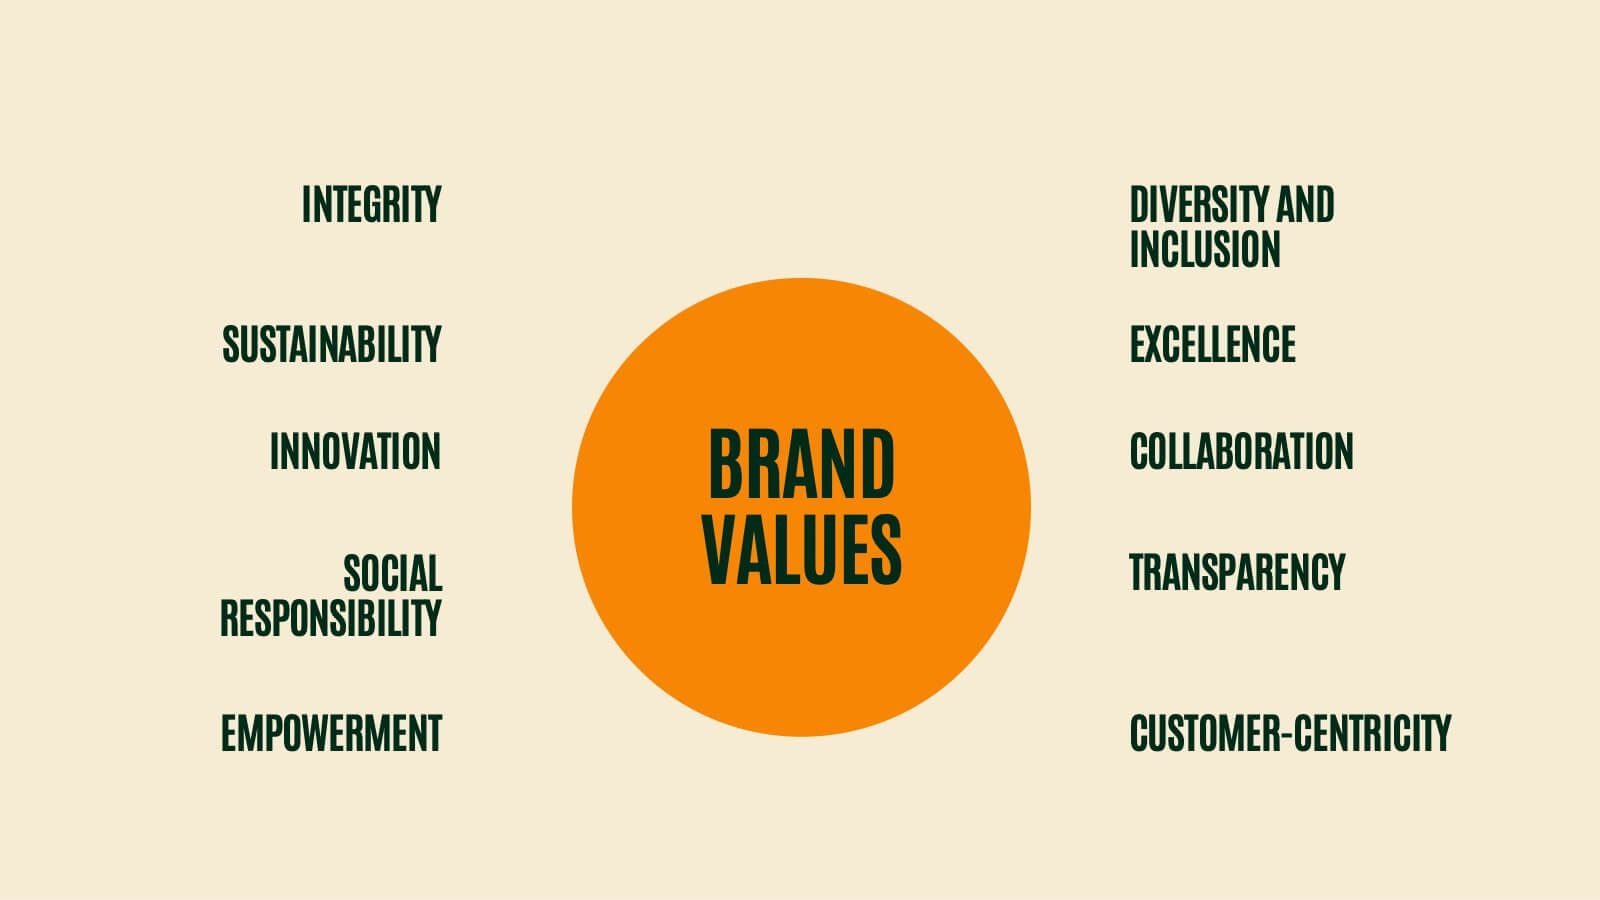
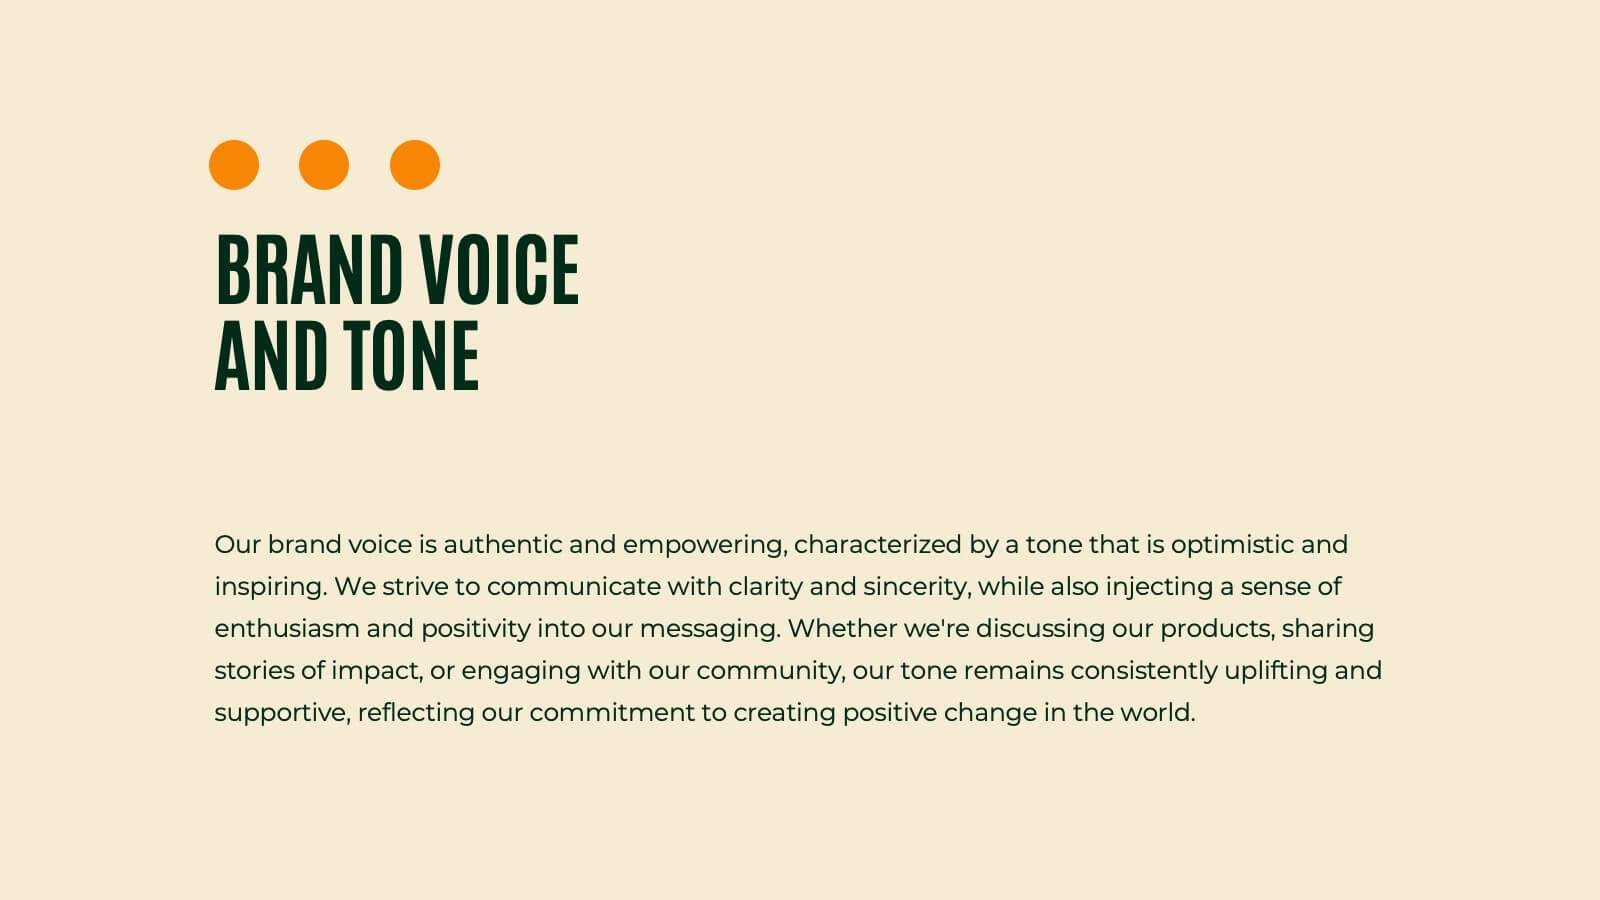
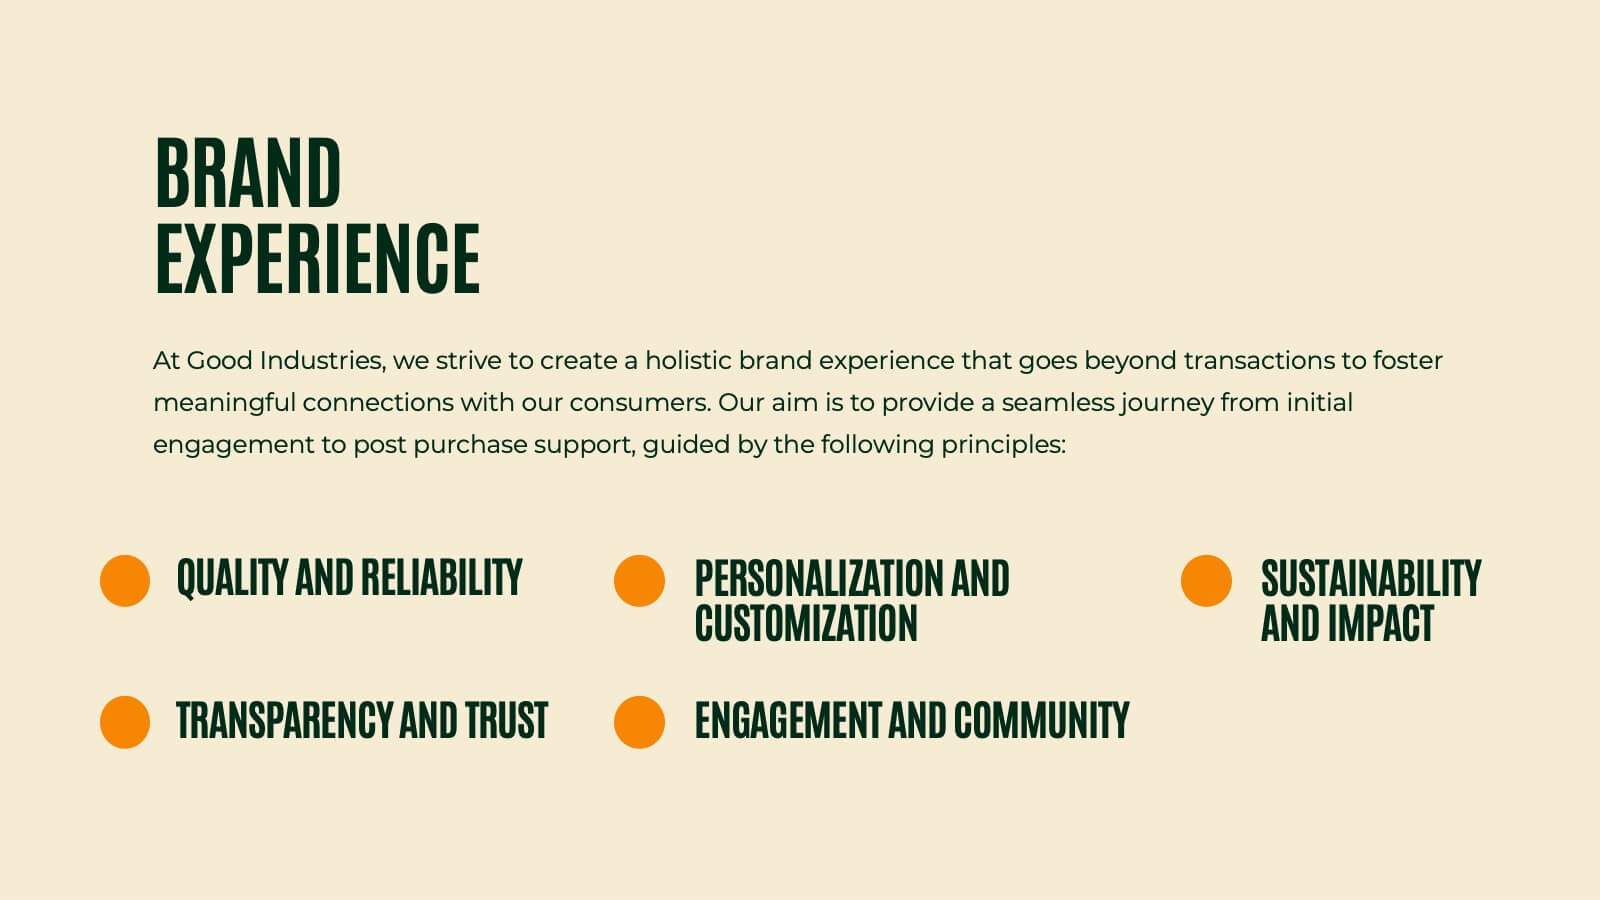
Griffin Rebranding Project Plan Presentation
Unleash the power of branding with this vibrant presentation template! This tool guides you through essential brand elements like identity, voice, and strategy. Perfect for marketers and brand managers aiming to make a memorable impact. Compatible with PowerPoint, Keynote, and Google Slides, it's a must-have for any branding project.


6 diapositivas
Milestones Technologies Infographics
Highlight significant milestones in technology with our Milestones Technologies infographic template. This template is fully compatible with popular presentation software like PowerPoint, Keynote, and Google Slides, allowing you to easily customize it to showcase pivotal moments and achievements in the world of technology. The Milestones Technologies infographic template offers a visually engaging platform to chronicle and celebrate key technological advancements, innovations, and breakthroughs throughout history. Whether you're a tech enthusiast, educator, or simply interested in technological progress, this template provides a user-friendly canvas to create informative presentations and educational materials. Deepen your appreciation for the impact of technology with this SEO-optimized Milestones Technologies infographic template, thoughtfully designed for clarity and ease of use. Customize it to highlight milestones across various fields, from computing and telecommunications to space exploration and biotechnology, making it a valuable resource for sharing the history of technology with your audience. Start crafting your personalized infographic today to explore the remarkable journey of technological progress.


8 diapositivas
Cognitive Psychology and Decision Making
Unlock the logic behind human choices with this eye-catching presentation template that puts cognitive puzzles into perspective—literally. Dive into how thought patterns, mental shortcuts, and biases influence decision making, all illustrated through clean visuals and digestible layouts. Easily customizable for PowerPoint, Keynote, and Google Slides.


26 diapositivas
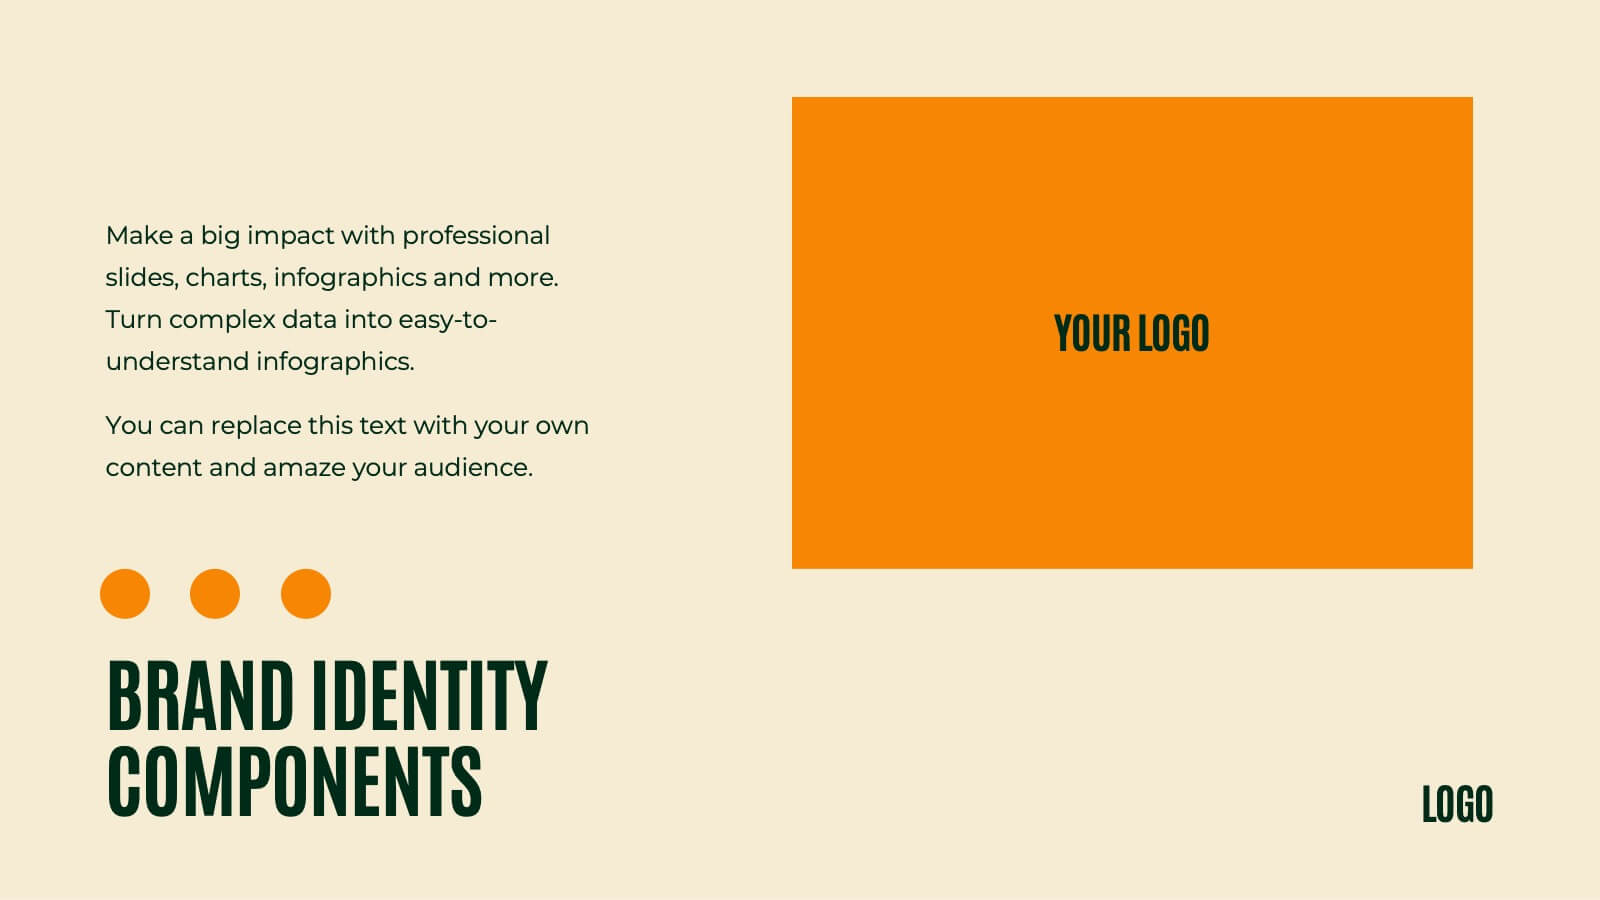
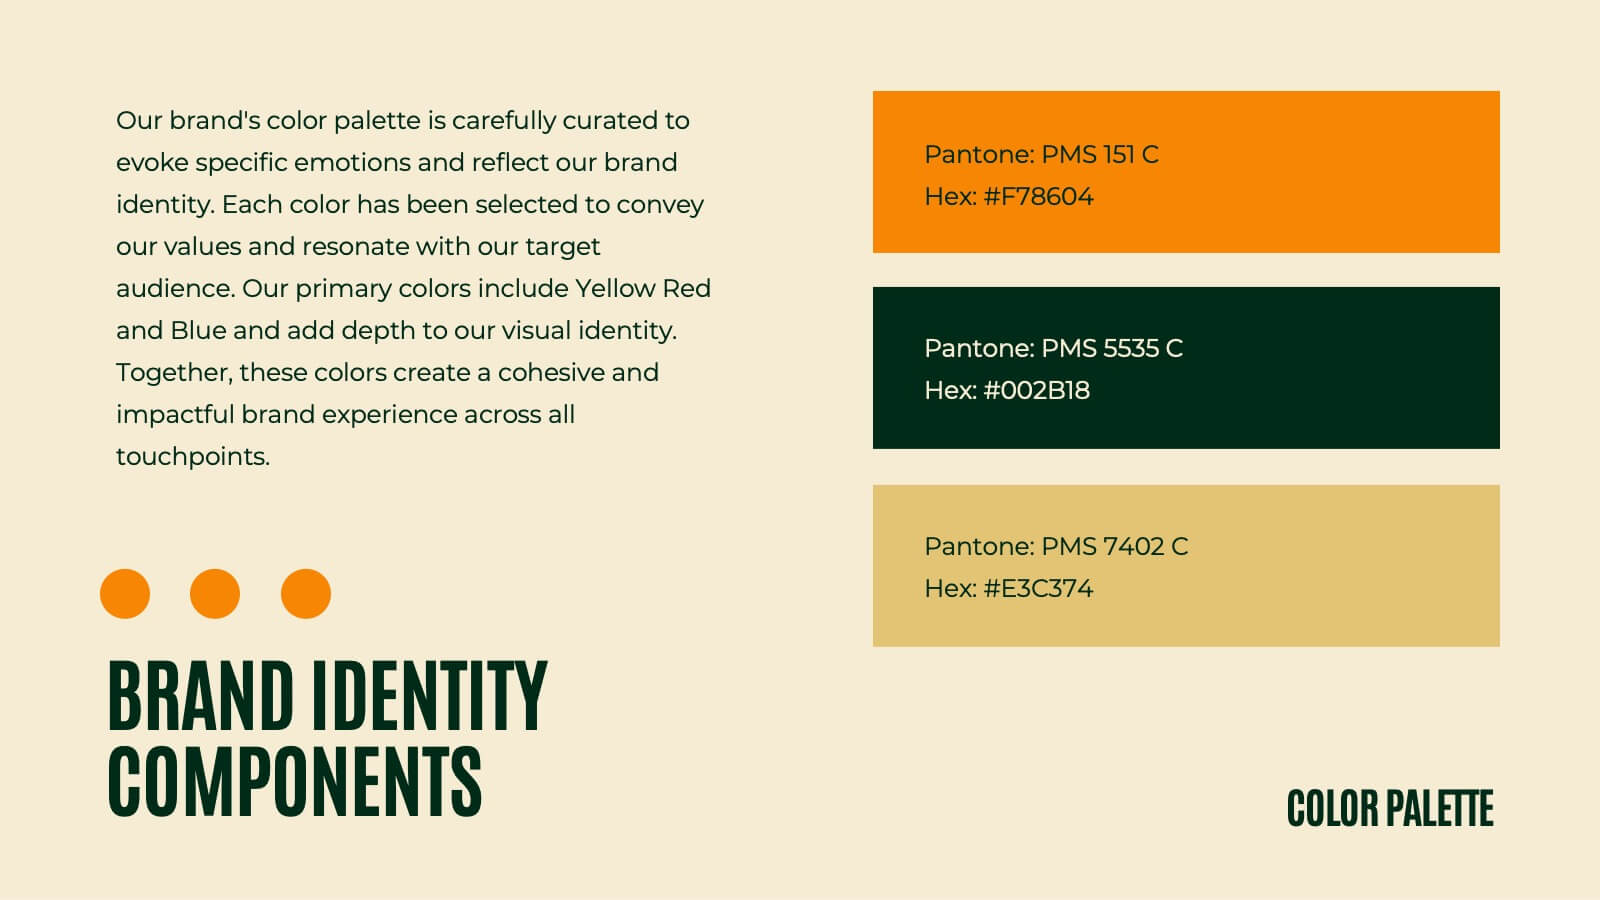
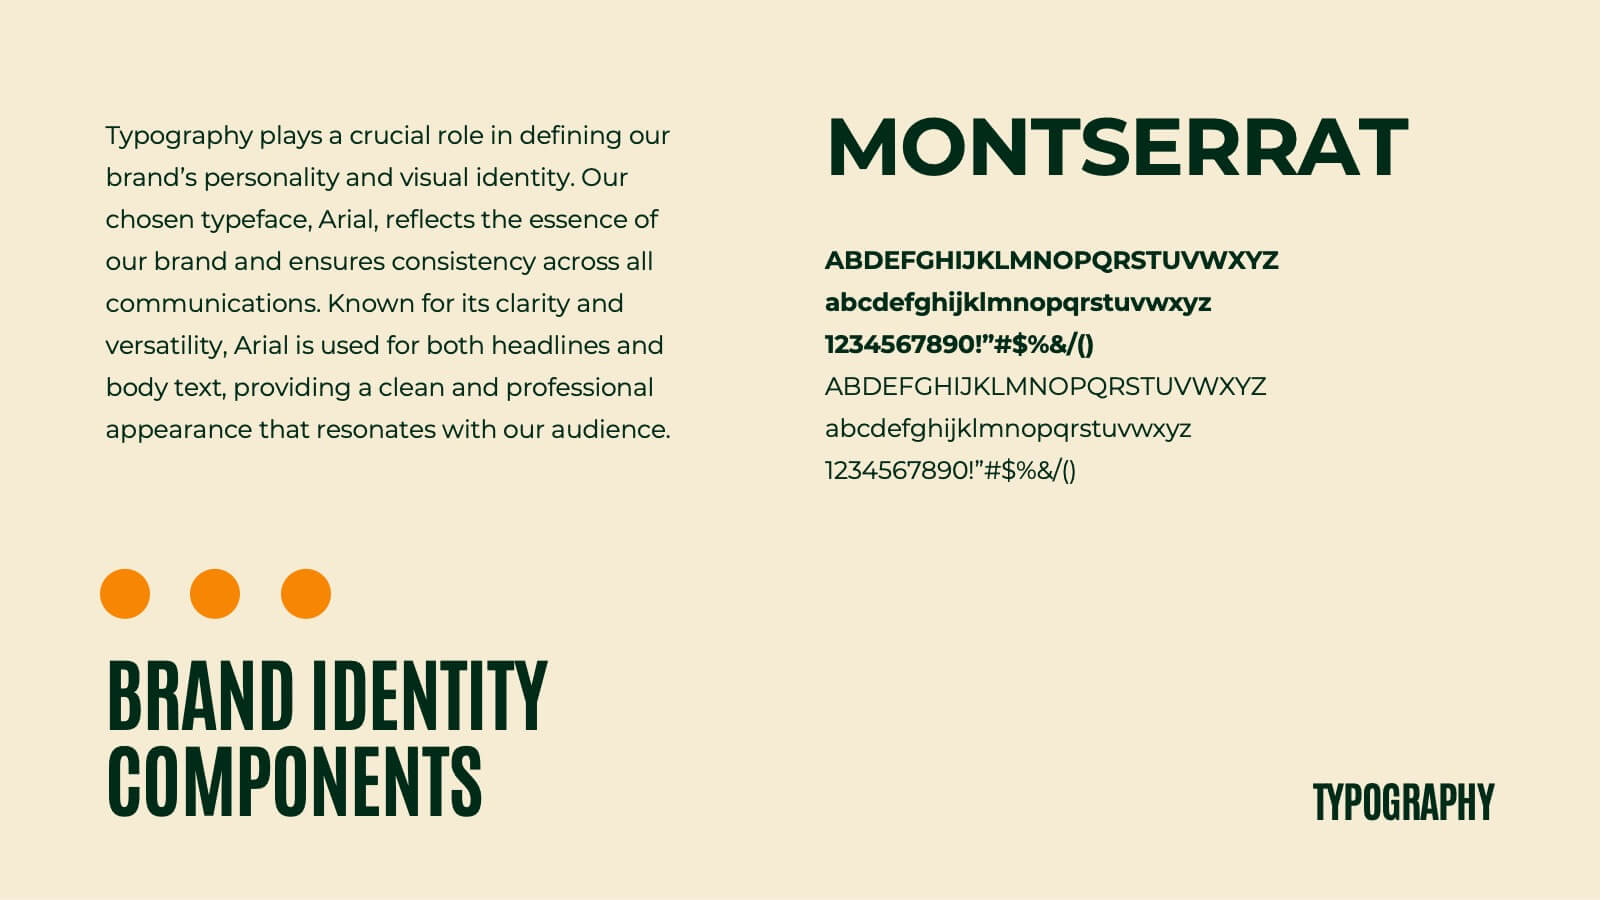
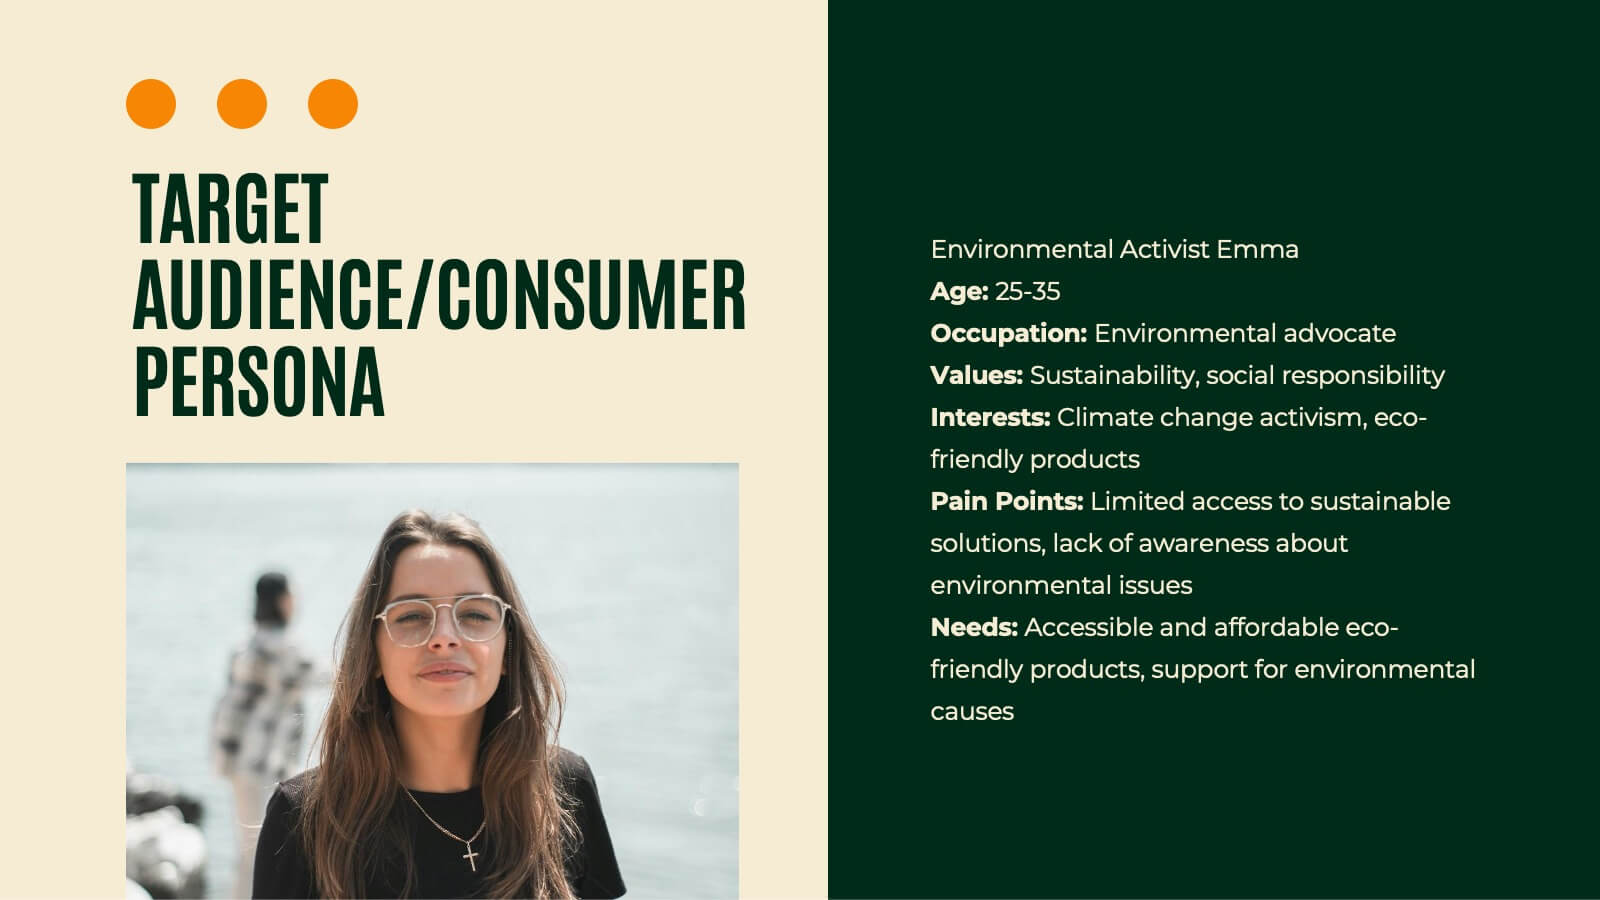
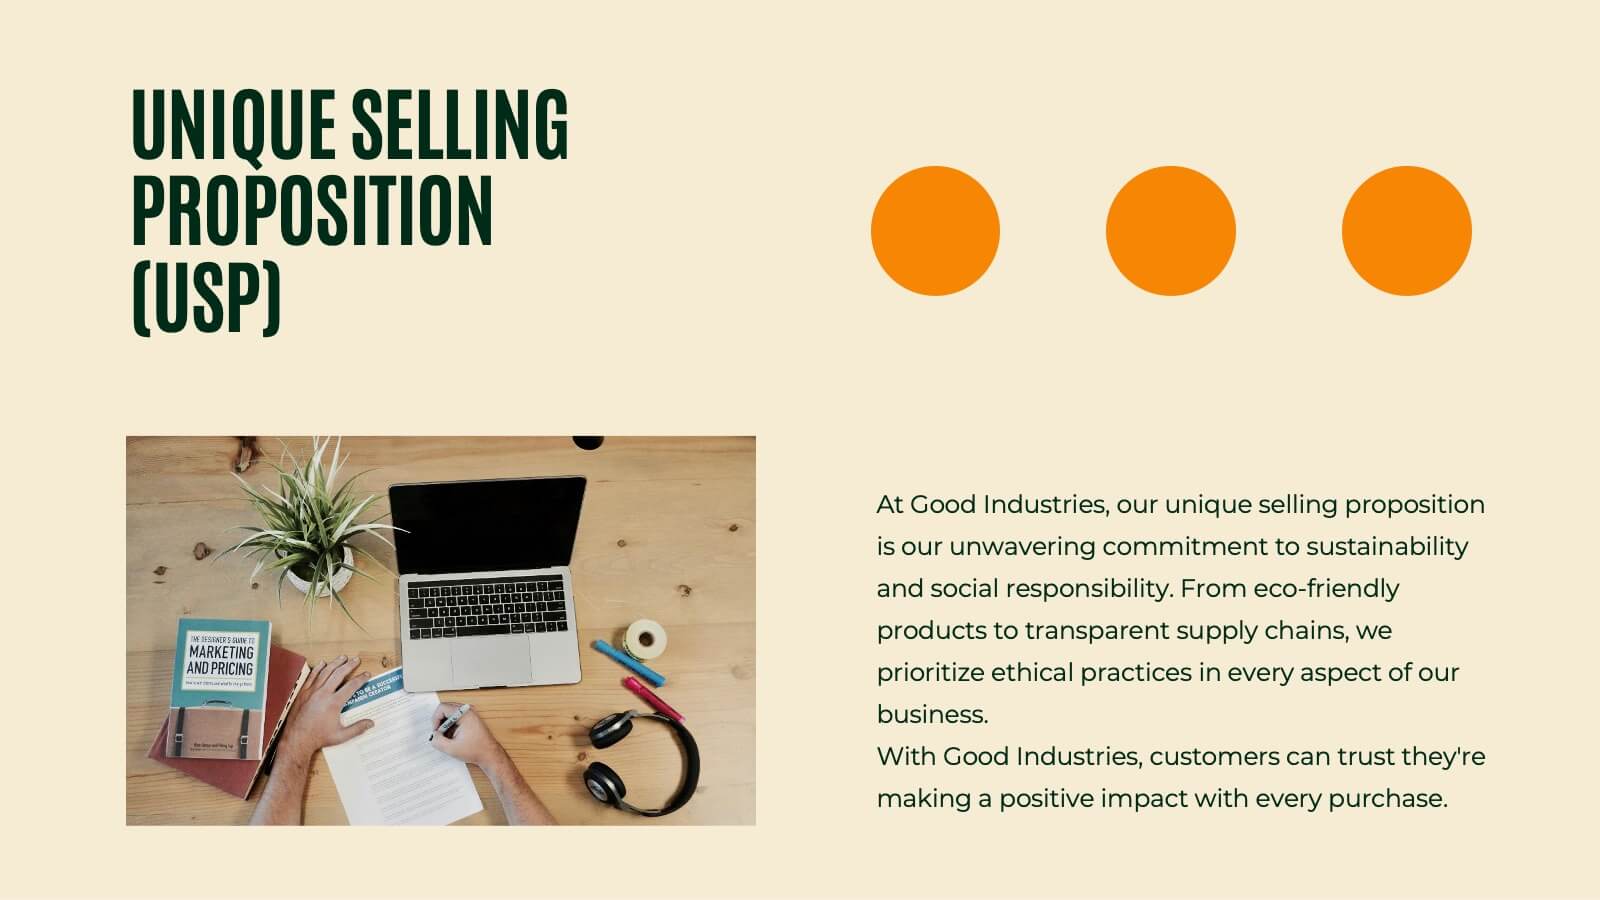
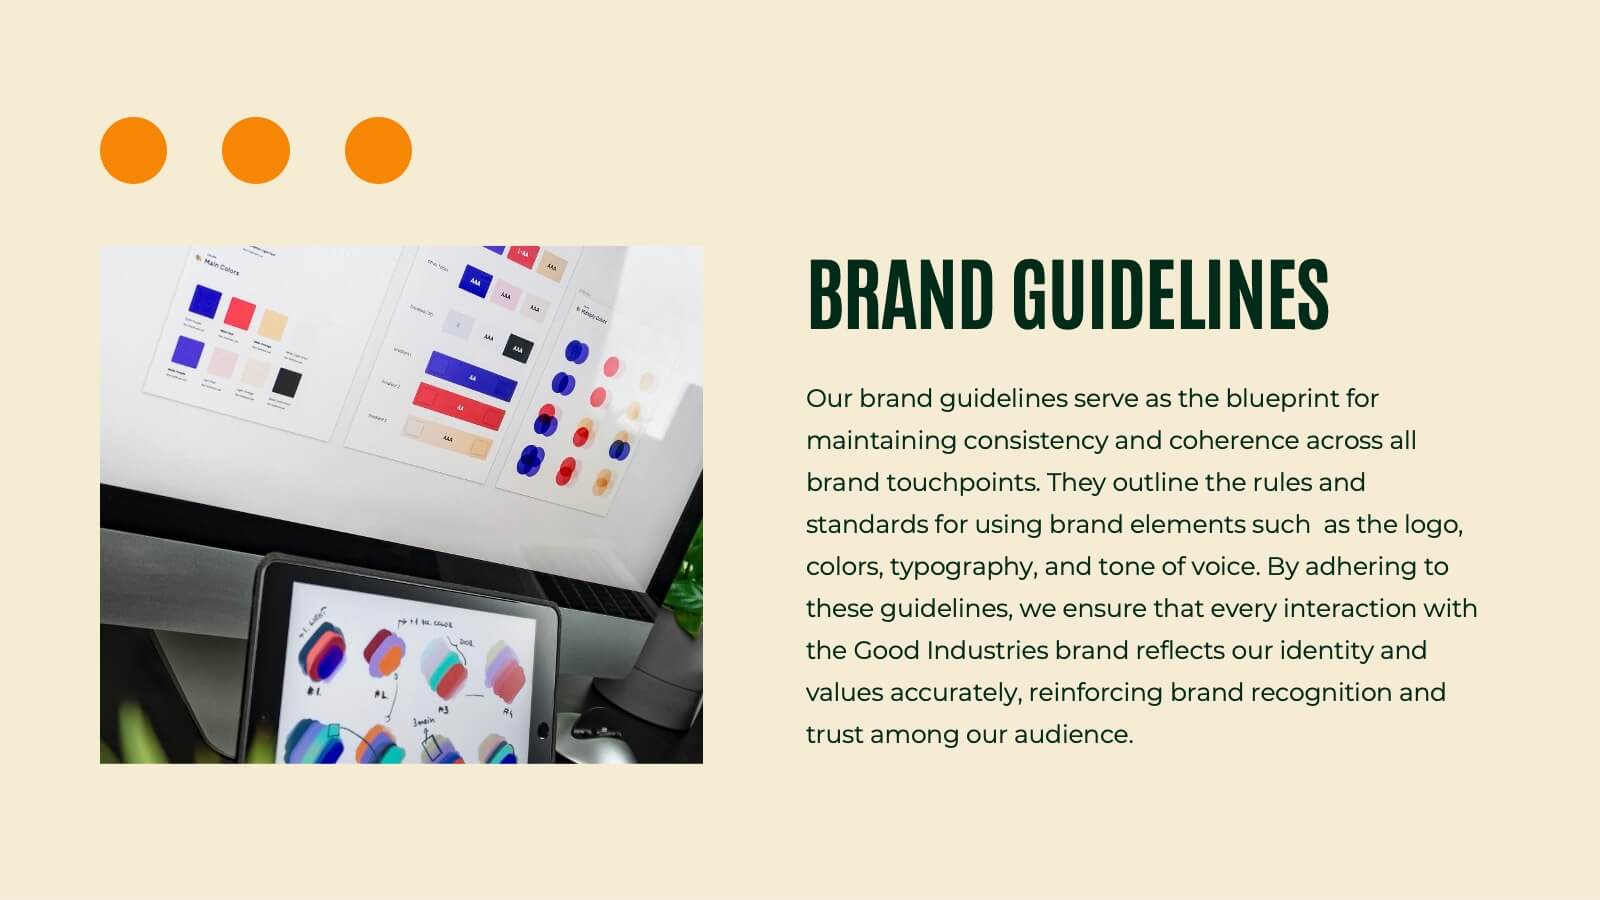
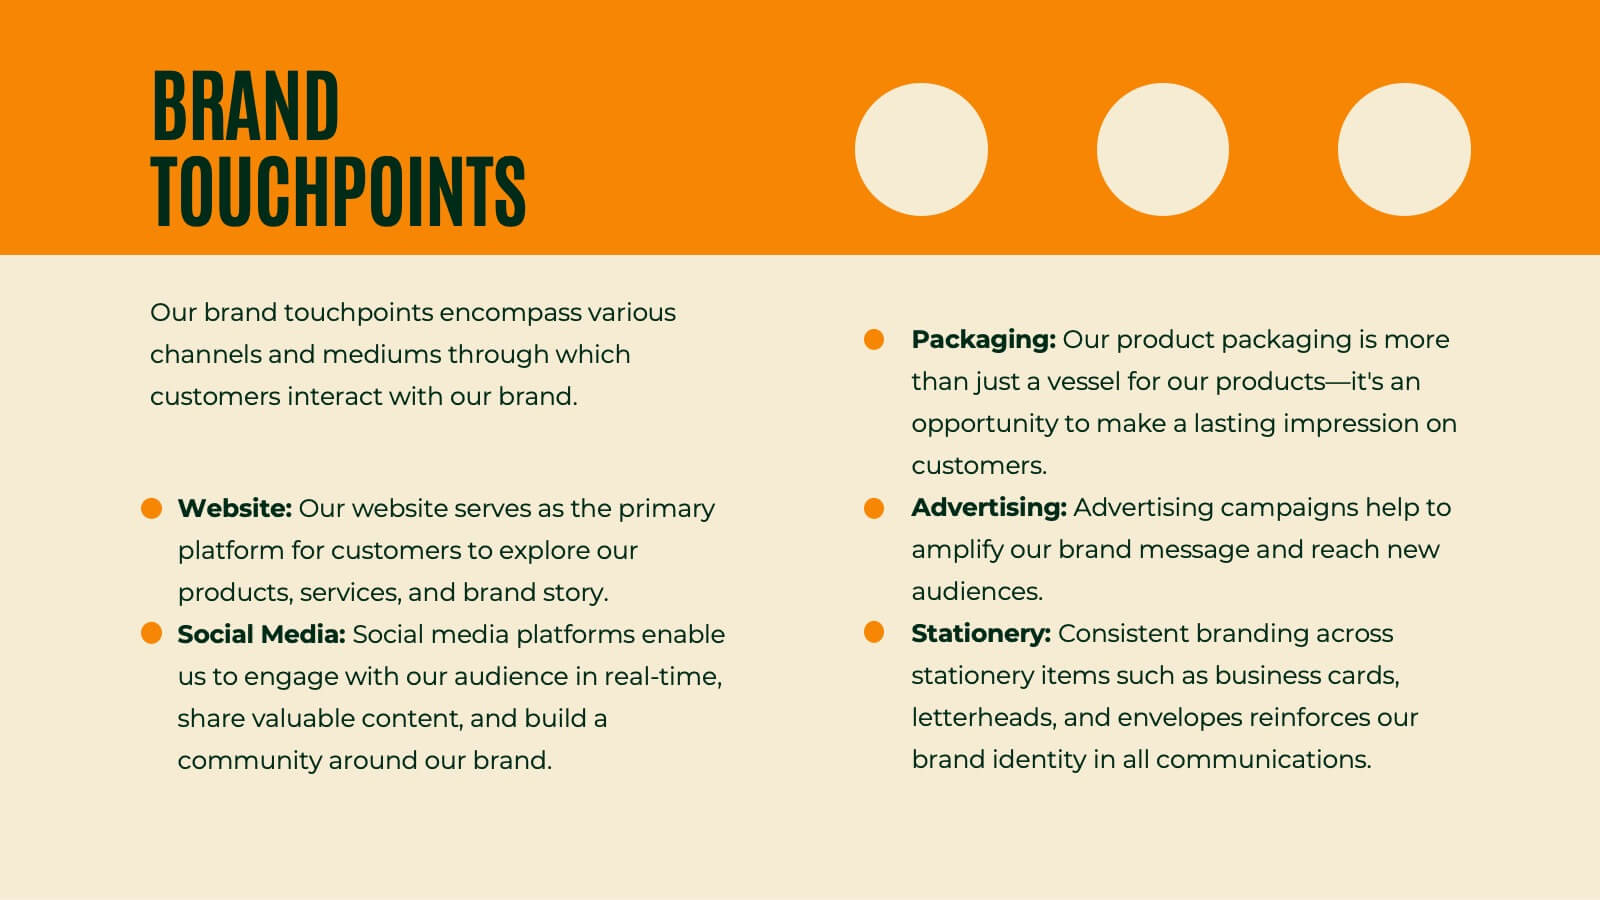
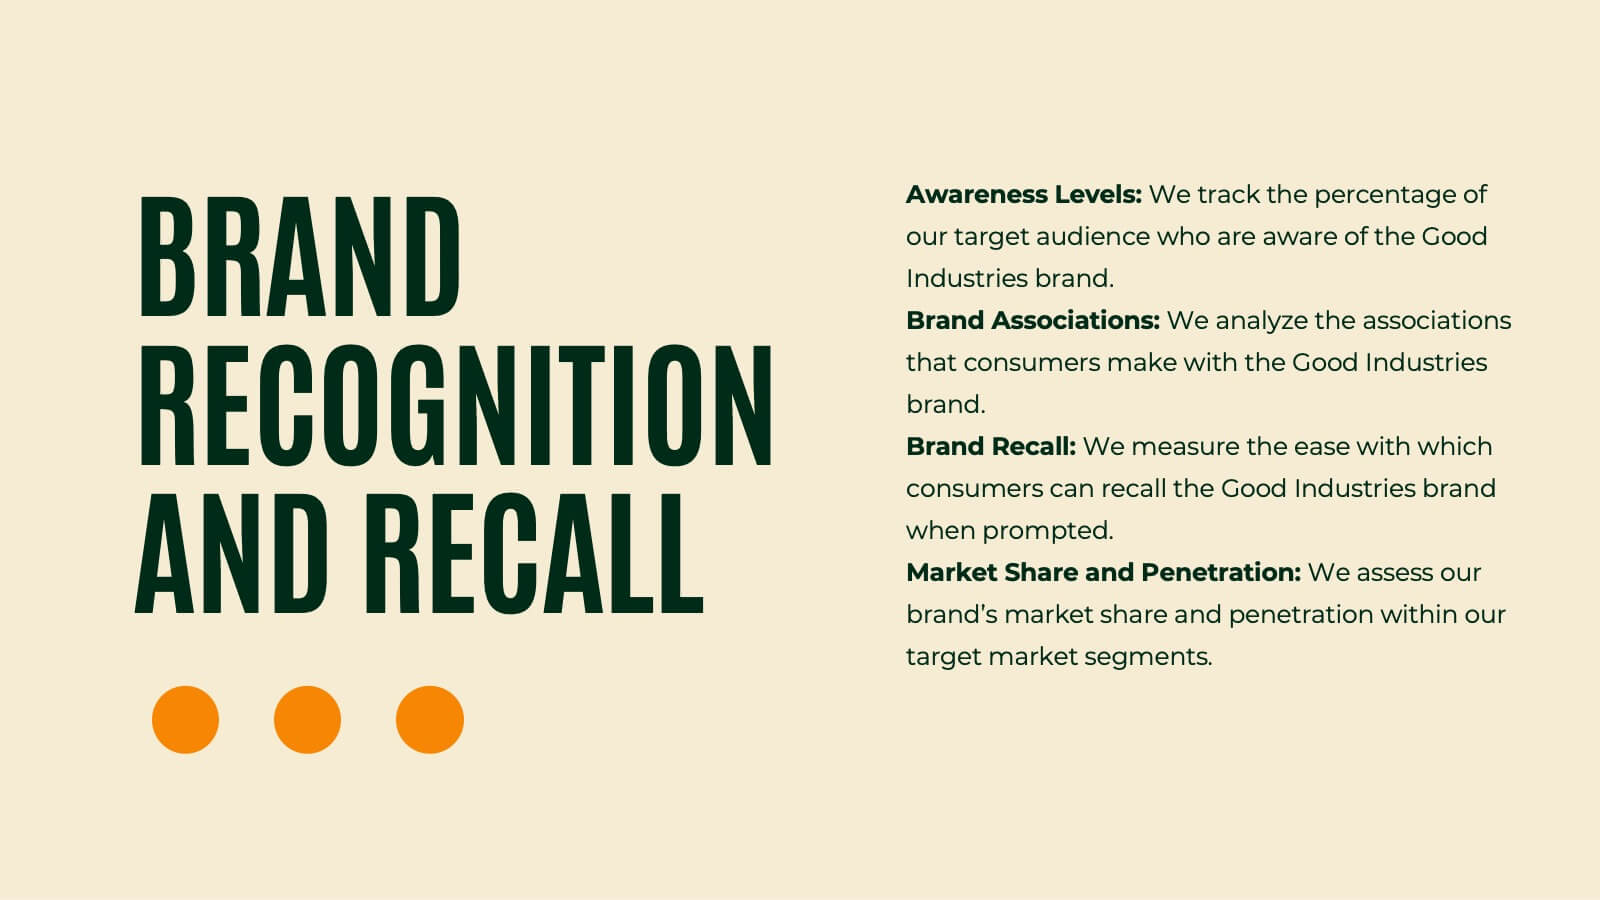
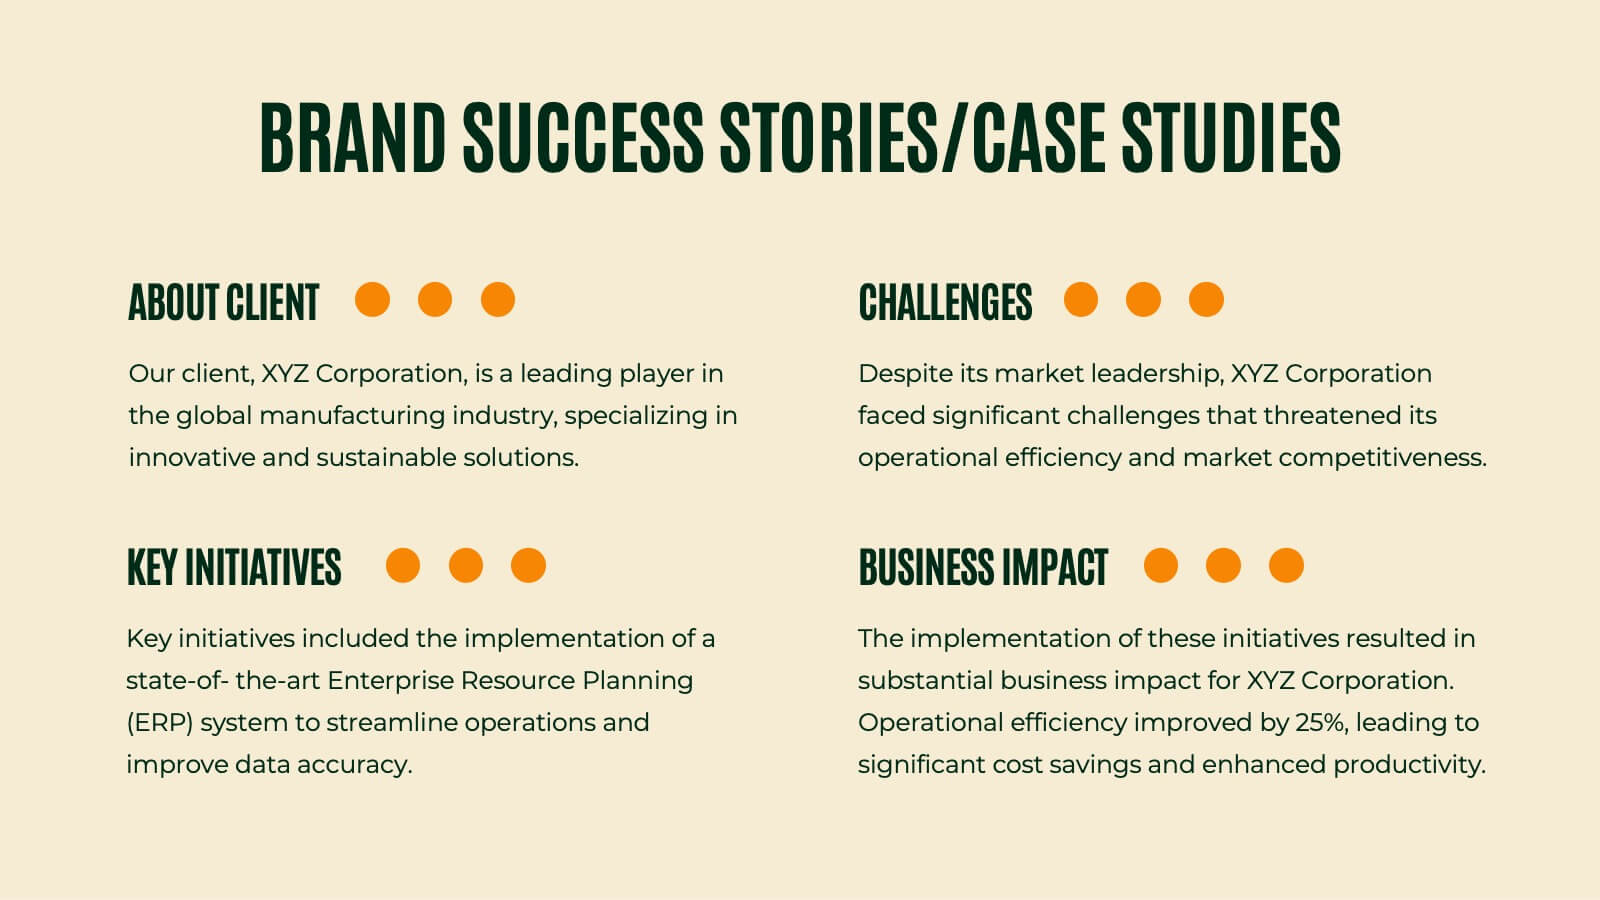
Forge Brand Strategy Report Presentation
The Brand Strategy Presentation Template is a sleek solution for showcasing brand identity. Highlight mission, values, audience personas, and future growth plans across 26 structured slides. Fully customizable for PowerPoint, Keynote, and Google Slides, it’s ideal for presenting brand insights to clients or stakeholders with professionalism and clarity.


6 diapositivas
Team Work Environment Infographic
A team work environment refers to the conditions and culture within a group of individuals who come together to work collaboratively on a common goal or project. This infographic template highlights the importance of teamwork and fosters a positive team-oriented workplace culture. The design emphasizes the key elements and benefits of a collaborative work environment, encouraging employees to work together effectively and efficiently. This infographic features illustrations that depict employees working together, collaborating, and supporting one another. This reinforces the idea of teamwork and unity within the organization.


6 diapositivas
Data Science and AI Big Data Presentation
Transform complex data concepts into engaging visuals with the Data Science and AI Big Data Presentation. This fully editable template highlights key areas such as machine learning, predictive analytics, automation, and data-driven decision-making. Perfect for data analysts, AI specialists, and business leaders, it’s available for PowerPoint, Keynote, and Google Slides, ensuring a modern and structured presentation.


34 diapositivas
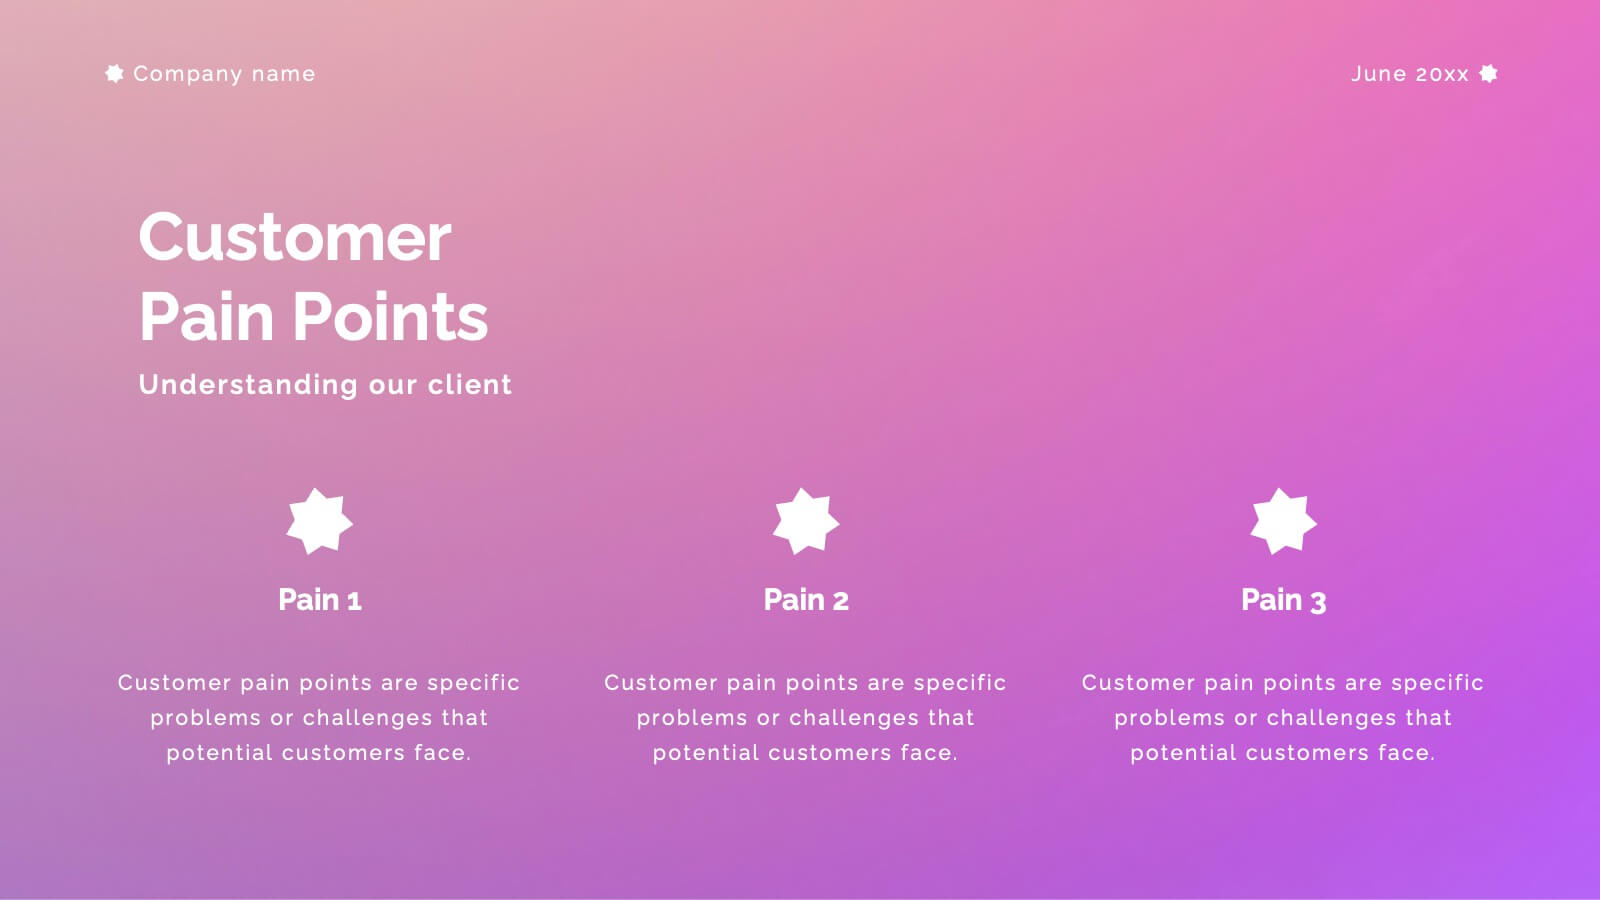
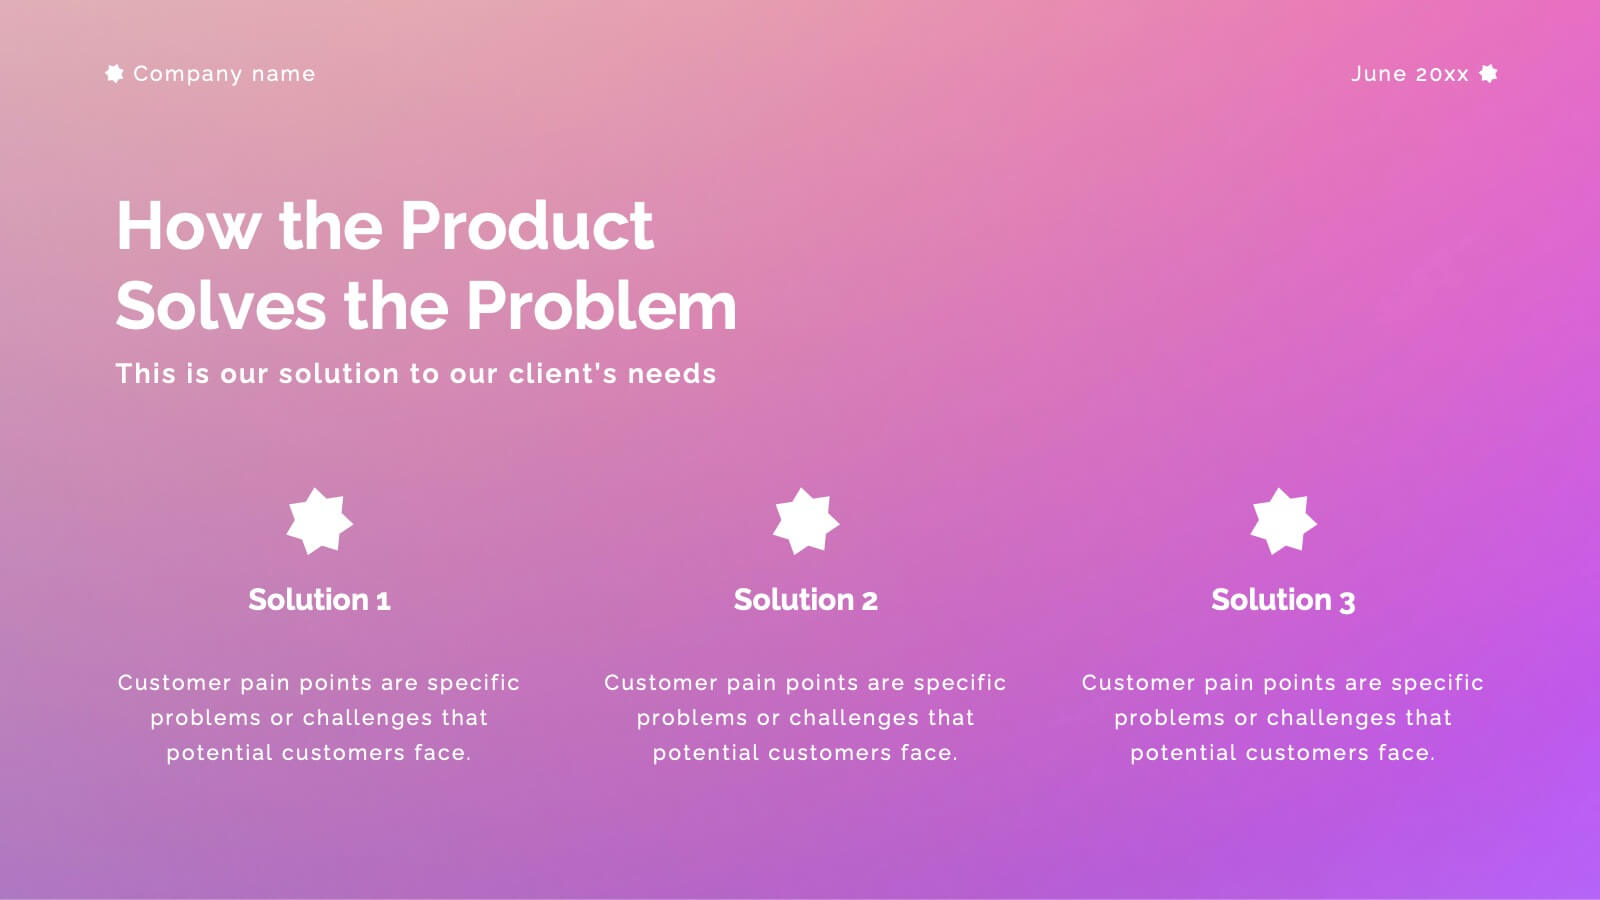
Pitch Deck Startup
Introducing our Pitch Deck Startup! Whether you are pitching to investors, partners, or customers, this template will help you create a persuasive presentation that showcases your company, growth plans, and financial projections. Customize the template to suit your needs and deliver a successful pitch that highlights the unique value of your startup and attracts potential investors or customers. This template includes sections for introducing your startup, explaining your business idea and market opportunity, showcasing your products or services, highlighting your financial projections, and outlining your growth plans.