


Características


¿Tienes alguna pregunta?
Recomendar


7 diapositivas
Empathy Map Infographic Presentation Template
An Empathy Map is a collaborative tool organizations can use to gain a deeper insight into their customers. Similar to a user persona, an empathy map can represent a group of users, such as a customer segment. An empathy map helps to map what a design team knows about the potential audience. Use this template to gain a deeper understanding of your target audience. This template comes with many empathy maps you can use to discover how to empathize with your customers. The empathy maps available in this template are designed to give you an avenue into the mind of your target audience.


6 diapositivas
Basic Numbers Infographic
This Basic Numbers Infographic is a visual representation of numerical data or information using simple graphical elements. This infographic template is a straightforward way to convey statistics, facts, or comparisons to your audience in a clear and engaging manner. The infographic includes a clean and uncluttered design while effectively presenting the numerical information. The visual elements enhance understanding and make the infographic visually appealing to your audience. The icons, symbols, and simple illustrations enhance the appeal of the infographic. Compatible with Powerpoint, Keynote, and Google Slides.


26 diapositivas
Navigating the Creative Industry Presentation
Unlock the secrets to success in the creative industry with this dynamic and visually engaging presentation. Covering essential topics like career pathways, industry trends, collaboration strategies, and personal branding, this template helps you present insights with clarity and impact. Fully customizable and compatible with PowerPoint, Keynote, and Google Slides for a seamless experience.


21 diapositivas
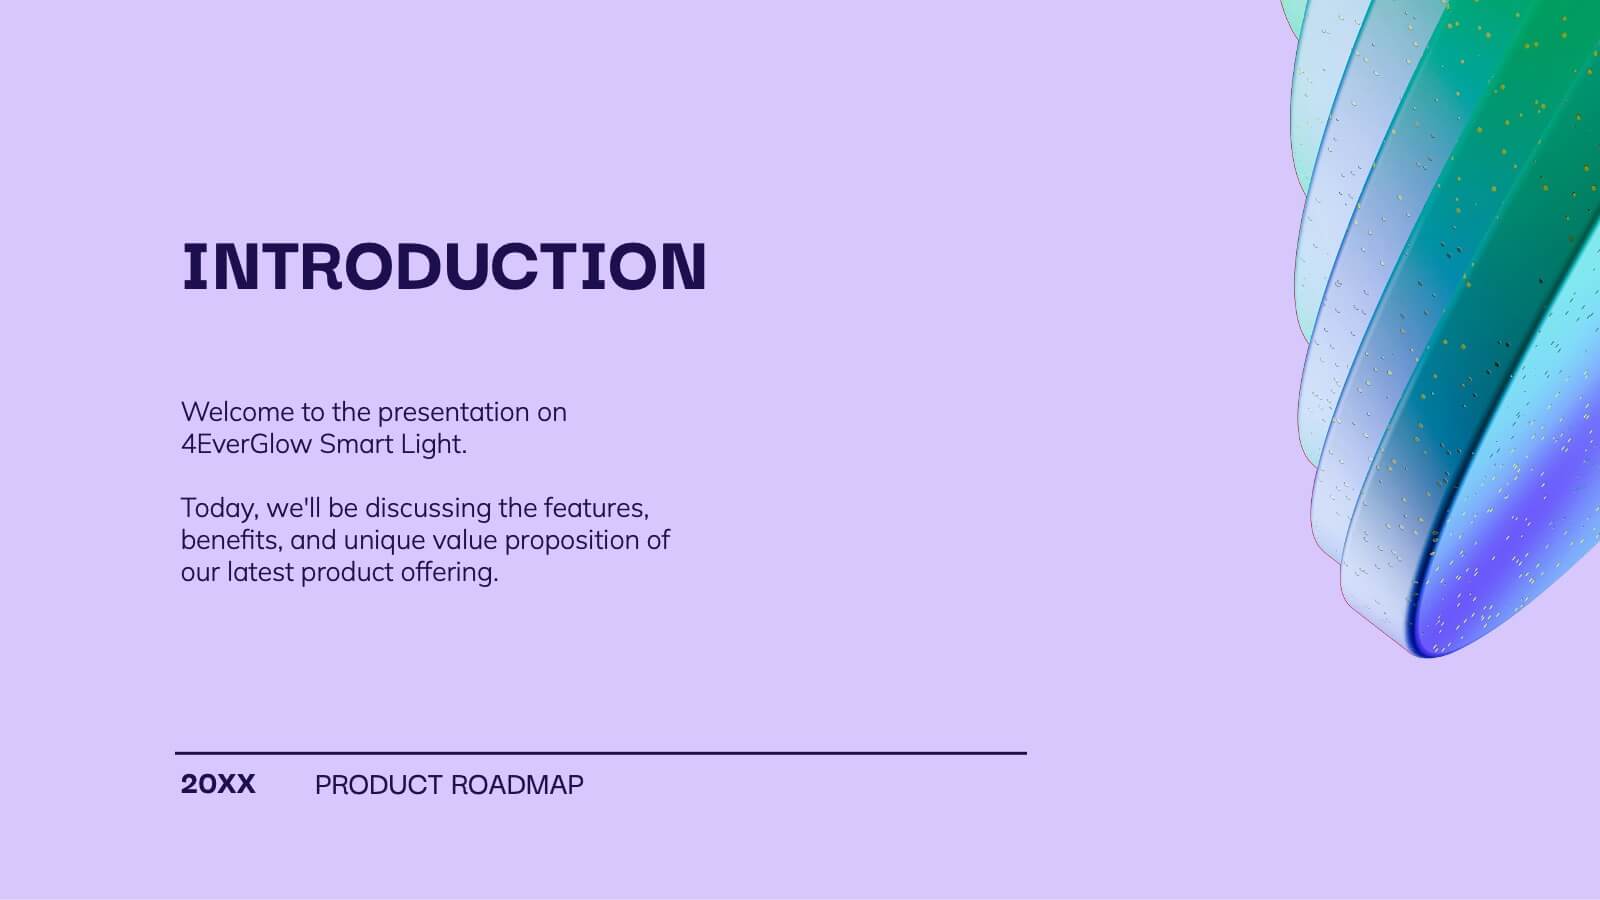
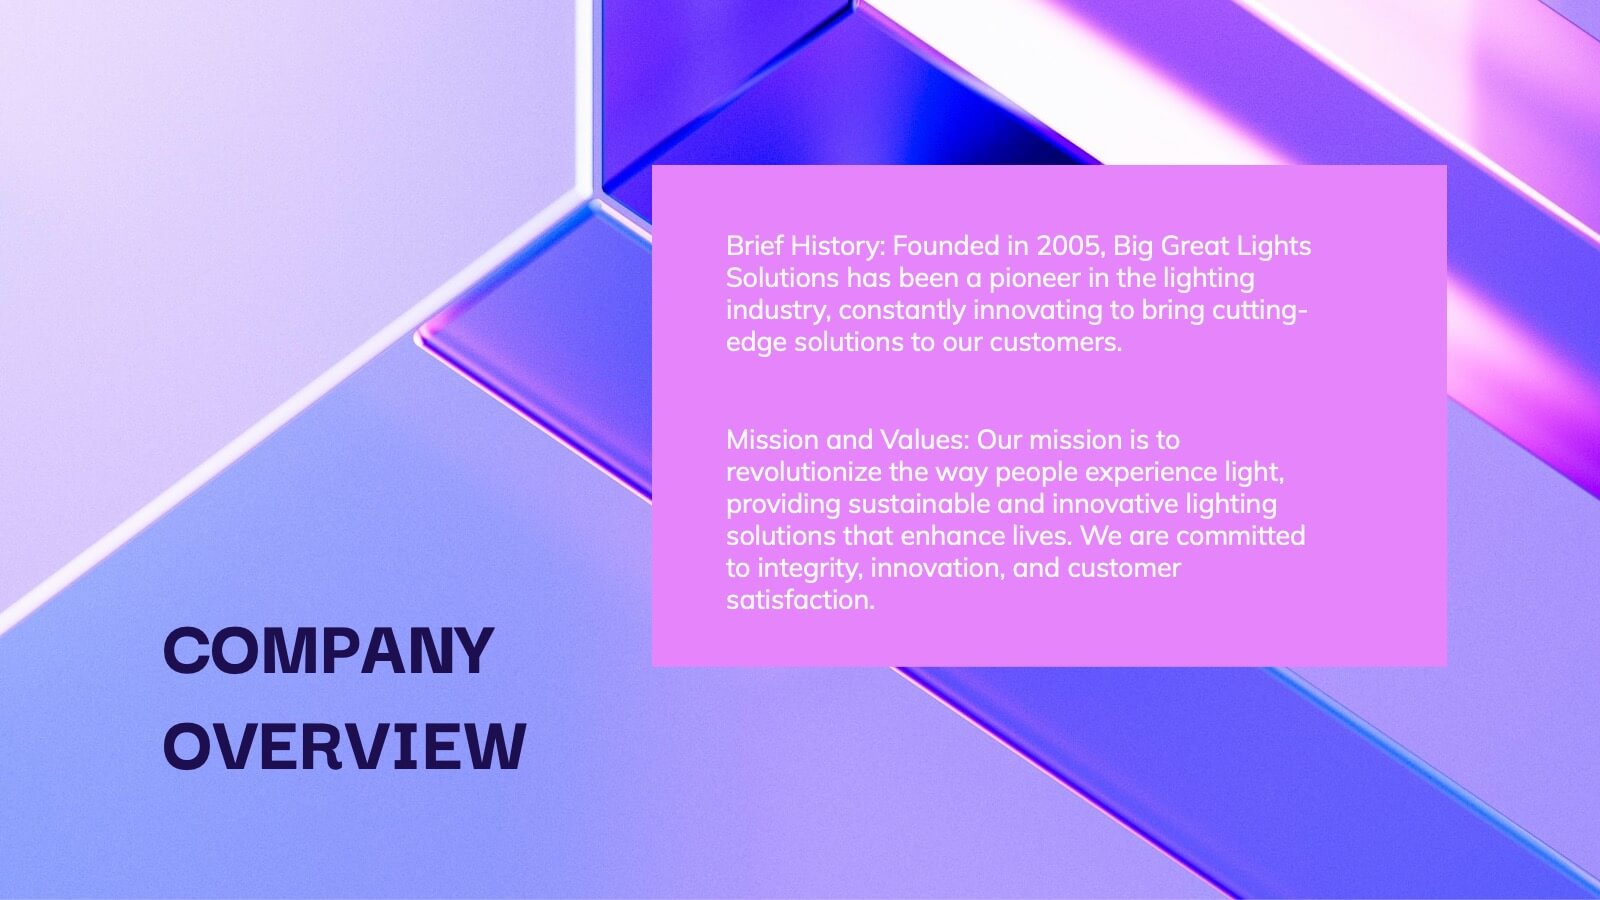
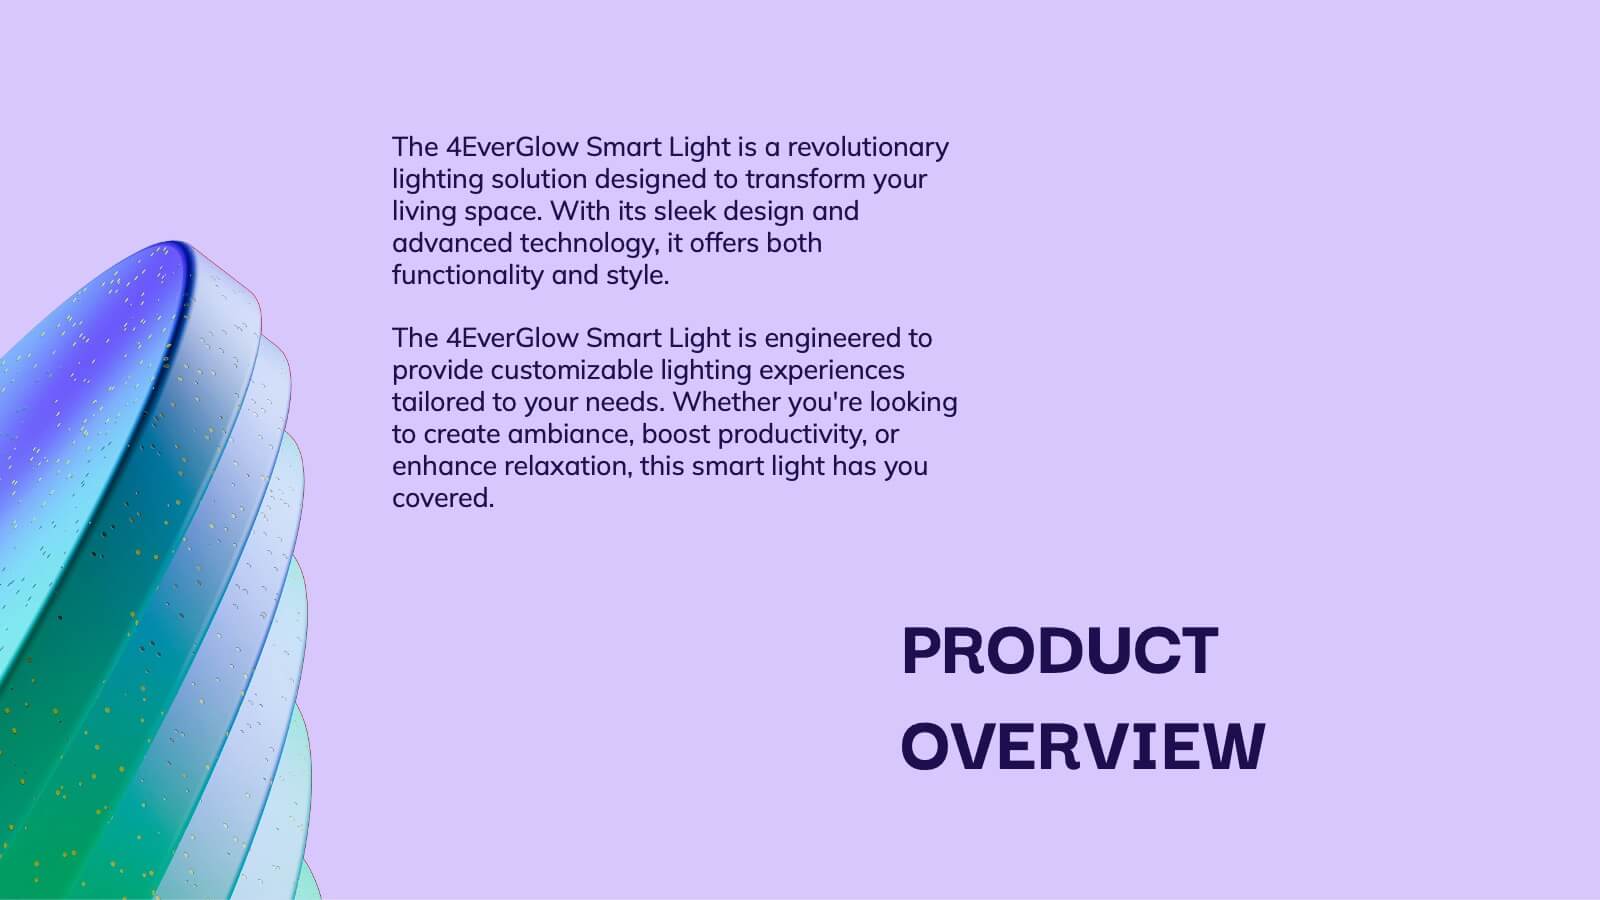
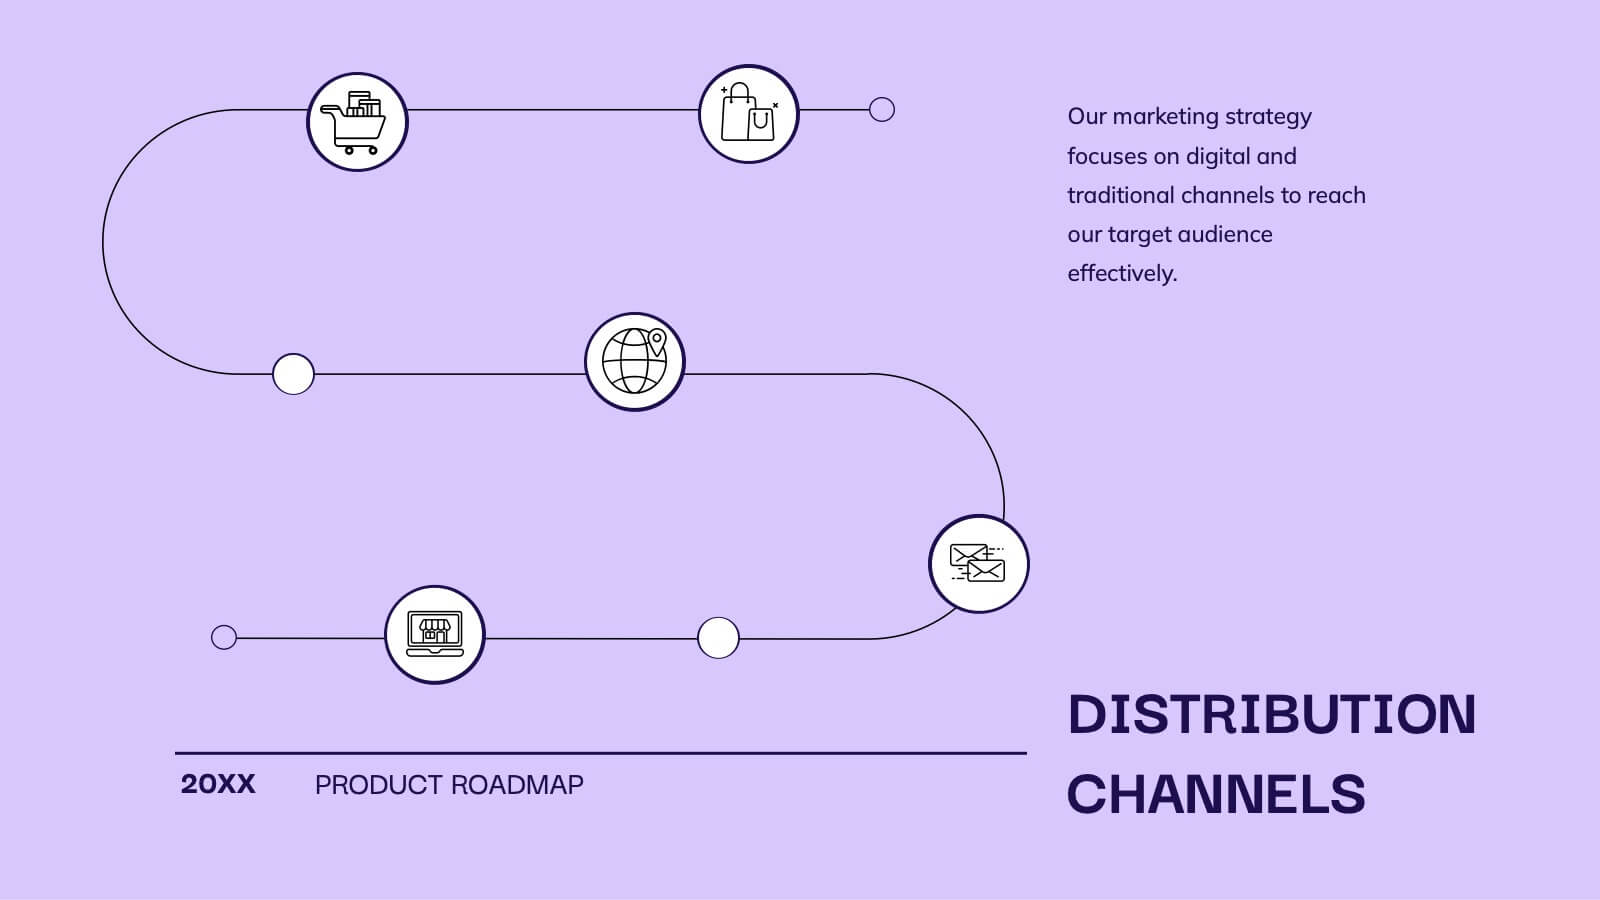
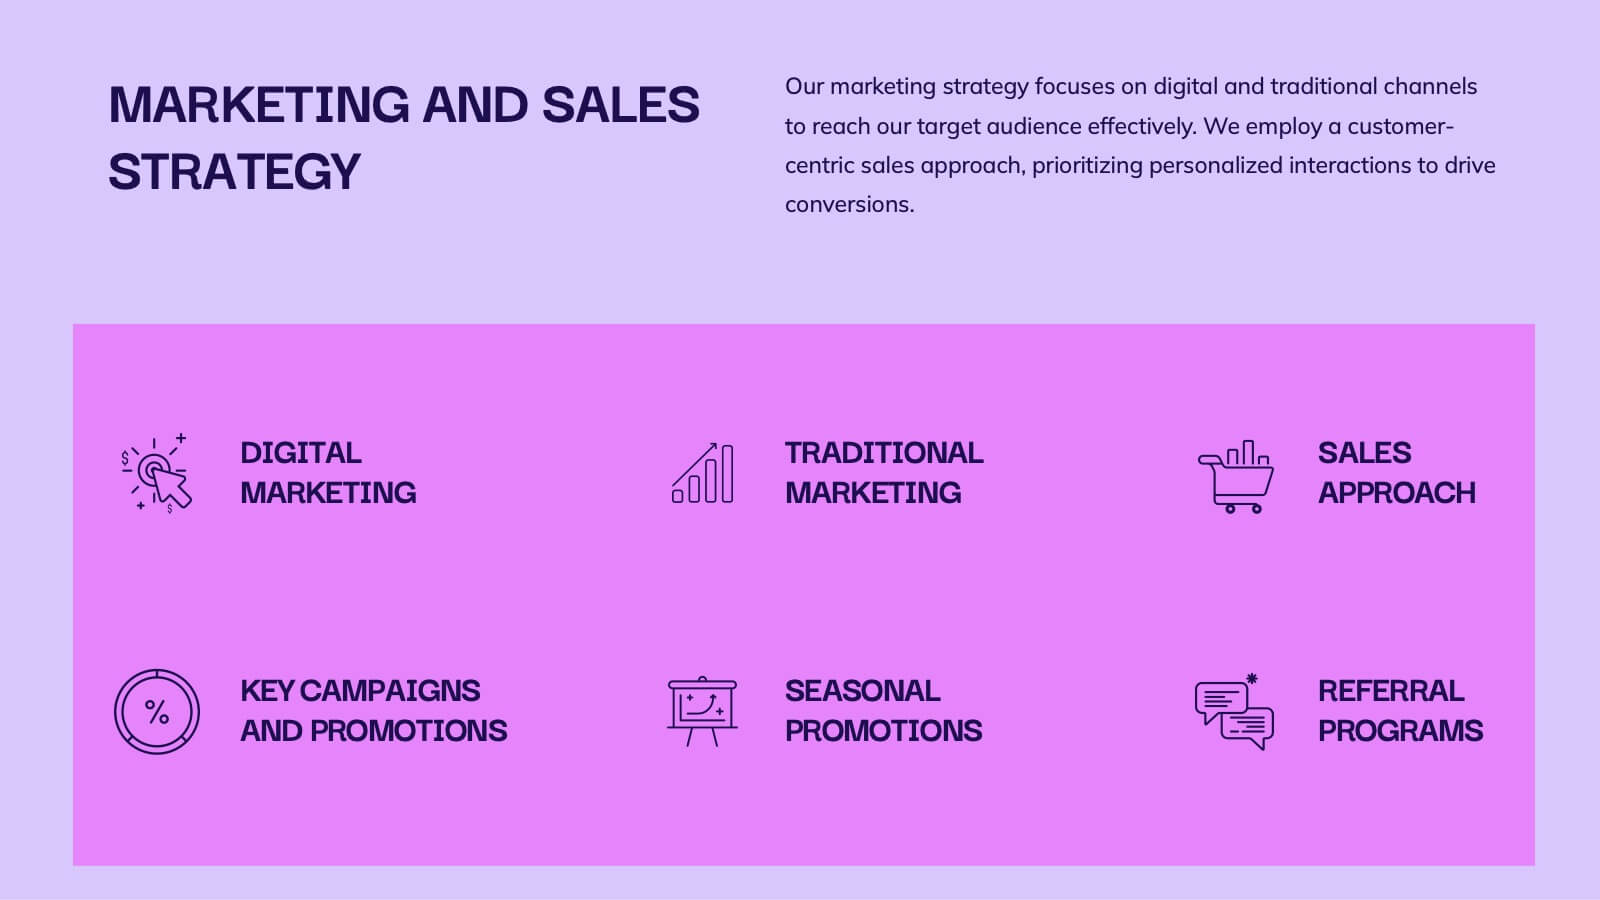
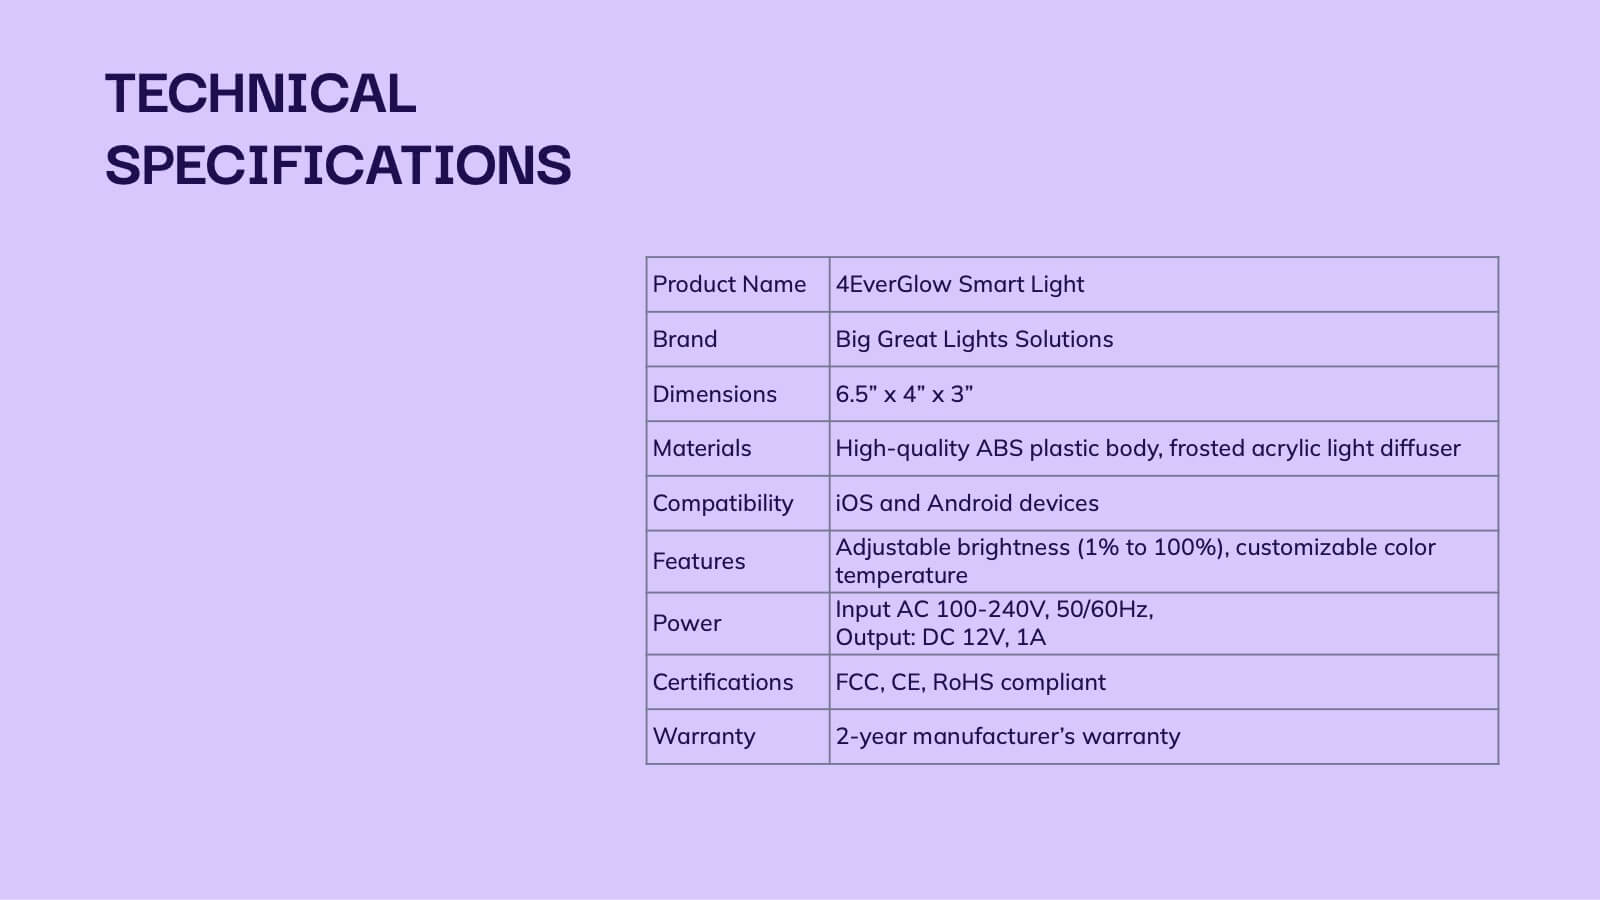
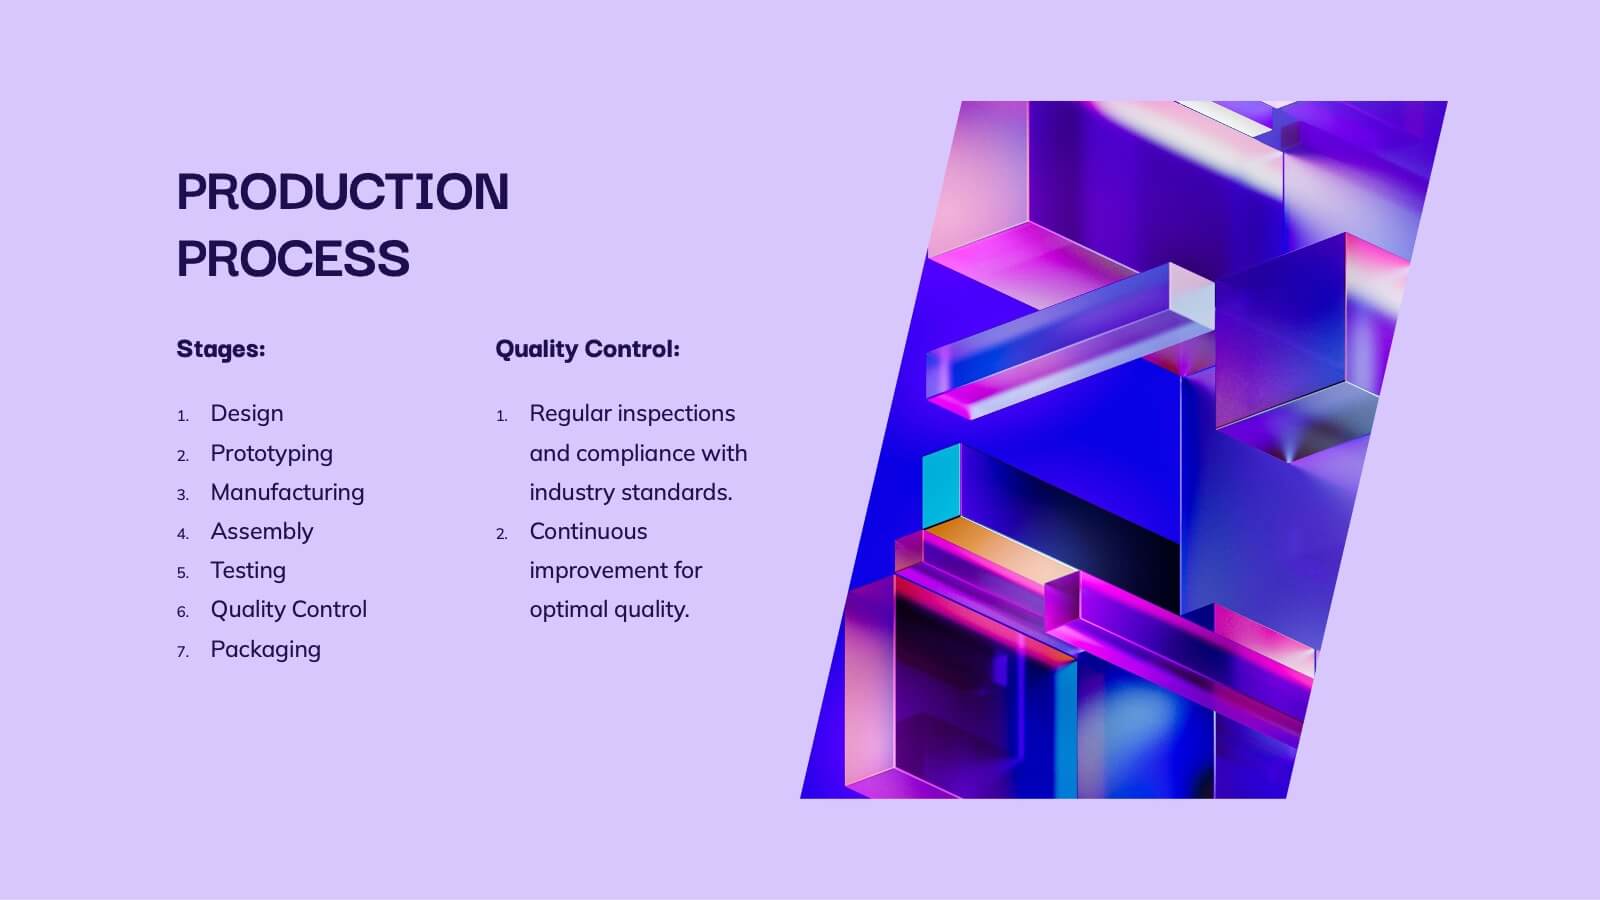
Glimmer Product Roadmap Presentation
Illuminate your product's future with this vibrant glimmer-themed presentation template! Perfect for outlining your product roadmap, it allows you to present key milestones, features, and timelines in a visually engaging way. Captivate your audience and keep them informed about your exciting journey ahead. Compatible with PowerPoint, Keynote, and Google Slides.


6 diapositivas
Process Flow Charts Presentation
Bring your workflow to life with a clean, modern layout that transforms complex steps into a simple visual path. This presentation helps teams explain processes, percentages, and progress with clarity and ease, making it ideal for planning and optimization. Fully compatible with PowerPoint, Keynote, and Google Slides.


6 diapositivas
Cloud Computing Infrastructure Overview Presentation
Break down complex systems with ease using the Cloud Computing Infrastructure Overview slide. This layout features a central cloud icon with multiple surrounding components, perfect for mapping out services, connections, or infrastructure layers. Fully editable in PowerPoint, Keynote, and Google Slides.


7 diapositivas
Business Process in Step-by-Step Presentation
Streamline operations with the Business Process in Step-by-Step presentation. This structured template breaks down complex workflows into clear, actionable steps, enhancing clarity and decision-making. Perfect for project planning, strategy execution, and workflow optimization. Fully customizable in PowerPoint, Keynote, and Google Slides for seamless presentation delivery.


5 diapositivas
Agile Workflow and Role Breakdown Presentation
Visualize Agile processes with this streamlined workflow and role breakdown diagram. Perfect for Scrum teams and project leads, this layout maps out five stages using arrows, icons, and a circular feedback loop. Easily editable in PowerPoint, Keynote, and Google Slides to fit any development cycle or team structure.


7 diapositivas
Sustainable Agriculture Infographic Presentation
An Agriculture Infographic presents information and data related to agriculture and the farming industry. This template is designed to cover a wide range of topics, including crop production, livestock farming, food processing, distribution, and sustainable agriculture practices. Use this infographic to provide information on the economic, social, and environmental impacts of agriculture, as well as to showcase new technologies and innovations in the farming industry. This infographic includes 7 slide layouts each with unique illustrations related to agriculture, charts, and diagrams.


8 diapositivas
Customer Feedback and Review
Highlight real user opinions with this Customer Feedback and Review presentation. Designed to showcase testimonials, star ratings, and satisfaction percentages, each slide offers a clean, card-style layout perfect for product reviews, client testimonials, or user surveys. Fully customizable in PowerPoint, Keynote, and Google Slides.


6 diapositivas
Real Estate Investment Portfolio Presentation
Bring your presentation to life with a clean, engaging layout that makes complex property portfolios easy to understand. This slide helps you break down key investments, showcase performance, and highlight essential insights with clarity and flow. Perfect for real estate reports or pitch decks, and fully compatible with PowerPoint, Keynote, and Google Slides.


8 diapositivas
Business Growth with TAM SAM SOM Framework Presentation
Illustrate Your Market Expansion Strategy with this Business Growth with TAM SAM SOM Framework presentation template. Clearly differentiate Total Addressable Market (TAM), Serviceable Available Market (SAM), and Serviceable Obtainable Market (SOM) to help businesses, entrepreneurs, and investors make informed growth decisions and target market opportunities. This visually engaging and fully customizable template is compatible with PowerPoint, Keynote, and Google Slides, making it ideal for business planning, market research, and investor presentations.


21 diapositivas
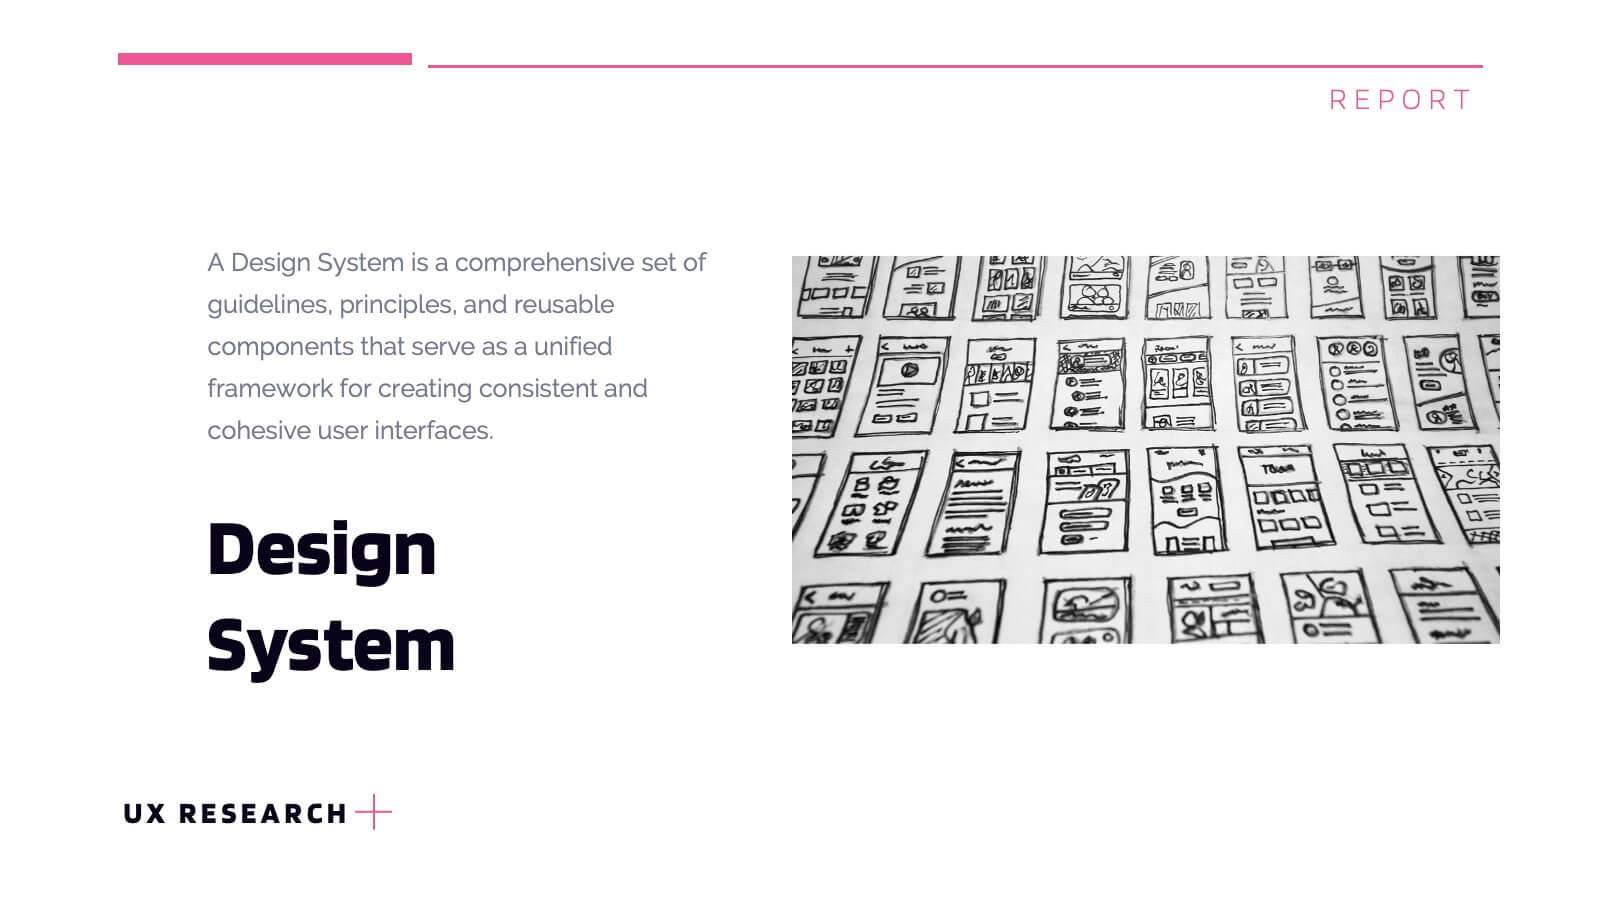
Lumascend UX Research Report Presentation
Present your UX research findings with clarity using this engaging and organized template! Covering key areas like user personas, wireframes, testing, and interaction design, it ensures all aspects of your design process are communicated effectively. Perfect for UX teams, stakeholders, or client presentations, this template works seamlessly with PowerPoint, Keynote, and Google Slides.


24 diapositivas
Petricor UX Strategy Plan Presentation
This UX Strategy Presentation offers a structured approach to user experience design, covering key aspects such as user research, wireframing, prototyping, and usability guidelines. With sections on branding, responsive design, and accessibility, this template is ideal for UX professionals. Fully editable and compatible with PowerPoint, Keynote, and Google Slides.


7 diapositivas
Union Venn Diagram Infographic
Venn Diagrams are a great way to display your data in an organized, aesthetically pleasing way. This infographic template is perfect for any presentation that requires a Venn Diagram. This template is designed to visually demonstrate the impact of your company's efforts. Use this to show how different teams work to achieve goals, or how different departments work together to create something new. Compatible with Powerpoint, Keynote, and Google Slides. This infographic uses a cool, bold color scheme and fun imagery to show the relationship between two or more sets of data in a way that will help you easily explain it to your target audience.


5 diapositivas
Nonprofit Organizations Infographics
Nonprofit Organizations are organizations that are established to pursue a particular social cause or provide a service that benefits the public, rather than generate a profit. These infographic templates are designed to visually present information about nonprofit organizations. They feature bright, colorful and engaging designs with icons and illustrations that represent different aspects of nonprofit organizations, such as fundraising, volunteers, and social impact. The template includes customizable graphs and text boxes to allow users to easily present data about nonprofits, including their structure, goals, impact, and funding sources.


4 diapositivas
Vision Statement Slide Presentation
Spark inspiration from the very first slide with a clean, modern layout designed to express future goals with clarity and confidence. This presentation helps teams communicate direction, long-term aspirations, and strategic focus in a simple, structured format. Fully compatible with PowerPoint, Keynote, and Google Slides.