


Características


¿Tienes alguna pregunta?
Recomendar


4 diapositivas
Business Goals and Objectives Presentation
Build a strong foundation for success with this business goals and objectives template! Designed to help organizations define clear targets and align strategies, this visual layout simplifies goal-setting and planning. Perfect for corporate teams, startups, and strategists. Fully customizable and compatible with PowerPoint, Keynote, and Google Slides for effortless editing.


6 diapositivas
Root Cause Breakdown with Impact Lines Presentation
Visualize the path from causes to consequences with the Root Cause Breakdown with Impact Lines Presentation. Designed with a clear horizontal arrow flow and dual-level layout, this slide helps you dissect key issues and their cascading effects. Ideal for risk analysis, incident reviews, and operational strategy meetings. Fully customizable in PowerPoint, Keynote, and Google Slides.


4 diapositivas
Sales Strategy 30-60-90 Day Plan
Accelerate your sales team’s performance with this 30-60-90 Day Strategy template. Designed with clean circular progress visuals and clear milestone stages, it helps you outline sales goals, track onboarding, and align strategic efforts. Ideal for new hires, quarterly planning, or sales enablement. Fully editable in PowerPoint, Keynote, and Google Slides.


7 diapositivas
Agile Project Management Approach Presentation
Illustrate iterative planning and delivery cycles with this Agile Project Management Approach Presentation. The dynamic circular graphic paired with a horizontal flow arrow highlights six core steps in agile workflows. Ideal for scrum teams, product owners, or project leads, each phase is clearly labeled with editable titles and content placeholders. Fully customizable and compatible with PowerPoint, Keynote, and Google Slides.


6 diapositivas
Startup Investment Infographics
The "Startup Investment" infographic template is a sleek and persuasive tool, perfectly crafted for PowerPoint, Keynote, and Google Slides. This template is a crucial asset for entrepreneurs, investors, and business consultants who are keen on presenting the essentials of startup financing, investment strategies, and growth opportunities in an impactful way. This template efficiently encapsulates the startup investment landscape, highlighting key areas like funding stages, investor types, valuation methods, and return on investment. It's designed to articulate the dynamics of startup funding, making it an invaluable tool for pitch presentations, investor meetings, and financial planning discussions. The design is as dynamic as the startup ecosystem itself, with a color scheme that is both vibrant and professional. This not only makes the presentation visually compelling but also signifies the energy, innovation, and potential associated with startup investments. Whether used in a boardroom, a startup incubator, or an investment seminar, this template ensures that your insights into "Startup Investment" are communicated with clarity, confidence, and visual appeal.


6 diapositivas
Porter's Five Forces Market Analysis Presentation
Gain a competitive edge with this Porter's Five Forces market analysis template! Designed to help businesses assess industry dynamics, this structured layout highlights competitive rivalry, supplier power, buyer influence, new market entries, and substitute threats. Perfect for strategists and analysts. Fully customizable and compatible with PowerPoint, Keynote, and Google Slides.


20 diapositivas
Dreamspire Academic Research Report Presentation
Present your research findings with impact using this bold and dynamic report template! It includes essential sections such as objectives, methodology, key findings, and future research directions, ensuring a comprehensive overview. Perfect for academic, business, or industry research presentations, this template is fully compatible with PowerPoint, Keynote, and Google Slides.


7 diapositivas
State-by-State Business Data Presentation
Break down insights with this State-by-State Business Data Presentation. Featuring a U.S. map segmented by regions, this slide is ideal for illustrating localized performance, regional statistics, or market segmentation. Customize text labels and highlight specific zones to match your business needs. Fully editable in PowerPoint, Keynote, and Google Slides.


4 diapositivas
Real Estate Market Trends
Present housing data and property growth insights with this ascending building chart layout. Perfect for realtors, investors, and market analysts, this template helps visualize real estate performance over time. Fully editable in PowerPoint, Keynote, and Google Slides.


5 diapositivas
SEO Techniques Infographics
SEO (Search Engine Optimization) techniques are strategies and practices used to improve a website's visibility and ranking in search engine results pages (SERPs). These infographic templates are designed to educate and inform about various techniques and strategies used in search engine optimization. With its eye-catching design and clear visual representations, the template helps convey complex SEO concepts in a concise and engaging manner. These provide a foundation for understanding the subsequent techniques discussed in the presentation. Throughout the infographic, best practices and tips are shared to help optimize SEO efforts.


12 diapositivas
5 Step Process Diagram Presentation
Step up your presentation game with our sleek "5 Step Process Diagram Presentation" template! Ideal for depicting interconnected processes or workflows, this infographic uses a central hexagonal design to connect five key steps, ensuring clarity and ease of understanding. Whether for academic, business, or personal projects, this template’s intuitive layout and customizable color schemes make it a versatile choice for any presentation. Compatible with PowerPoint, Keynote, and Google Slides, it’s designed to enhance the way you visualize complex information.


6 diapositivas
Profit Threshold Break-Even Calculation Presentation
Illustrate financial performance with this profit threshold timeline. The layout spans from big loss to high profit, marking each stage with flag icons and editable labels. Ideal for break-even analysis, sales strategies, or ROI comparisons. Easily customizable in PowerPoint, Keynote, and Google Slides to match your brand’s visual identity.


26 diapositivas
Beginner's Guide to Investing Presentation
This presentation template is a fantastic starting point for anyone looking to dive into the world of investing. Designed with clarity and accessibility in mind, it caters specifically to beginners eager to understand the fundamentals of investment strategies and options. The template introduces users to the basics of stocks, bonds, and other investment vehicles, using easy-to-understand language and clear, informative visuals. The content is laid out in a logical sequence, beginning with basic concepts and gradually progressing to more complex investment ideas and strategies. Slides are enriched with diagrams, charts, and comparison tables that break down financial data and trends in a digestible format. Key investment terms are explained through engaging infographics that make learning both interactive and effective. To ensure a broad usability range, the template is fully compatible with popular presentation platforms such as PowerPoint, Google Slides, and Keynote. This compatibility allows users to easily adapt and present the information across different devices and settings, making it an invaluable tool for personal education or group training sessions in various learning environments.


6 diapositivas
Investment Trust Infographic
An investment trust, also known as a closed-end fund, is a type of collective investment vehicle that pools funds from multiple investors to invest in a diversified portfolio of assets. This Infographic template visually communicates key information about investment trusts, which are financial vehicles from multiple investors to invest in a diversified portfolio of assets. This template highlights different types of investment, such as trusts, fixed-income trusts, or sector-specific trusts. The icons and images are included to represent each type. This infographic is fully customizable and compatible with Powerpoint, Keynote, and Google Slides.


12 diapositivas
Corporate Governance Strategy Presentation
Optimize your company's strategic direction with our Corporate Governance Strategy template. Designed to showcase the critical components of effective governance, this template is perfect for illustrating clear governance frameworks within PowerPoint, Keynote, and Google Slides. Ideal for corporate leaders aiming to enhance transparency, accountability, and organizational alignment, this template serves as an essential tool for fostering strong corporate governance practices.


20 diapositivas
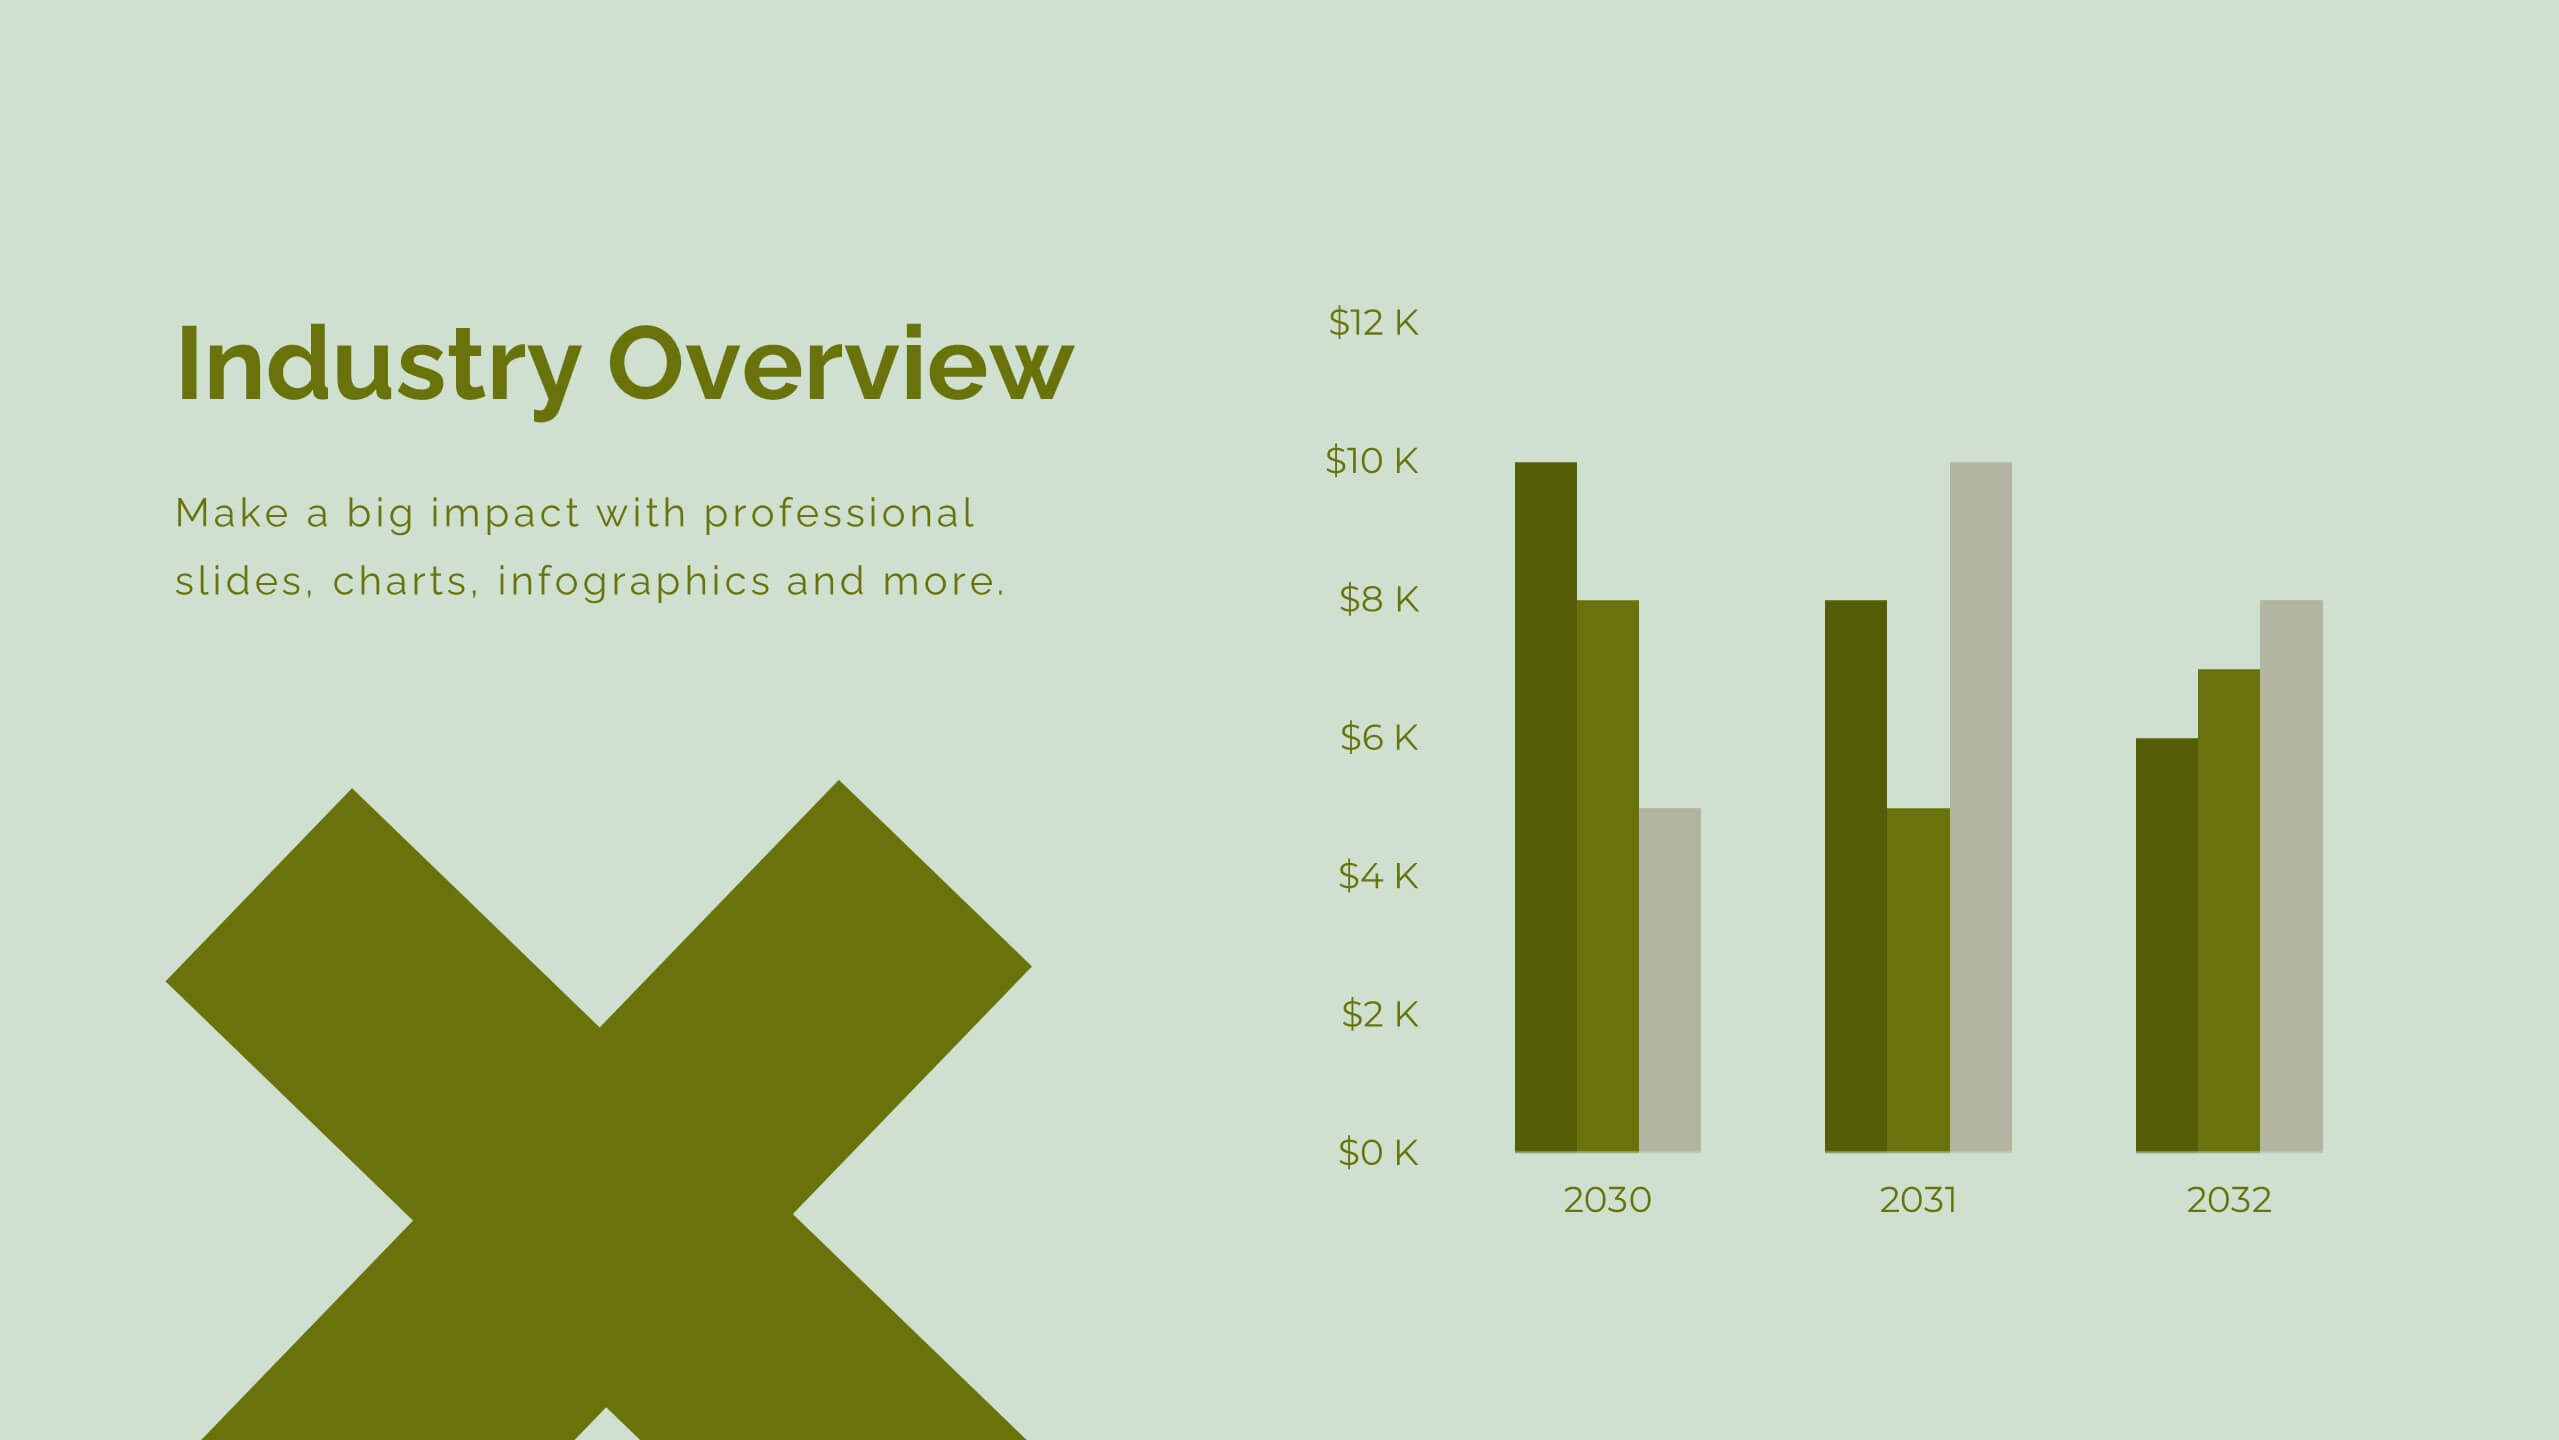
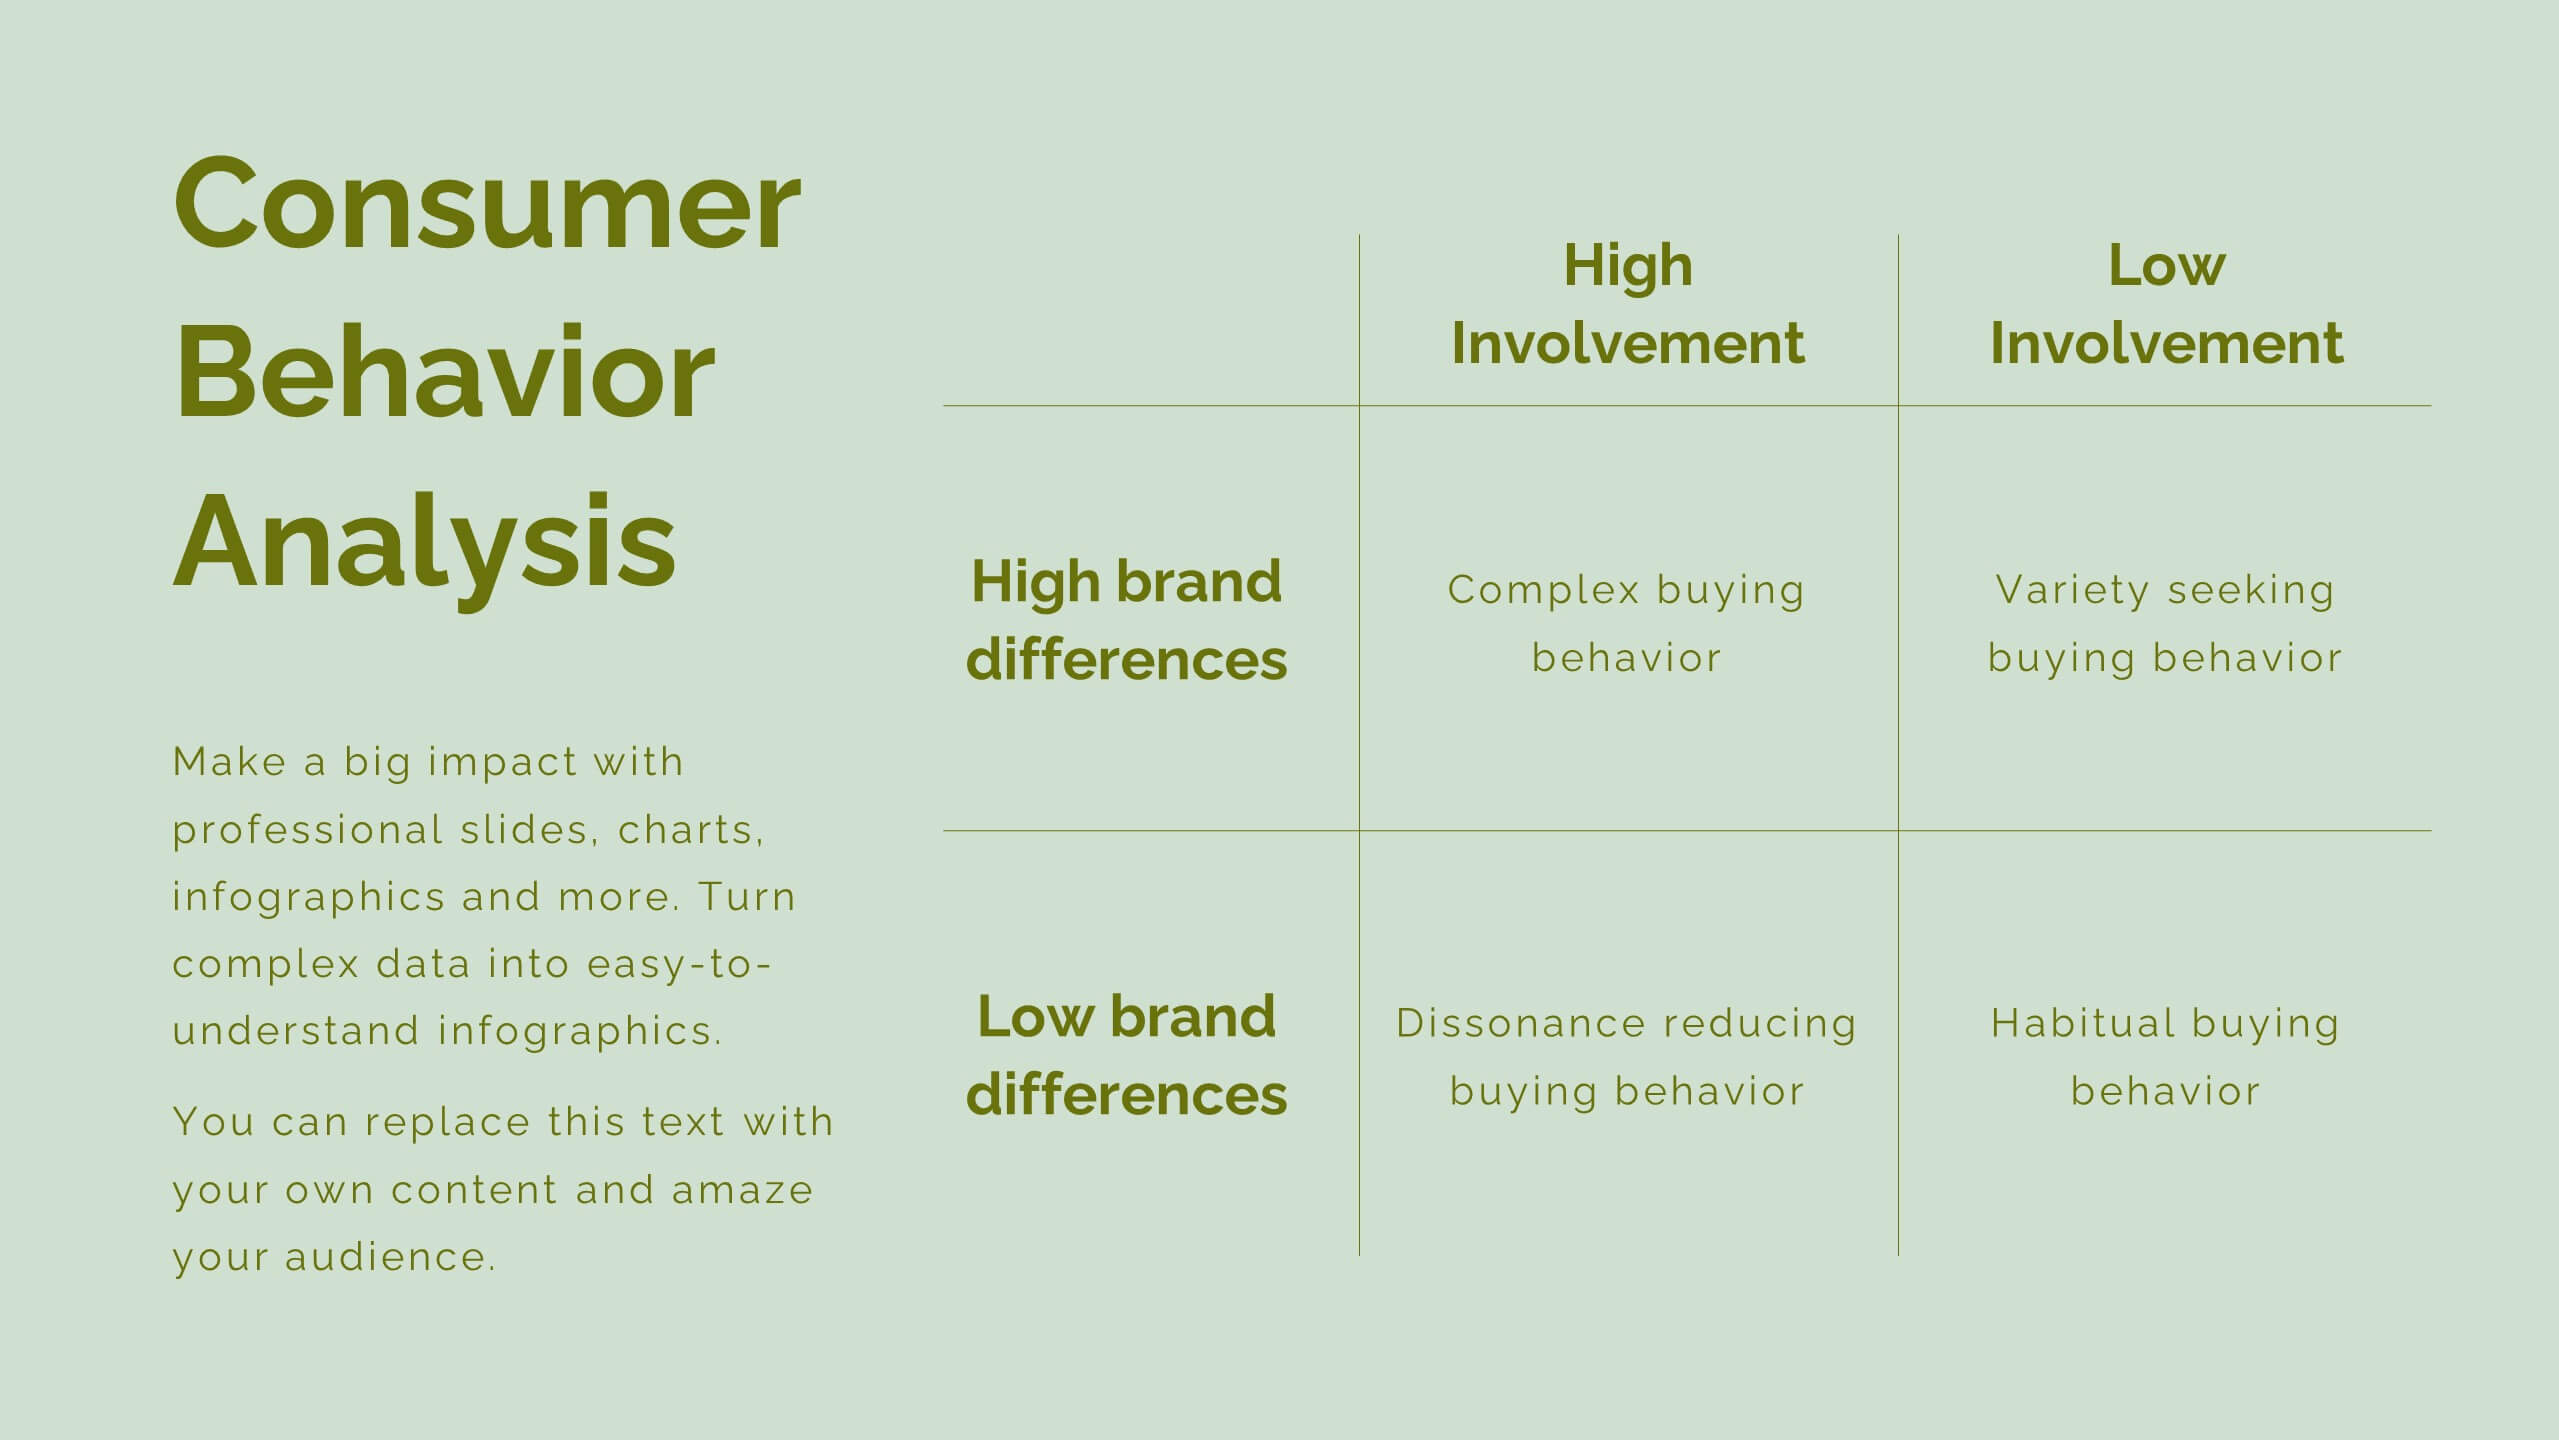
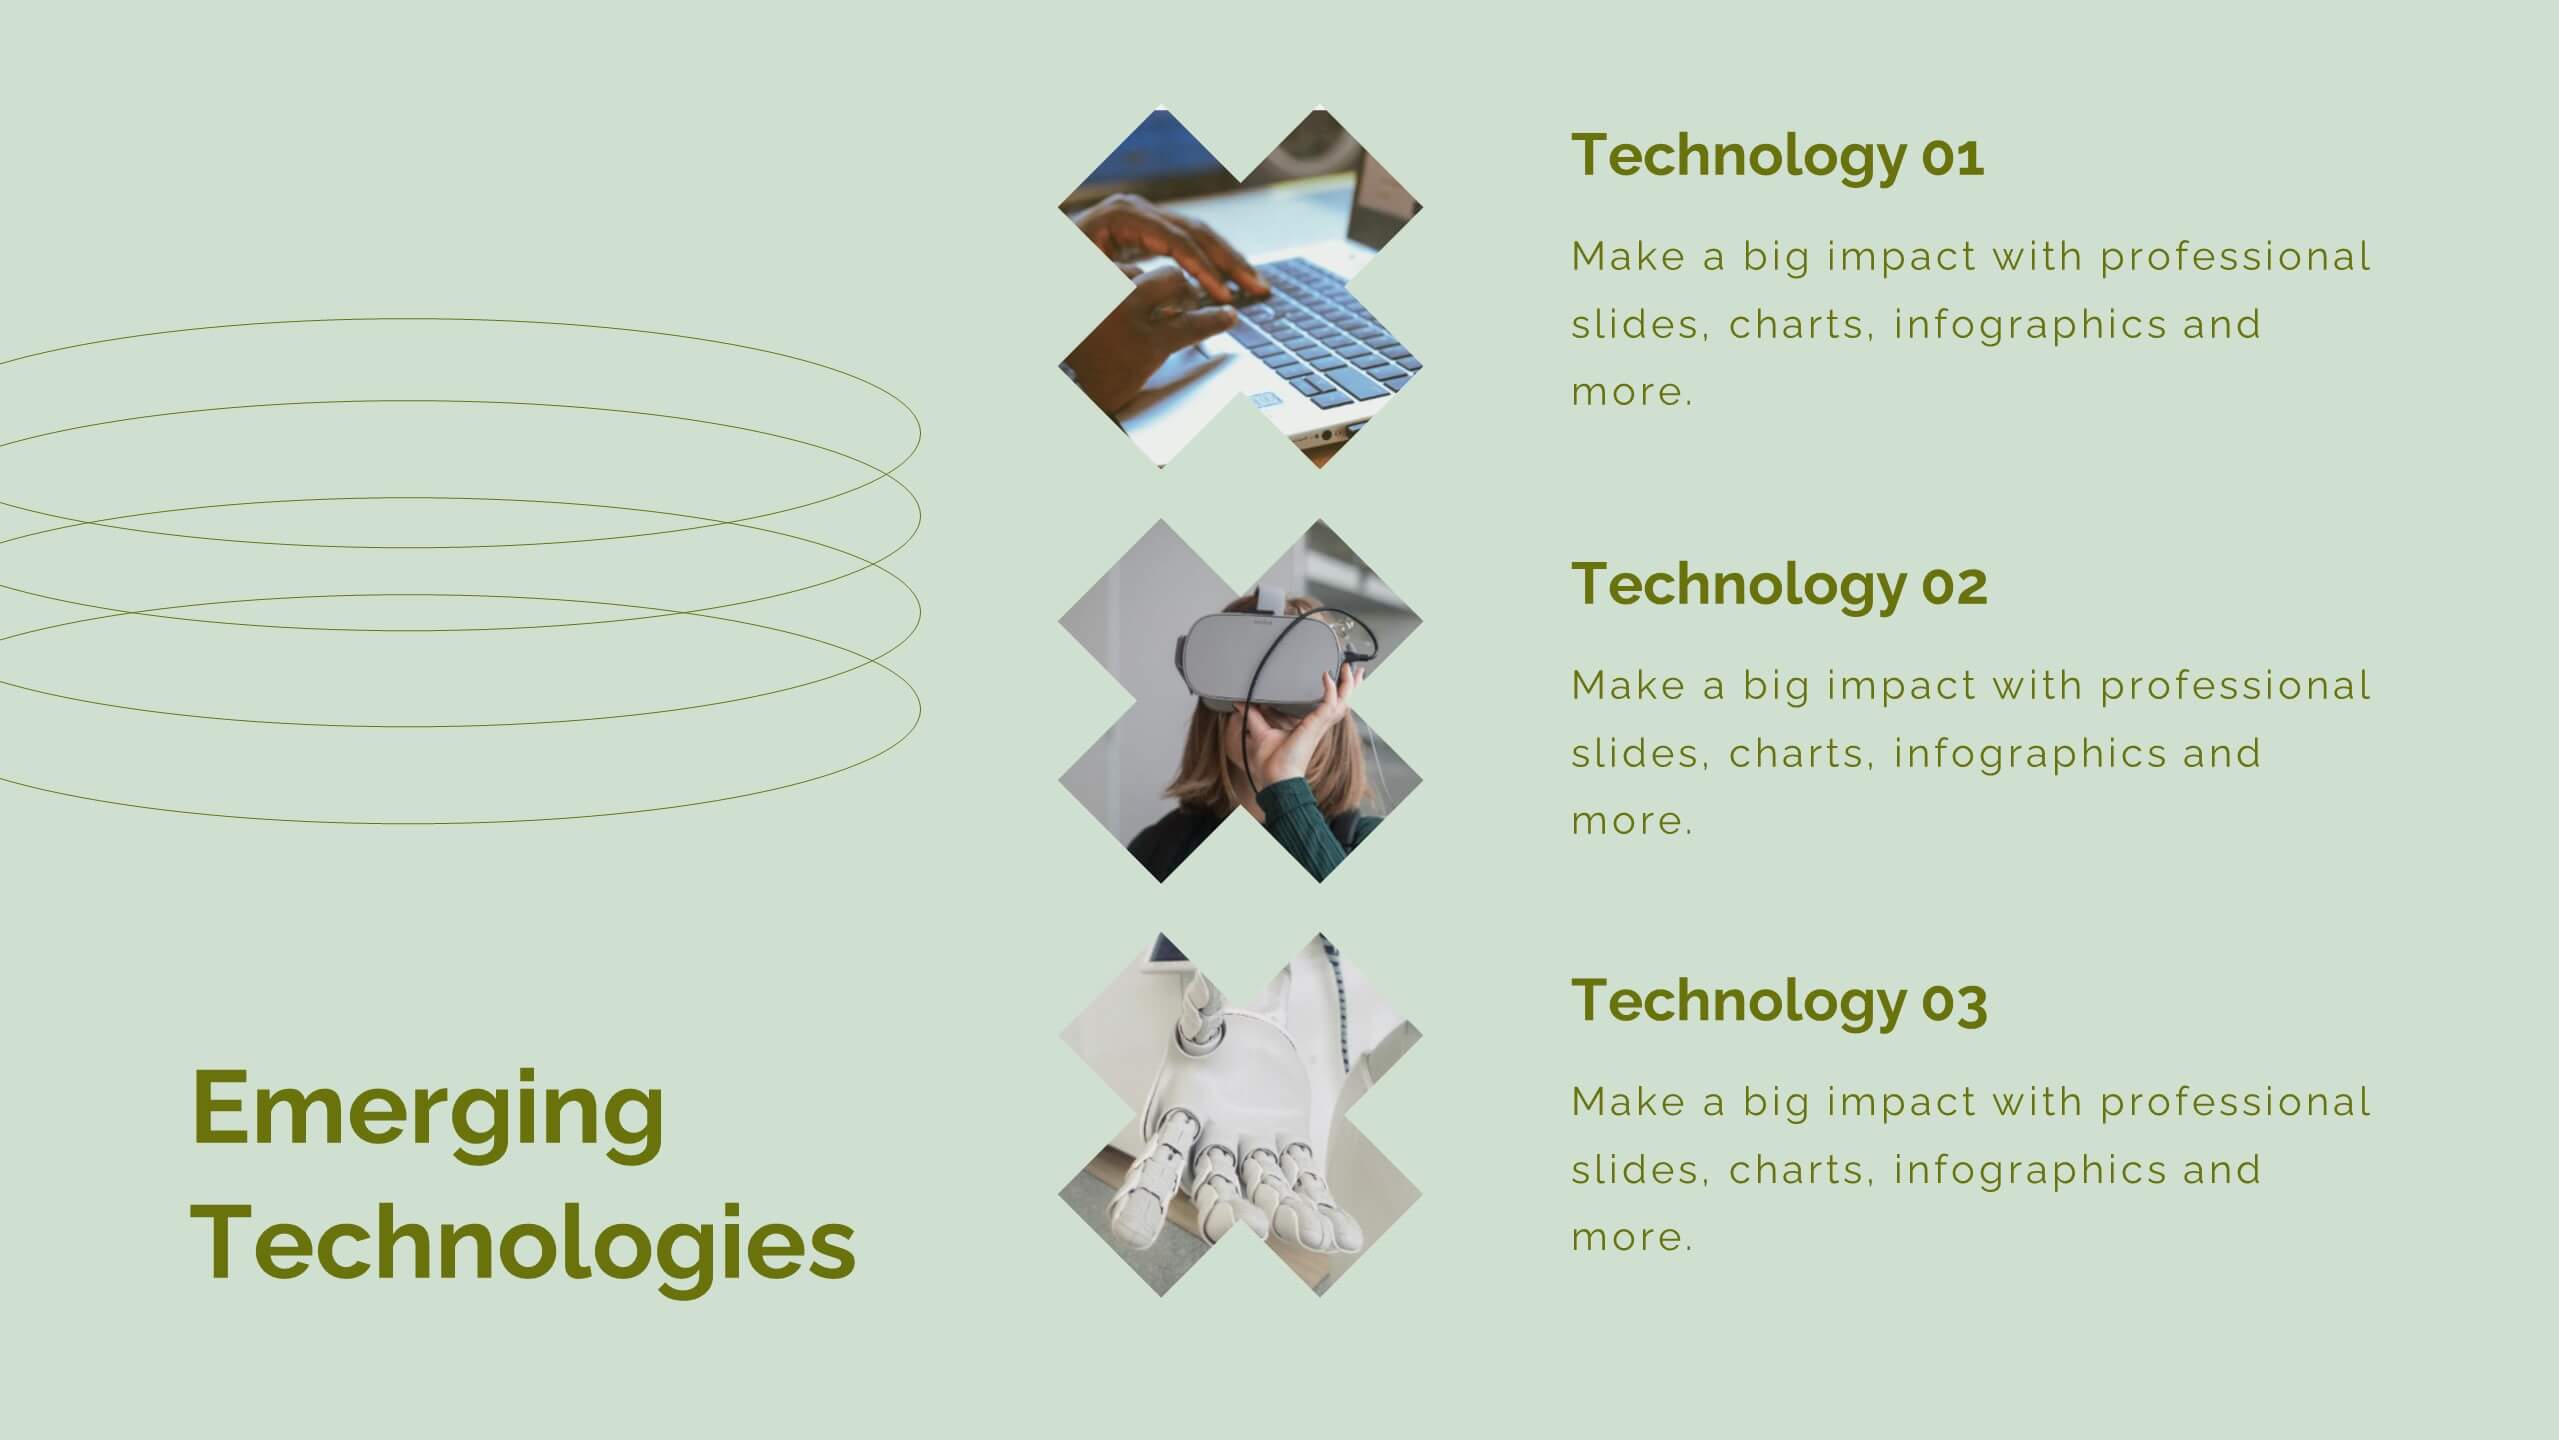
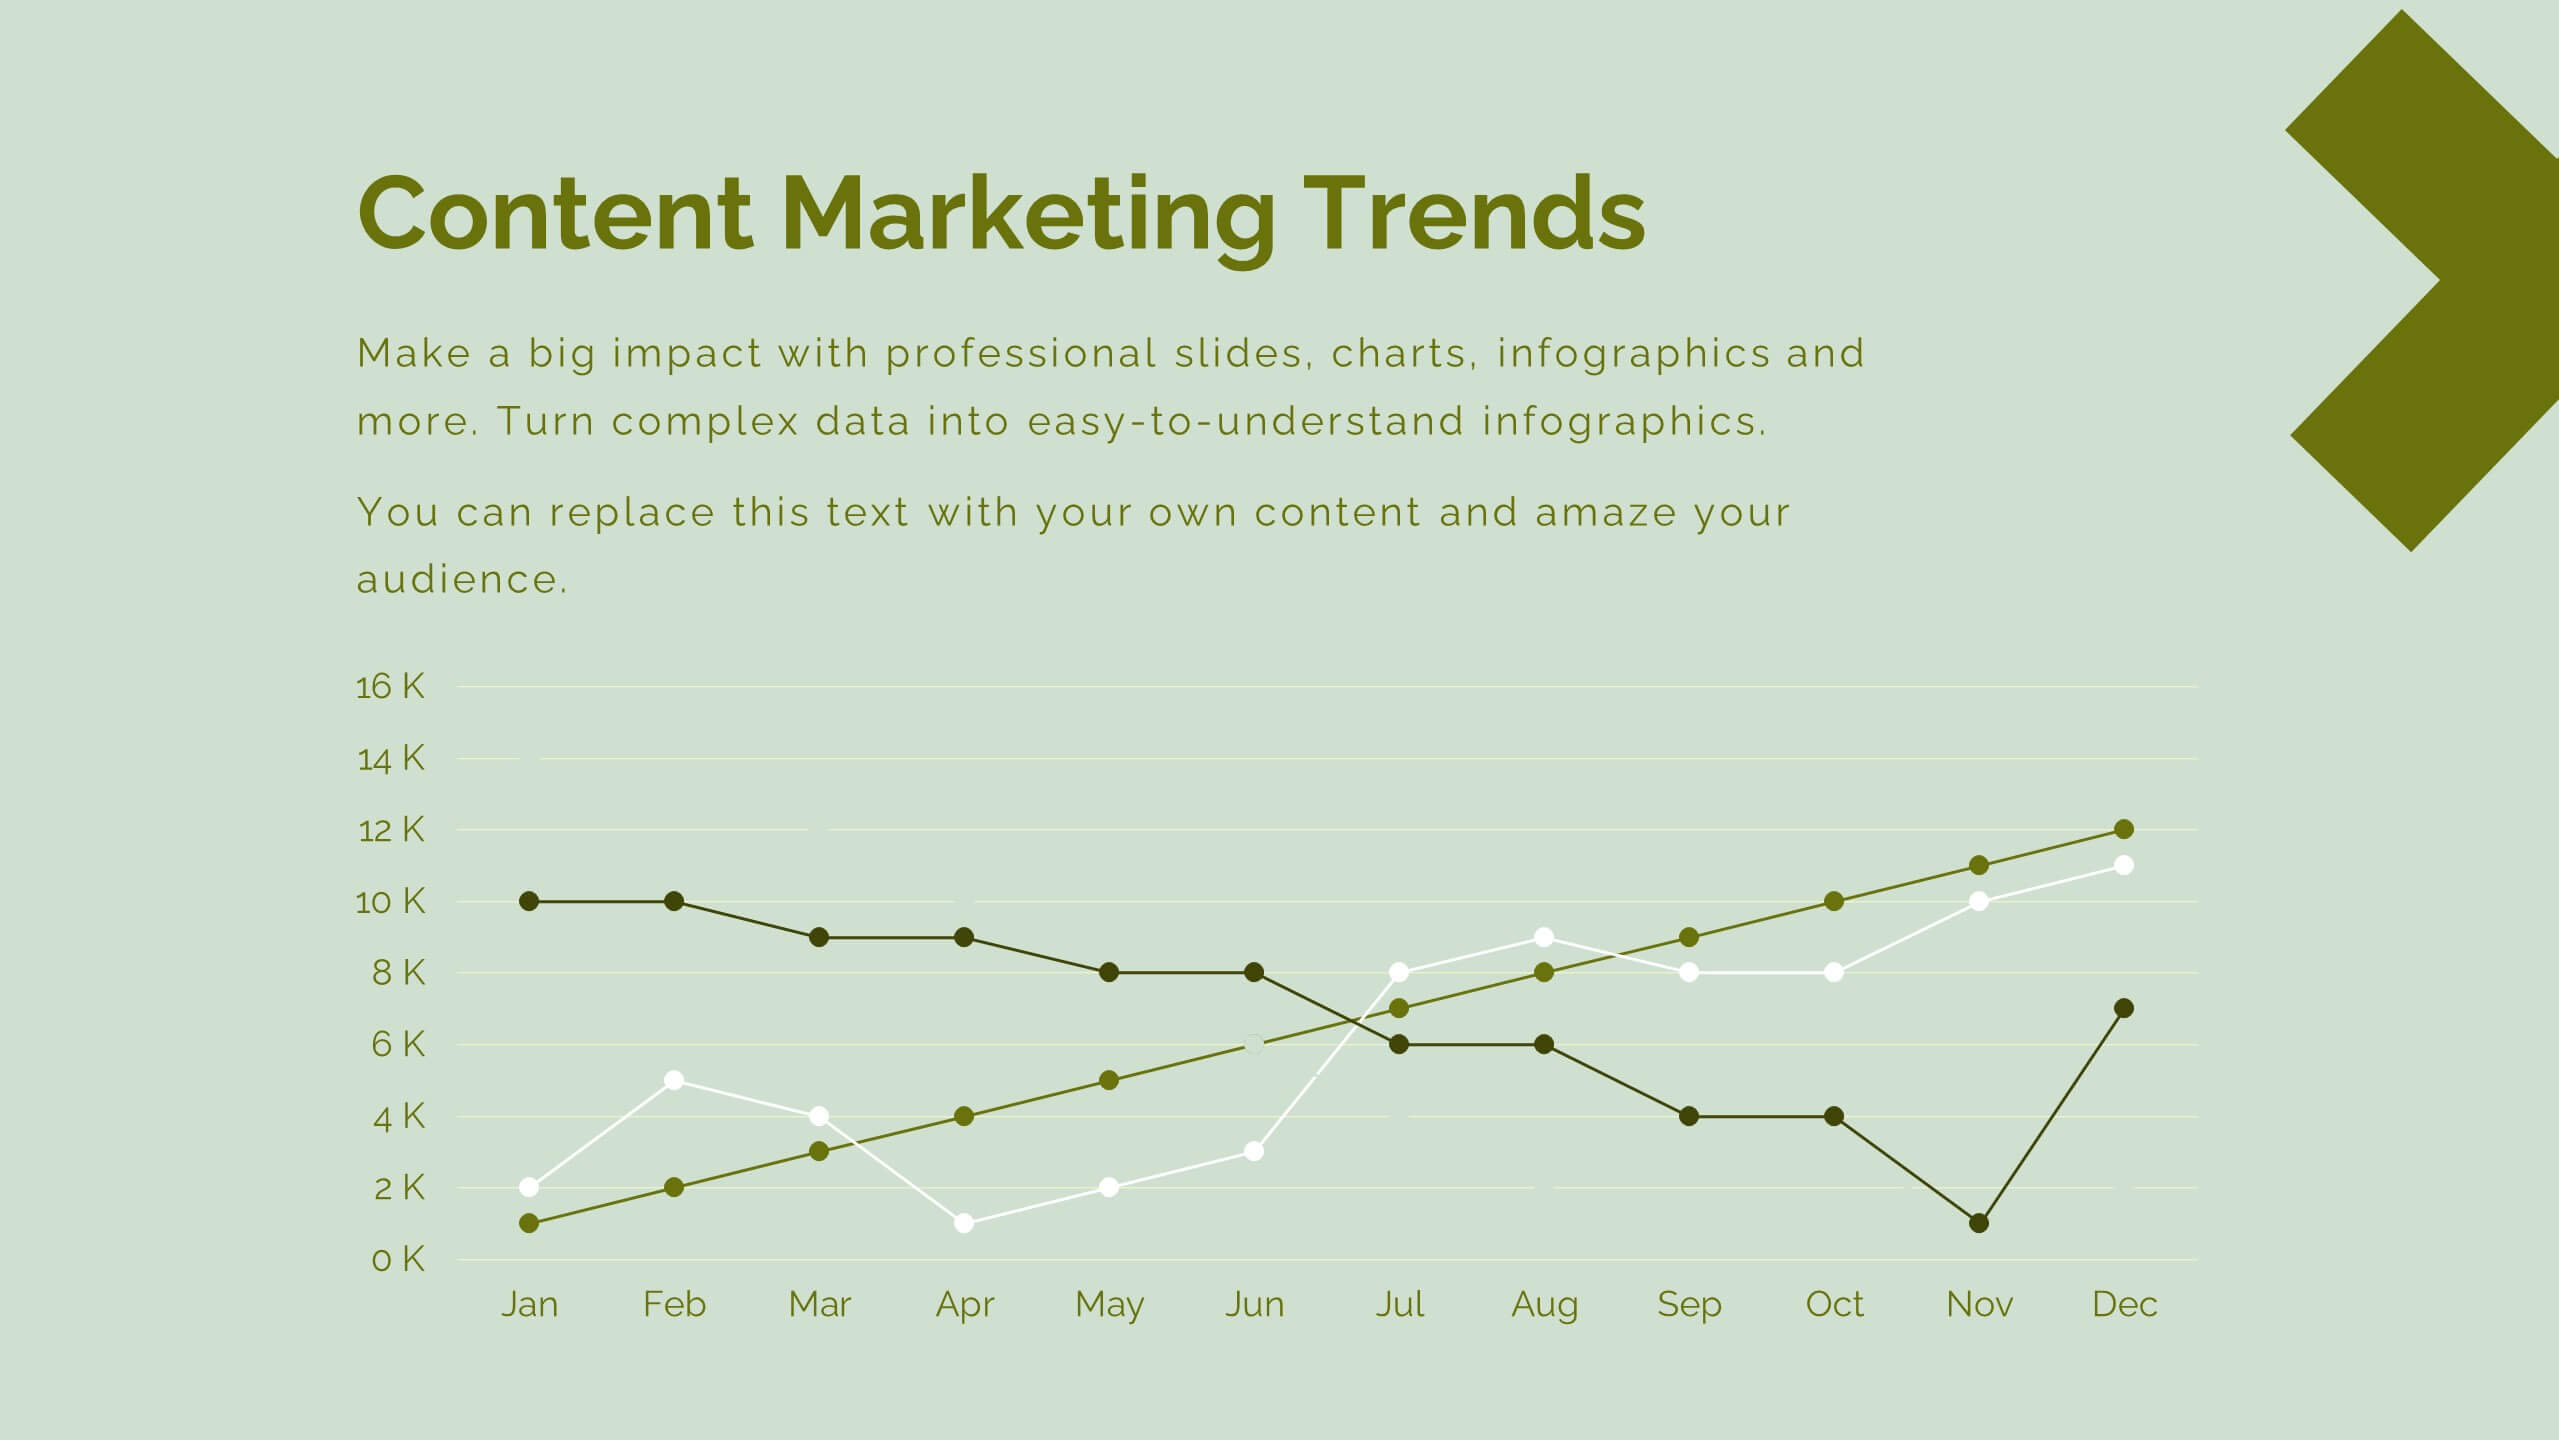
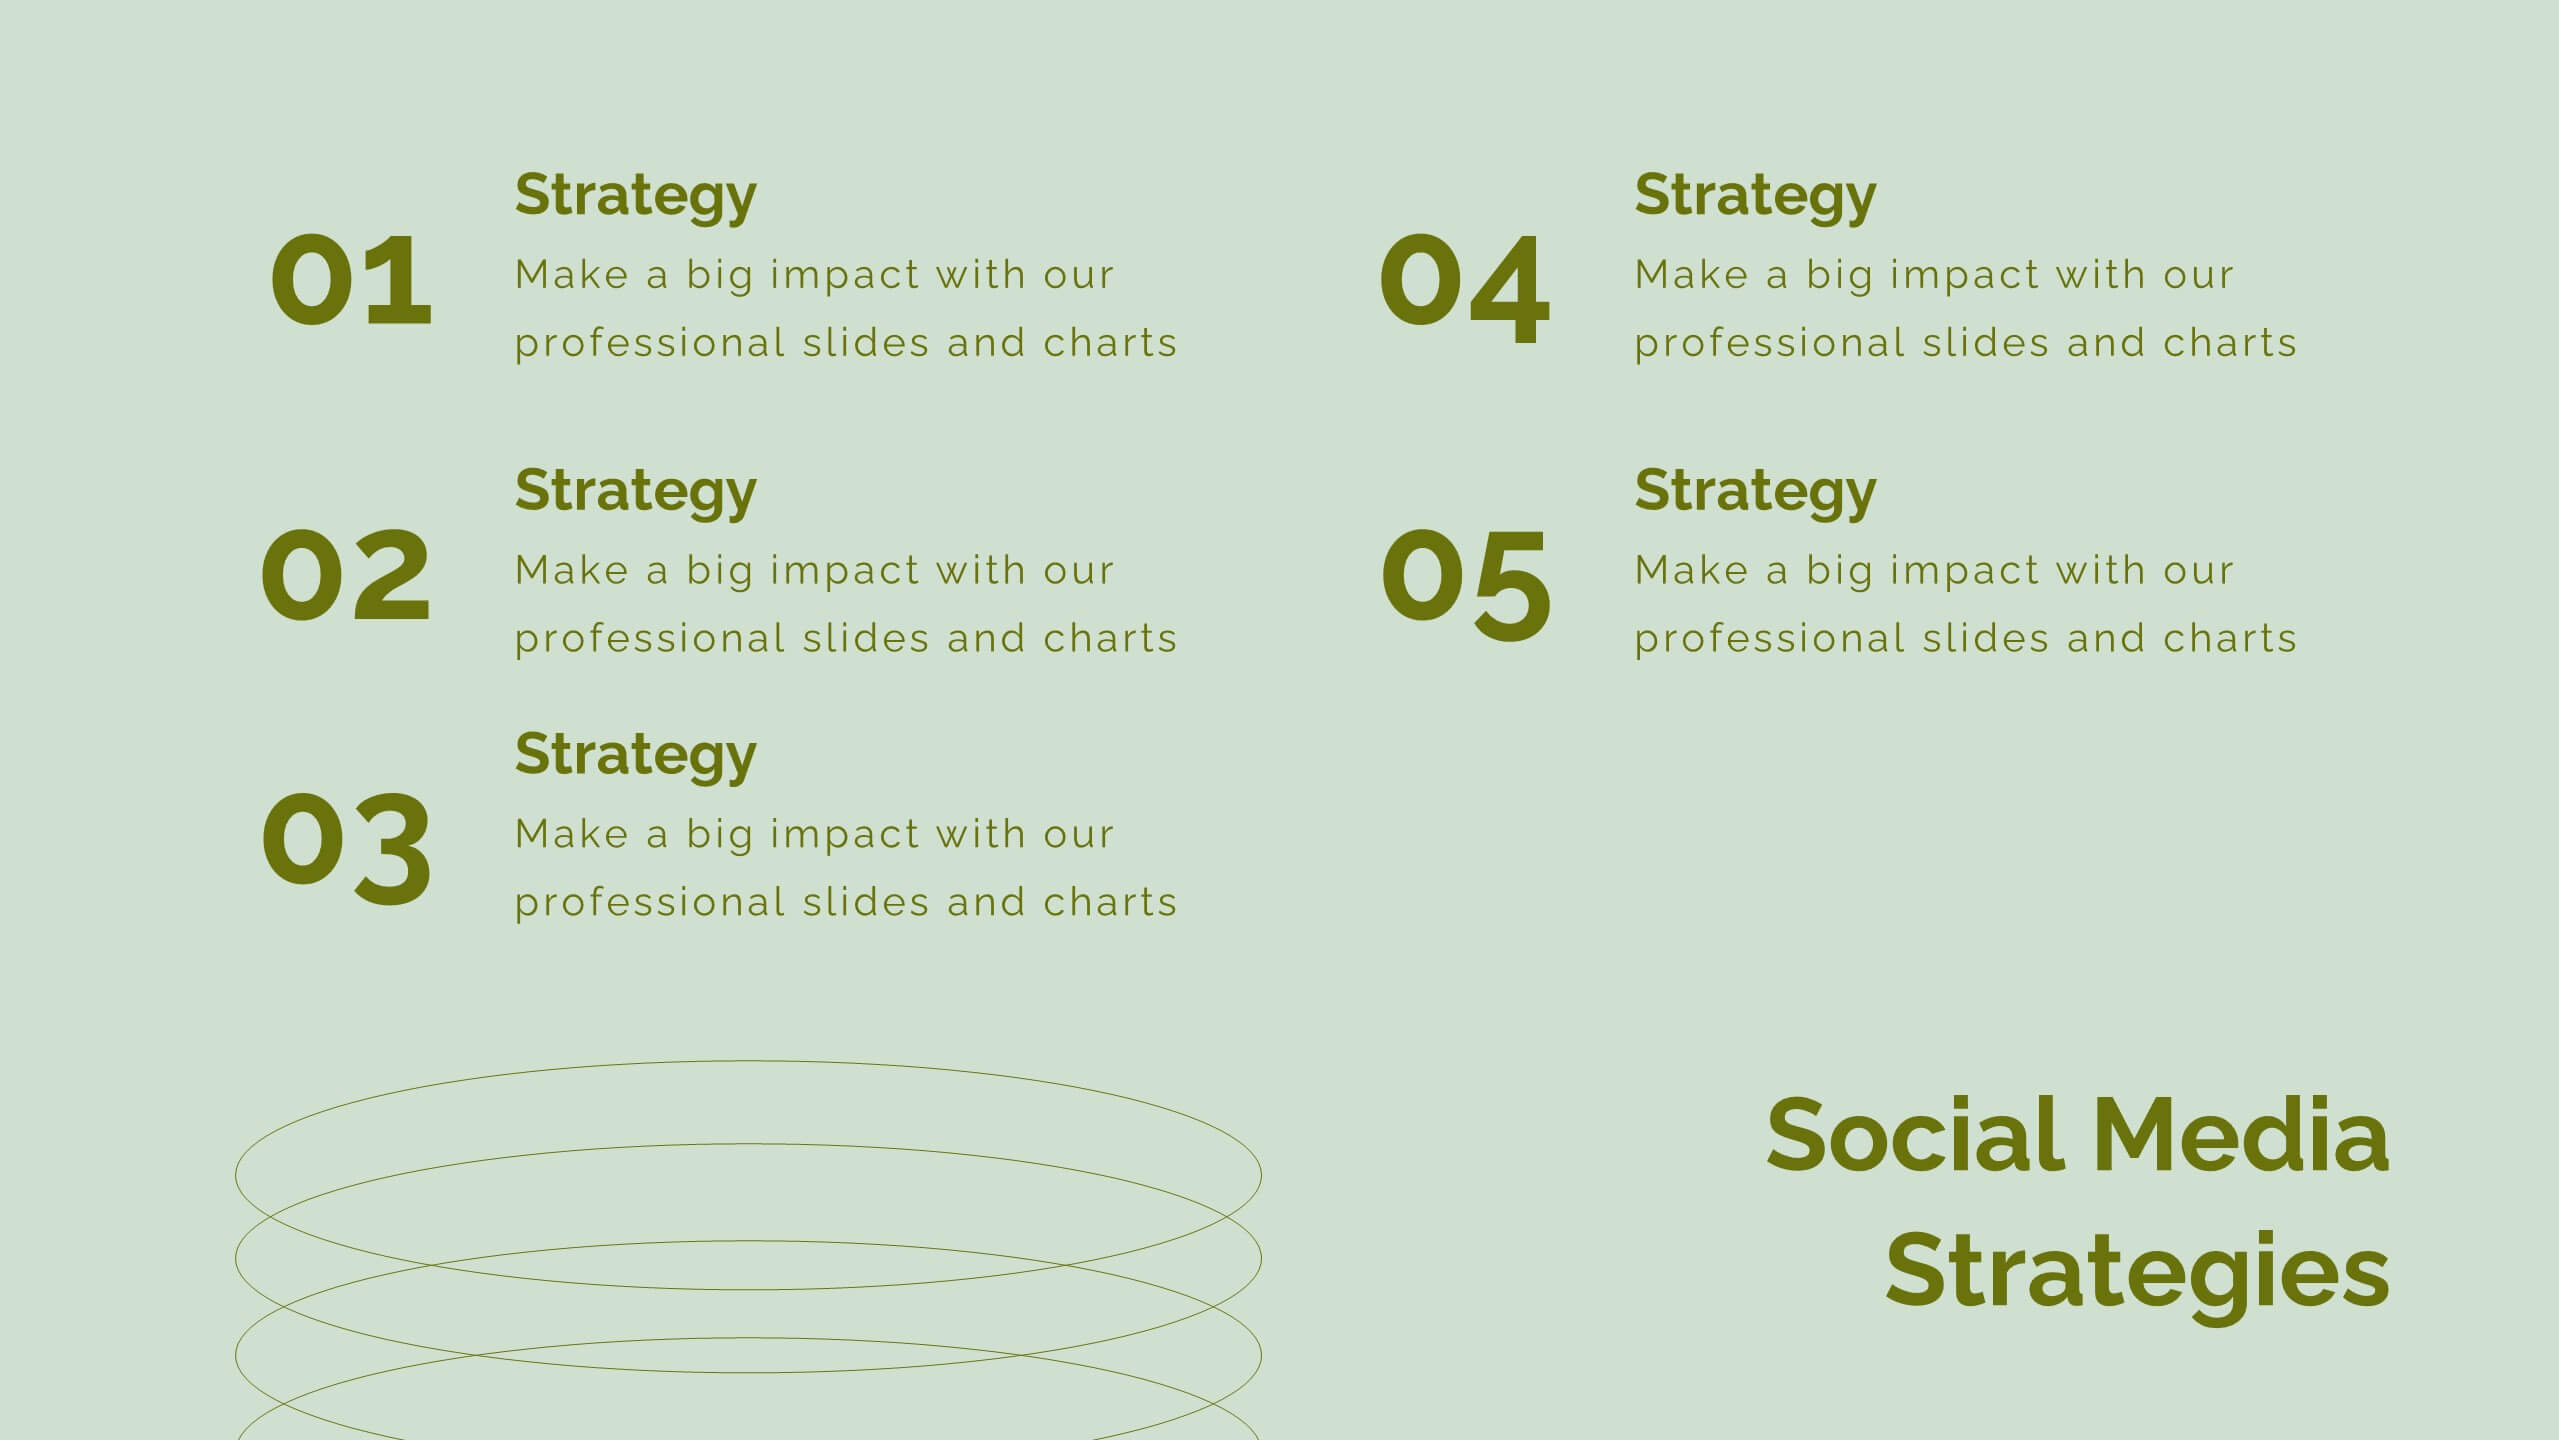
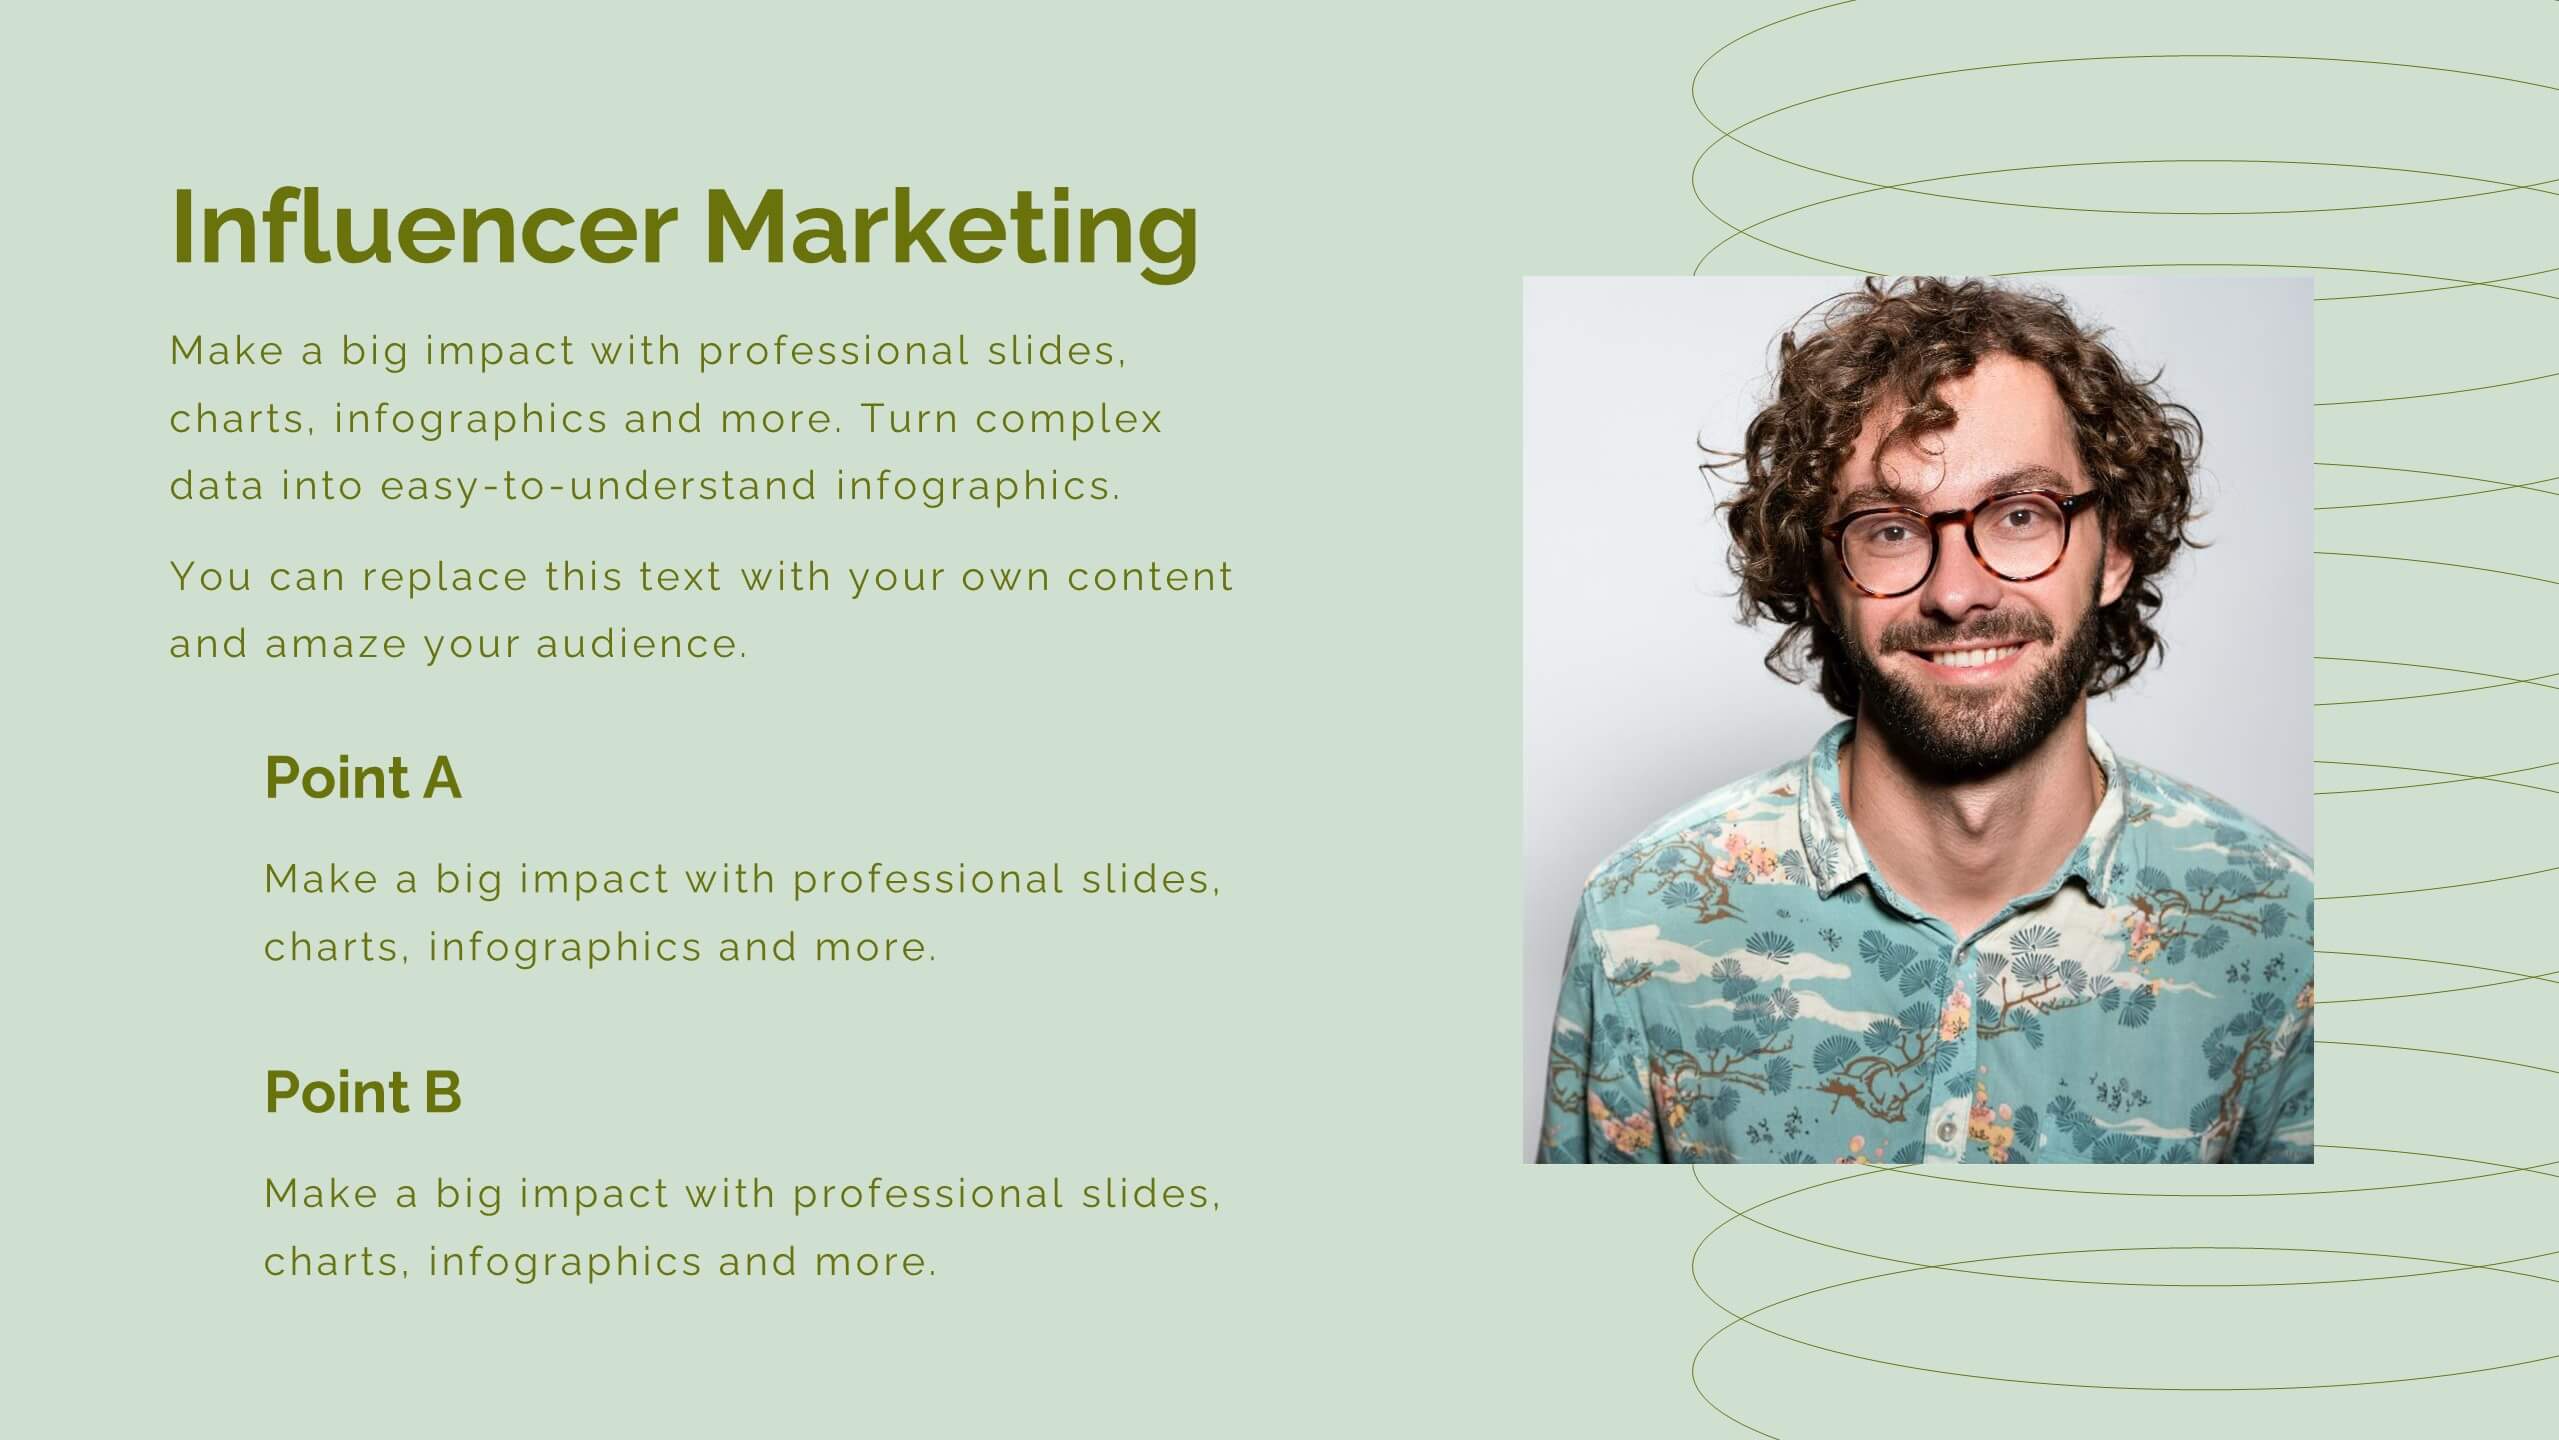
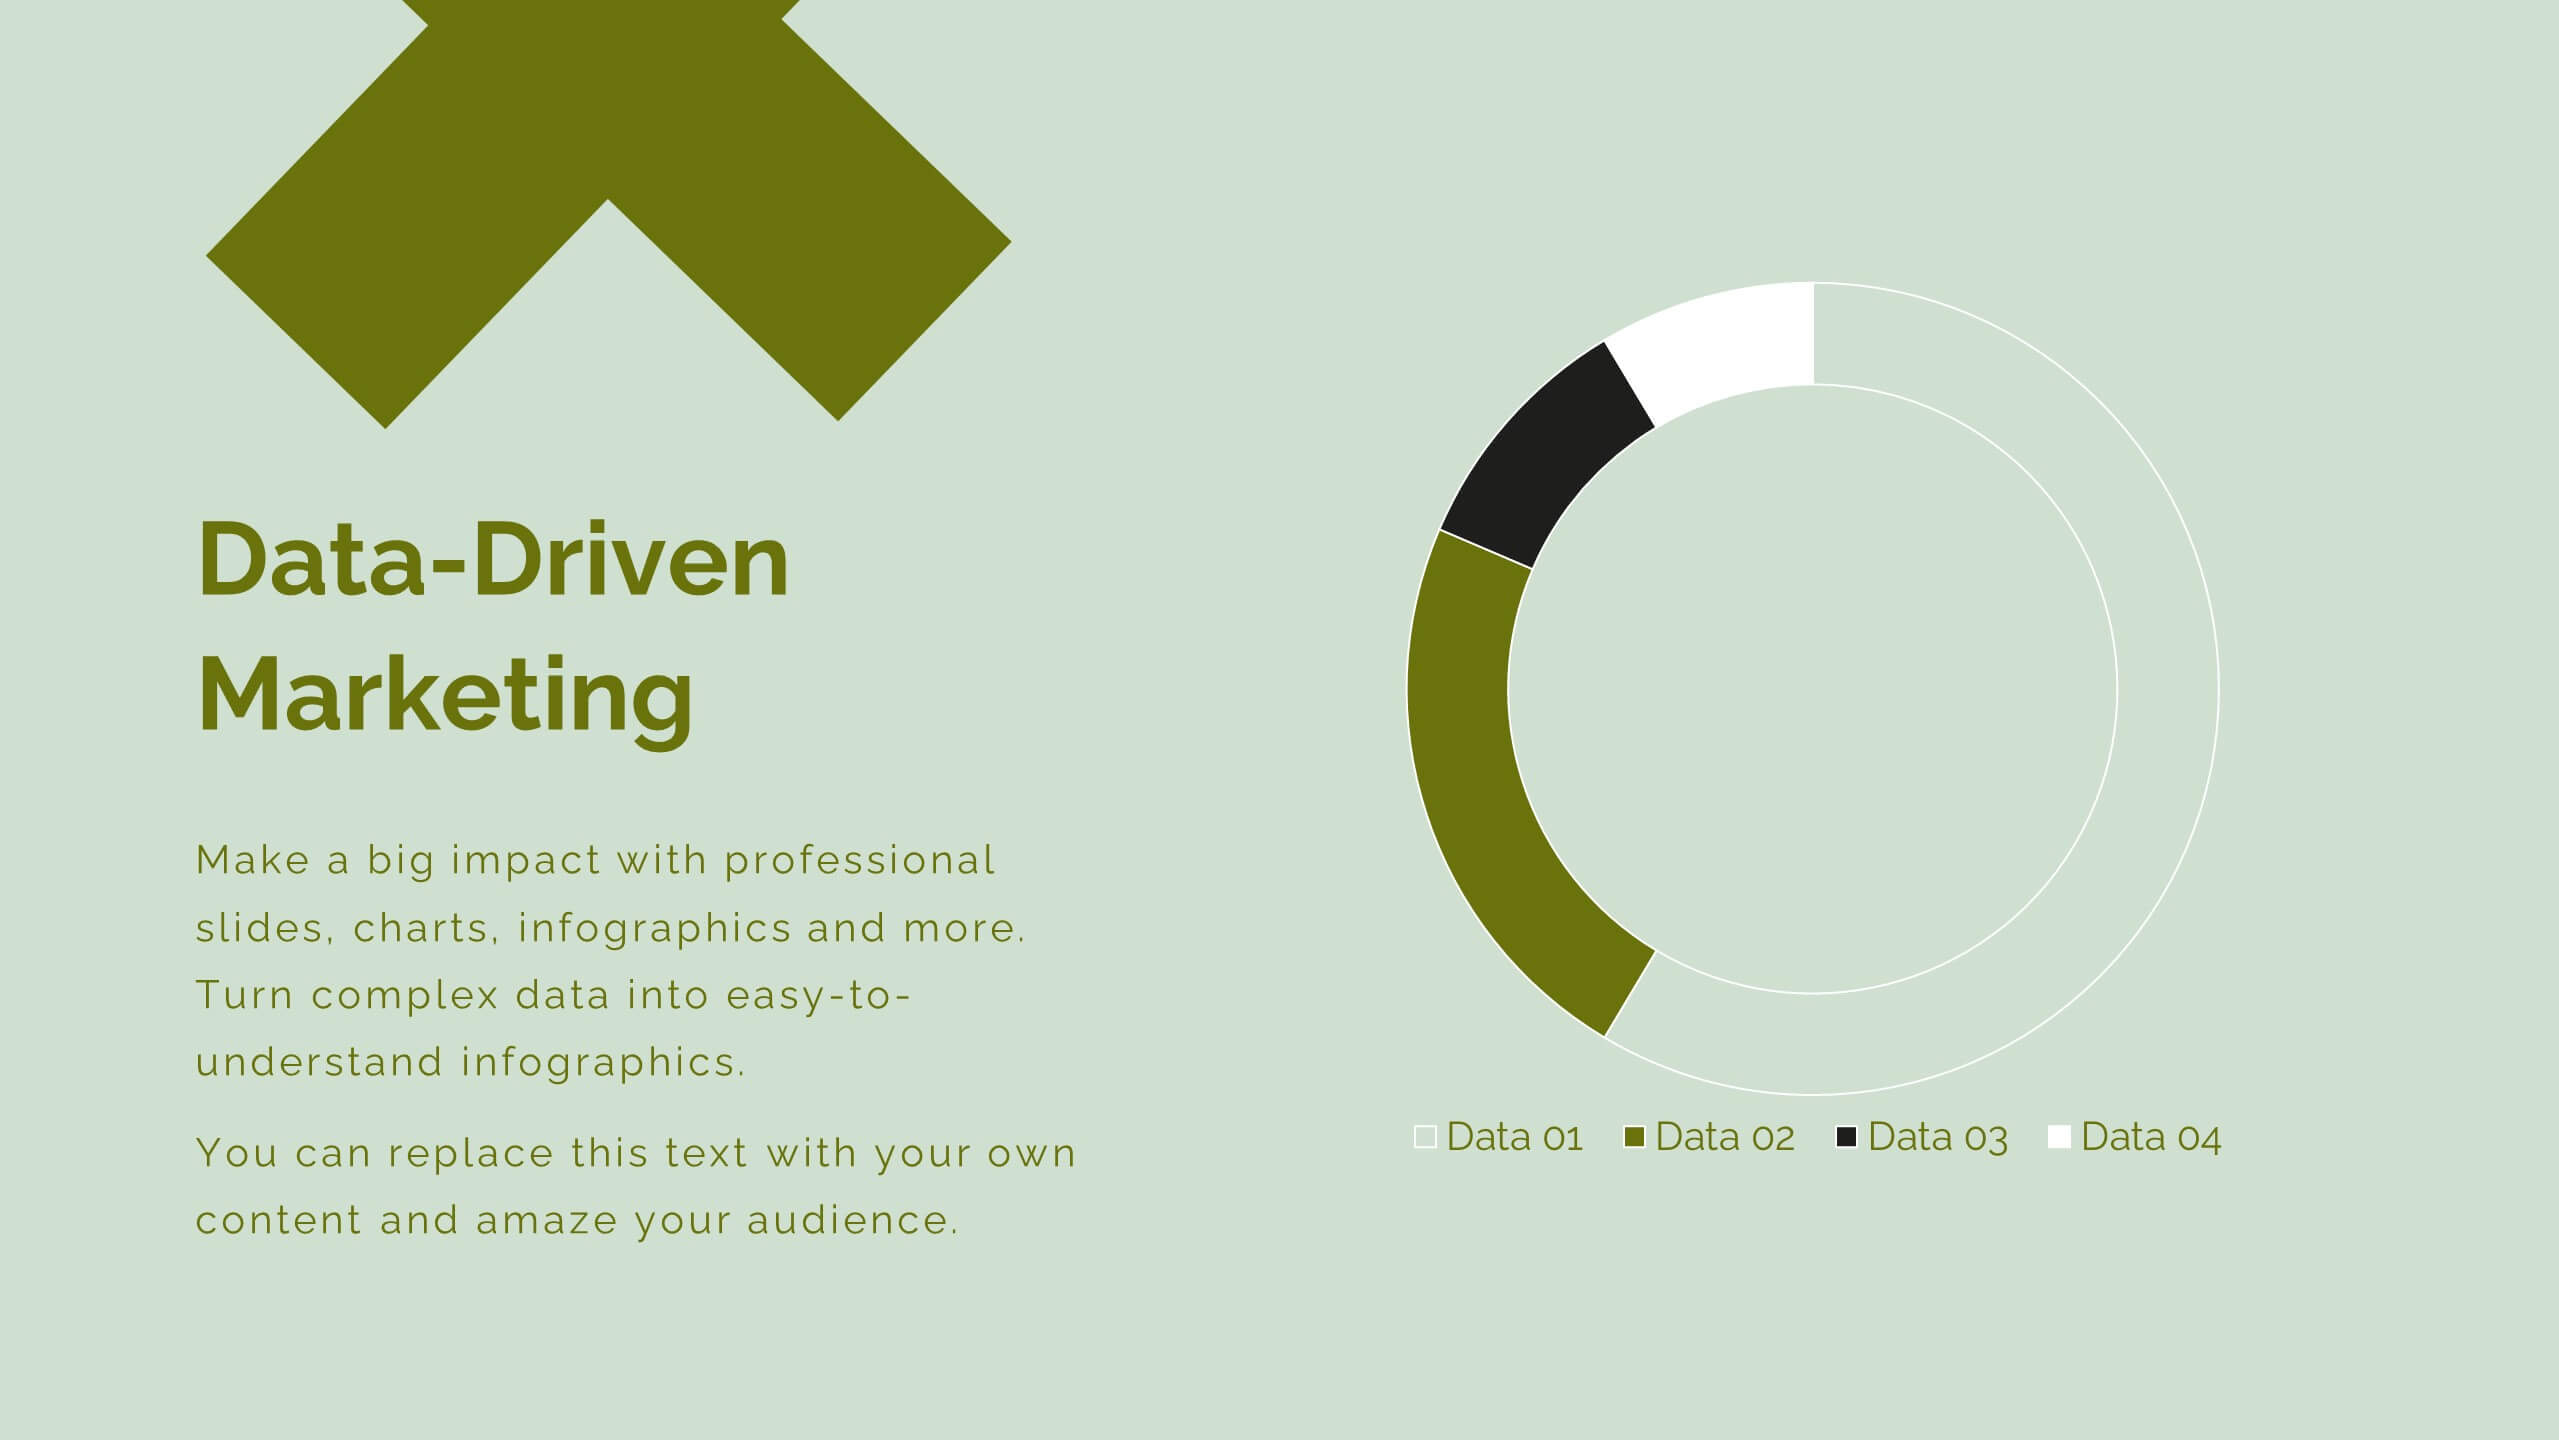
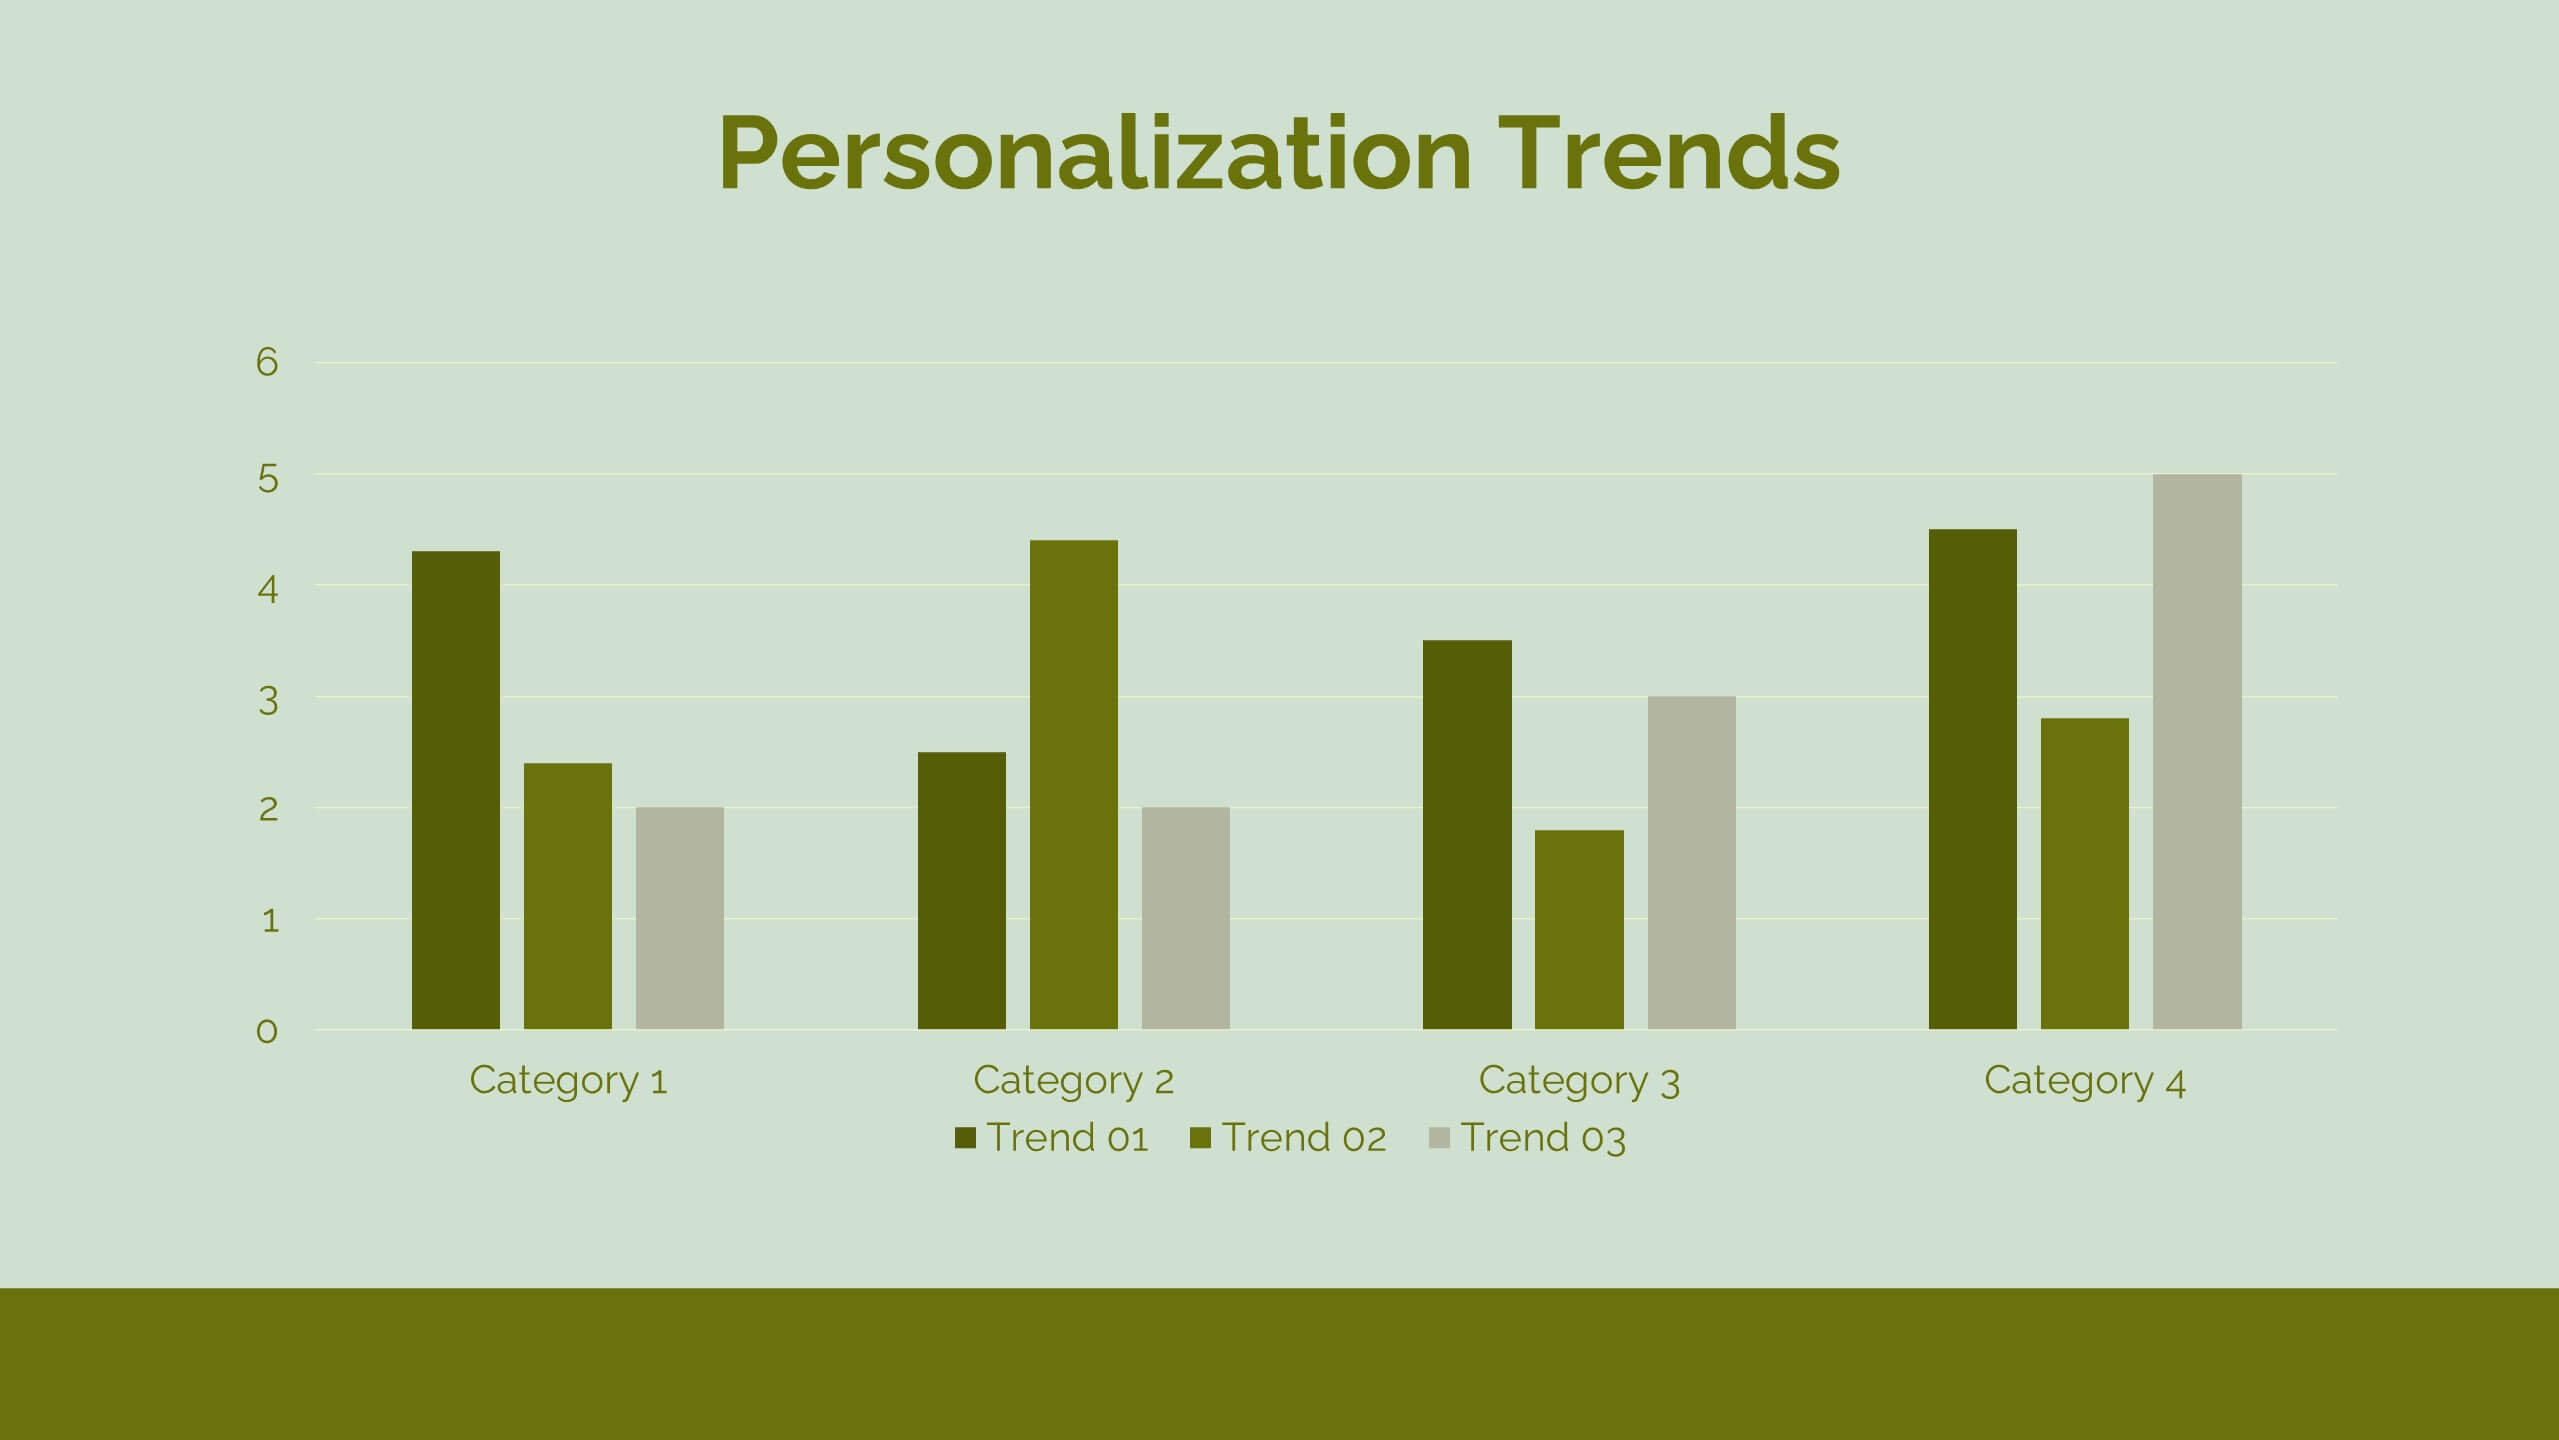
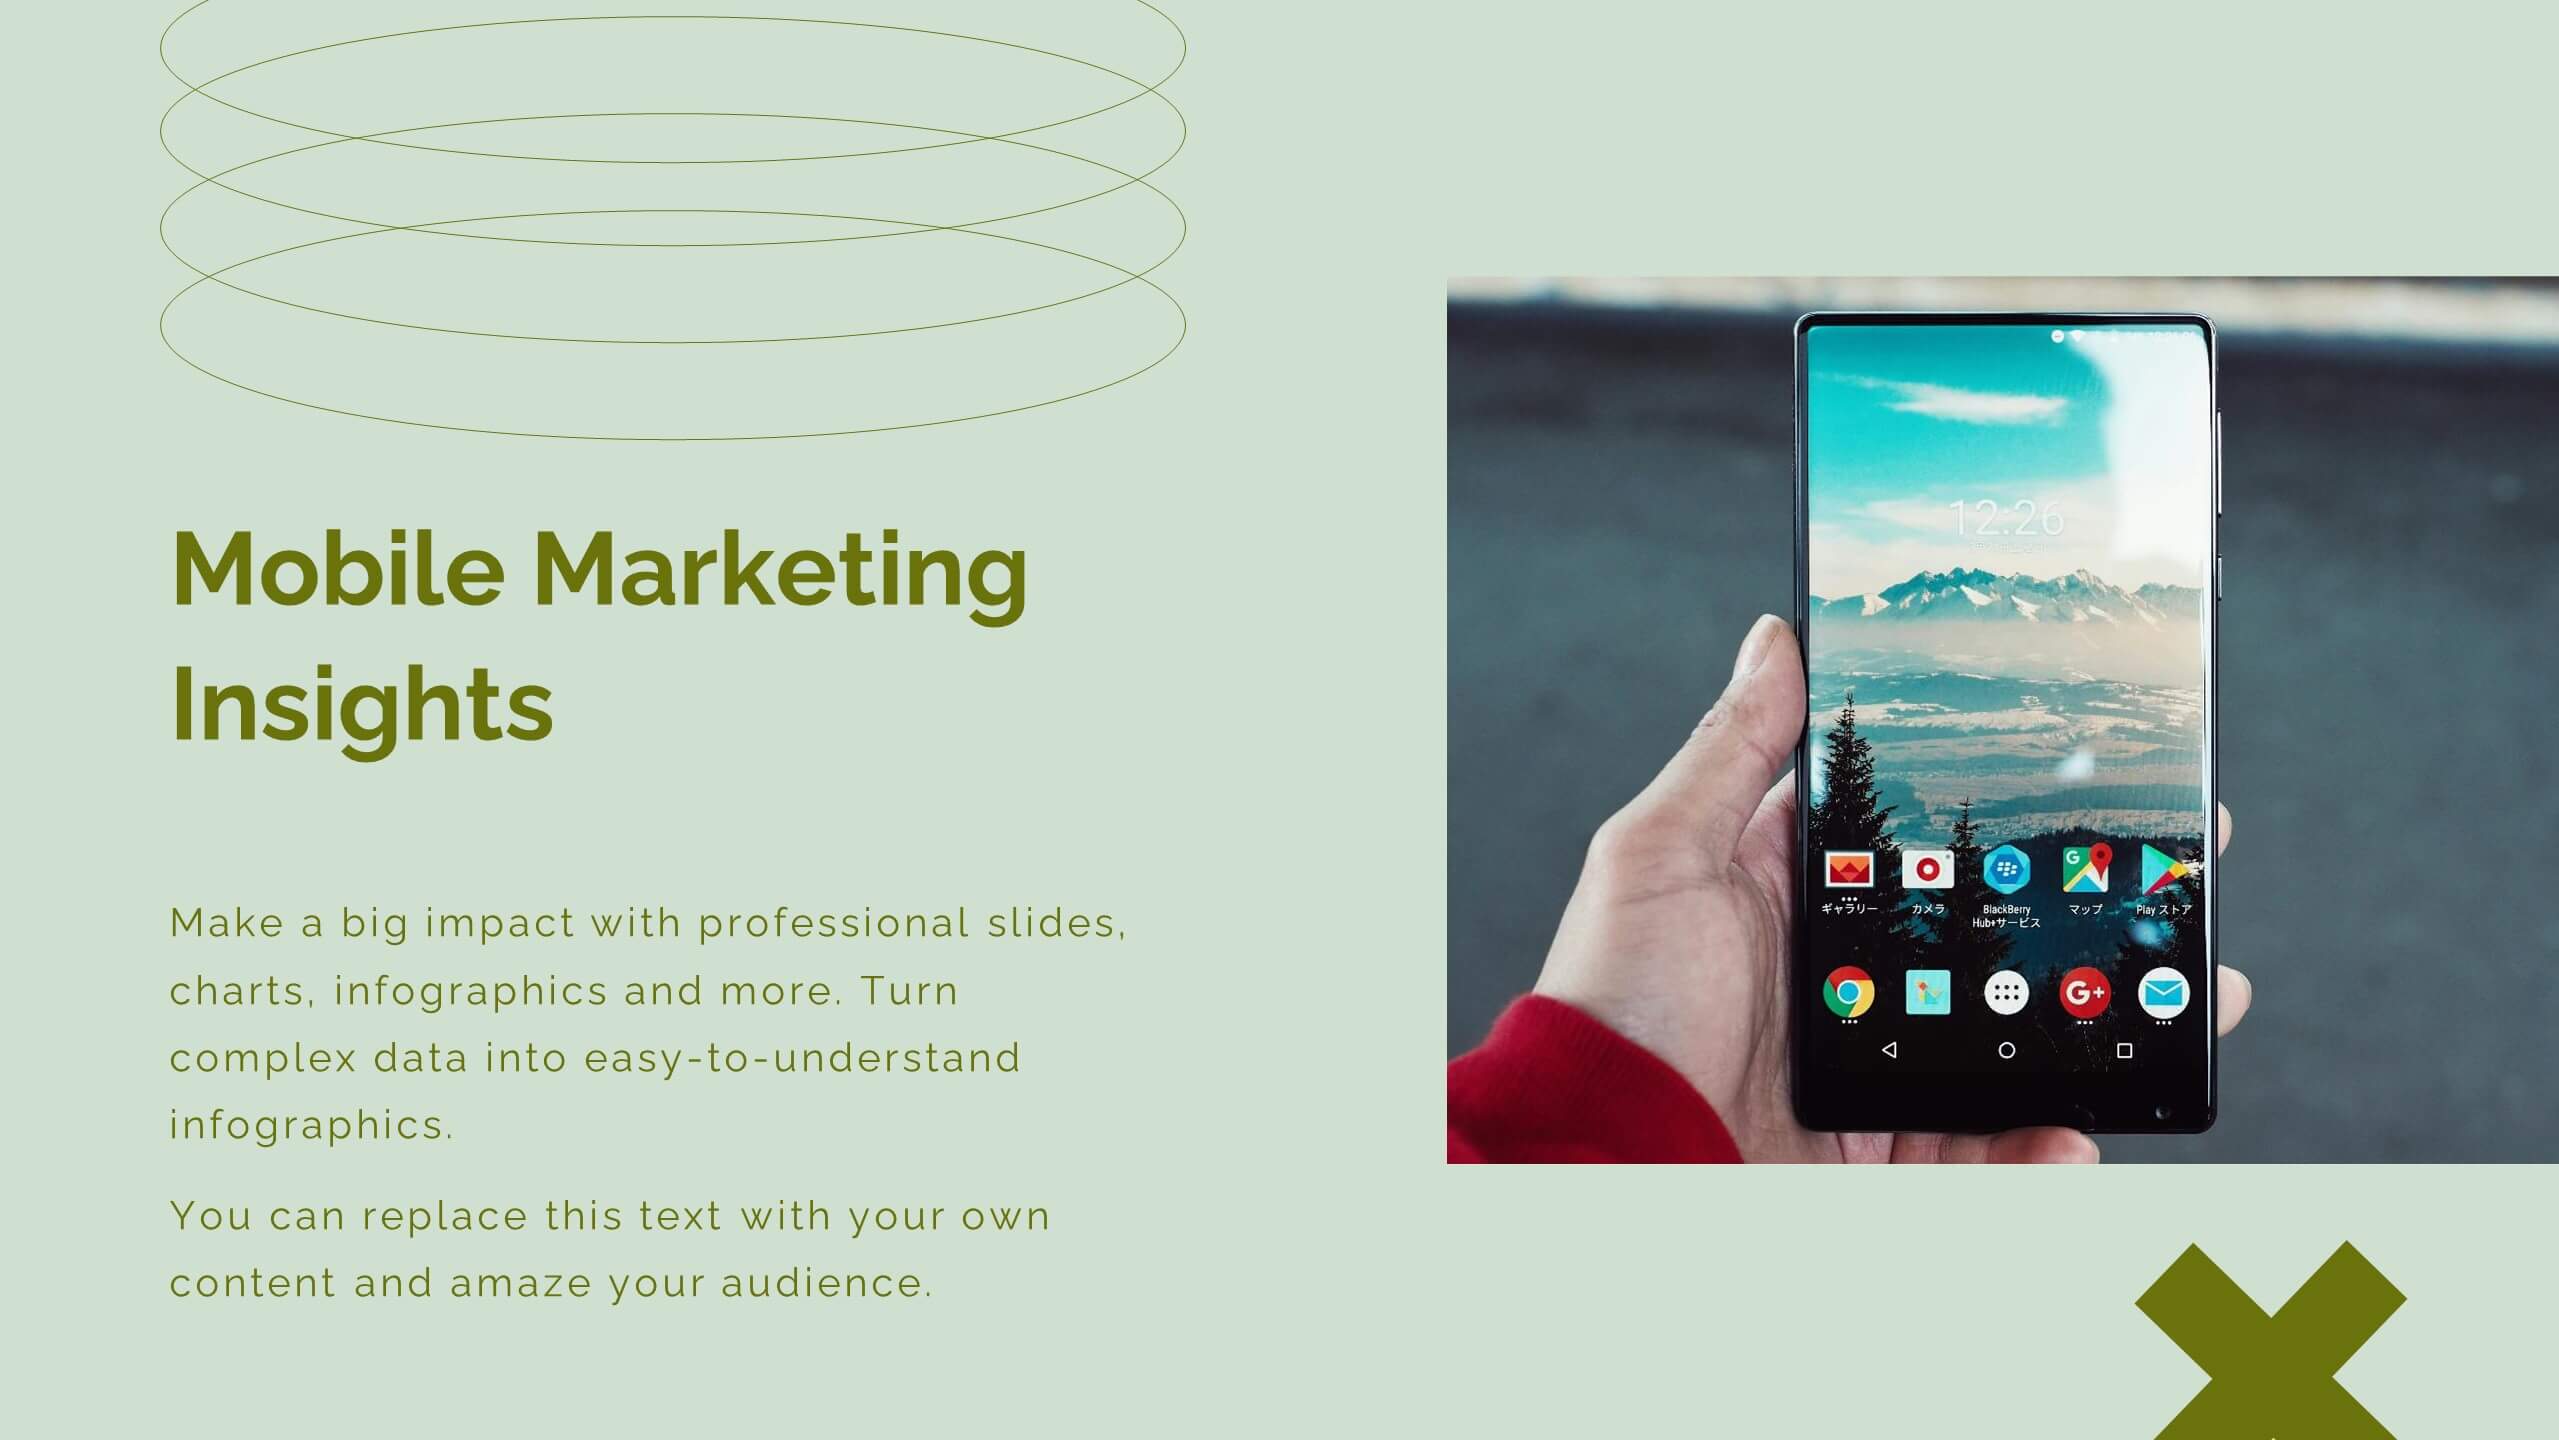
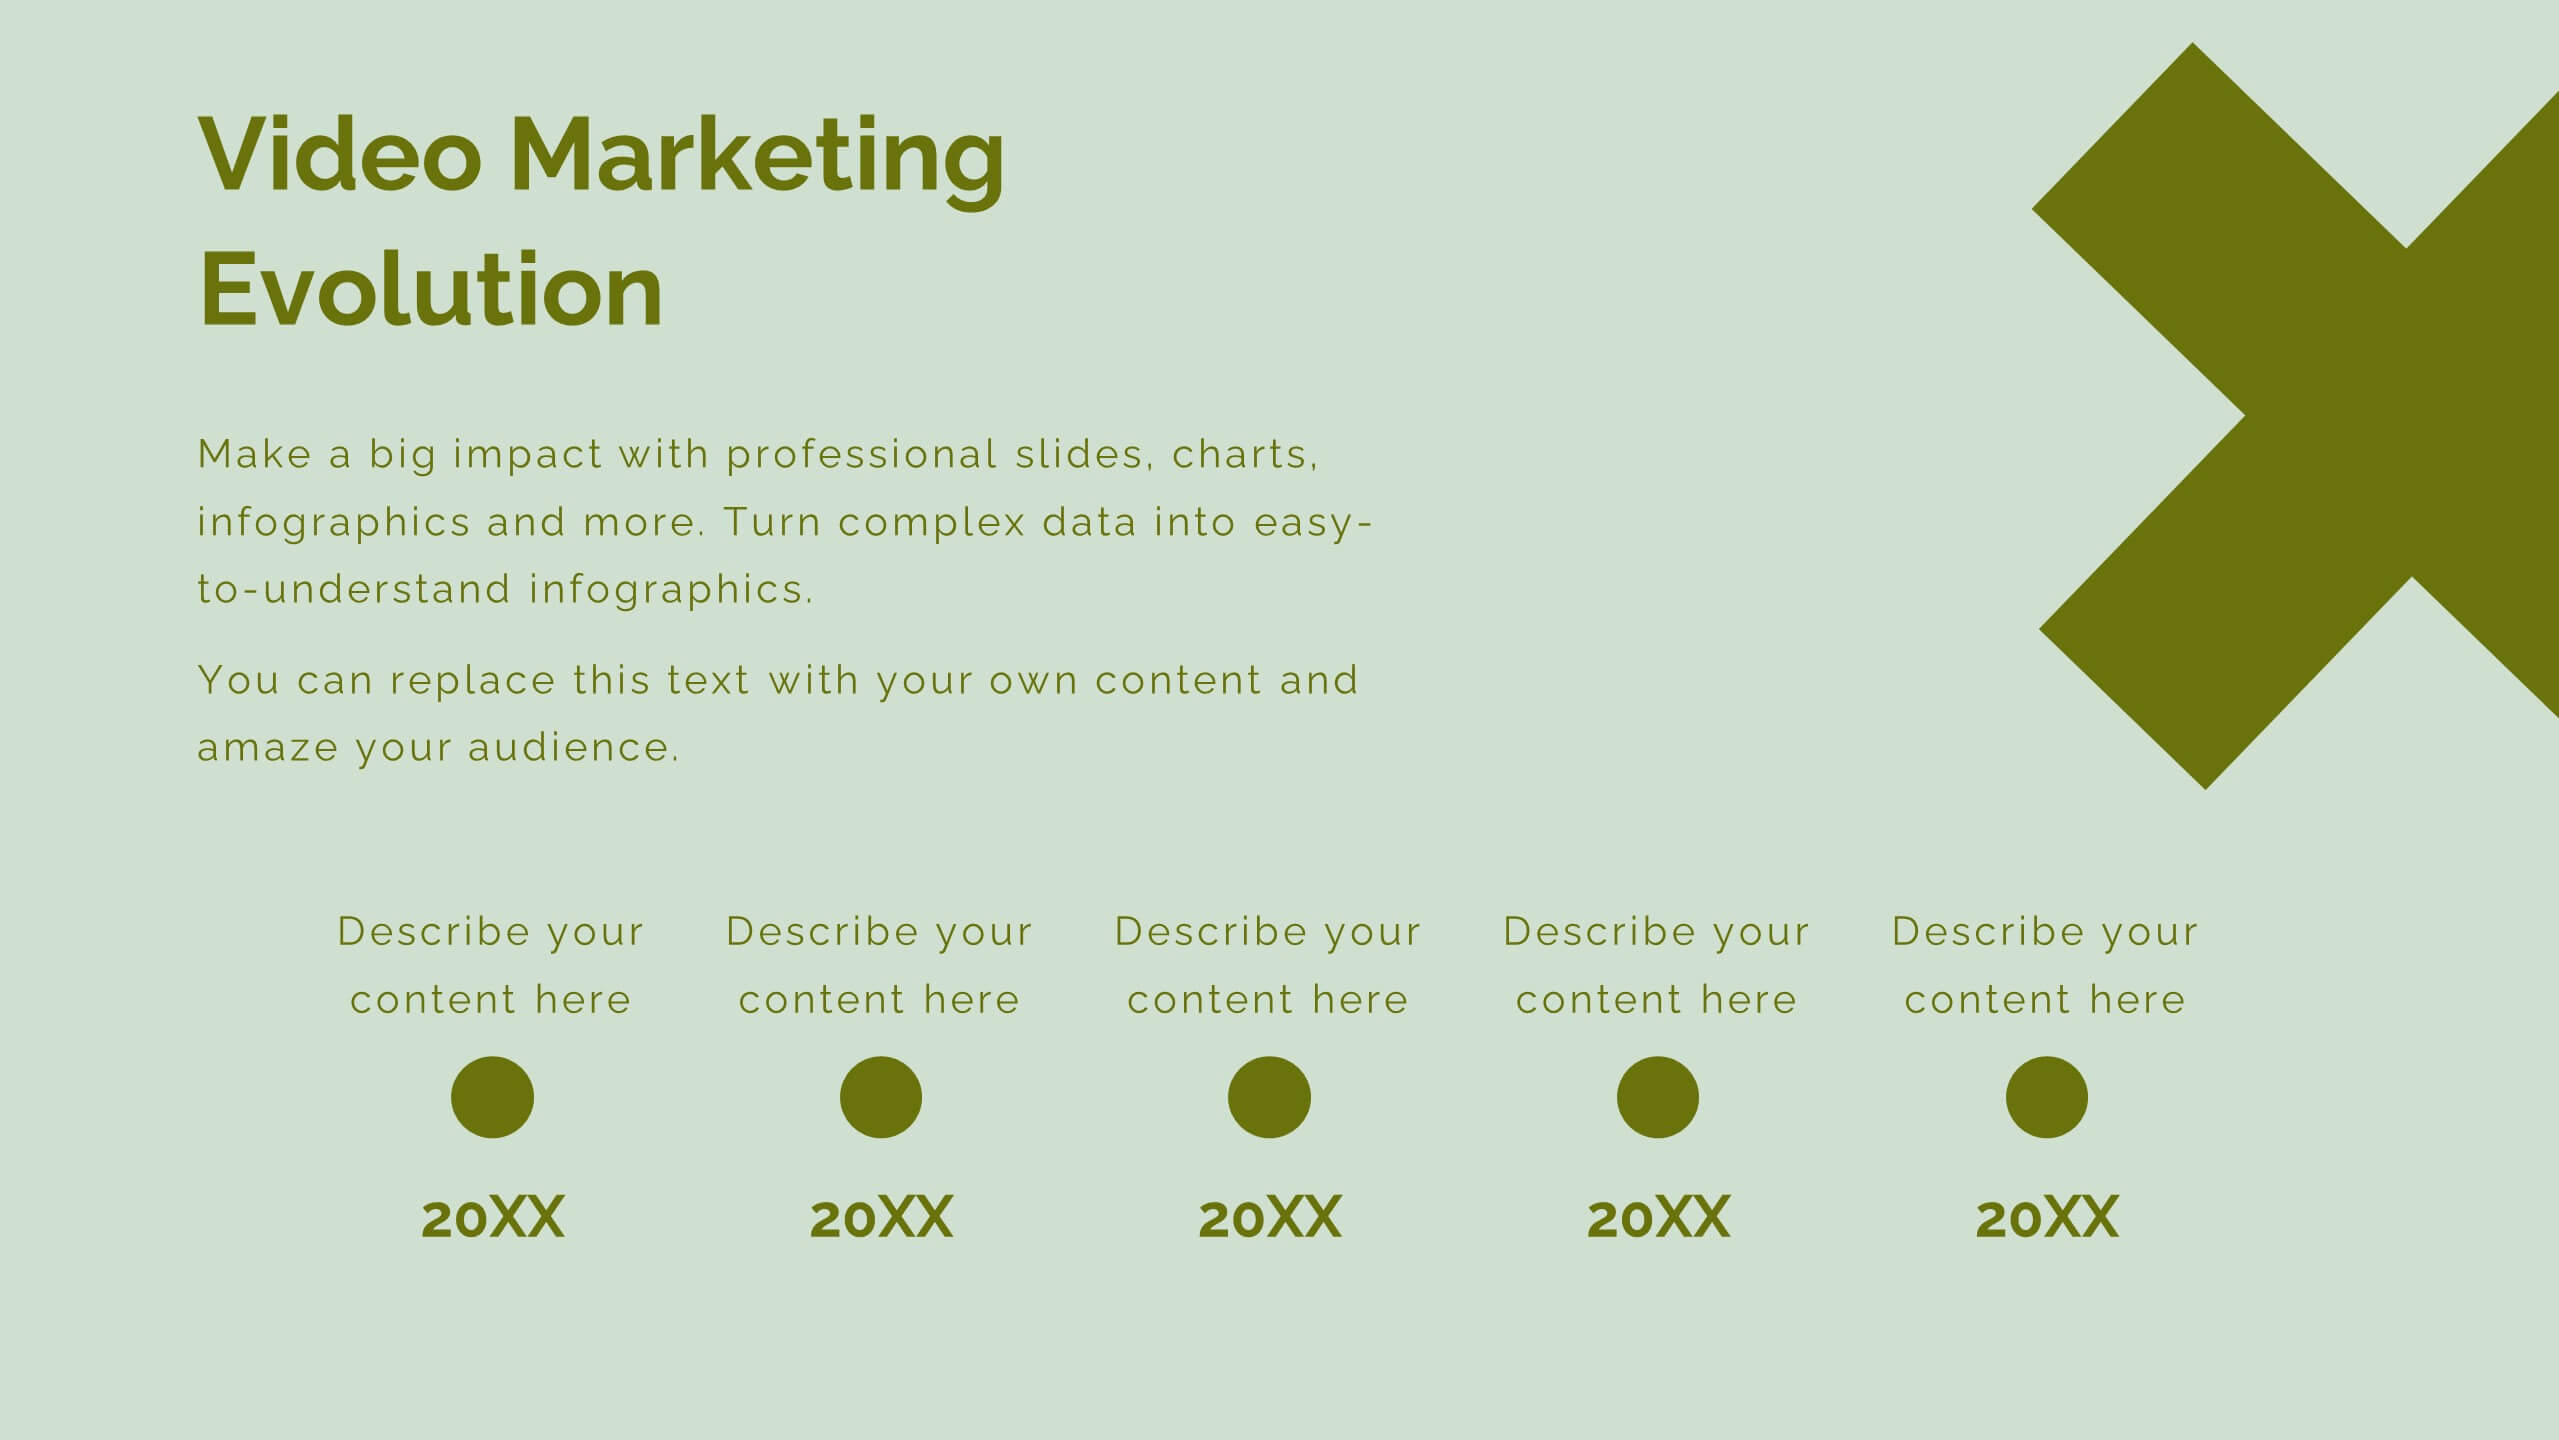
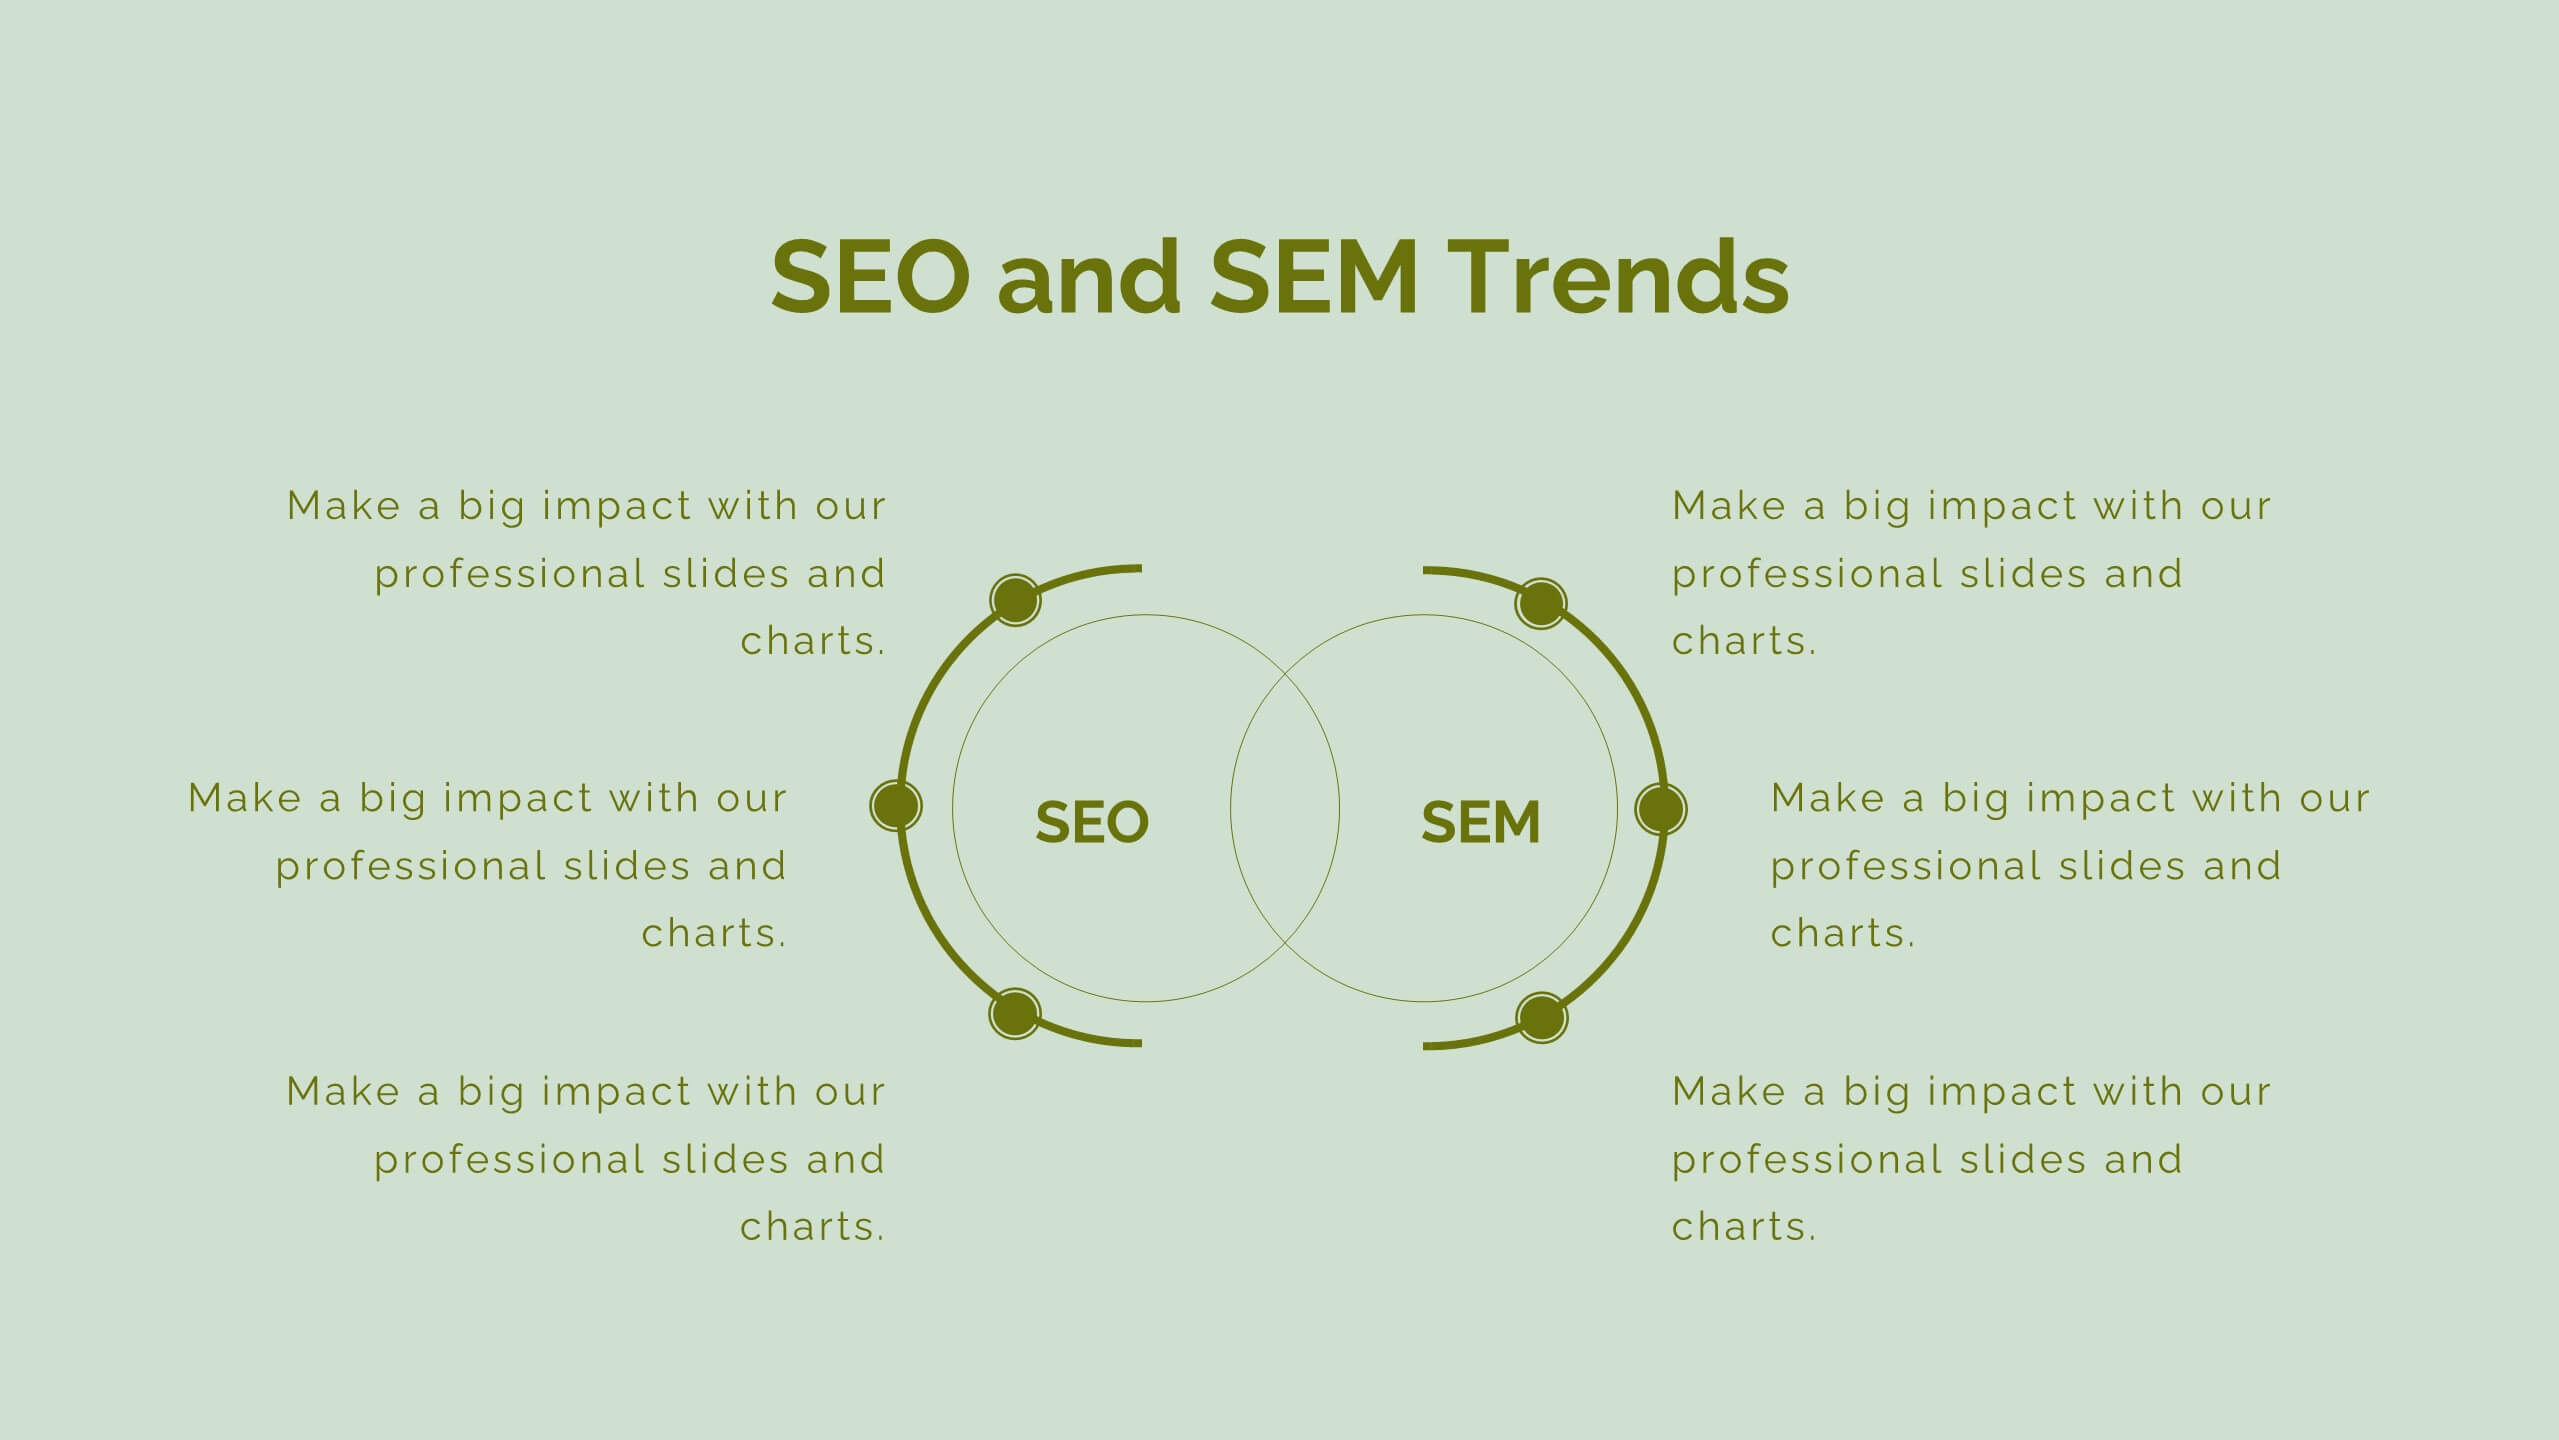
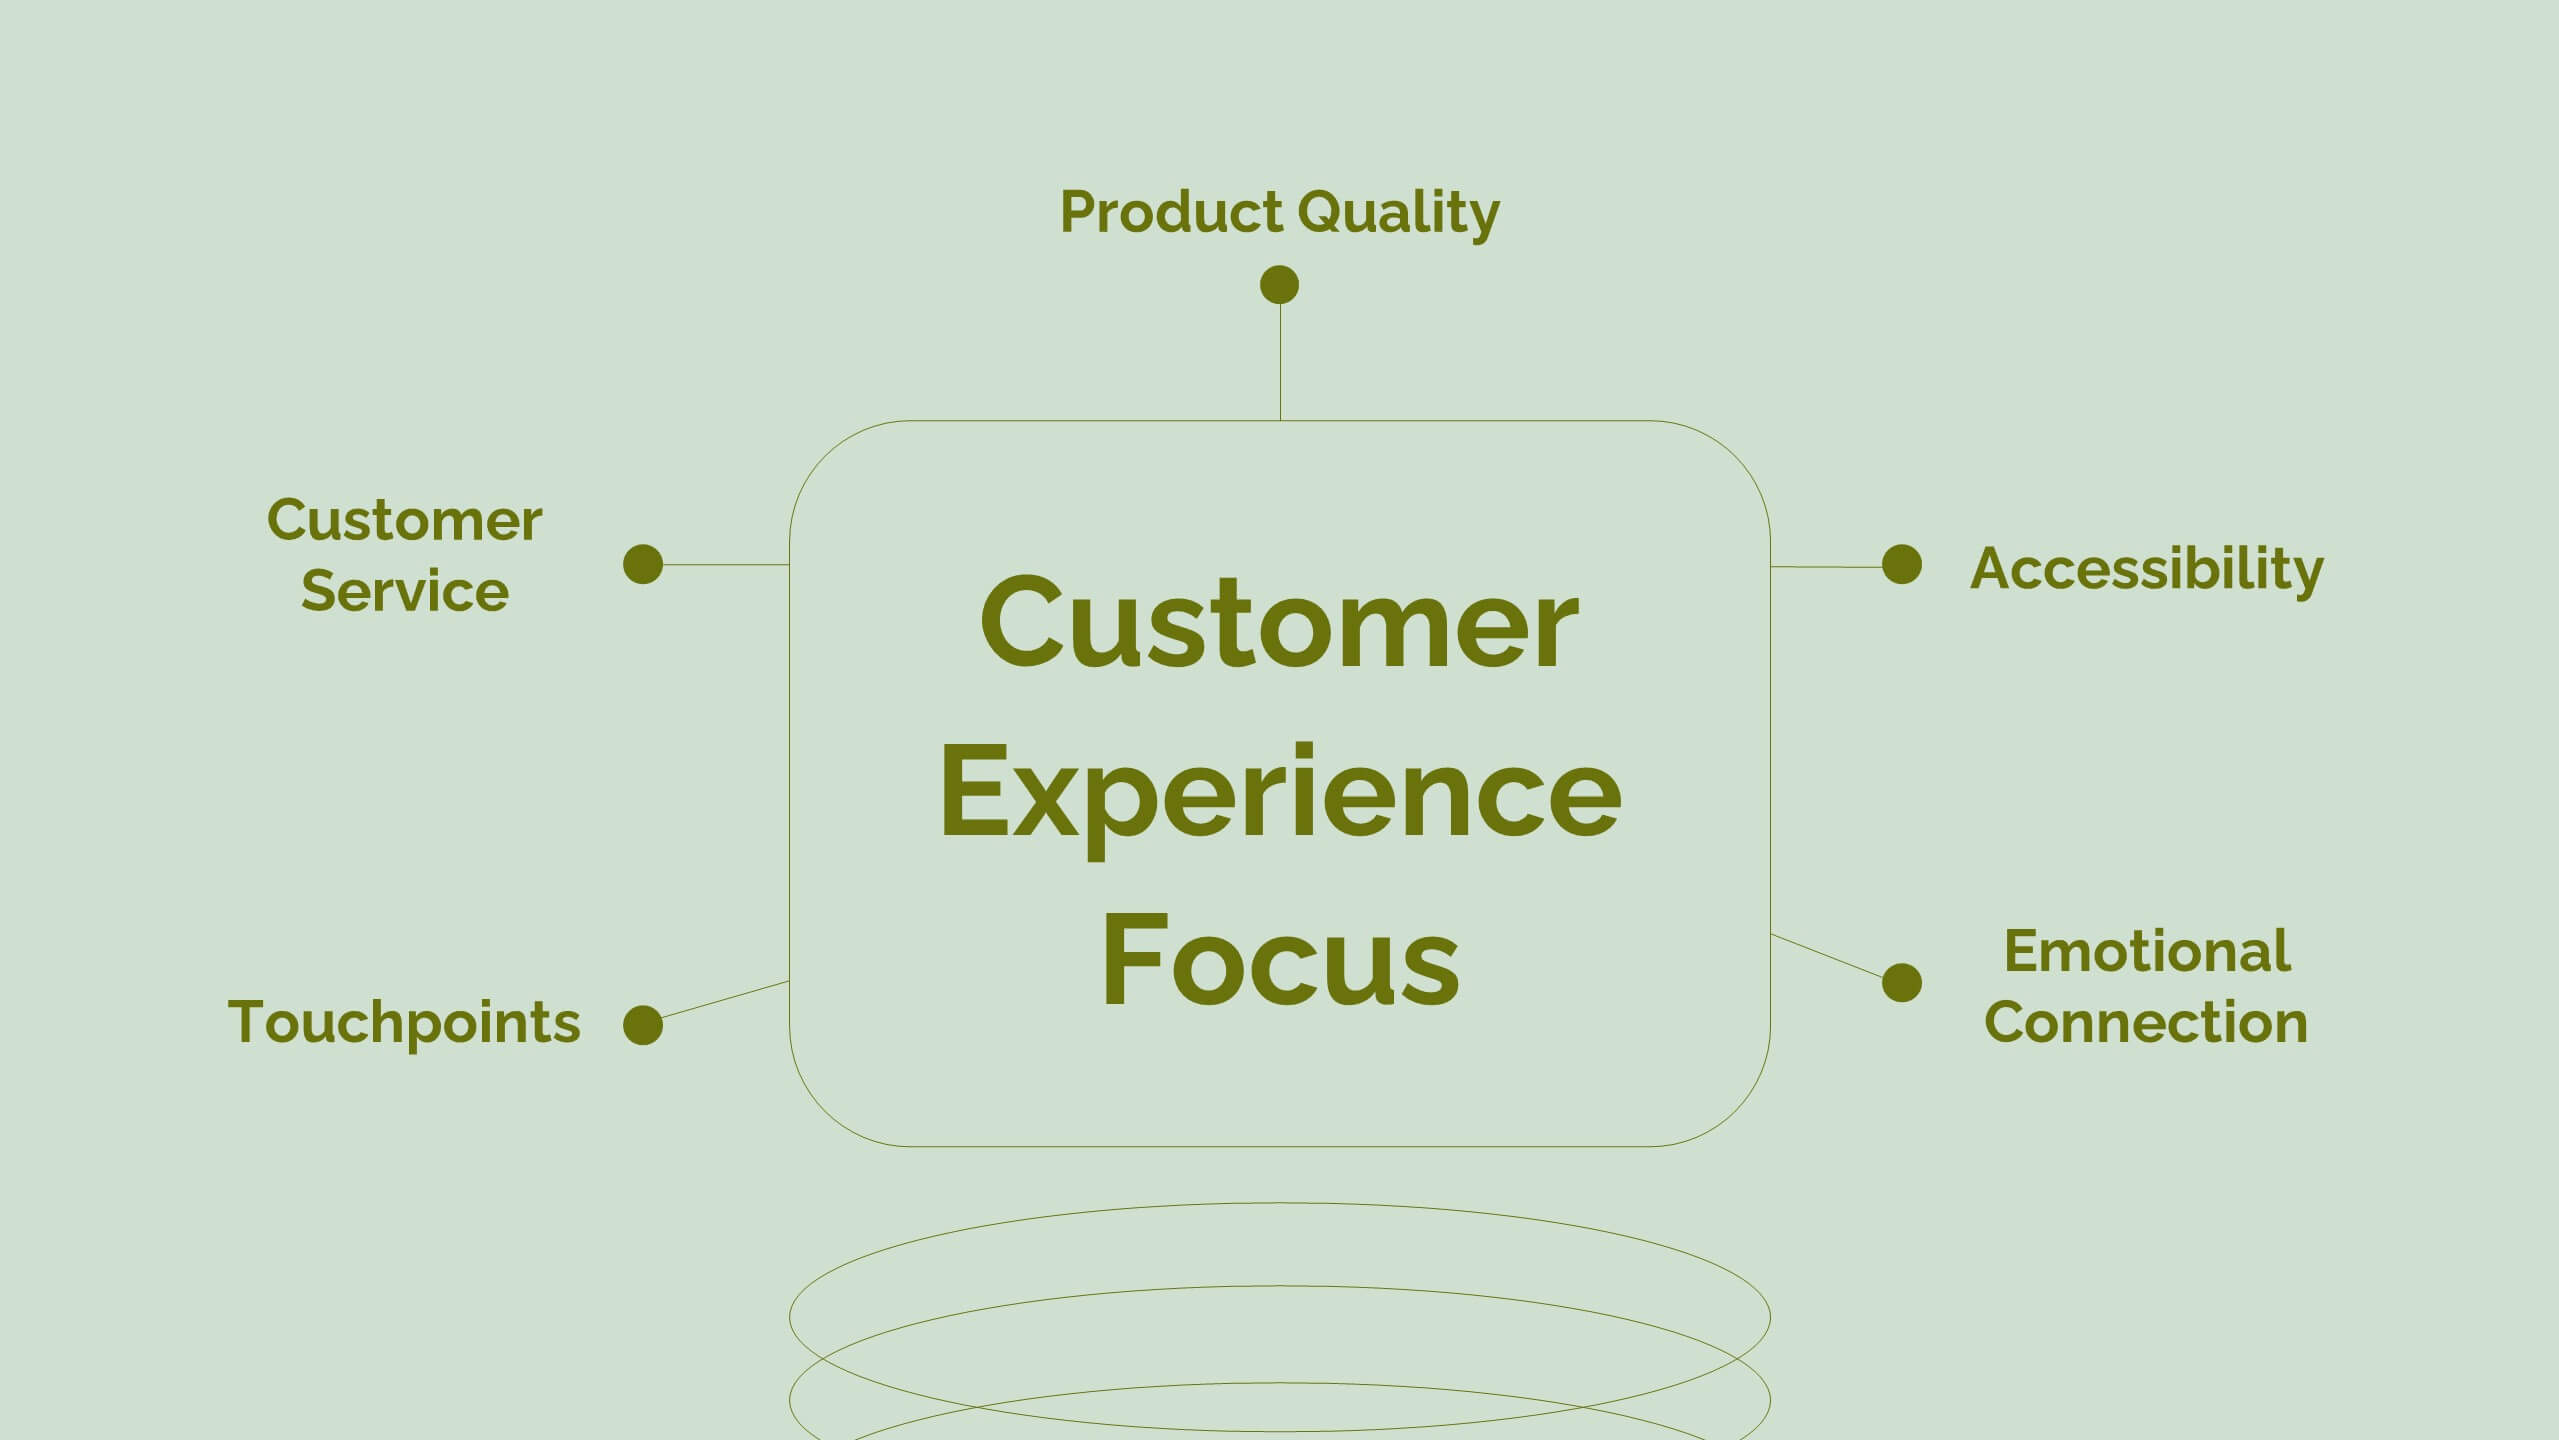
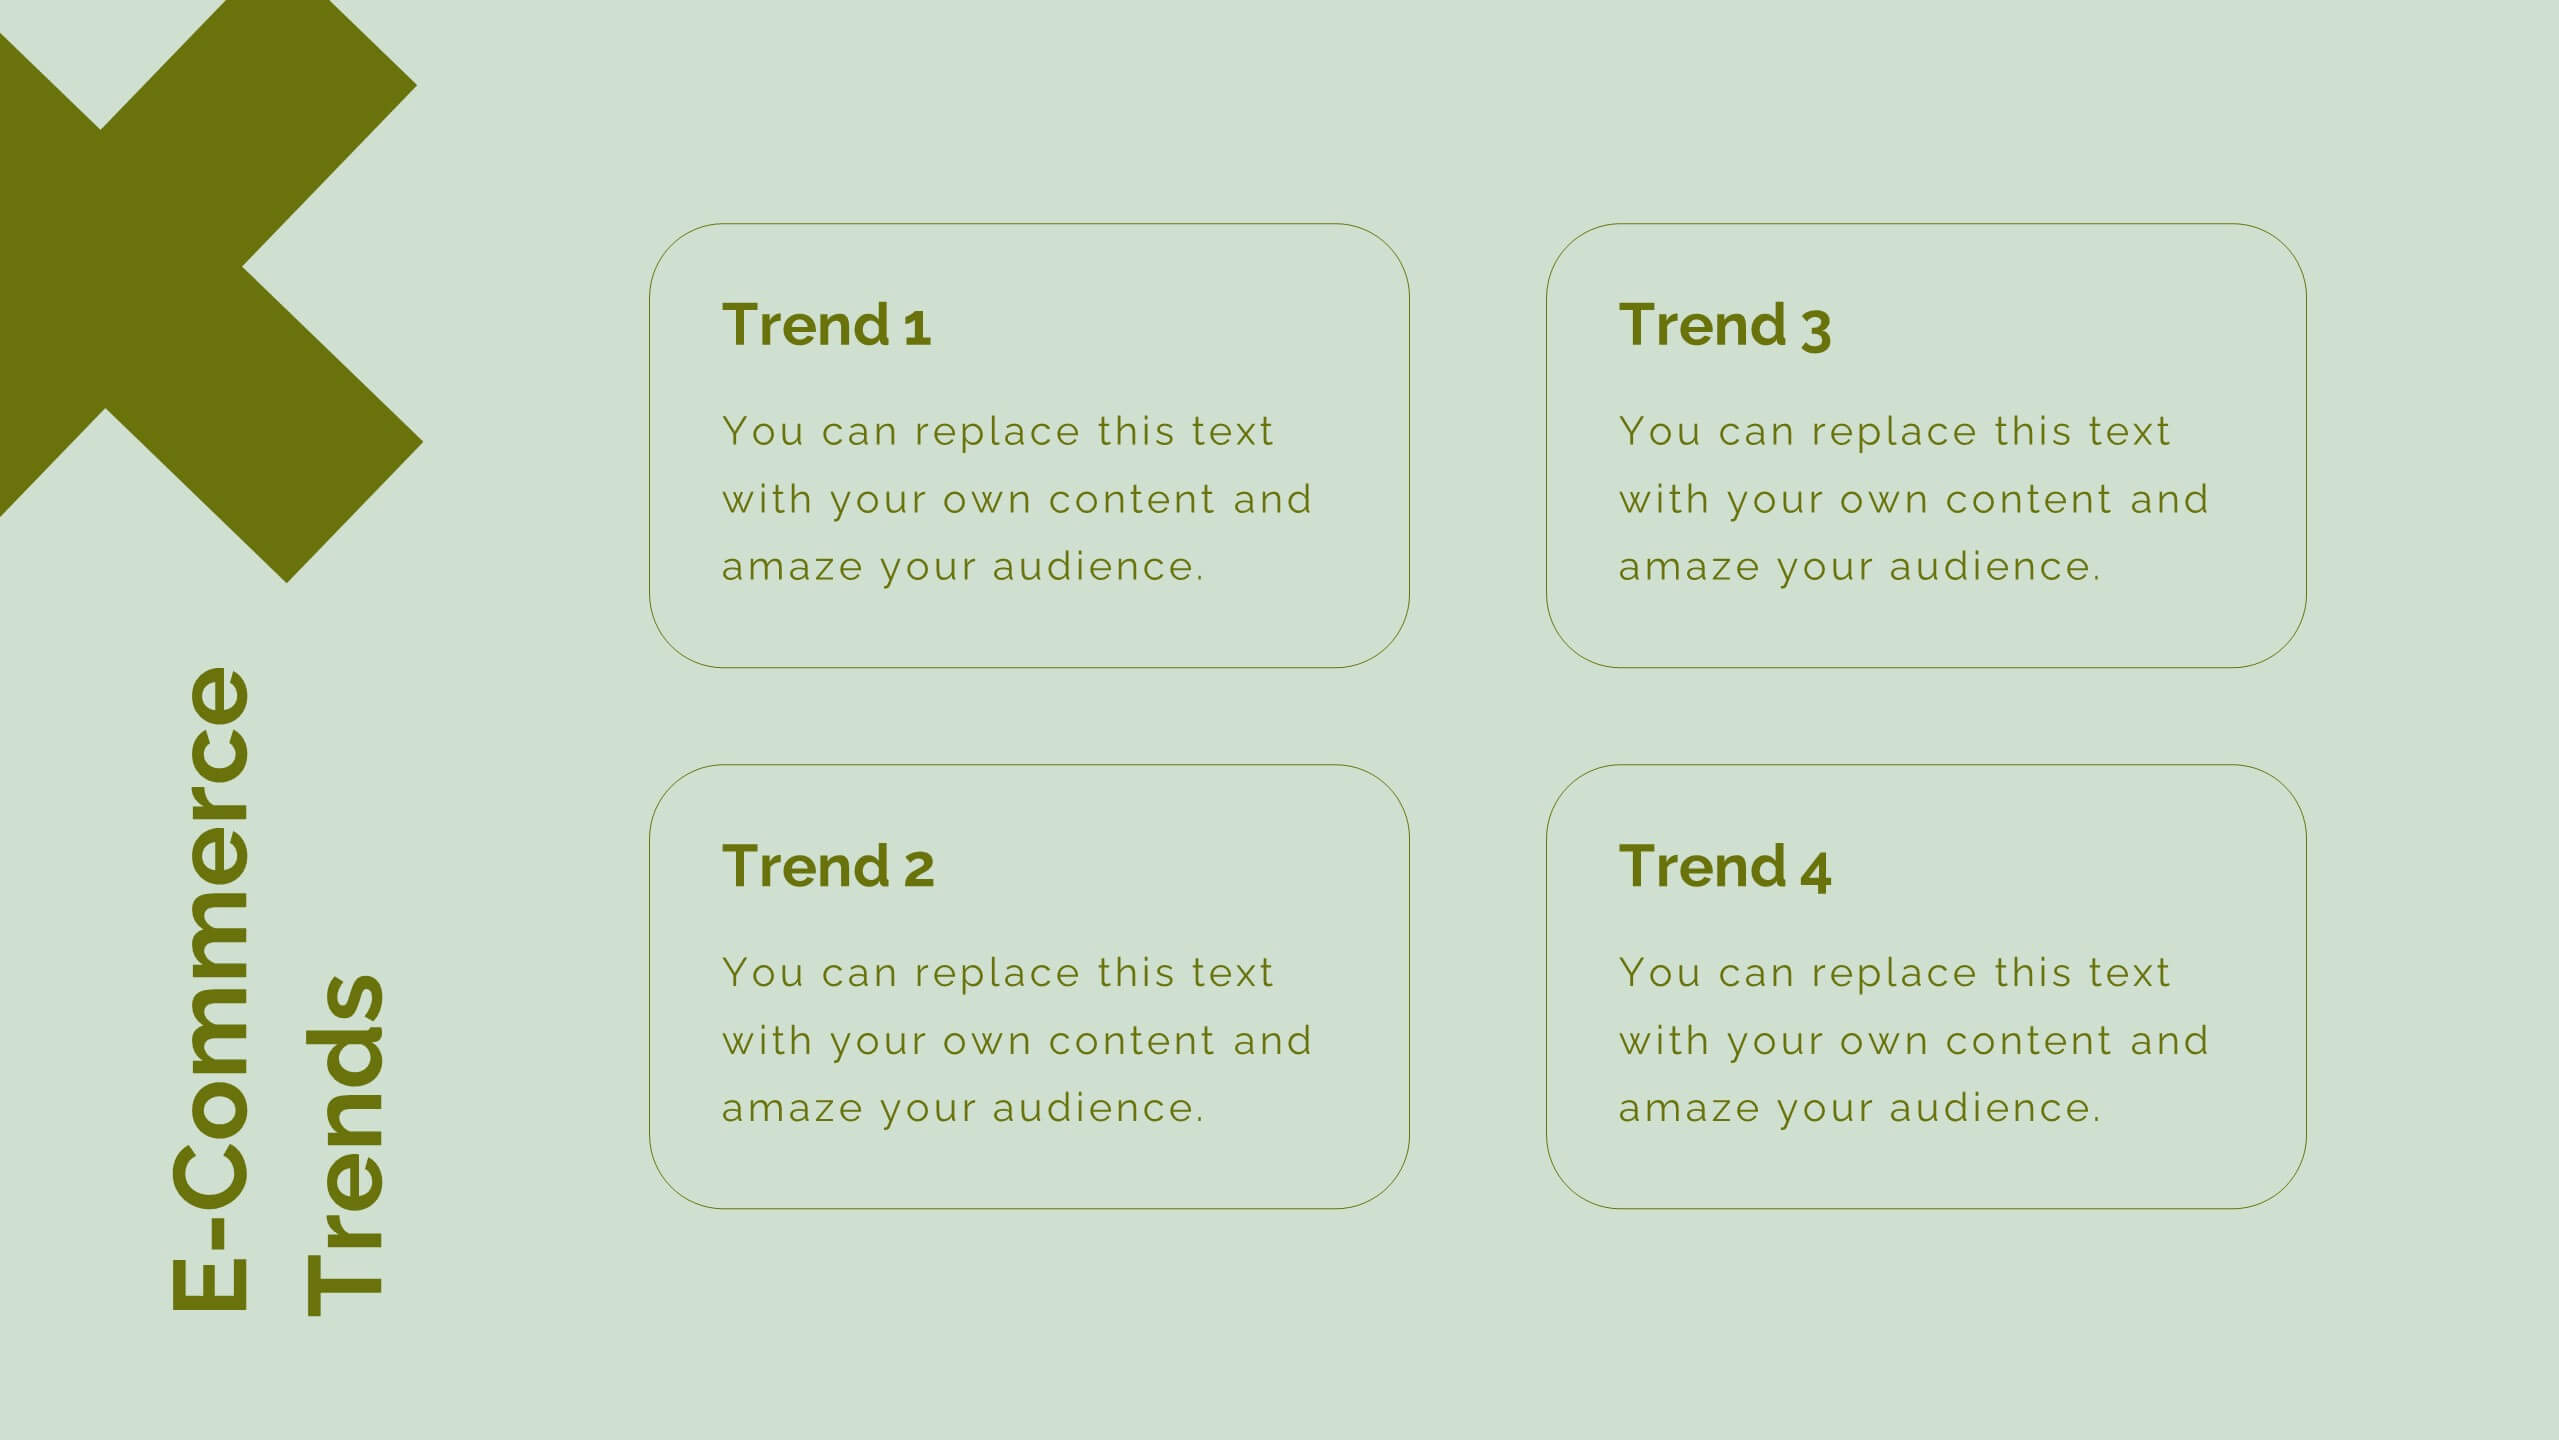
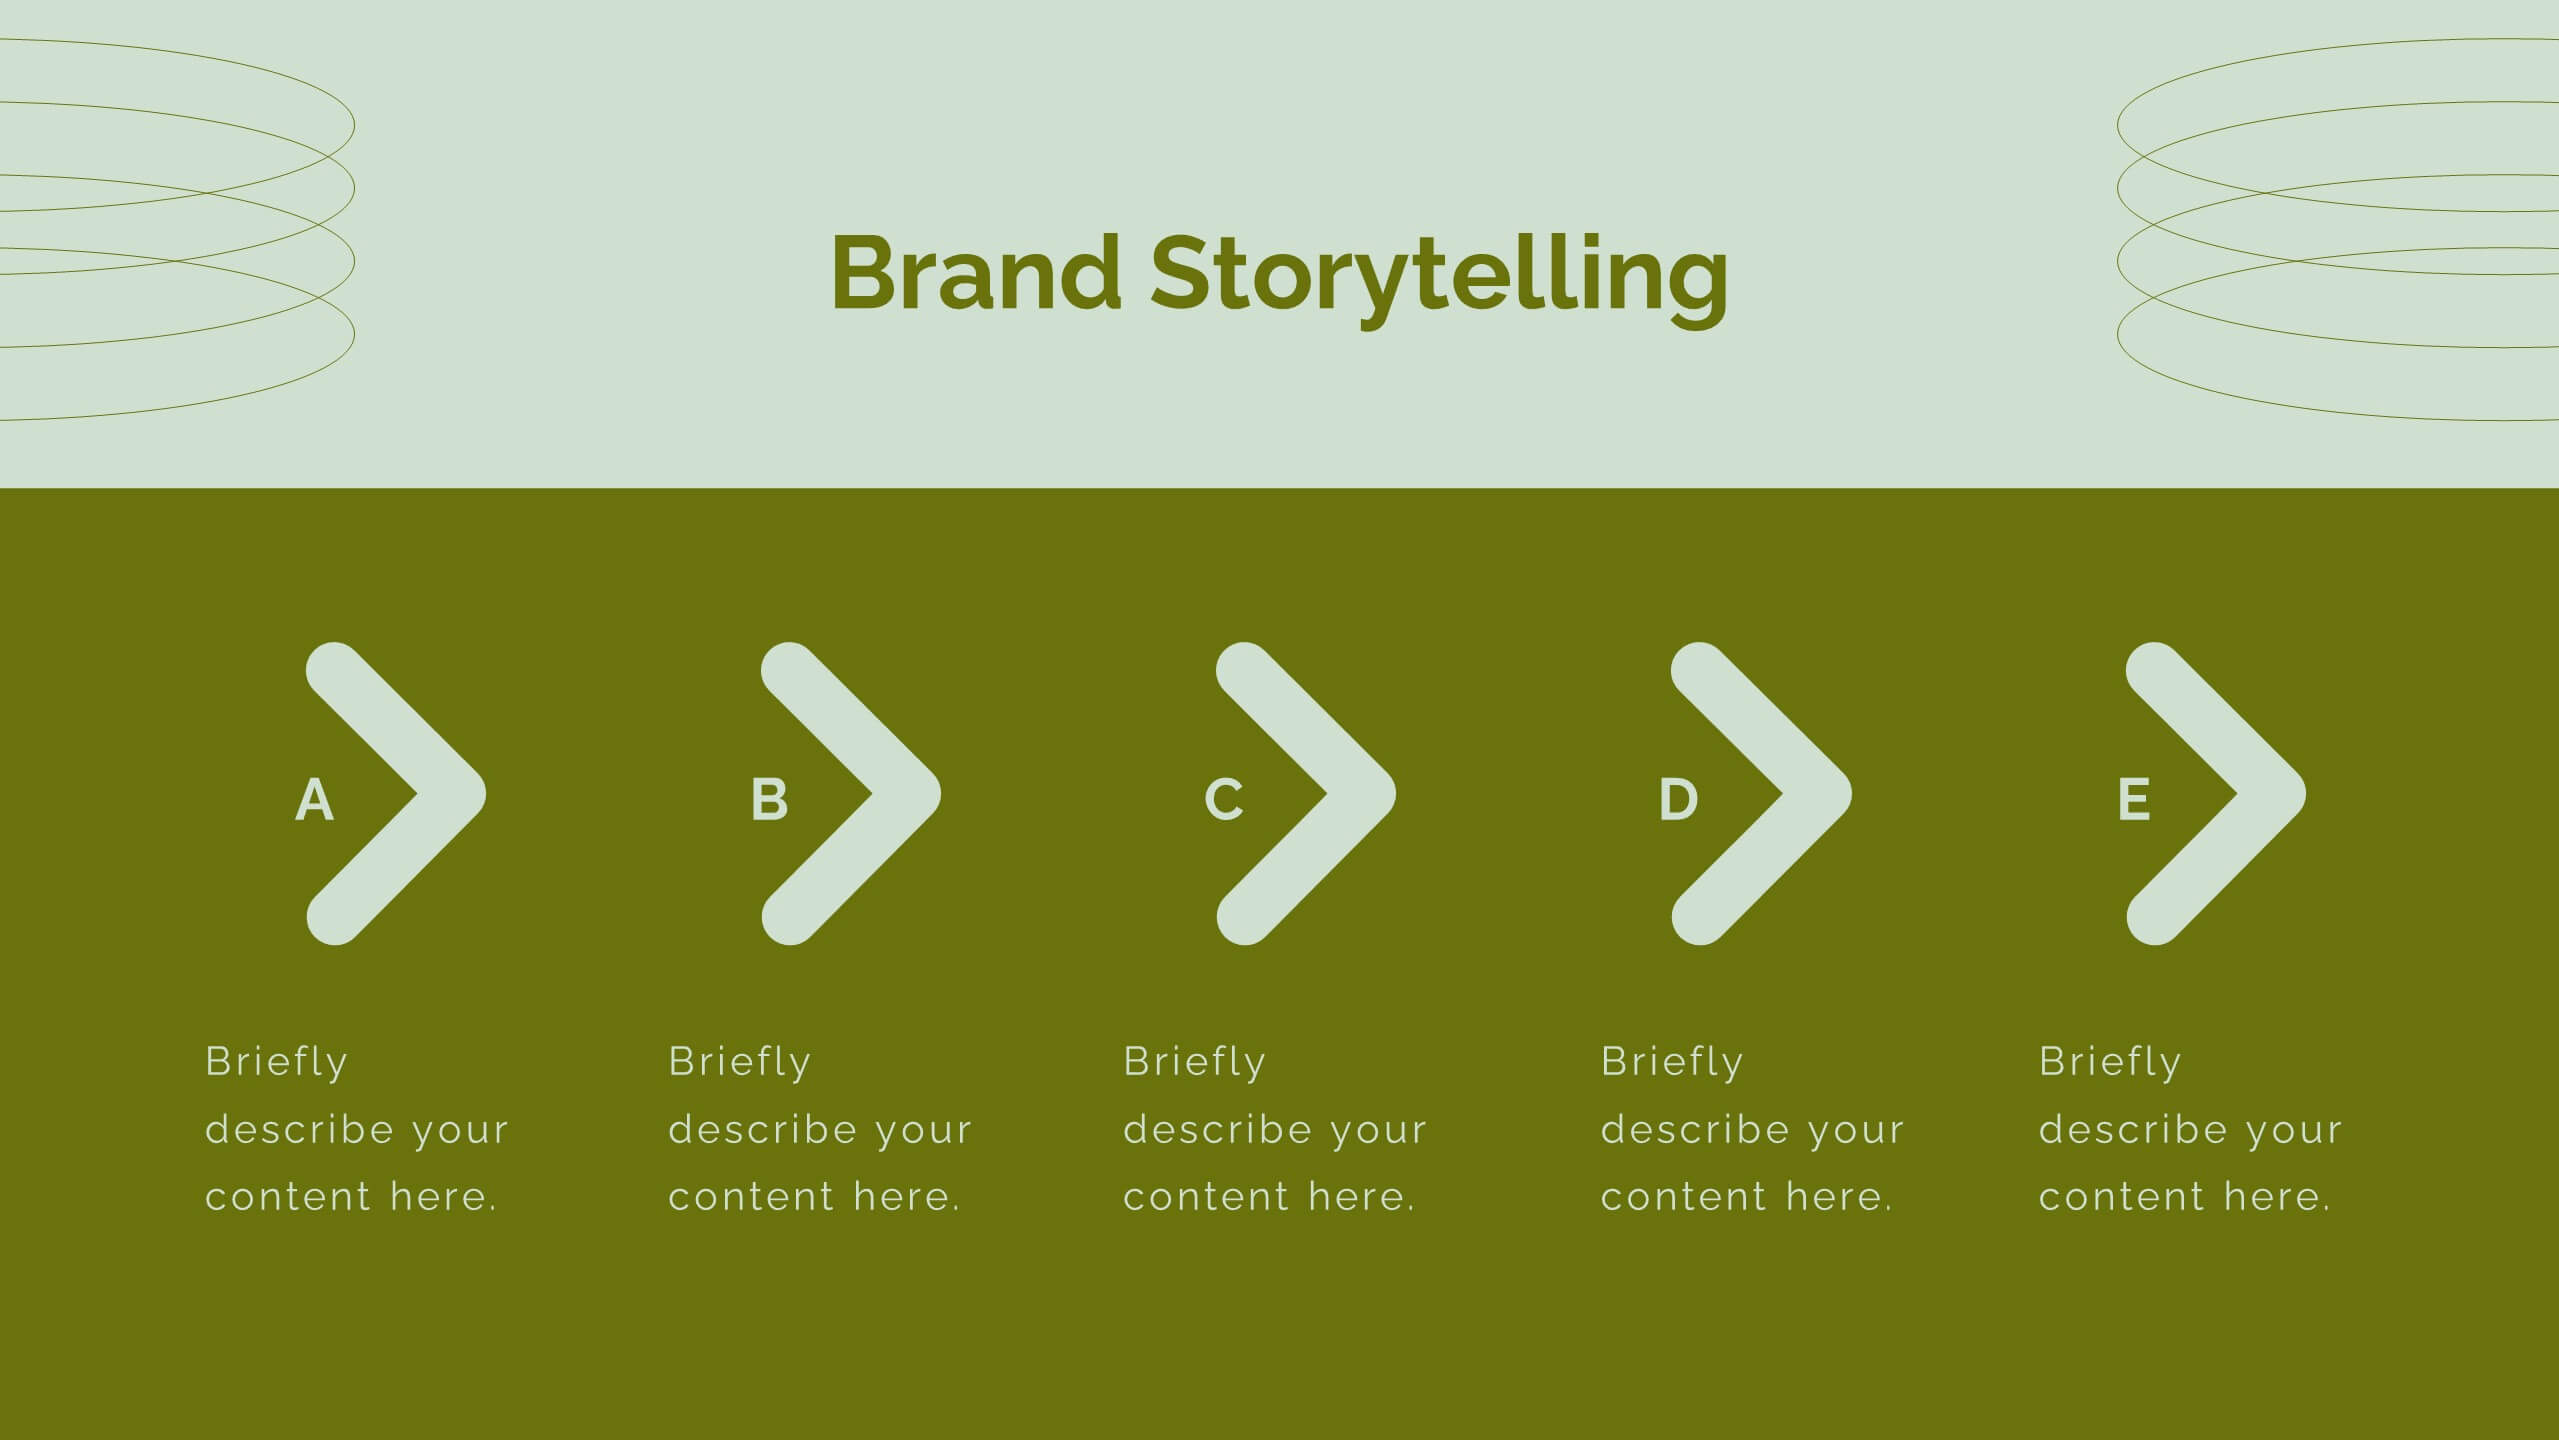
Aura Digital Marketing Strategy Plan Presentation
Revamp your digital marketing strategies with this dynamic template! Covering everything from industry overviews and consumer behavior analysis to emerging technologies and social media strategies, this template has it all. Perfect for creating compelling presentations that highlight data-driven marketing and brand storytelling. Compatible with PowerPoint, Keynote, and Google Slides.


7 diapositivas
RAPID Profit Matrix Infographic
Delve into the systematic world of decision-making with our RAPID Matrix infographic. Cloaked in the trustworthiness of blue tones and complemented by the proactive energy of green, our template elucidates the RAPID framework—Recommend, Agree, Perform, Input, Decide—in an engaging and comprehensible manner. Adorned with exact infographics, distinct icons, and tailored image placeholders, it demystifies roles and responsibilities within decision-making processes. Perfectly calibrated for Powerpoint, Keynote, or Google Slides. An invaluable tool for project managers, business leaders, or any team seeking clarity in its decision-making process. Engage, clarify, and execute with precision.