


Características


¿Tienes alguna pregunta?
Recomendar


19 diapositivas
Kinetic Sales Forecast Presentation
Forecast your sales with style using this vibrant template! Perfect for detailing company overview, sales process, team, and strategy. Includes sections for case studies, pricing, and future opportunities. Ideal for sales teams to impress stakeholders. Compatible with PowerPoint, Keynote, and Google Slides.


6 diapositivas
Europe Education Map Infographics
Explore our versatile Europe Education Map infographic template, a valuable resource for visualizing the educational landscape across the continent of Europe. This template is fully compatible with popular presentation software such as PowerPoint, Keynote, and Google Slides, allowing you to effortlessly customize it to meet your specific needs. The Europe Education Map infographic template provides a solid foundation for illustrating data related to educational institutions, literacy rates, and academic trends throughout Europe. Whether you're an educator, researcher, or interested in European education, this template offers a user-friendly platform to create informative presentations and educational materials. Impress your audience with this SEO-optimized Europe Education Map infographic template, designed for clarity and ease of use. Customize it to showcase educational opportunities, achievements, and regional insights, making it a valuable asset for your projects and presentations. Begin crafting your personalized infographic today!


4 diapositivas
Employee Training Needs Skills Gap
Train to close the gap. This Employee Training Needs Skills Gap slide makes it easy to visualize where employees are now, where they need to be, and the learning journey in between. TFully customizable for PowerPoint, Keynote, and Google Slides.


26 diapositivas
Hypnosia Brand Guidelines Proposal Presentation
This Brand Guidelines Proposal Template provides a sleek, professional layout to showcase key branding elements like vision, values, identity, and strategy. Perfect for businesses and agencies, it ensures brand consistency. Fully customizable and compatible with PowerPoint, Keynote, and Google Slides for seamless adaptation to your brand’s style.


26 diapositivas
Spellis Rebranding Project Plan Presentation
Revamp your brand’s identity with this sleek and strategic presentation template. Covering key aspects such as brand values, audience personas, strategy, positioning, and future development, this template ensures a comprehensive rebranding approach. Fully customizable and compatible with PowerPoint, Keynote, and Google Slides for seamless use.


8 diapositivas
Digital Payment and Credit Solutions Deck Presentation
Present your financial strategies with clarity using this Digital Payment and Credit Solutions Deck Presentation. Designed to highlight key service features and fintech insights, this layout visually compares digital cards, credit options, or payment tiers. Perfect for banks, startups, and financial analysts. Fully editable in PowerPoint, Keynote, and Google Slides.


7 diapositivas
Circle Target Infographic
The Circle Infographic is designed to increase the visual appeal and engagement of your content. This circle Infographics template is an awesome way to show off your data. This is a fun, colorful and energetic template that can be used for many different purposes such as business, marketing, sales and much more. This is perfect for any company that wants to show their scope, growth, and reach in a clear and concise way. The template is easy to use and customizable, so you can create your own unique infographic that shows off your brand's strengths. Easily change the colors and style to match your brand.


6 diapositivas
Corporate Health Metrics Dashboard Presentation
Take the pulse of your workplace with this dynamic health dashboard presentation layout. Designed to visualize employee wellness data, activity levels, and corporate health KPIs, this template blends clarity and creativity for impactful reporting. Easily customizable and fully compatible with PowerPoint, Keynote, and Google Slides to fit your presentation needs.


8 diapositivas
Winning Strategies for Professional Success Presentation
Showcase your top performers, strategic milestones, or ranked insights with this podium-style template. Featuring vibrant visuals and structured layout, it’s ideal for performance reviews, leadership presentations, and competitive analysis. Fully editable in PowerPoint, Keynote, and Google Slides—perfect for professional success stories, rankings, and progress highlights.


12 diapositivas
Social and Professional Networking Presentation
Build Strong Connections with this Social and Professional Networking template. Featuring a dynamic network diagram, this slide helps visualize connections, relationships, and networking strategies in a clean, professional format. Ideal for business professionals, marketers, and career coaches, this fully editable template is compatible with PowerPoint, Keynote, and Google Slides for seamless customization.


6 diapositivas
Spider Diagram for Concept Mapping
Map complex relationships with ease using the Spider Diagram for Concept Mapping Presentation. This slide features a central radial chart connected to six surrounding nodes—each paired with editable titles, icons, and detailed text sections. Perfect for visualizing project scopes, idea clustering, strategic alignment, or team functions. Customize colors, icons, and text directly in PowerPoint, Keynote, or Google Slides. The clean, professional layout ensures clear communication across all types of presentations.


22 diapositivas
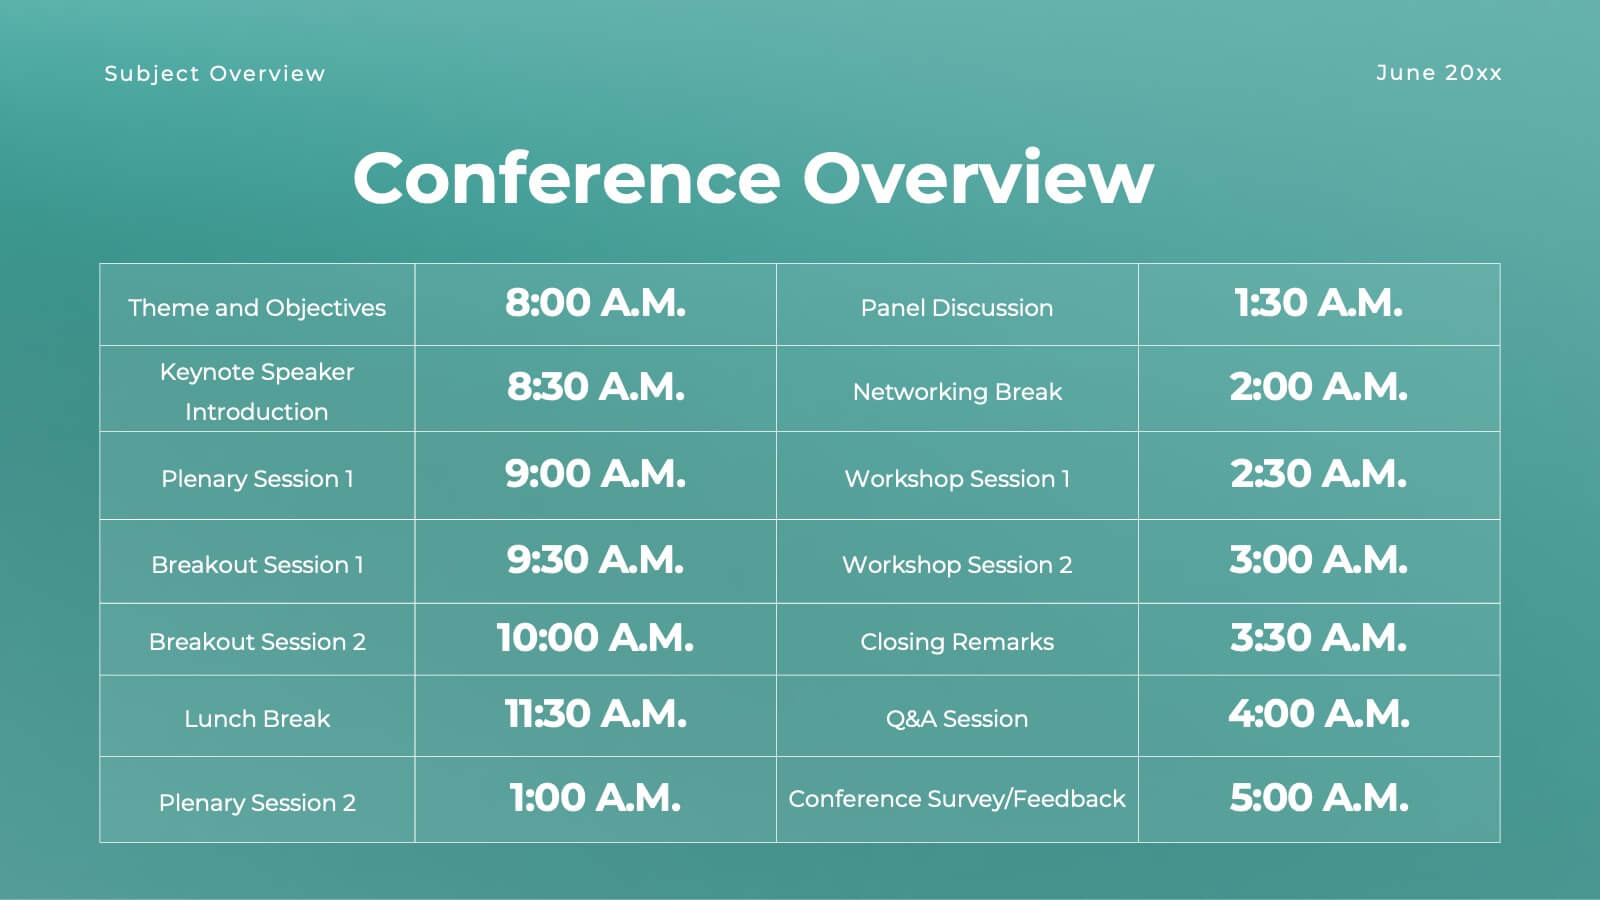
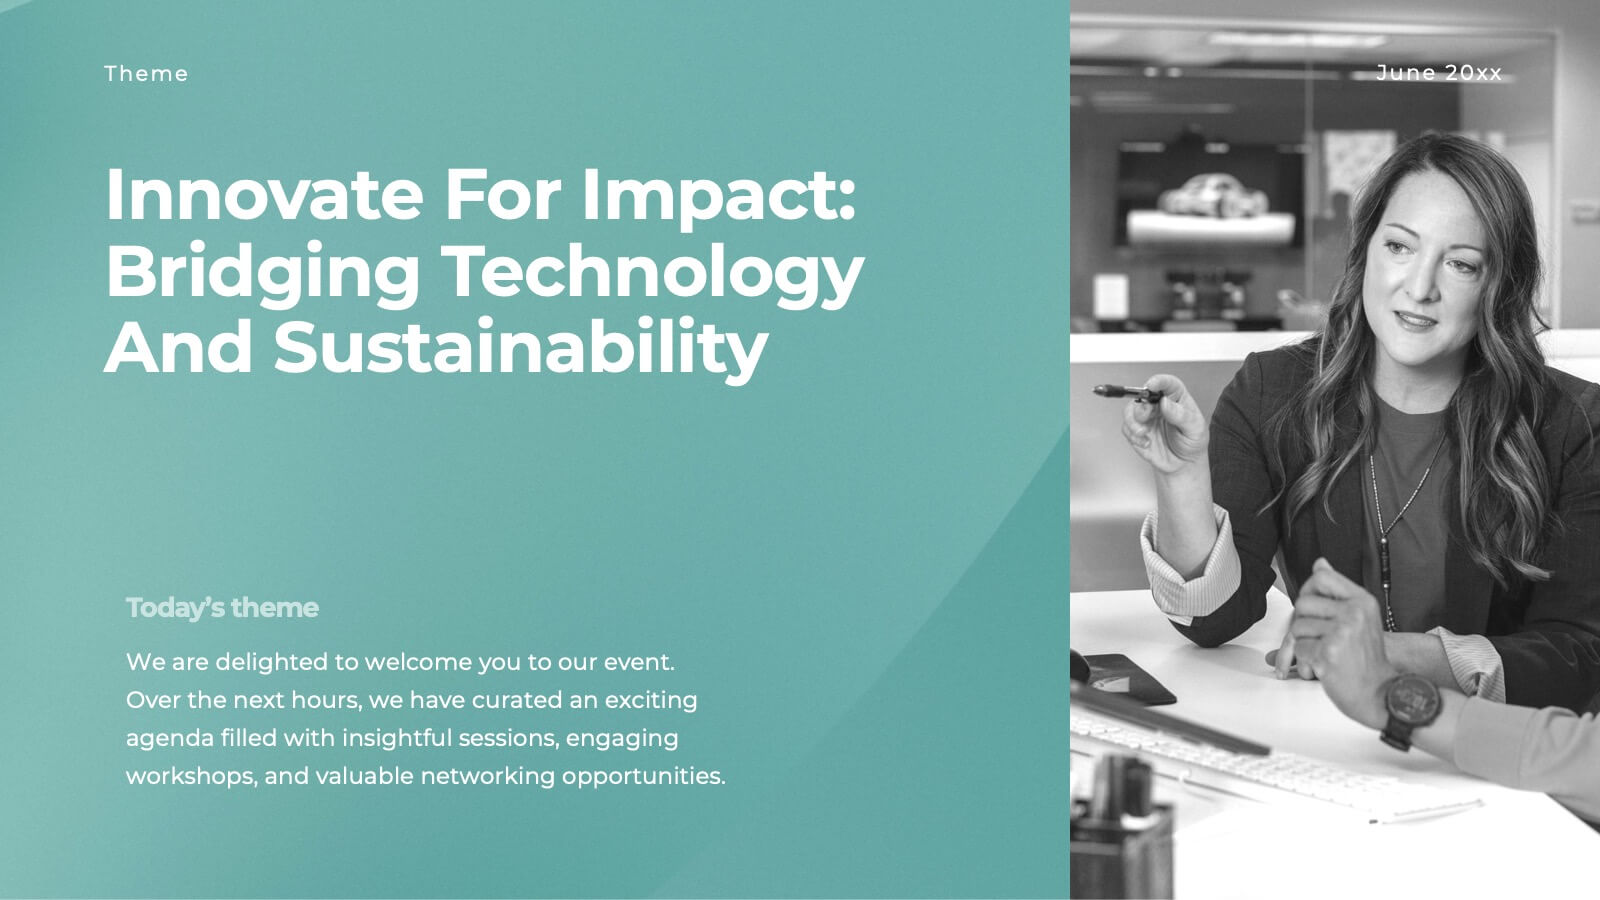
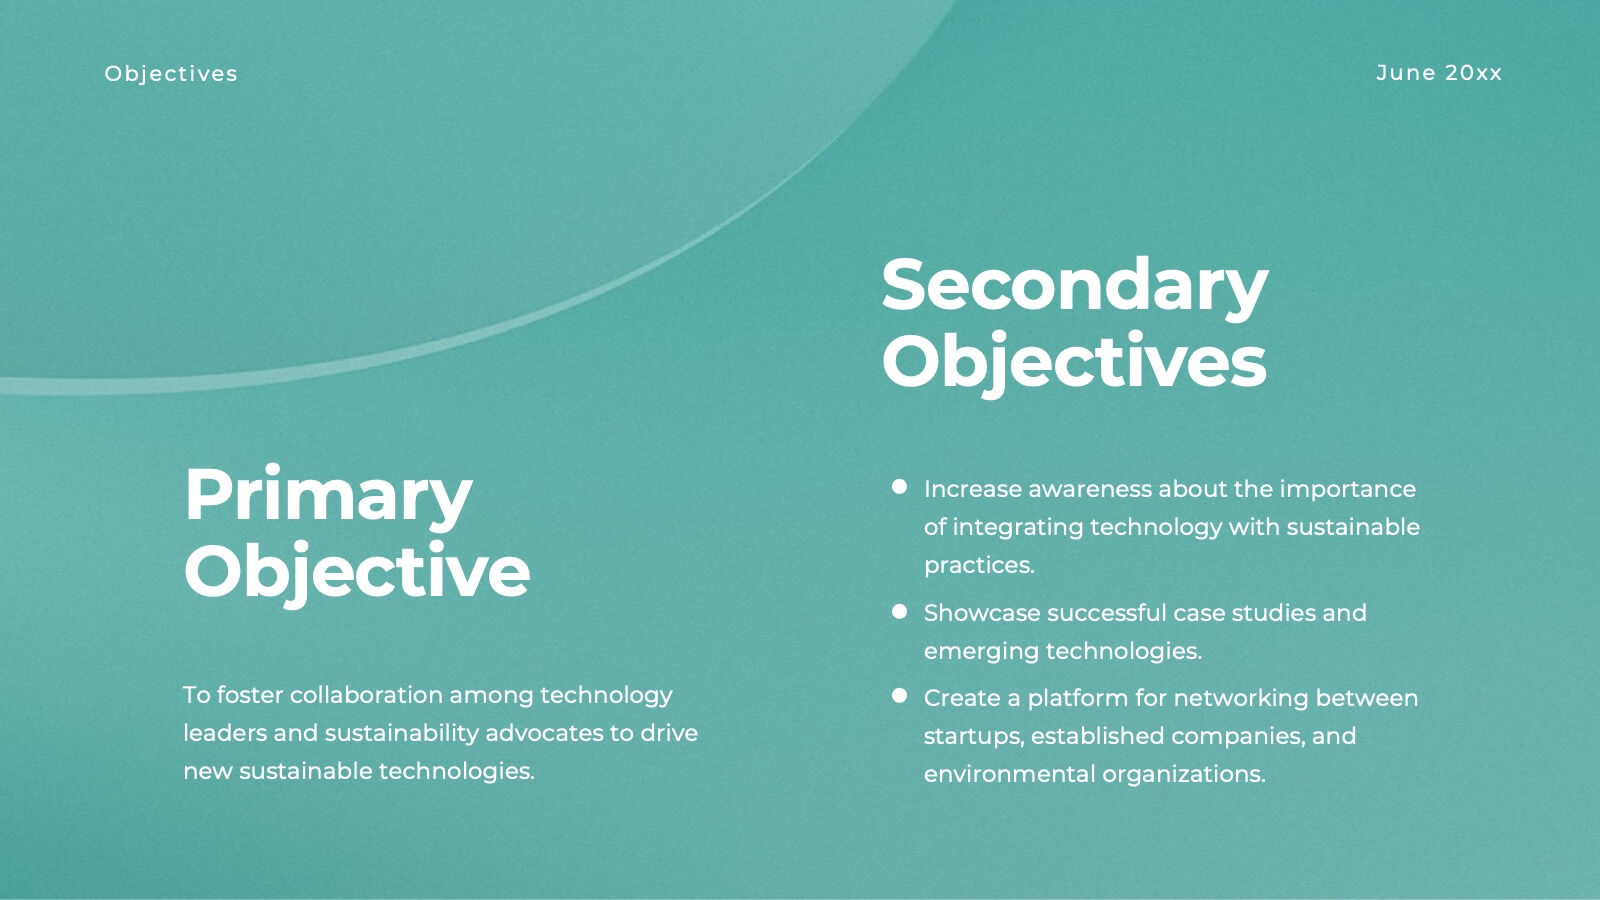
Halo Small Business Pitch Deck Presentation
Streamline your business presentations with this versatile pitch deck template! Ideal for conferences and meetings, it includes slides for objectives, session details, keynote speakers, and panel discussions. Keep your audience engaged with professional design and clear, structured content. Compatible with PowerPoint, Keynote, and Google Slides for seamless presentations on any platform.


20 diapositivas
Axisflare Artist Portfolio Presentation
Showcase your creative journey with this vibrant artist portfolio template, featuring sections for project highlights, philosophy, style, and client testimonials. Ideal for presenting your work and artistic approach, this template is compatible with PowerPoint, Keynote, and Google Slides for seamless presentation across various platforms.


3 diapositivas
Break Even Financial Model Presentation
Bring your financial story to life with this sleek and professional presentation design. Ideal for illustrating profit margins, cost recovery, or growth potential, it helps visualize when investments start to pay off. Fully customizable and compatible with PowerPoint, Keynote, and Google Slides for effortless editing and impactful presentations.


8 diapositivas
RACI Matrix Role Assignment Presentation
The "RACI Matrix Role Assignment" presentation template is designed to clarify role responsibilities in project management contexts. Each slide presents a clear visual breakdown of who is responsible, accountable, consulted, and informed (RACI) for each task within a project. This approach helps in preventing overlap and ensuring all team members are clear about their roles and responsibilities, promoting more effective communication and project management.


6 diapositivas
Product Life Cycle Stages Infographic
The product life cycle is a concept that describes the various stages that a product goes through from its introduction to its eventual decline in the market. This infographic visually represents the different stages a product goes through from its introduction to its eventual decline in the market. The product stages included in this template help businesses understand and manage the different phases of a product's existence and make informed decisions about marketing, production, and strategy. This template is fully customizable and compatible with Powerpoint, Keynote, and Google Slides.


6 diapositivas
Key Business Milestones Presentation
Showcase your company’s journey with this dynamic and professional presentation design. Perfect for highlighting achievements, key phases, and growth stages, it helps you visualize progress with clarity and impact. Fully editable and compatible with PowerPoint, Keynote, and Google Slides, making milestone storytelling simple and visually compelling.