


Características


¿Tienes alguna pregunta?
Recomendar


7 diapositivas
Home Buyer Checklist Infographic
Step into your dream home with confidence using our Home Buyer Checklist Infographic Template. This visually engaging guide is meticulously designed to streamline the home-buying process, making it transparent and manageable for first-time buyers and seasoned investors alike. This template provides a comprehensive checklist that covers every important aspect of home buying, from budgeting and financing to inspecting and closing. Its intuitive layout and vibrant design elements make complex tasks approachable and easy to understand, ensuring you don’t miss a beat on your journey to homeownership. Tailor each slide to your specific needs by customizing colors, text, and graphics to reflect your personal style or brand identity. Ideal for real estate agents, mortgage advisors, and educational workshops, this template empowers users to navigate the maze of real estate transactions with ease and assurance.
20 diapositivas
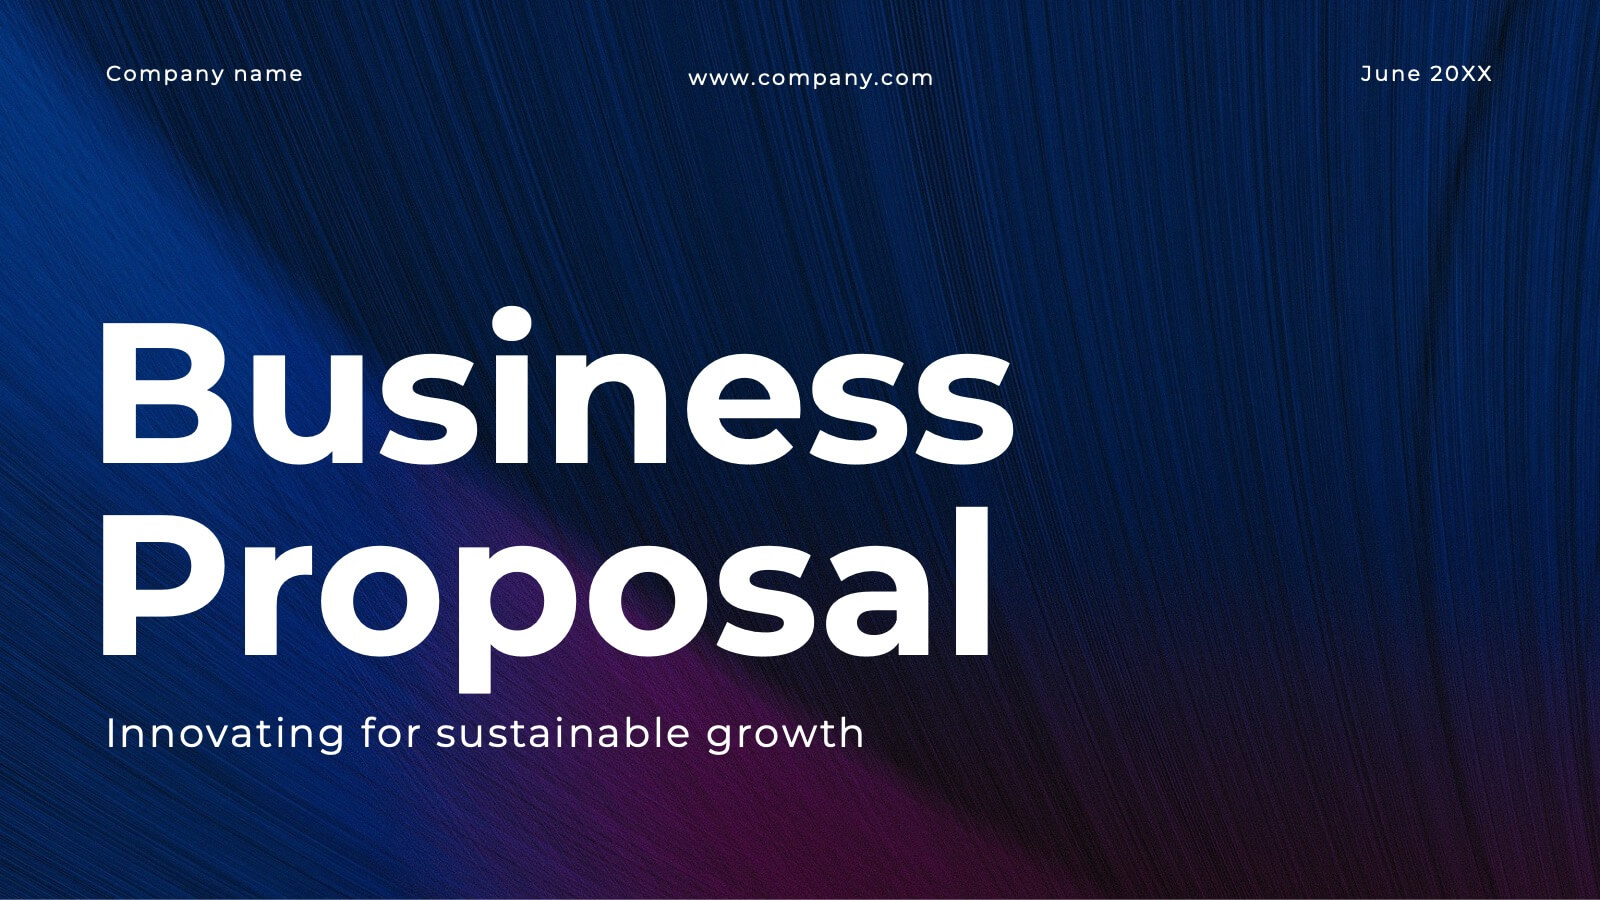
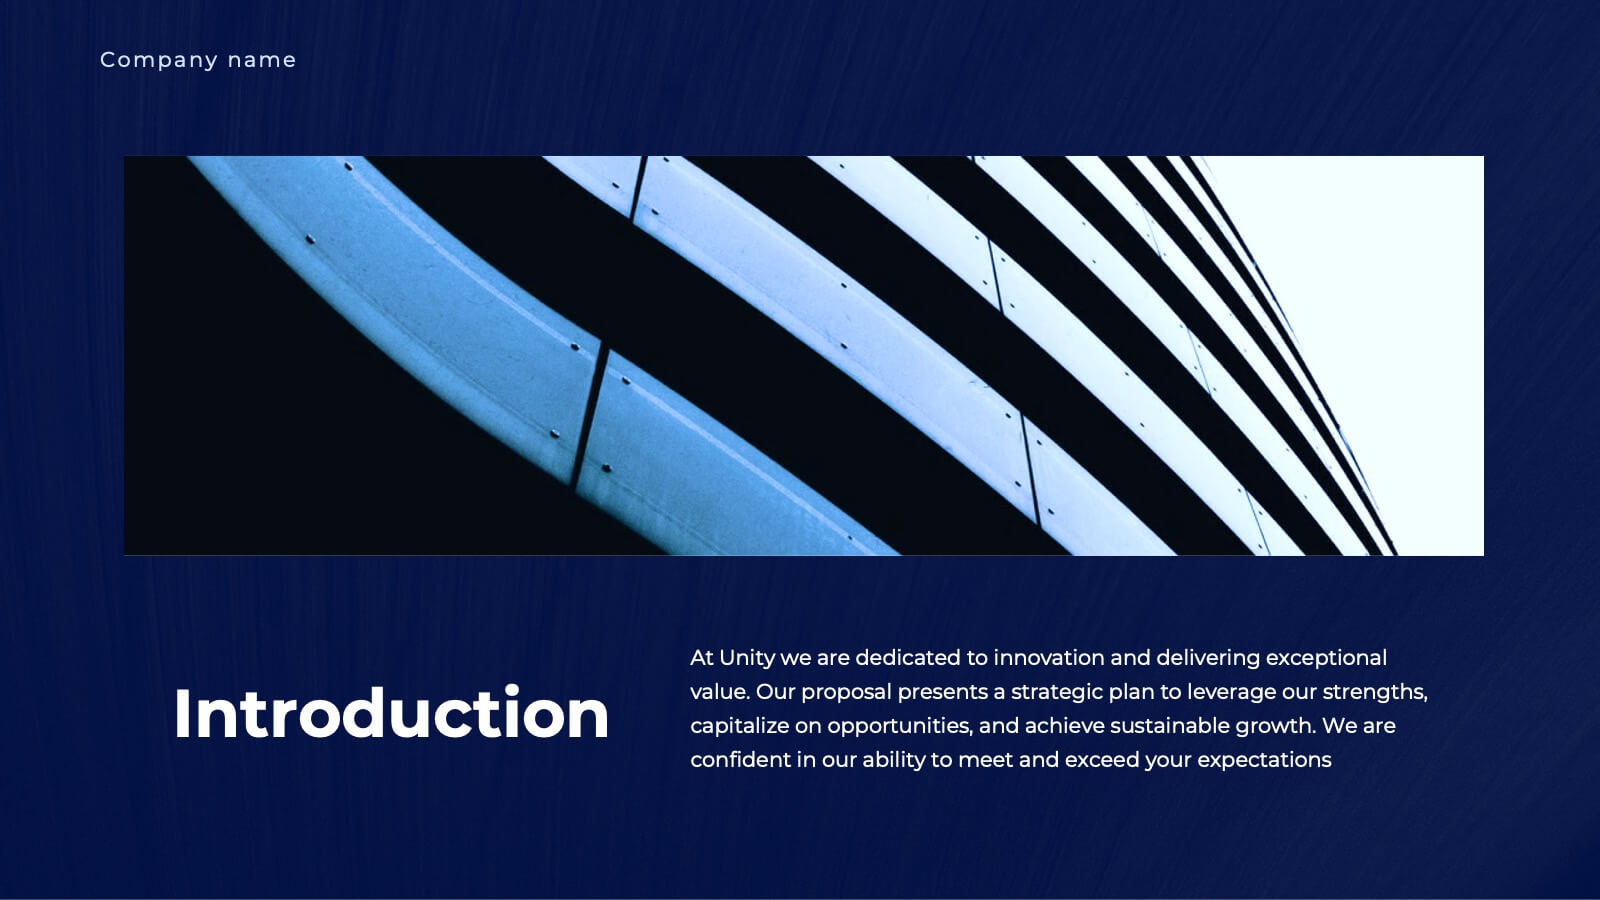
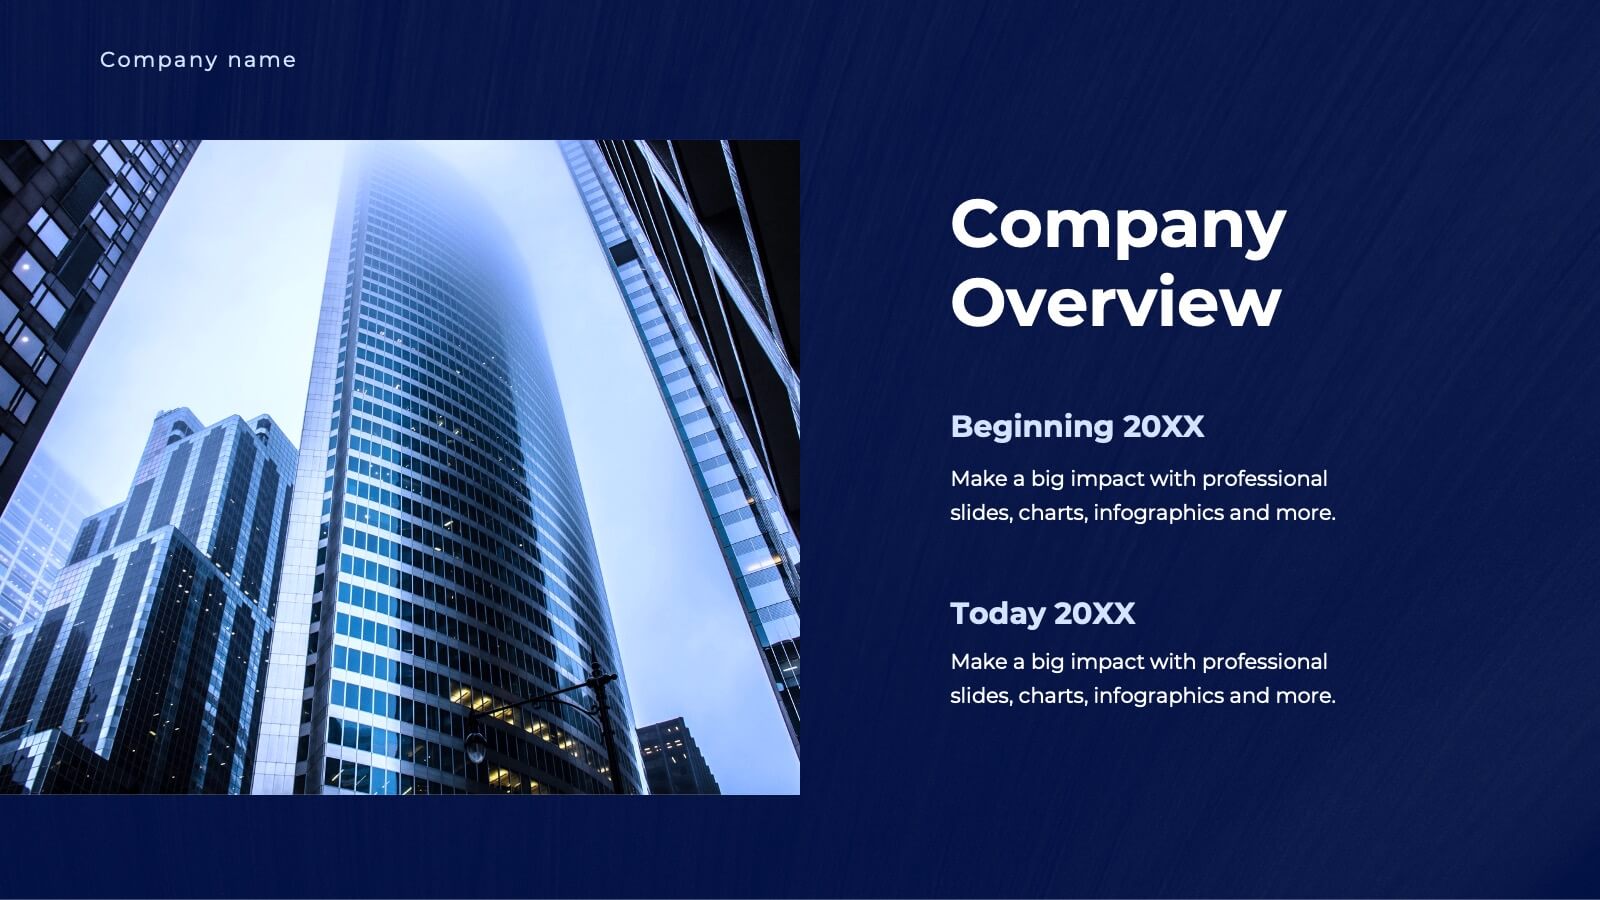
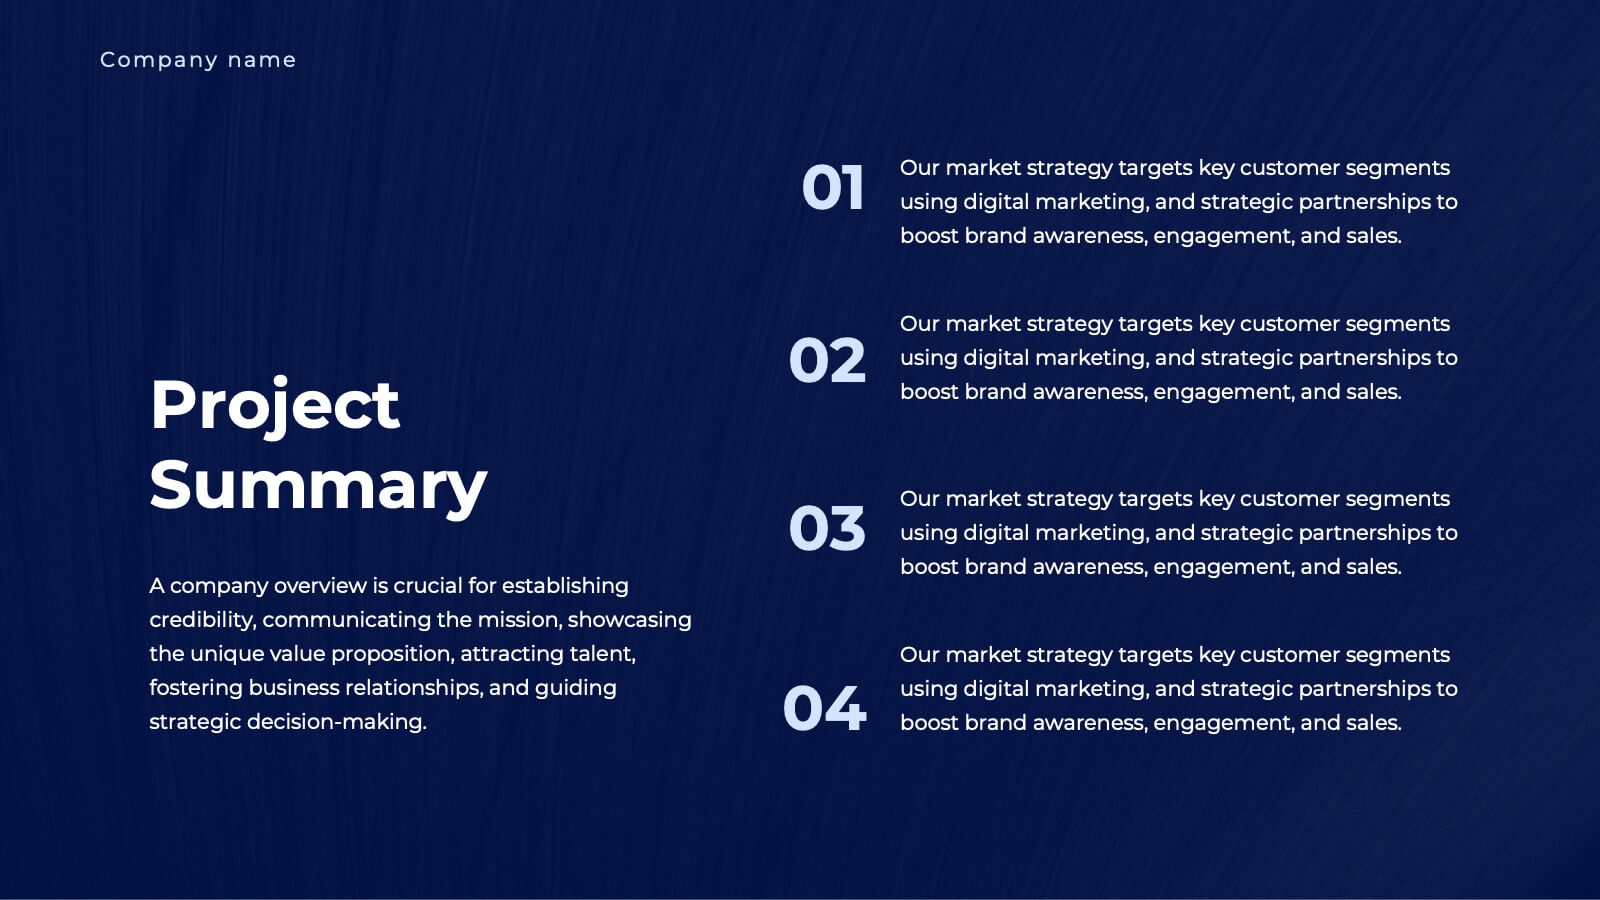
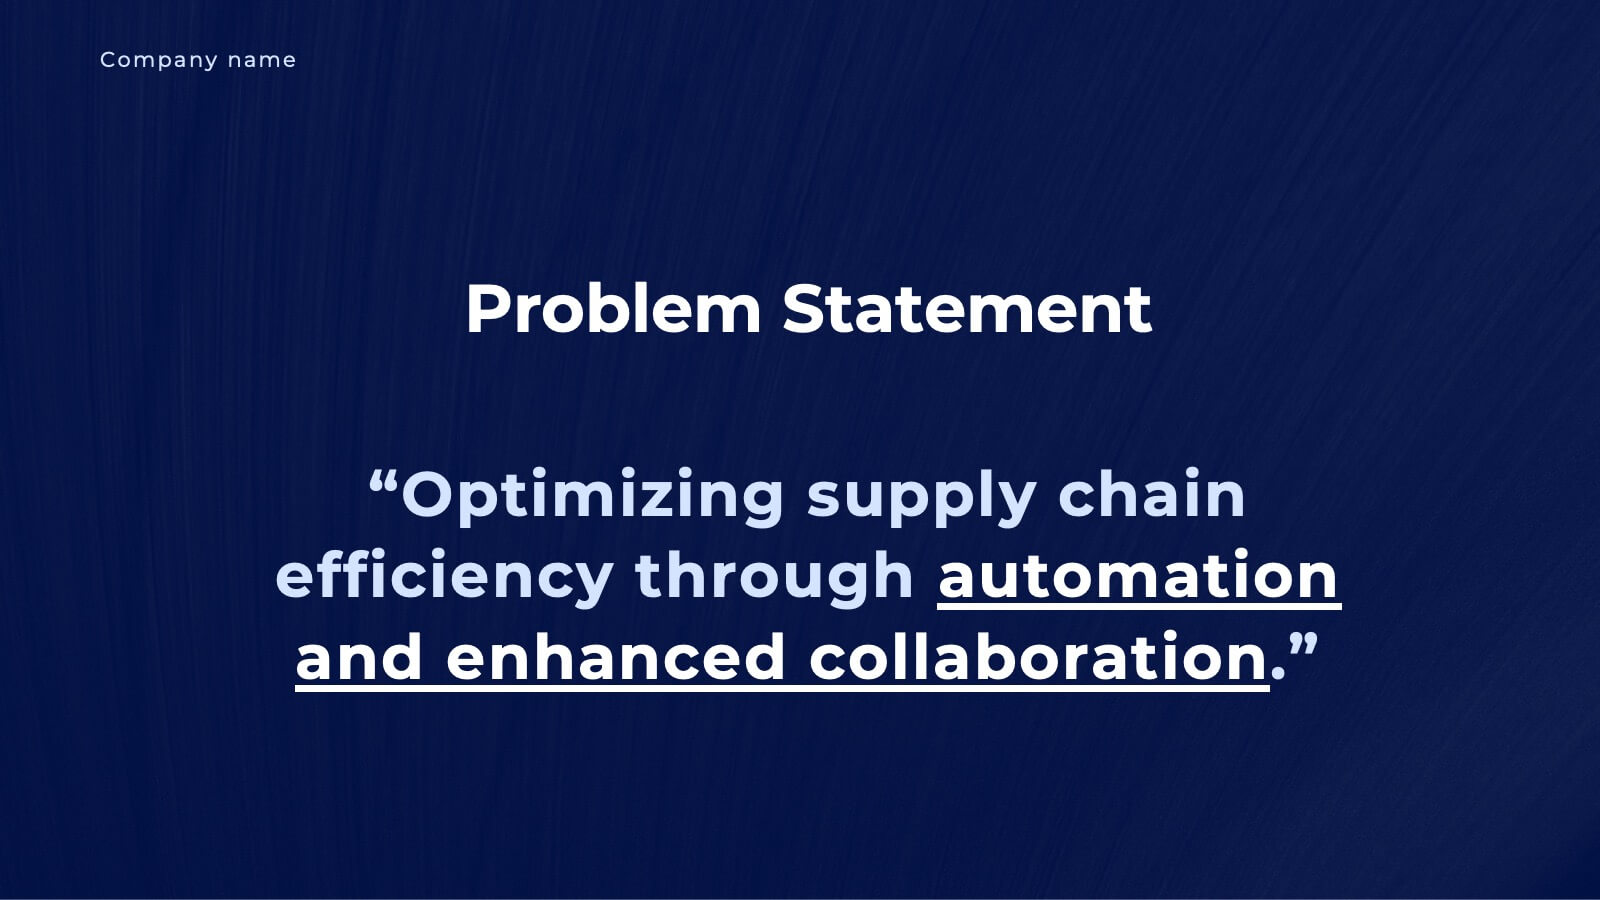
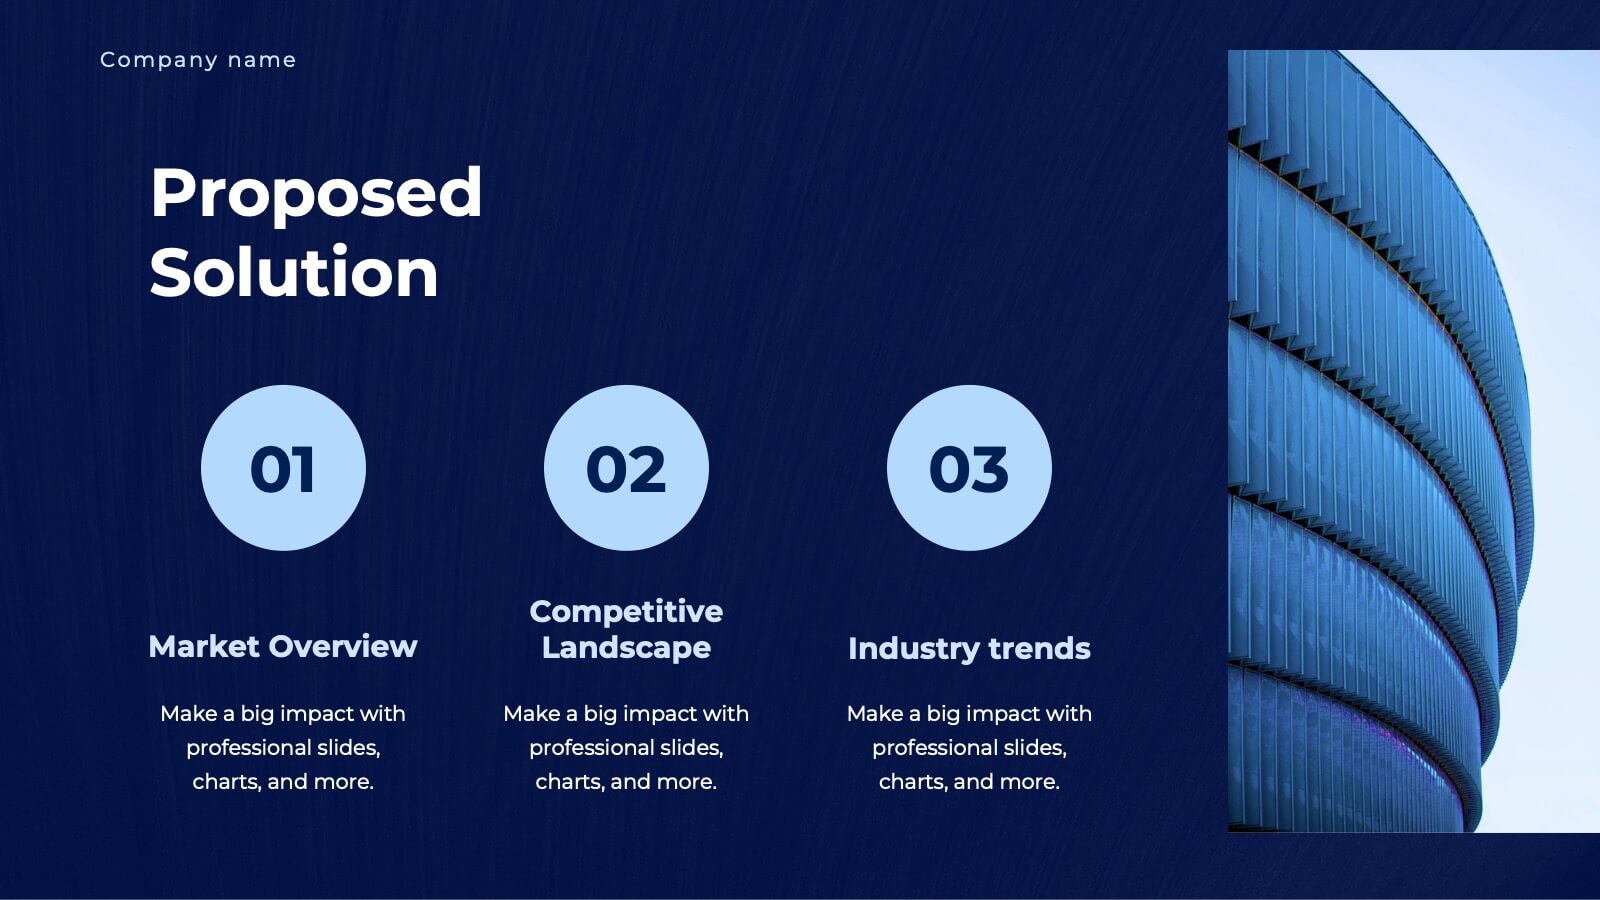
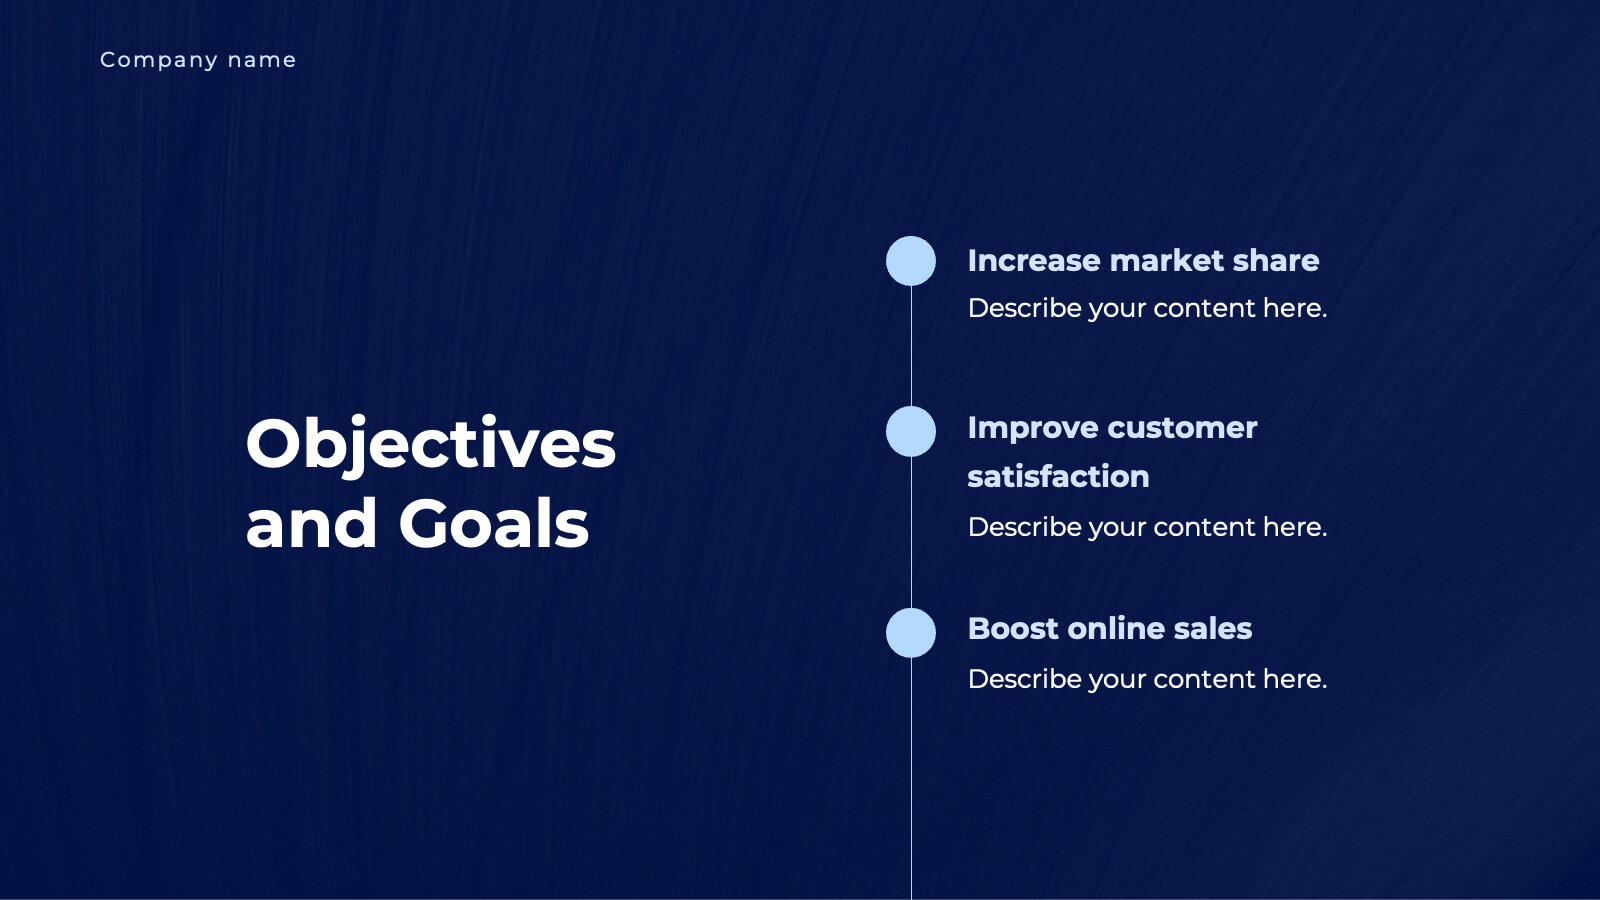
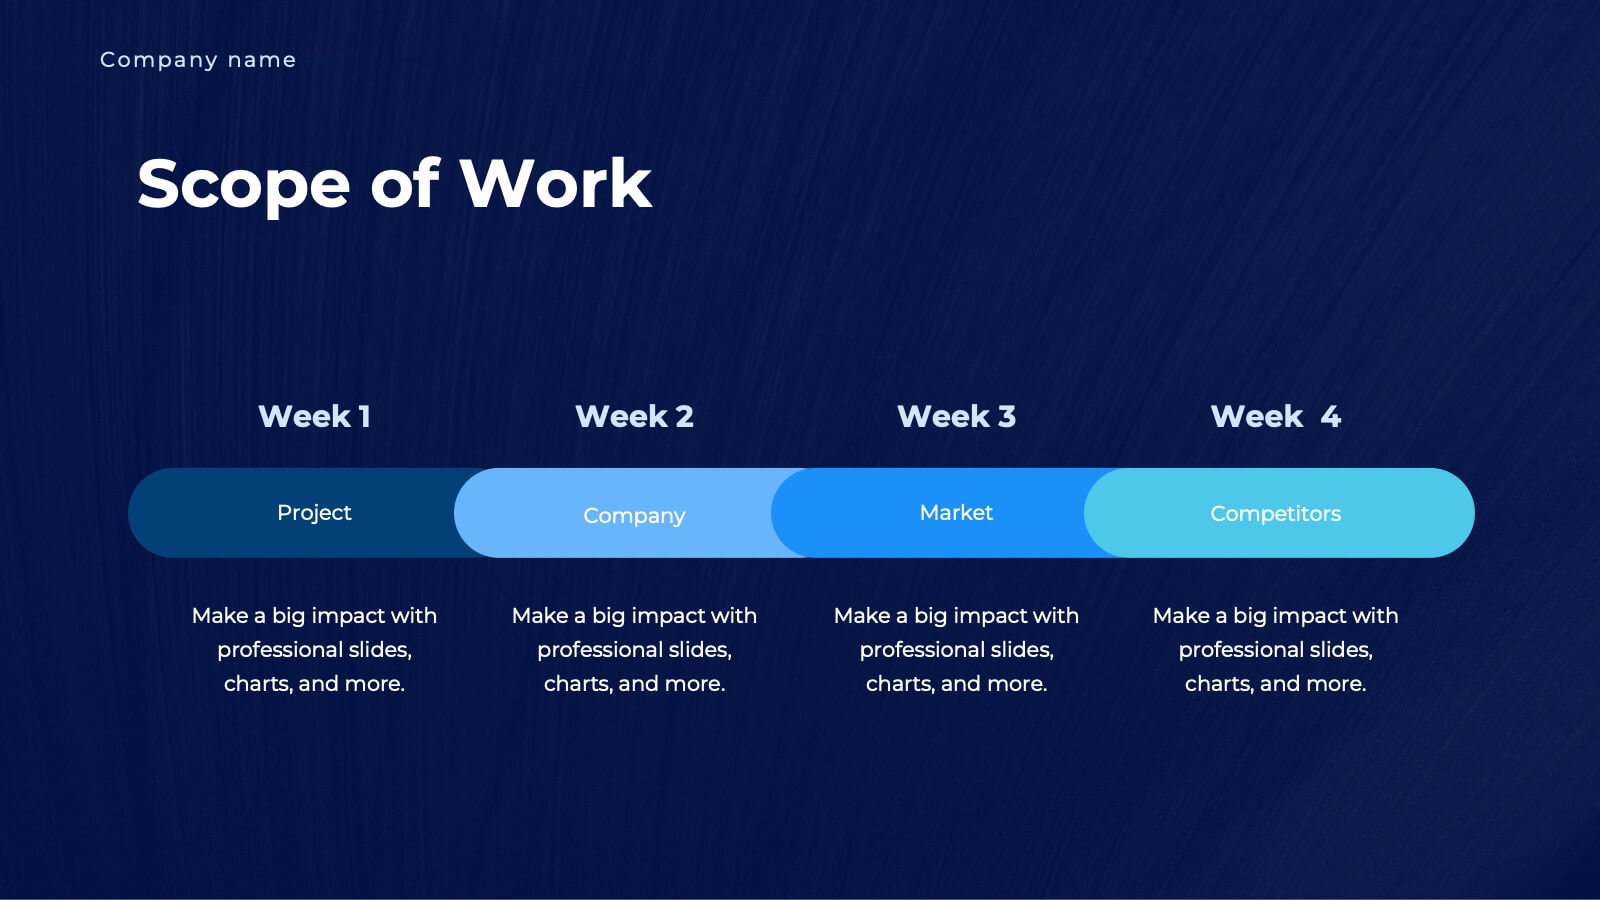
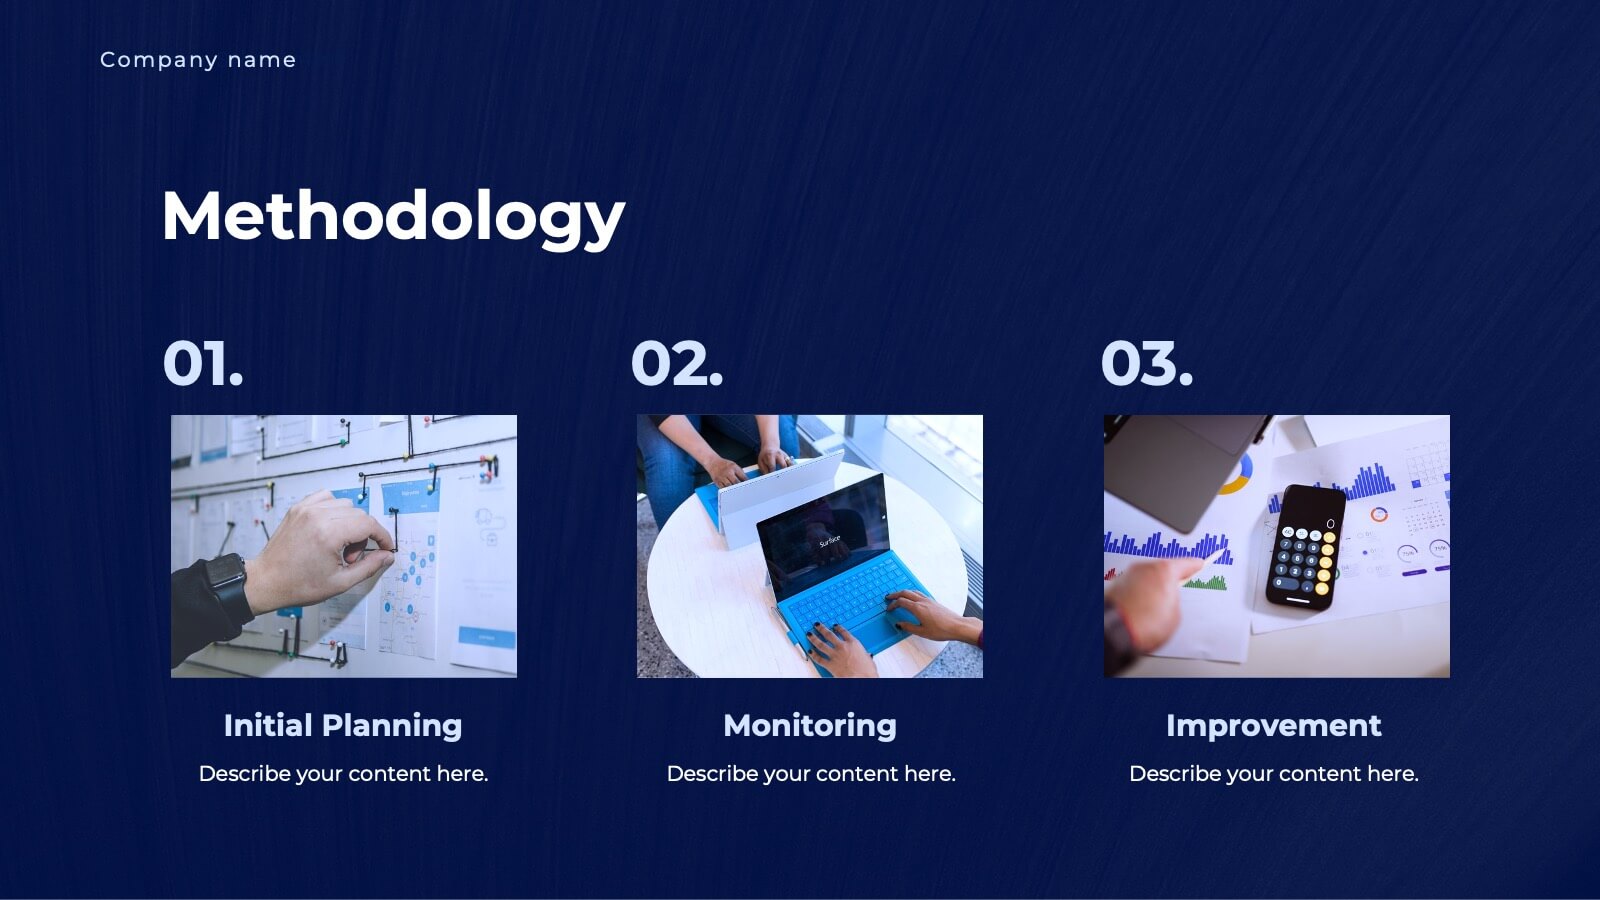
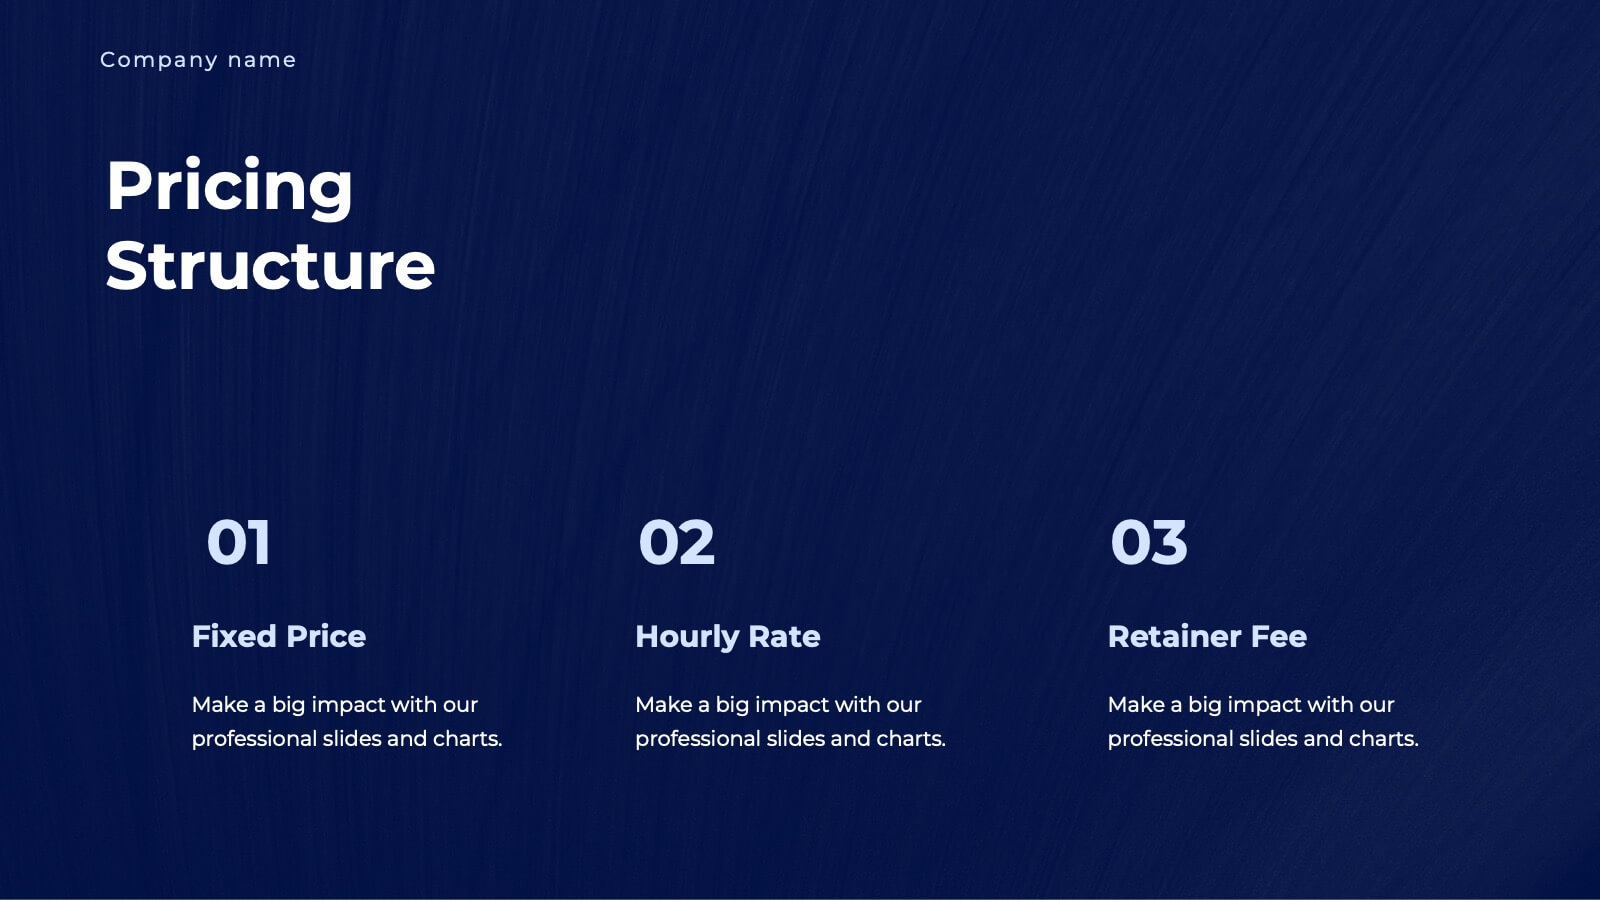
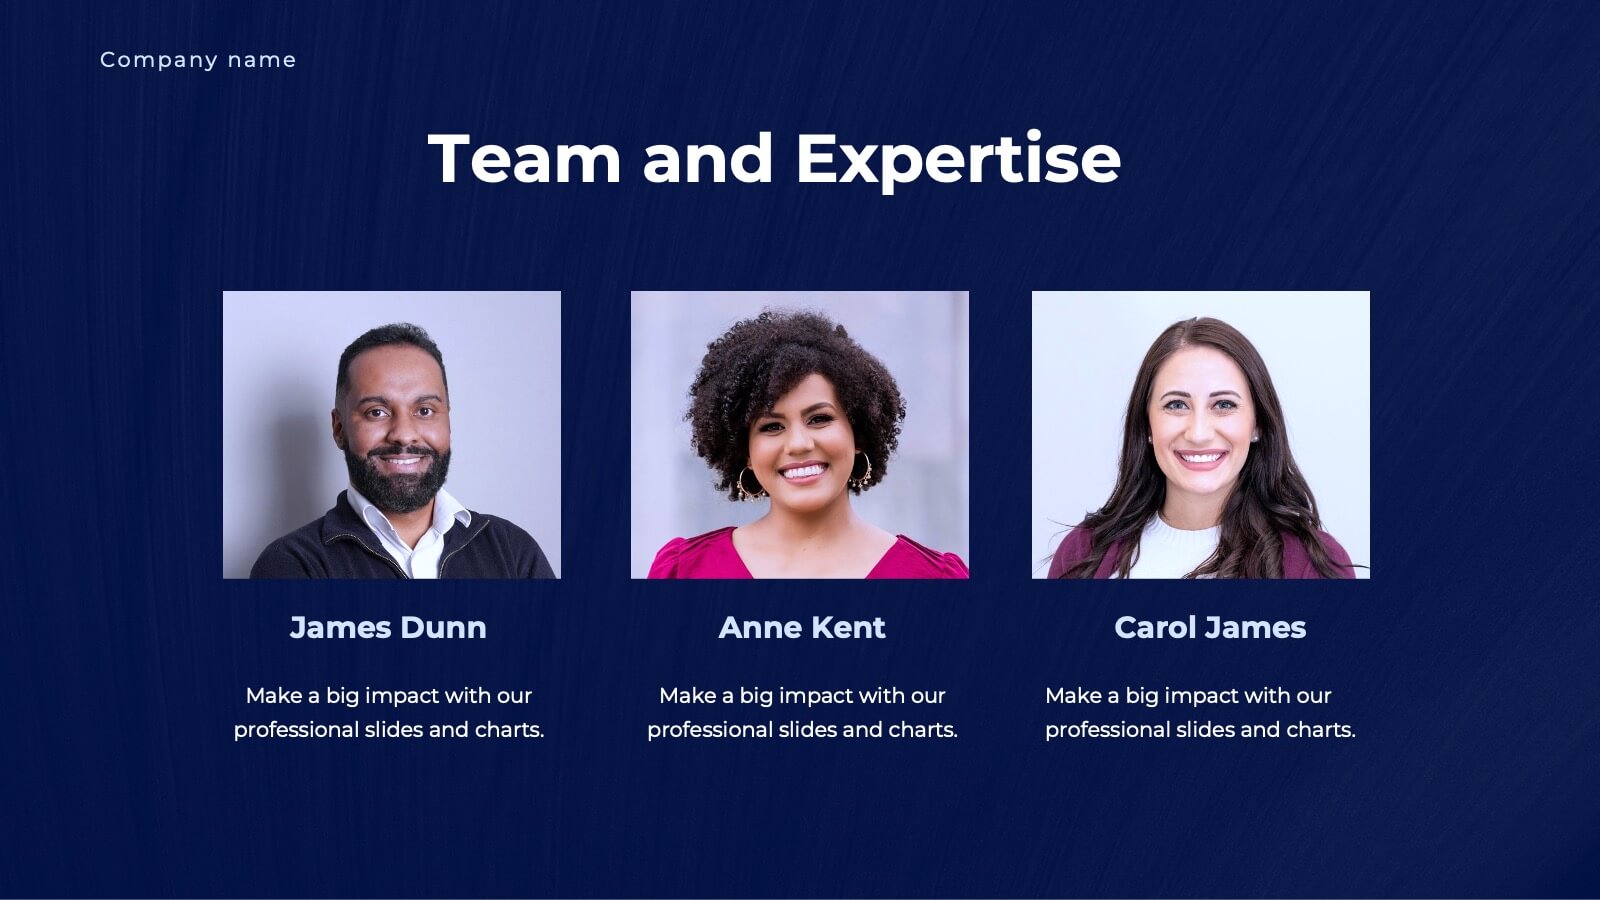
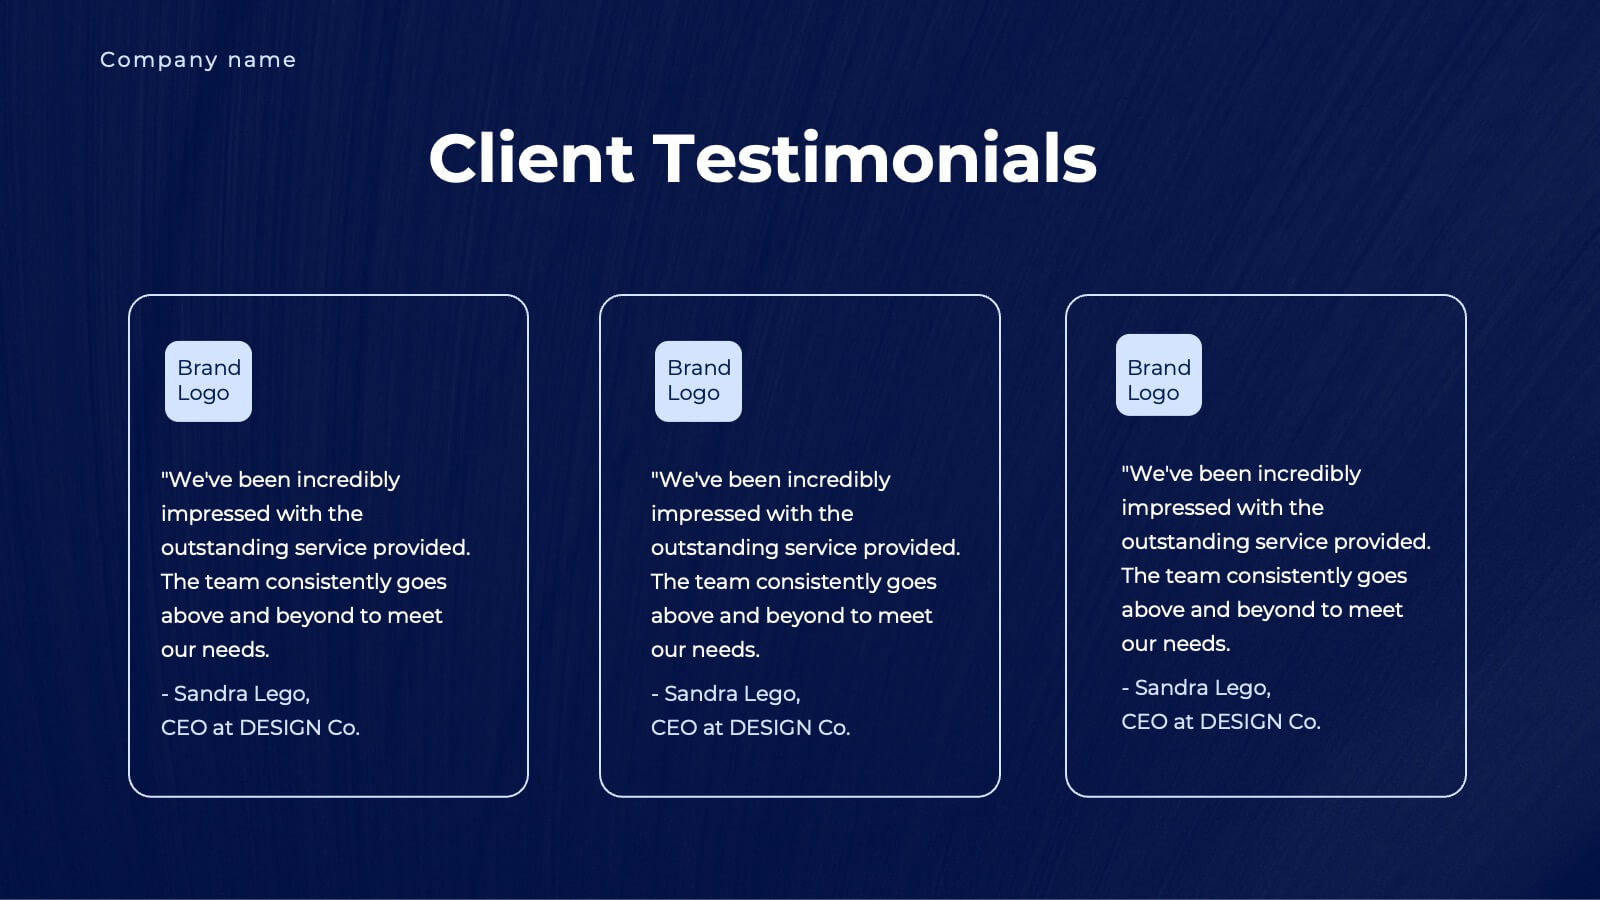
Unity Business Proposal Presentation
Take your business proposals to the next level with this elegant and comprehensive template! Perfect for presenting company overviews, project summaries, and detailed solutions. Ideal for business professionals looking to impress clients and stakeholders. Compatible with PowerPoint, Keynote, and Google Slides, this template ensures your proposals are impactful and professional.
4 diapositivas
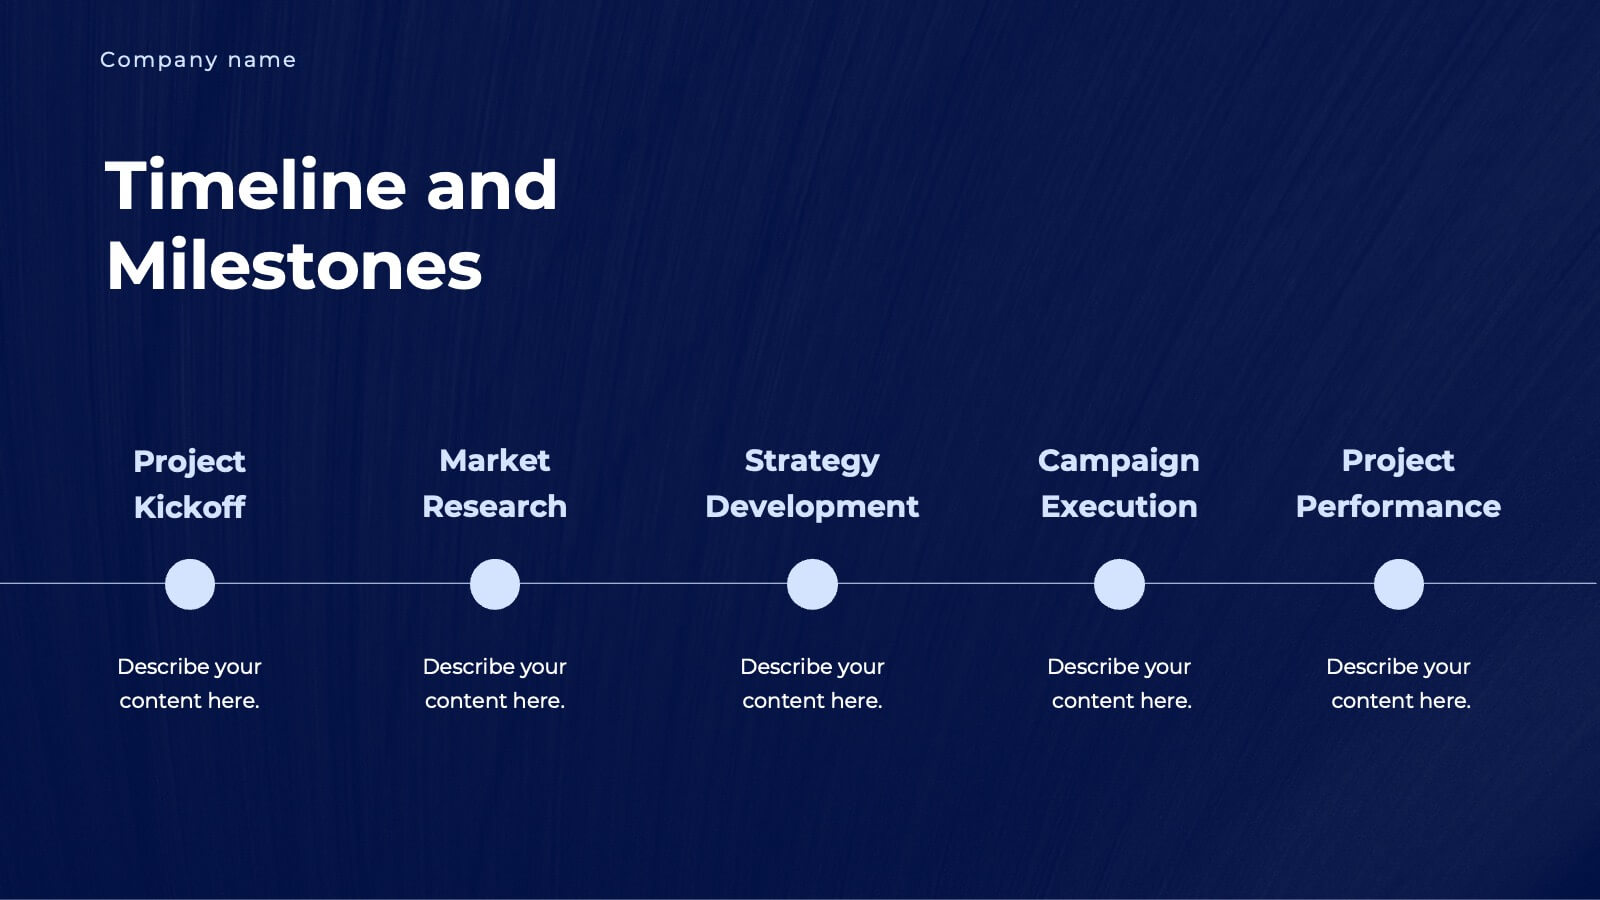
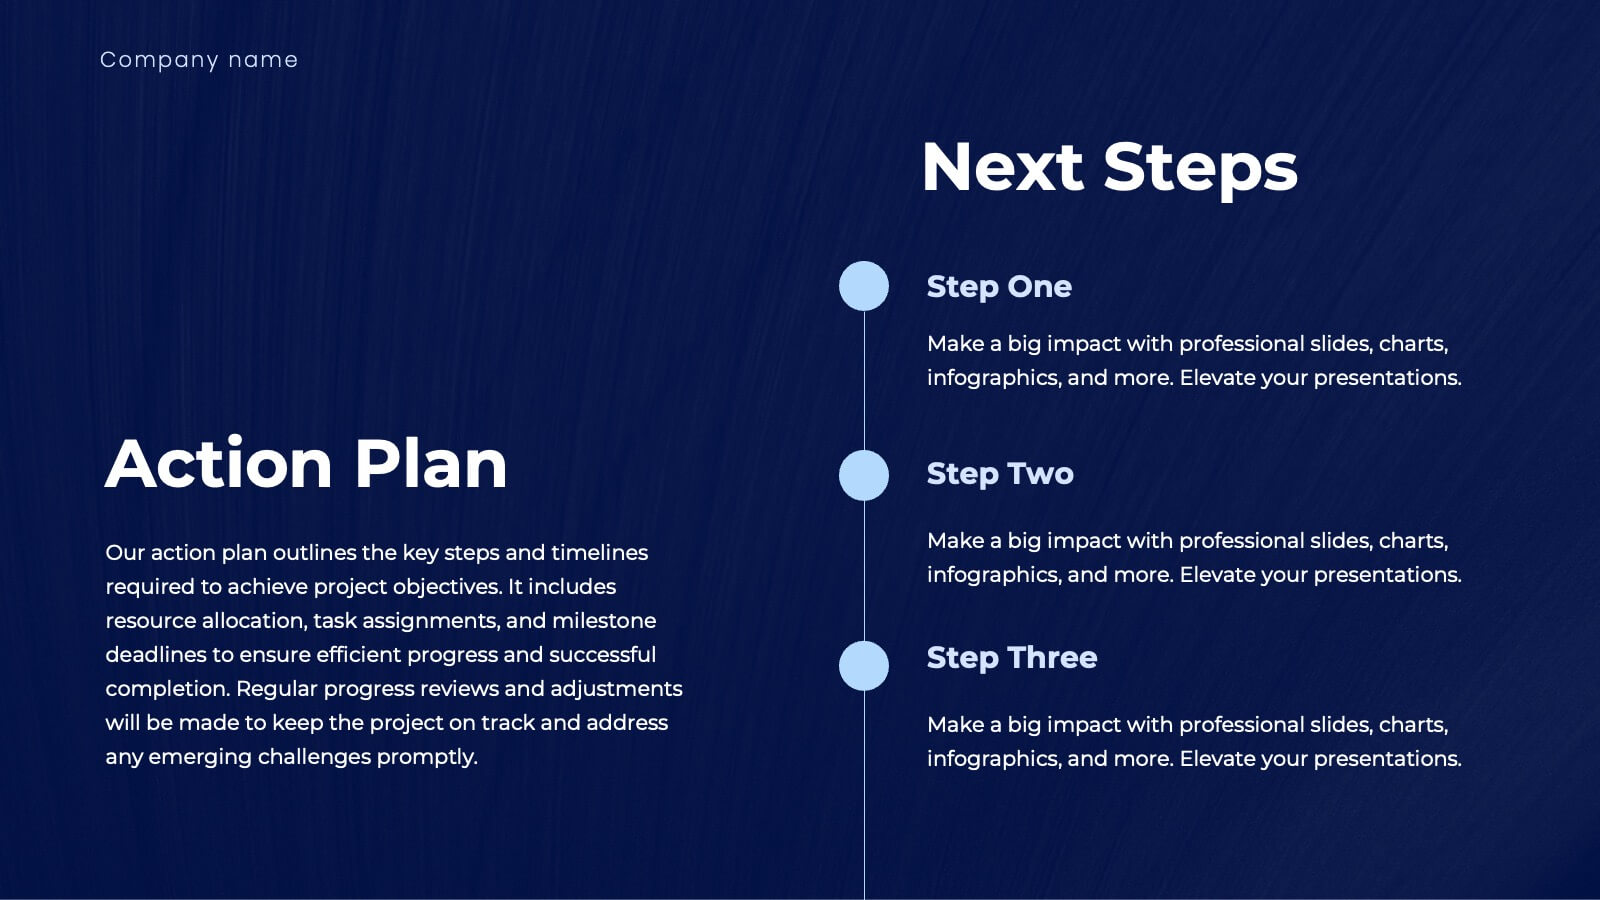
Objectives and Results Strategy Tracking Presentation
Track progress with clarity using the Objectives and Results Strategy Tracking Presentation. This sleek, minimalist layout helps visualize how each objective connects to measurable outcomes along a strategic path. Ideal for OKR reviews, quarterly goal updates, and performance check-ins. Fully customizable in PowerPoint, Canva, Keynote, and Google Slides.


4 diapositivas
Regional Analytics for North America Map Presentation
Visualize key performance metrics by region with the Regional Analytics for North America Map Presentation. This slide layout combines stacked bar visuals with a detailed map, allowing you to compare data points across multiple regions. Ideal for reporting trends, KPIs, or market analysis. Fully editable in Canva, PowerPoint, and Google Slides.


6 diapositivas
WFH Tools and Productivity Tips
Level up your work-from-home game with this modern visual wheel that breaks down essential tools and actionable tips to boost productivity. Perfect for remote teams, solo entrepreneurs, or virtual training sessions, this layout keeps key info easy to digest and visually engaging. Fully compatible with PowerPoint, Keynote, and Google Slides.


8 diapositivas
Market Segmentation Customer Profile Presentation
Define Your Ideal Customer with Market Segmentation! The Market Segmentation Customer Profile template is designed to visually categorize customer demographics, behaviors, and needs. Featuring a clean, professional layout with a circular segmentation design, this template helps businesses analyze target audiences, refine marketing strategies, and improve customer engagement. Ideal for marketers, sales teams, and business analysts, this PowerPoint, Keynote, and Google Slides-compatible template is fully editable, allowing you to tailor insights and key data points effortlessly.


4 diapositivas
Sales Performance Dashboard Report Presentation
Track progress and showcase trends with the Sales Performance Dashboard Report Presentation. This template features a clean monthly line chart to visualize product growth, alongside three metric boxes for highlighting KPIs or category performance. Ideal for quarterly recaps, revenue reporting, or product analysis. Fully editable in Canva, PowerPoint, and Google Slides.


5 diapositivas
New Hire Employee Onboarding Flow Presentation
Make a lasting first impression with a clear, engaging flow that guides new hires through every step of their onboarding journey. Perfect for HR teams and managers, this presentation simplifies complex processes with visual structure and clarity. Fully compatible with PowerPoint, Keynote, and Google Slides for easy customization and use.


6 diapositivas
Gantt Charts Analysis Infographic
Streamline your project planning with our Gantt Chart Analysis Infographic, designed for seamless integration with Powerpoint, Google Slides, and Keynote. The Gantt chart layout allows you to display activities against a time scale, making it easy to identify key phases, task durations, and overlapping activities. Each bar represents a task, with colors and lengths that can be customized to reflect different stages or priorities. Perfect for detailing project timelines, and workflow coordination, this template is a visual aid that enhances clarity and fosters collaborative project management. With this Gantt Chart infographic, you can ensure your project stays on track.


6 diapositivas
World Map Biomes Infographics
The "World Map Biomes" infographic template is a visually stunning and educational tool, expertly designed for PowerPoint, Keynote, and Google Slides. This template is a treasure trove for educators, environmentalists, and geographers aiming to provide a captivating geographical overview of the planet's diverse biomes. This template beautifully illustrates the Earth's varied biomes, from lush rainforests and arid deserts to tundra and coral reefs. Each biome is vividly represented, complete with key characteristics, flora and fauna, and climate information. This makes it a powerful resource for educational programs, environmental awareness campaigns, and geographical studies. The design is as informative as it is visually appealing, with a color scheme that mirrors the richness and diversity of the Earth's ecosystems. This not only makes the presentation a feast for the eyes but also enhances the educational impact, engaging audiences of all ages in the wonders of our world's biomes. Whether used in a classroom, a seminar, or an environmental exhibit, this template ensures that the "World Map Biomes" are presented in an enthralling, informative, and visually spectacular manner.


7 diapositivas
Job Objective Infographic Presentation
A Job Objective is an introduction that summarizes an individual's career goals and objectives. This Template is designed to create a visual experience with a focus of solving your objectives, showcasing your expertise and individuality. Use this infographic to help you visually communicate your knowledge and skills with a powerful presentation. Highlight your experience, skills and key achievements. You can edit the graphics, photos, data and text in this template so that it fits your needs perfectly. All you have to do is just download this template in PowerPoint, Keynote, or Google Slides.


6 diapositivas
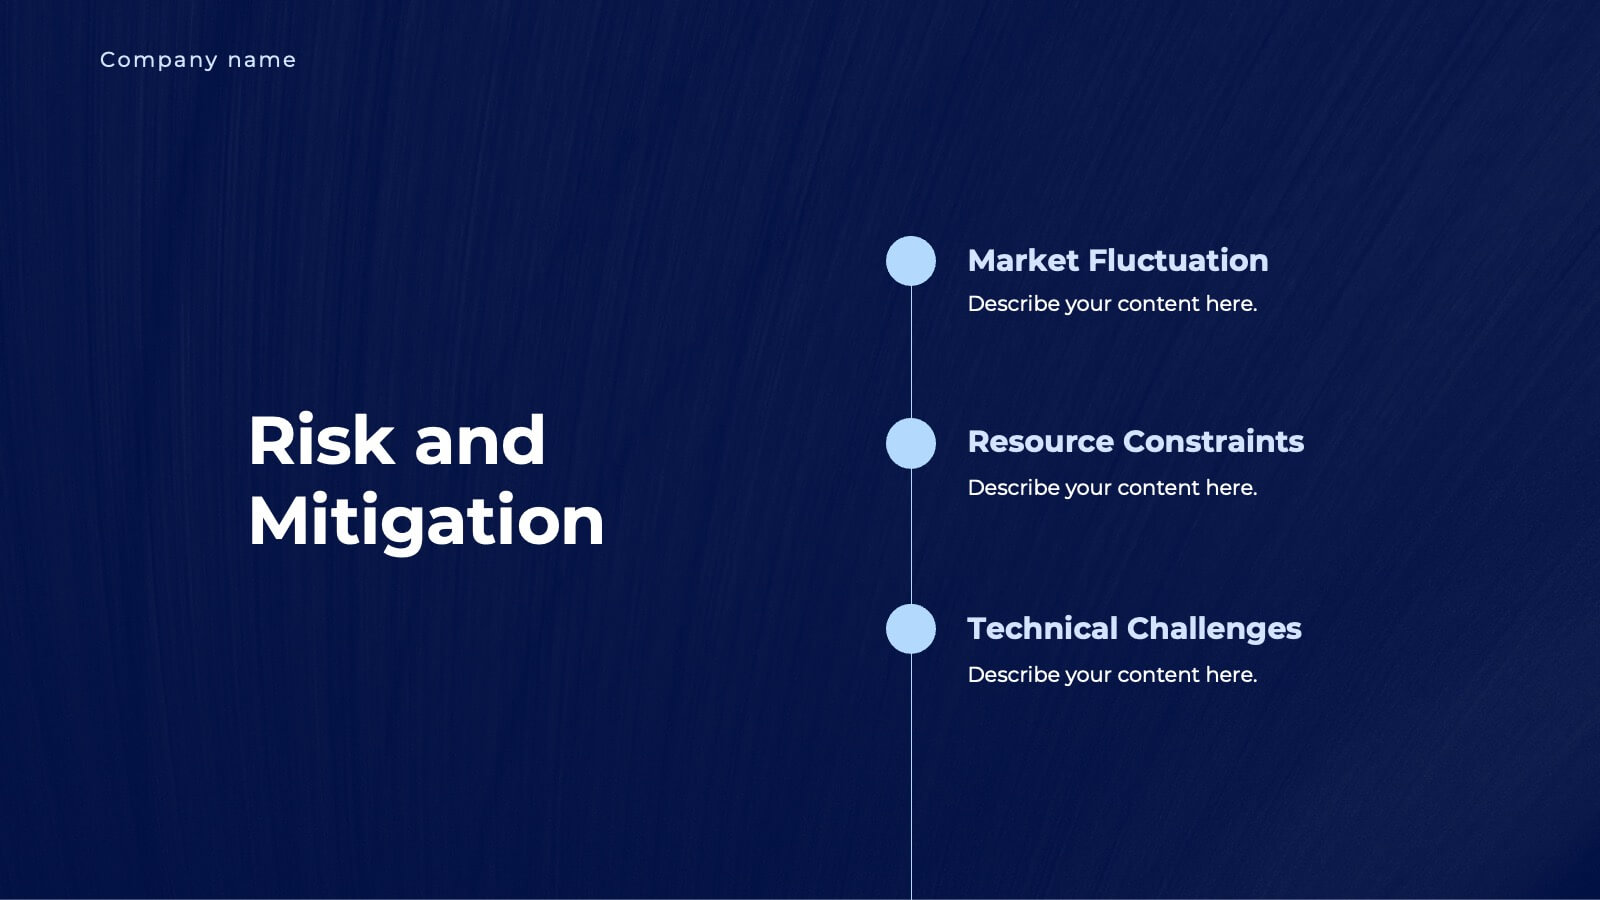
Risk Management in Insurance Presentation
Ensure Stability and Security with this Risk Management in Insurance Presentation template. Featuring a shield-themed layout, this slide effectively communicates key risk assessment strategies, mitigation plans, and compliance measures in the insurance sector. Ideal for insurance professionals, financial risk analysts, and compliance teams, this fully editable template is compatible with PowerPoint, Keynote, and Google Slides, allowing you to tailor the content to your specific risk management needs.


7 diapositivas
Growth Mindset Infographic Presentation
A Growth Infographic is a visual representation of data that displays the growth of a particular business, industry, or market over time. It can be used to illustrate growth in areas such as revenue, profits, customer base, or market share. This growth template includes a timeline and graphs that shows the change in data over time, presented in a visually appealing way using icons, symbols, and color-coding. Use this infographic to include additional information such as industry trends, key drivers of growth, and future projections. Easily edit in Powerpoint, Keynote, and Google Slides.


6 diapositivas
Life Insurance Infographic
Life insurance is a contract between an individual and an insurance company, where the insurance company agrees to pay a sum of money (the death benefit) to the designated beneficiaries upon the death of the insured person. This infographic template is designed to provide a clear and concise overview of what life insurance is, why it is important, and the different types of life insurance coverage available. This infographic aims to educate and inform individuals about the value of life insurance in protecting their loved ones and securing their financial future. This infographic is compatible with Powerpoint, Keynote, and Google Slides.


21 diapositivas
Thunderbird Small Business Pitch Deck Presentation
Take flight with this dynamic Thunderbird-inspired presentation, perfect for pitching your small business! Designed to highlight your business model, market potential, and financial projections, this template ensures your pitch is clear, compelling, and professional. Its bold visuals will help you soar. Compatible with PowerPoint, Keynote, and Google Slides.


6 diapositivas
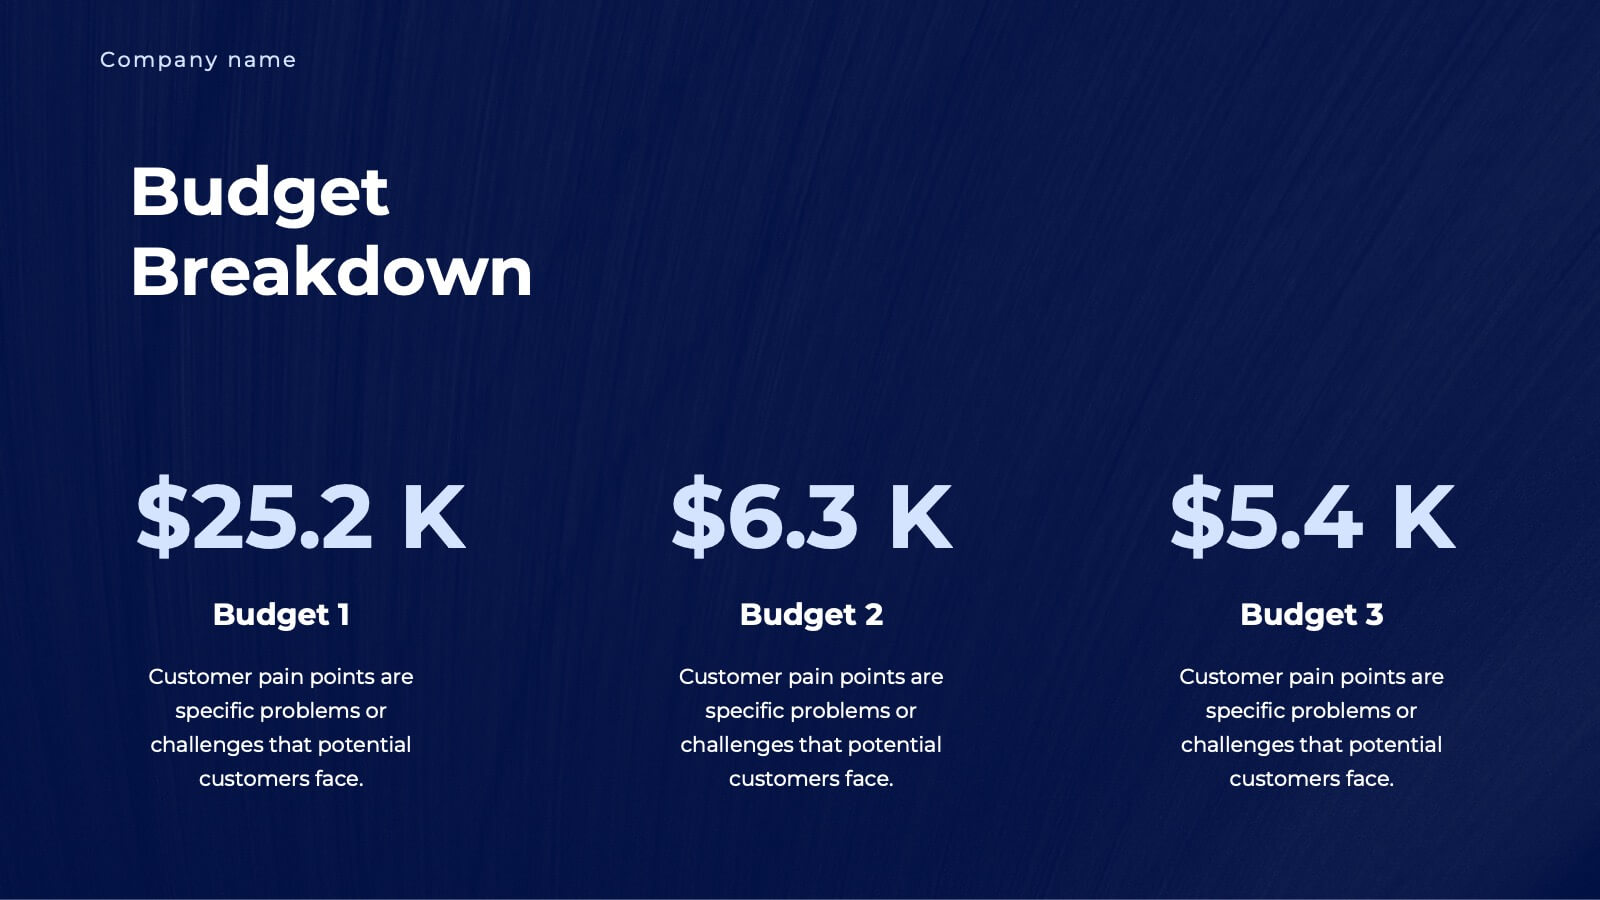
Budget Allocation Strategy Presentation
Break down your budget plan with this clear and modern 6-point layout. Featuring a central money bag icon and segmented categories, this slide is perfect for financial strategy, departmental budgeting, or resource distribution. Fully editable in Canva, PowerPoint, or Google Slides for easy customization to match your brand.


7 diapositivas
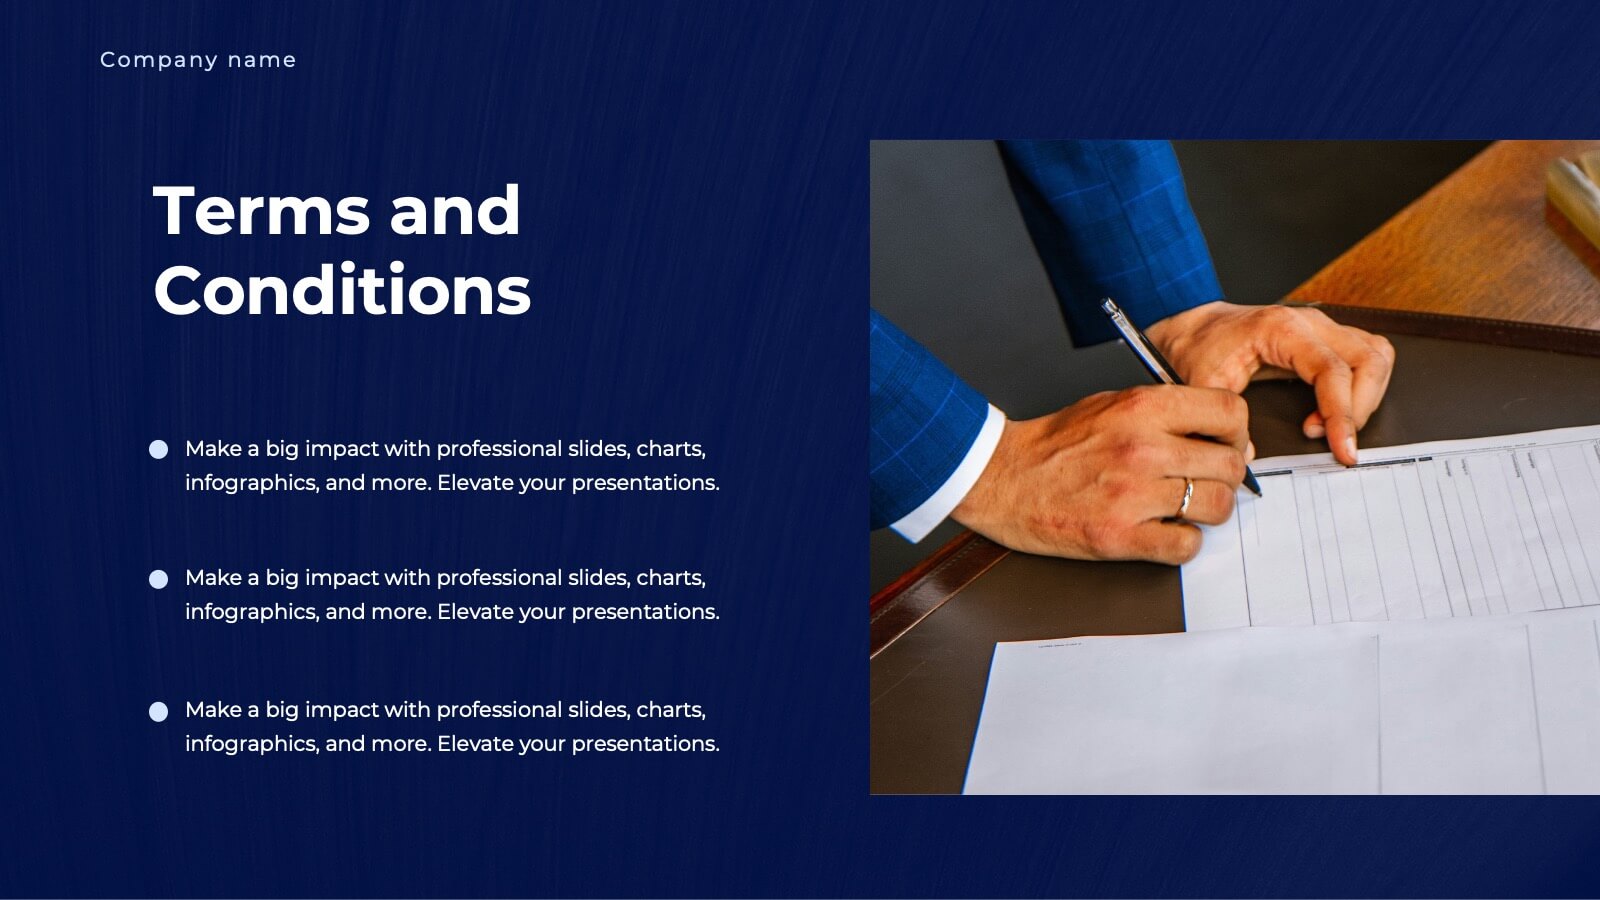
Investment Bank Infographic Presentation
An investment infographic helps investors understand complex investment concepts by presenting information in a clear and concise manner. This is a professional Investment template with all the elements you need to make a great impact. Use this presentation to help you explain a new investment opportunity, or show the benefits of your product or service. Designed for use in PowerPoint, Keynote and Google Slides, it is easy to customize and fully editable, making it a perfect starting point for any investor or financial pitch. You can change the texts, image and shapes as you wish!