


Características


¿Tienes alguna pregunta?
Recomendar


20 diapositivas
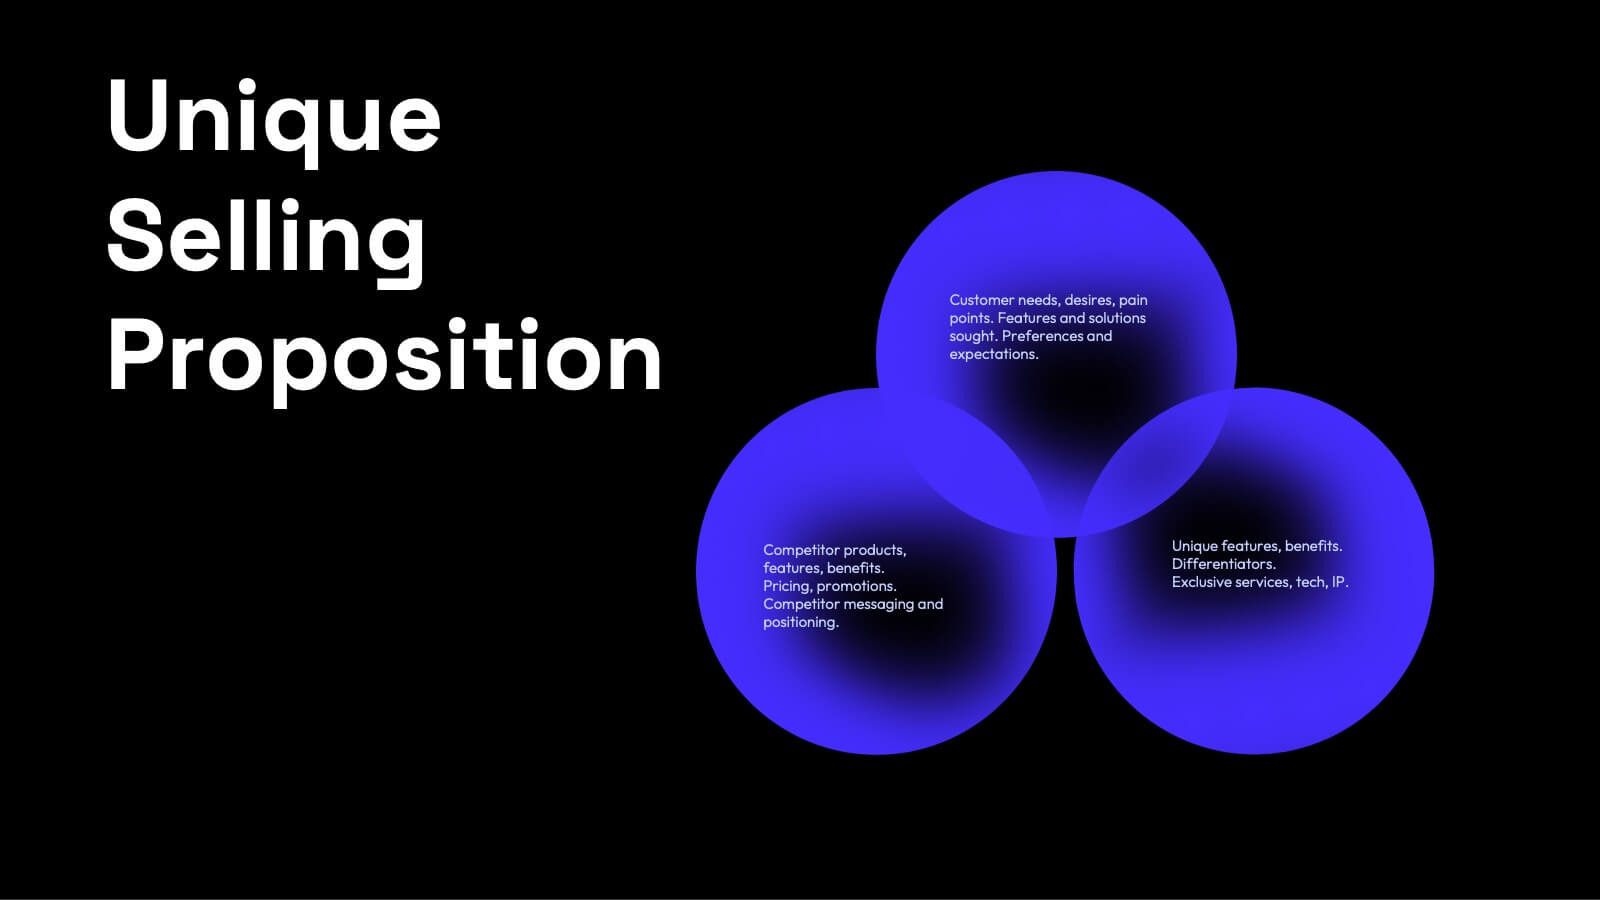
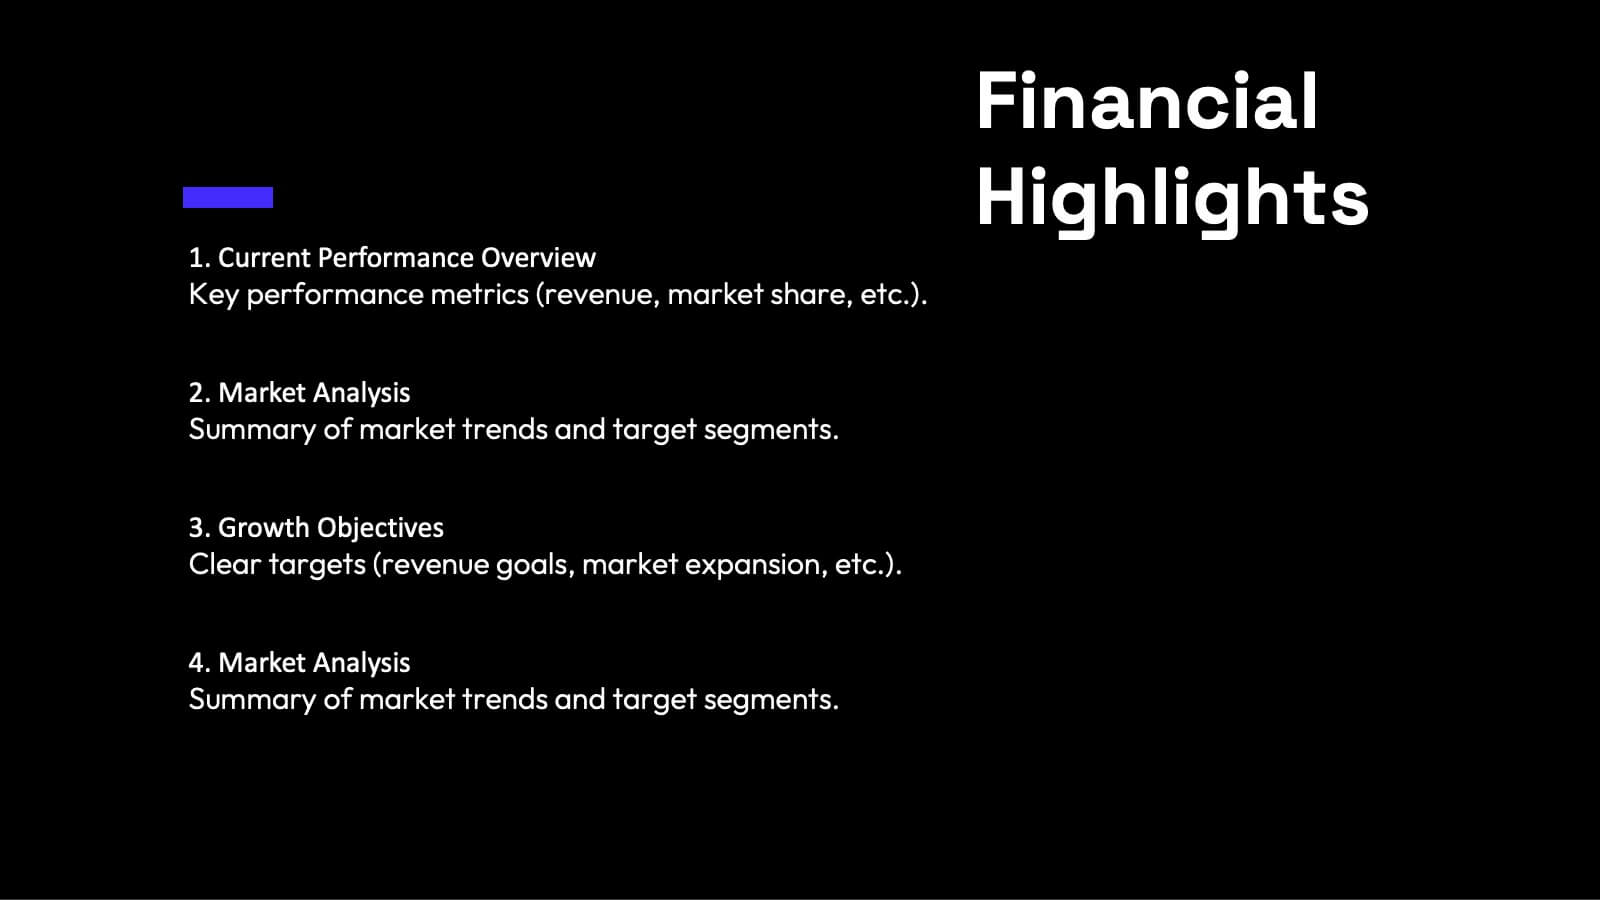
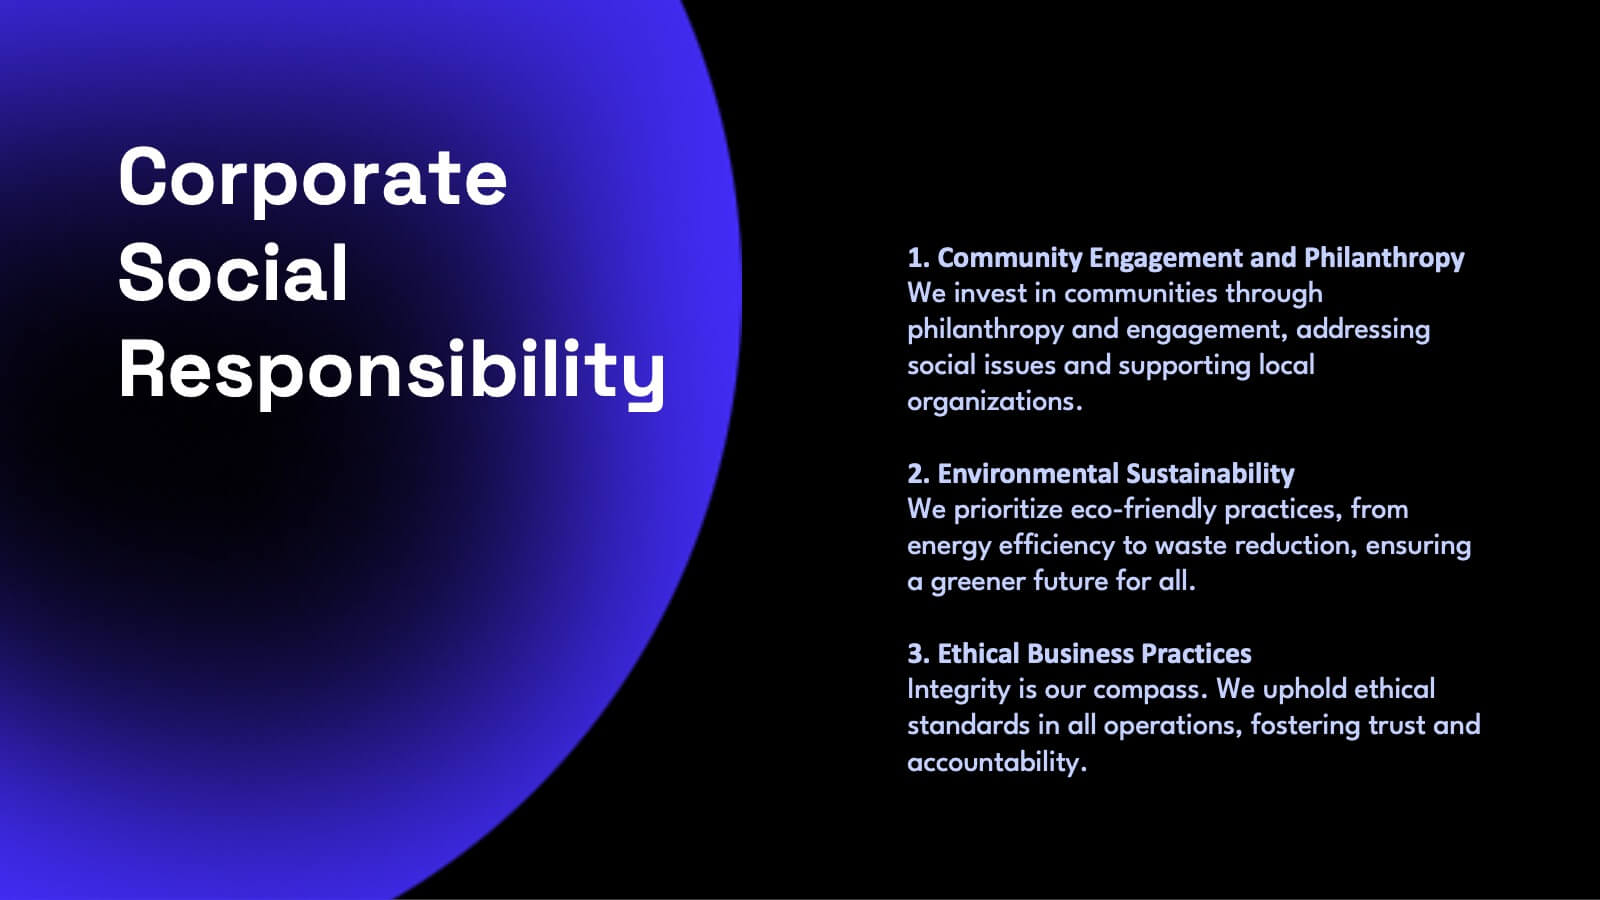
Apex Content Marketing Pitch Deck Presentation
Ignite your marketing strategy with this captivating pitch deck! Perfect for showcasing content marketing plans, it features slides on company history, target audience, and unique selling propositions. Make a lasting impression with sleek, modern designs and compelling content. Compatible with PowerPoint, Keynote, and Google Slides for a smooth presentation experience on any platform.


6 diapositivas
Blue Ocean Strategy Business Model
Capture new market spaces with this innovative Blue Ocean Strategy slide. Designed with a dynamic hourglass visual, it helps you showcase differentiation and low-cost strategies clearly. Perfect for business strategy sessions, growth planning, and innovation discussions. Fully editable in PowerPoint, Keynote, and Google Slides.


2 diapositivas
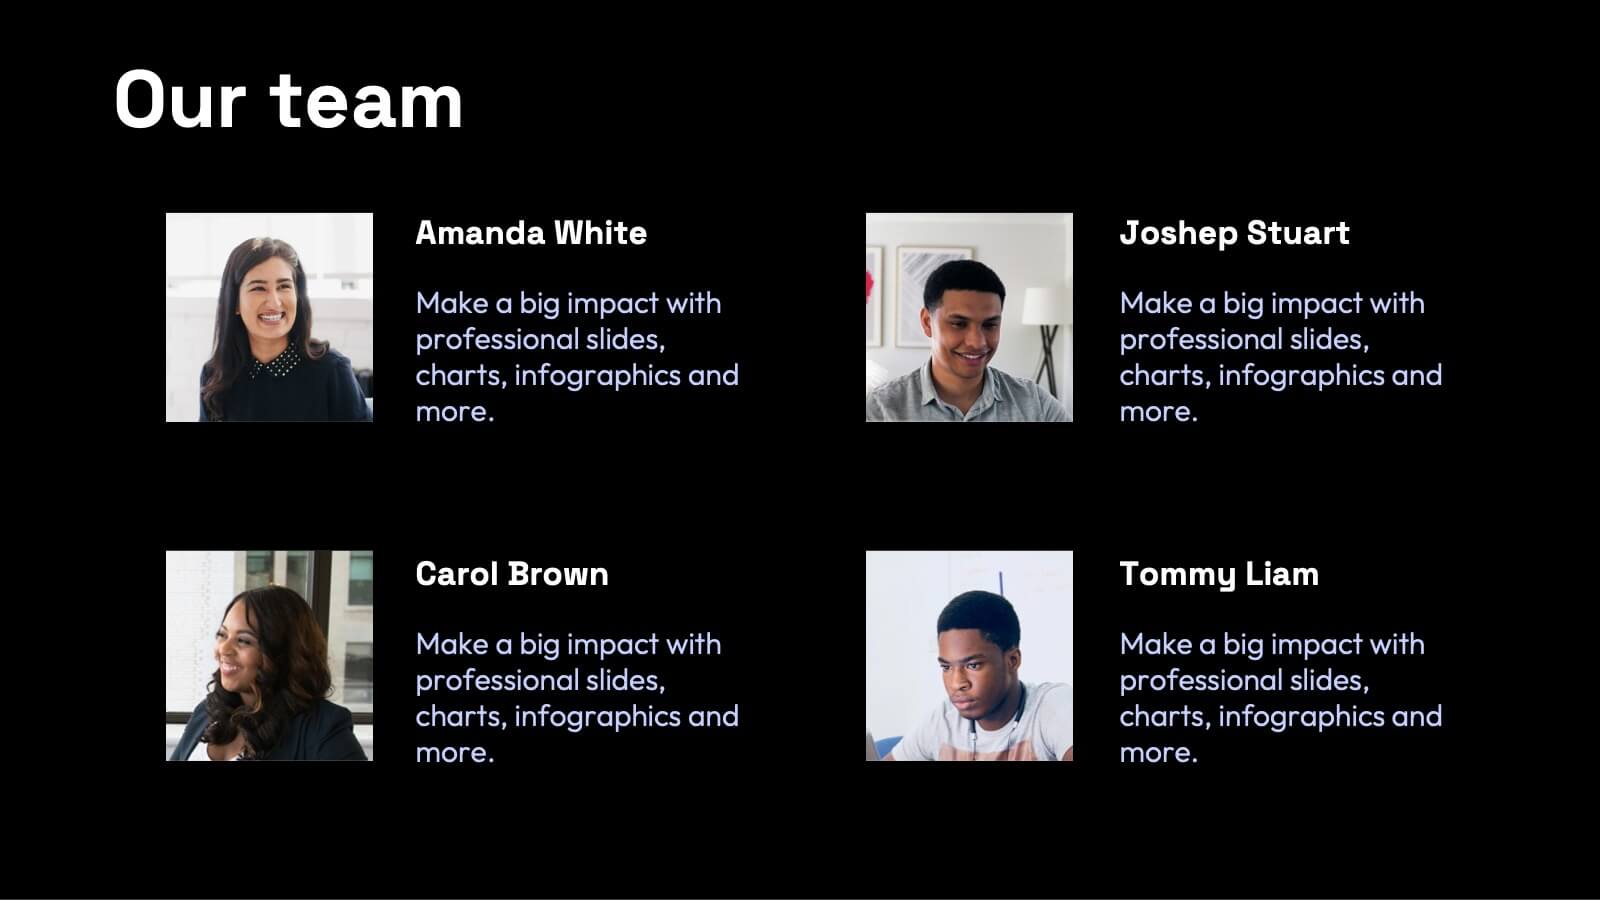
Business Self-Introduction Presentation
Introduce yourself with confidence using this Business Self-Introduction Slide. Perfect for networking, team meetings, and professional presentations, this template features a modern layout with a dynamic photo cutout, engaging visuals, and structured text areas. Fully customizable for PowerPoint, Keynote, and Google Slides, you can adjust colors, fonts, and content to reflect your personal or business identity.


7 diapositivas
Professional Goals Infographic
Unfold the pathway to success with our professional goals infographic. Designed to help individuals and organizations visualize and track their aspirations, this infographic offers a comprehensive look at professional milestones and strategies to achieve them. The primary palette revolves around a pristine white backdrop, enhanced by accents of vibrant orange and a mix of complementary colors to distinguish different areas. Its design ensures seamless integration into PowerPoint, Keynote, or Google Slides presentations, transforming your professional goals discourse into a visually engaging experience.


8 diapositivas
Task Management Process Presentation
Bring clarity and momentum to every workflow with this clean, step-by-step layout designed to break down tasks, handoffs, and progress stages. This presentation helps teams visualize responsibilities and streamline execution with ease. Fully customizable and ready to use in PowerPoint, Keynote, and Google Slides.


12 diapositivas
Creative Alphabet Infographic
Add a bold twist to your data with this Creative Alphabet Infographic slide, featuring a stylized letter “B” puzzle layout. Ideal for branding breakdowns, step-by-step processes, or topic segmentation, each puzzle piece aligns with a customizable title and description. Fully editable in PowerPoint, Keynote, and Google Slides.


4 diapositivas
Property Listing and Comparison Presentation
A sleek, modern way to spotlight property details comes to life in this clean presentation design, making comparisons feel effortless and engaging. It clearly organizes features, differences, and key selling points so audiences can make informed decisions fast. Fully editable and easy to use, this presentation works seamlessly in PowerPoint, Keynote, and Google Slides.


6 diapositivas
Innovation-Driven Culture and Vision
Present your strategy with clarity using the Innovation-Driven Culture and Vision Presentation. This clean, modern layout features five vertical icon markers to highlight key pillars of innovation. Ideal for leadership talks or team strategy meetings. Fully customizable in PowerPoint, Keynote, and Google Slides for easy edits and branding.


5 diapositivas
Creative Problem Solving with Design Thinking Presentation
Bring your innovation process to life with the Creative Problem Solving with Design Thinking Presentation. This visual layout uses gear and bulb icons to highlight four essential stages in the design thinking approach. Perfect for brainstorming sessions, innovation pitches, and product development workshops. Easily editable in Canva, PowerPoint, Google Slides, and Keynote.


7 diapositivas
United States Map Infographic Presentation Template
The United States is a country in North America, consisting of 50 states. Besides the 48 conterminous states that occupy the middle latitudes of the continent, the United States includes the state of Alaska, at the northwestern extreme of North America, and the island state of Hawaii, in the mid-Pacific Ocean. This map template is a great way to kickstart your project, add a clean and professional look with it. This template can be used to display any type of data or information you need in your presentations. Use this map template to show where the states are and what they're known for.


8 diapositivas
Sustainable Operation & Ethical Practice Presentation
Illustrate your ethical initiatives and operational sustainability with this water drop flow diagram. Ideal for outlining four key actions or principles, it features a faucet visual and icon-based content drops. Fully customizable in PowerPoint, Keynote, and Google Slides—perfect for ESG reporting, CSR updates, and eco-conscious business presentations.


6 diapositivas
Product Launch Milestone Plan Presentation
Turn your big idea into a successful launch with this bold and structured presentation design. Perfect for outlining goals, tracking phases, and measuring progress, it keeps your product roadmap clear and engaging. Easily editable and compatible with PowerPoint, Keynote, and Google Slides for seamless presentation creation.


24 diapositivas
Catalyst Strategic Planning Report Presentation
Unleash your strategic vision with the Catalyst Strategic Planning Report template! This vibrant and dynamic layout is designed to make your strategic planning presentations not only effective but also visually captivating. The template’s playful yet professional design elements, including bold color blocks and creative graphics, draw attention to key points, ensuring your message resonates with your audience. From SWOT analysis to market trends, and resource allocation to action plans, every slide is crafted to communicate your strategic objectives clearly and compellingly. Perfect for business reviews, strategic meetings, or investor presentations, this template allows you to present data-driven insights and actionable steps in an engaging manner. It’s fully customizable, making it easy to adapt to your brand’s colors and style. Whether you’re presenting to a team or stakeholders, the Catalyst template provides the perfect platform to articulate your vision. Compatible with PowerPoint, Keynote, and Google Slides, it’s your go-to tool for impactful strategic presentations!


5 diapositivas
Website UI Mockup Device Display
Present your web interface with clarity and flair using this clean device display slide. Designed around a desktop monitor mockup, it’s perfect for showcasing UI designs, website pages, or digital layouts. Fully customizable in PowerPoint, Keynote, and Google Slides—edit colors, fonts, and content to match your project needs.


6 diapositivas
Data Analysis Methods Infographics
This Data Analysis Methods Infographic is an excellent tool for professionals and students alike to present statistical findings and patterns. Designed for seamless integration with PowerPoint, Google Slides, and Keynote. The infographics are ideal for illustrating trends, and summarizing large amounts of data in an easily digestible format. With a variety of chart styles, including bar graphs, line charts, and icon arrays, the template allows for versatile data representation. Make your data speak volumes with this crisp and informative infographic, ensuring your audience grasps the insights at a glance. Perfect for market research, academic research, and business performance presentations.


7 diapositivas
Annual Financial Report Infographic
This easy-to-use infographic template is crafted for a straightforward Annual Financial Report. Suitable for PowerPoint, Google Slides, and Keynote, it features diverse charts like bar graphs, pie charts, and tables for illustrating financial data such as sales growth, product earnings, and expenses. The professional blue and grey color palette is ideal for a corporate setting, while simple icons and clear spaces for text ensure information is digestible. This template is perfect for financial analysts and business managers who need to present complex fiscal data in a clear, visually appealing way.


7 diapositivas
Decision Steps Infographic
Decision-making is a pivotal aspect of any business journey. This decision steps infographic, designed in a harmonious blend of green, white, and blue, effortlessly maps out the complexity of such decisions. It offers a structured, graphical representation of the pathways that lead to informed choices. Executives, project managers, and team leaders will find this tool indispensable when guiding teams and stakeholders through the labyrinth of options. Enhanced to work seamlessly on PowerPoint, Keynote, and Google Slides, this infographic stands as a beacon for those navigating the multifaceted terrains of business decisions.