


Características


¿Tienes alguna pregunta?
Recomendar


6 diapositivas
Weekly Gantt Planning Slide Presentation
Jump into your week with a layout that makes planning feel effortless and visually clear. This presentation helps teams map tasks across each day, track progress, and organize priorities with a clean, modern weekly timeline. Perfect for project updates and team coordination. Fully compatible with PowerPoint, Keynote, and Google Slides.


21 diapositivas
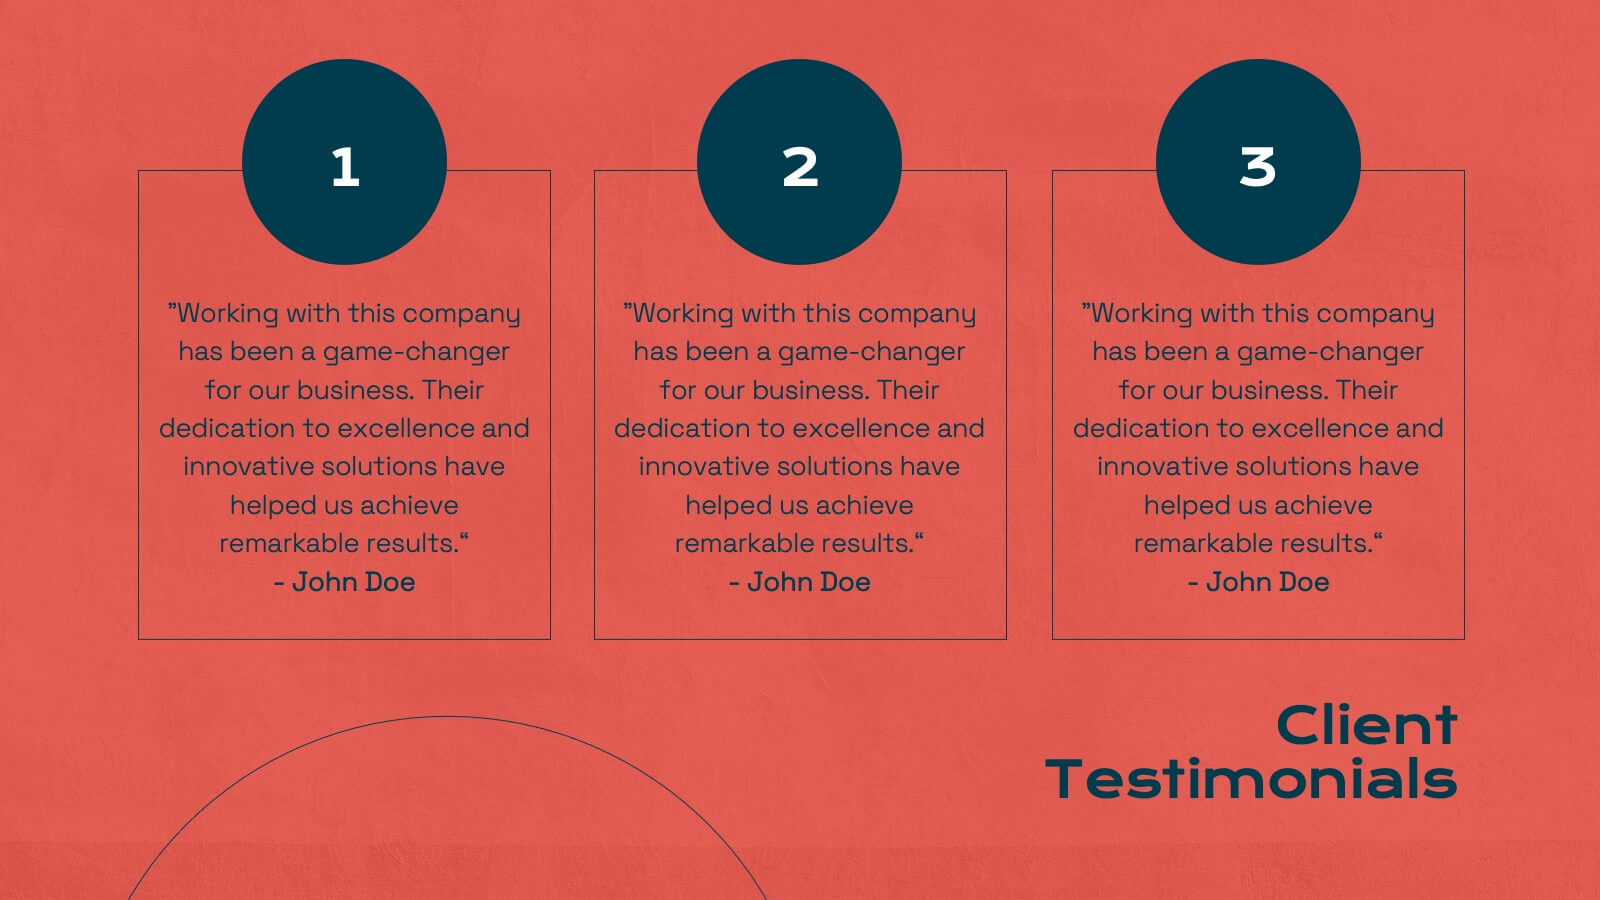
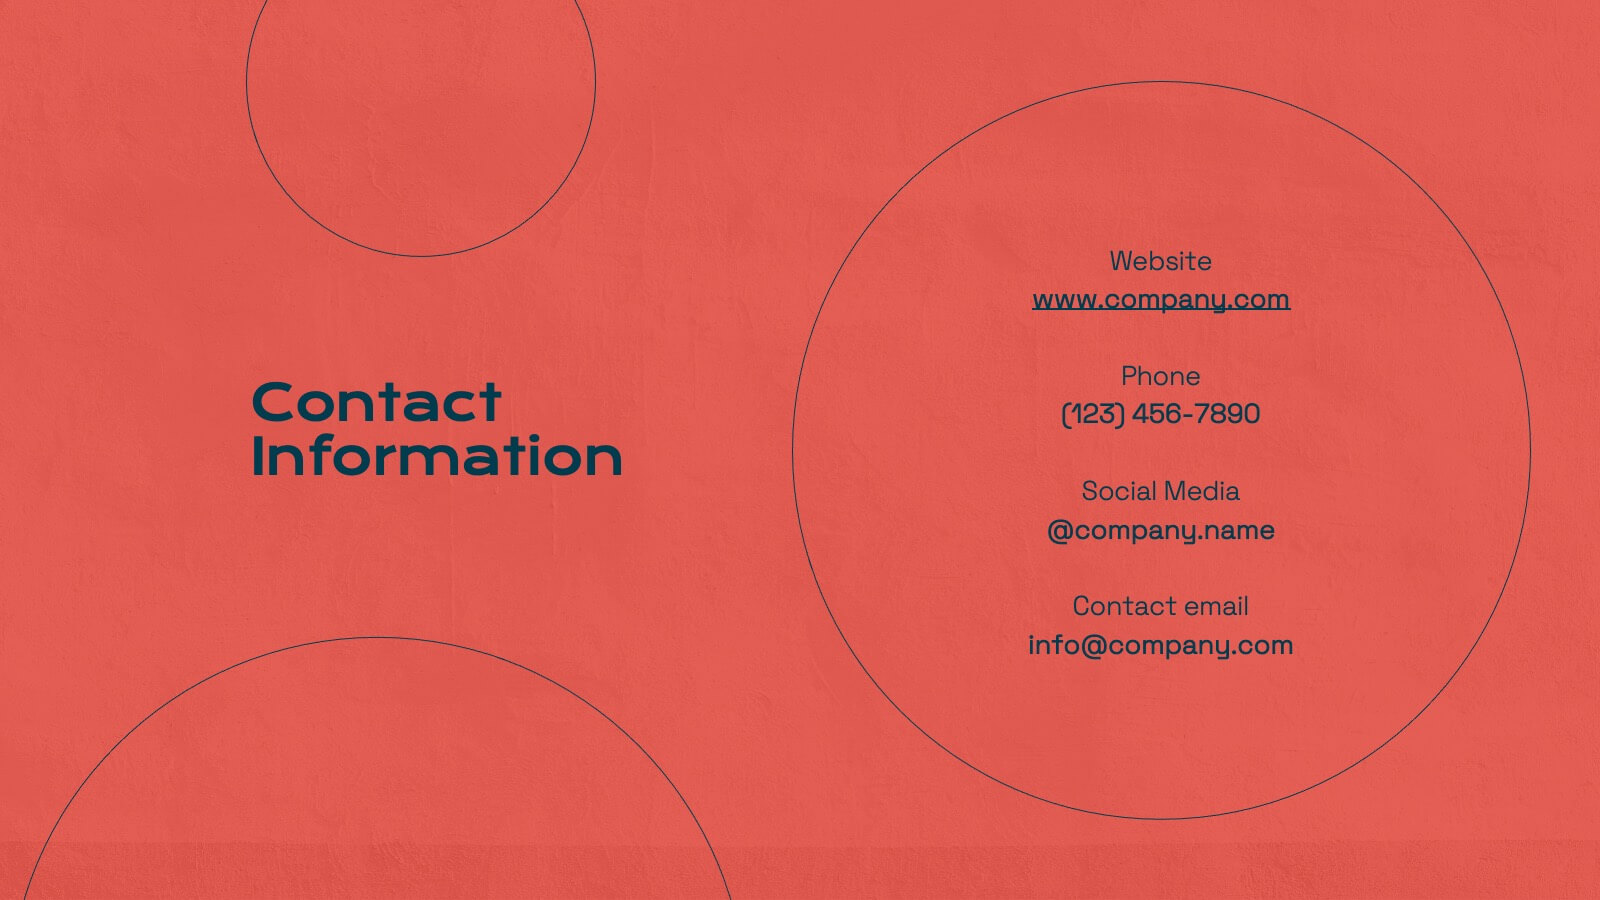
Inventra Creative Portfolio Presentation
Make a lasting impression with this sleek and modern creative portfolio presentation template. Perfect for showcasing your artistic journey, featured projects, unique style, and client testimonials. Highlight your creative process, pricing, and services with a bold and professional layout. Fully customizable in PowerPoint, Keynote, and Google Slides.


6 diapositivas
Organizational Objectives and Key Results Presentation
Showcase your strategic goals and measurable outcomes with the Organizational Objectives and Key Results template. Designed with a sleek radial key layout, it’s ideal for mapping priorities and tracking progress. Fully editable in Canva, PowerPoint, and Google Slides, allowing easy customization of colors, icons, and text to fit your objectives.


6 diapositivas
Decision Tree Diagrams Presentation
Turn complex choices into clear, visual stories with this clean and modern template. Perfect for illustrating outcomes, decision paths, or process options, it helps you communicate strategy and logic with confidence. Fully customizable and compatible with PowerPoint, Keynote, and Google Slides for seamless professional presentations.


4 diapositivas
Execution-Based Strategic Action Plan Presentation
Highlight your execution strategy with this visually striking pinwheel diagram. Each blade represents a focused action step, ideal for showcasing implementation plans or performance initiatives. Fully customizable in PowerPoint, Keynote, and Google Slides—perfect for strategic reviews, team briefings, or progress tracking across four critical areas.


6 diapositivas
Customer Journey Mapping with Buyer Persona Presentation
Clearly visualize the customer experience across all touchpoints with this structured journey mapping slide. Featuring a central buyer persona graphic and six customizable steps with icons, this layout helps you break down each stage of the customer path. Perfect for UX strategy, customer service insights, and product development. Fully editable and compatible with PowerPoint, Keynote, and Google Slides.


5 diapositivas
Team Collaboration Goals Presentation
Bring your teamwork vision to life with a clean, engaging layout that makes every goal feel clear and achievable. This presentation helps you outline priorities, align roles, and highlight shared milestones in a visually balanced format. Perfect for project kickoffs or planning sessions. Fully compatible with PowerPoint, Keynote, and Google Slides.


4 diapositivas
30 60 90 Day Plan Goals Presentation
Set your roadmap in motion with a clean, visual timeline that makes each milestone easy to follow and present with confidence. This presentation helps you outline priorities, track progress, and communicate clear goals for the first three months. Fully editable and compatible with PowerPoint, Keynote, and Google Slides.


5 diapositivas
Health Awareness Campaign Presentation
Bright and uplifting, this slide brings awareness to important health causes through a clean ribbon-focused layout that’s easy to read and visually engaging. It helps present key messages, statistics, or campaign steps clearly while keeping the design calm and supportive. Fully compatible with PowerPoint, Keynote, and Google Slides.


21 diapositivas
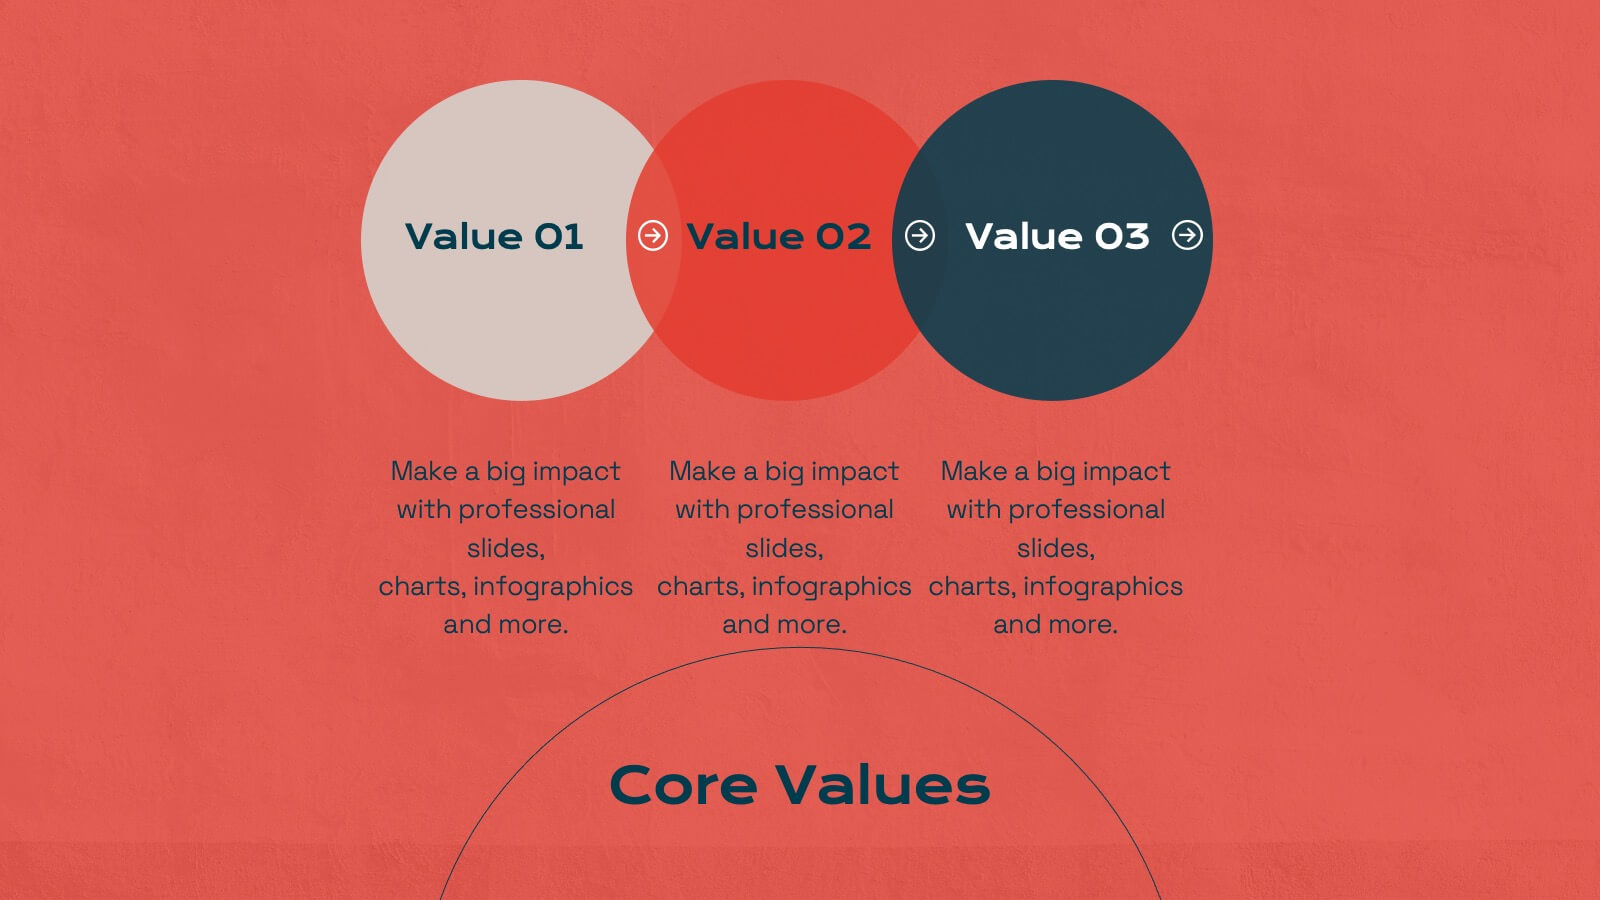
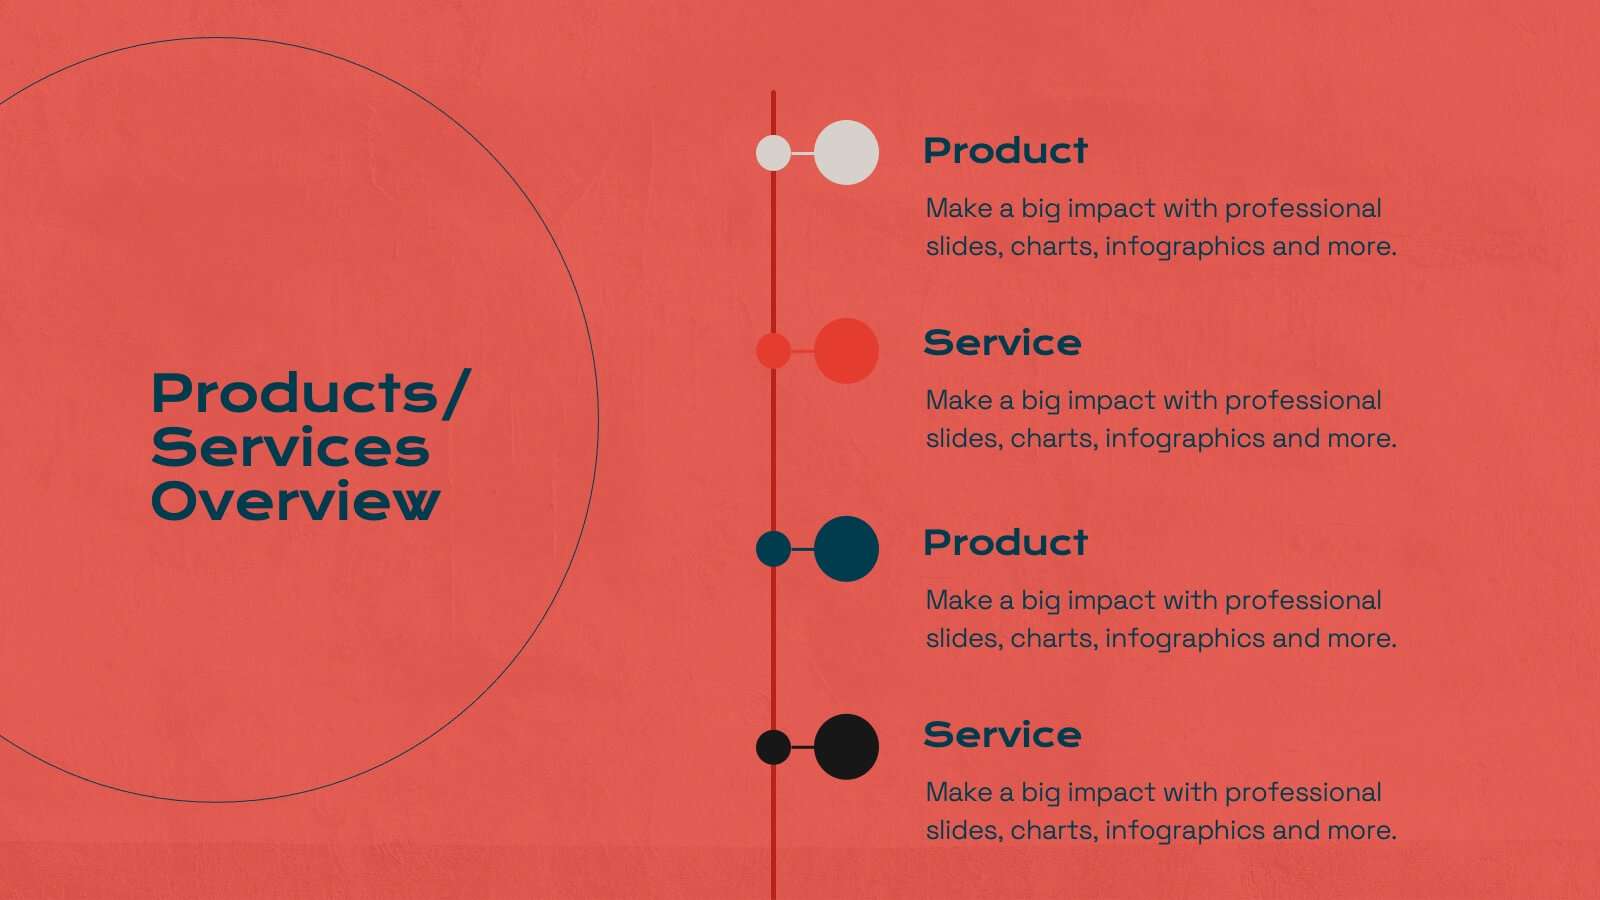
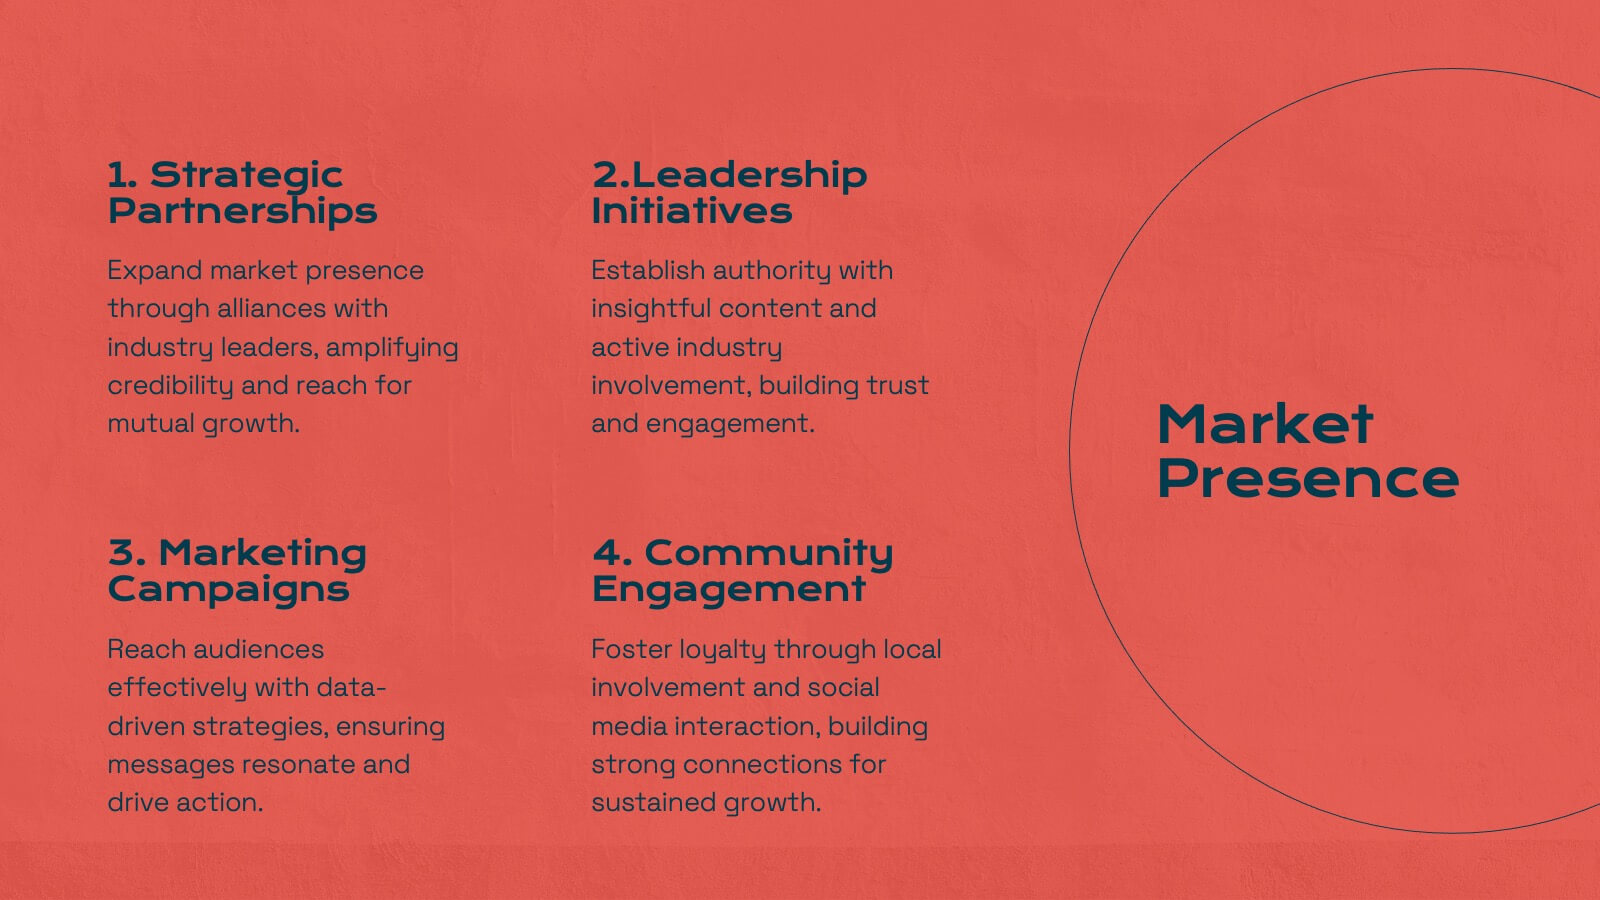
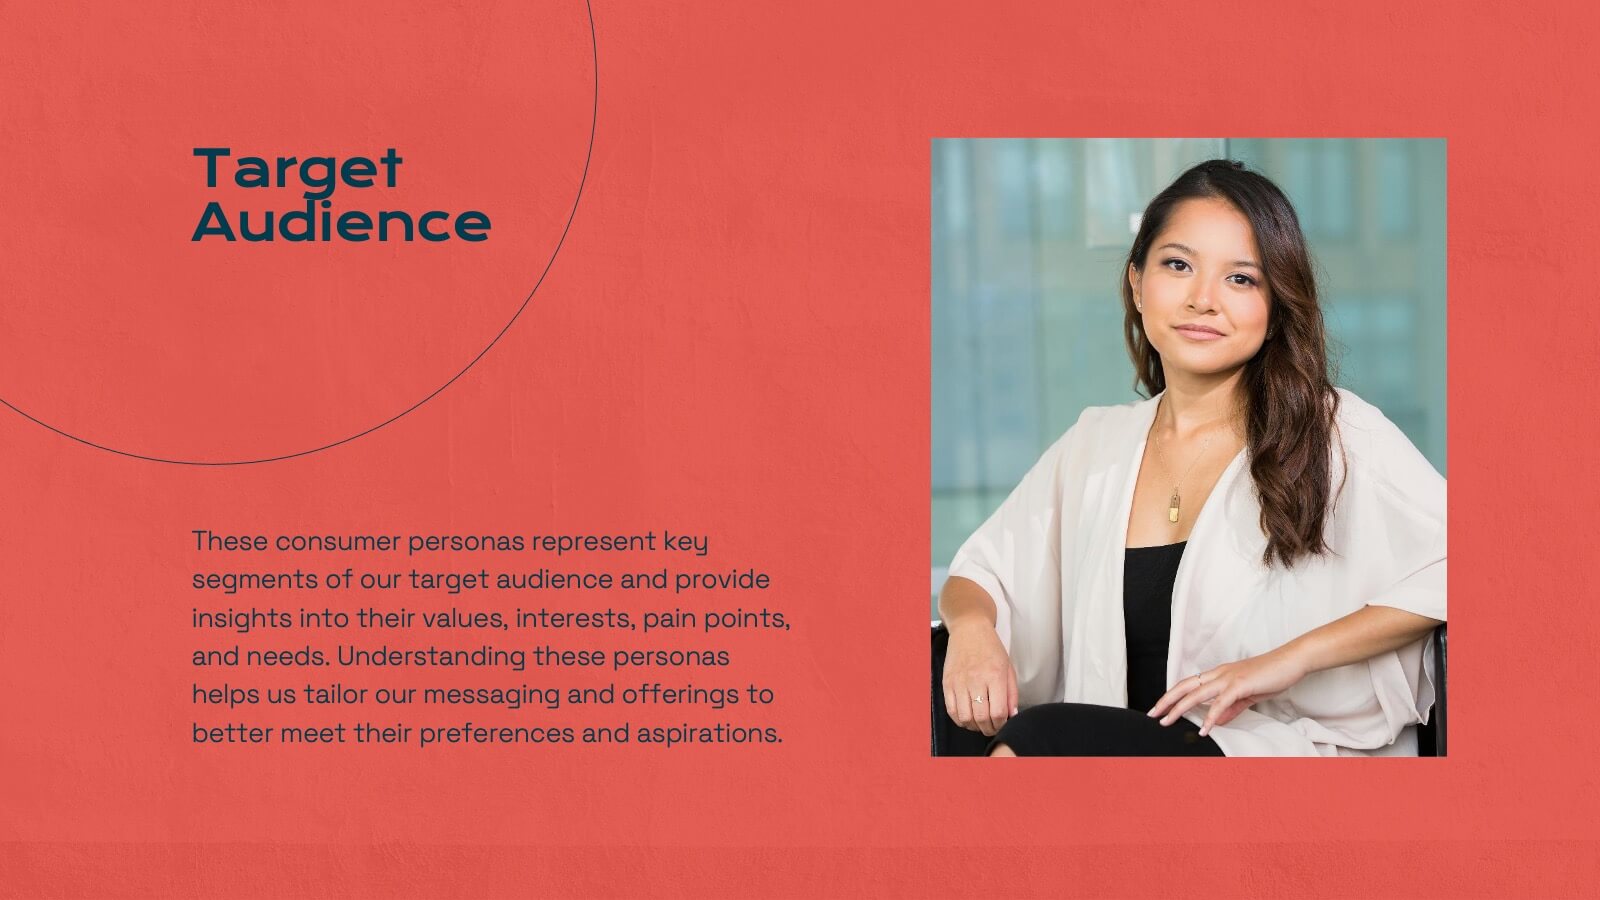
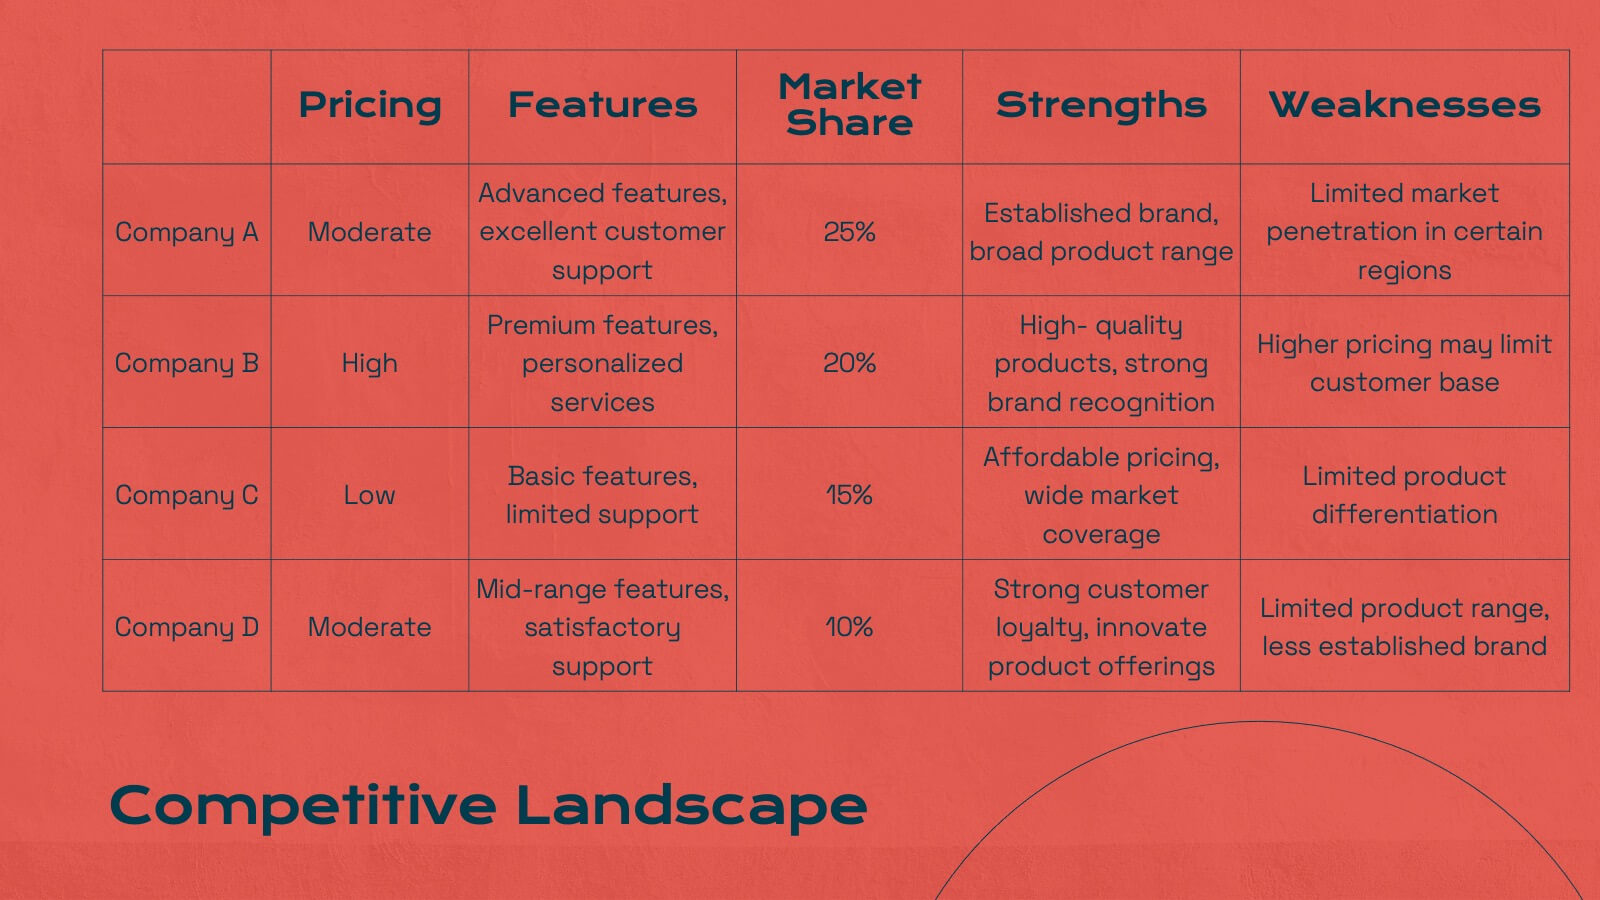
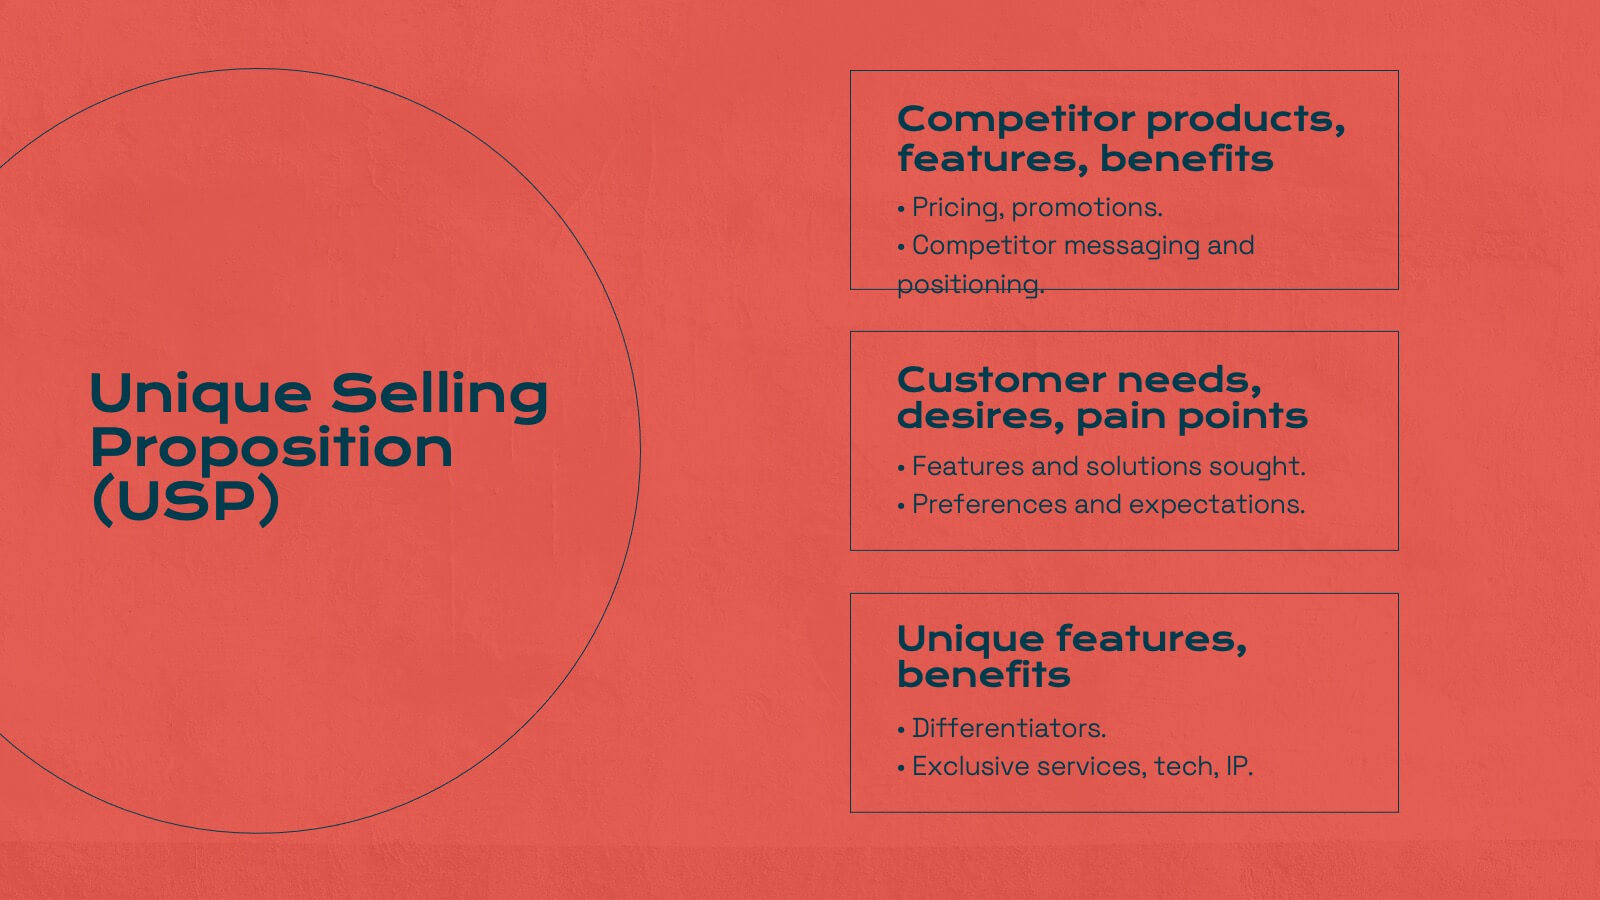
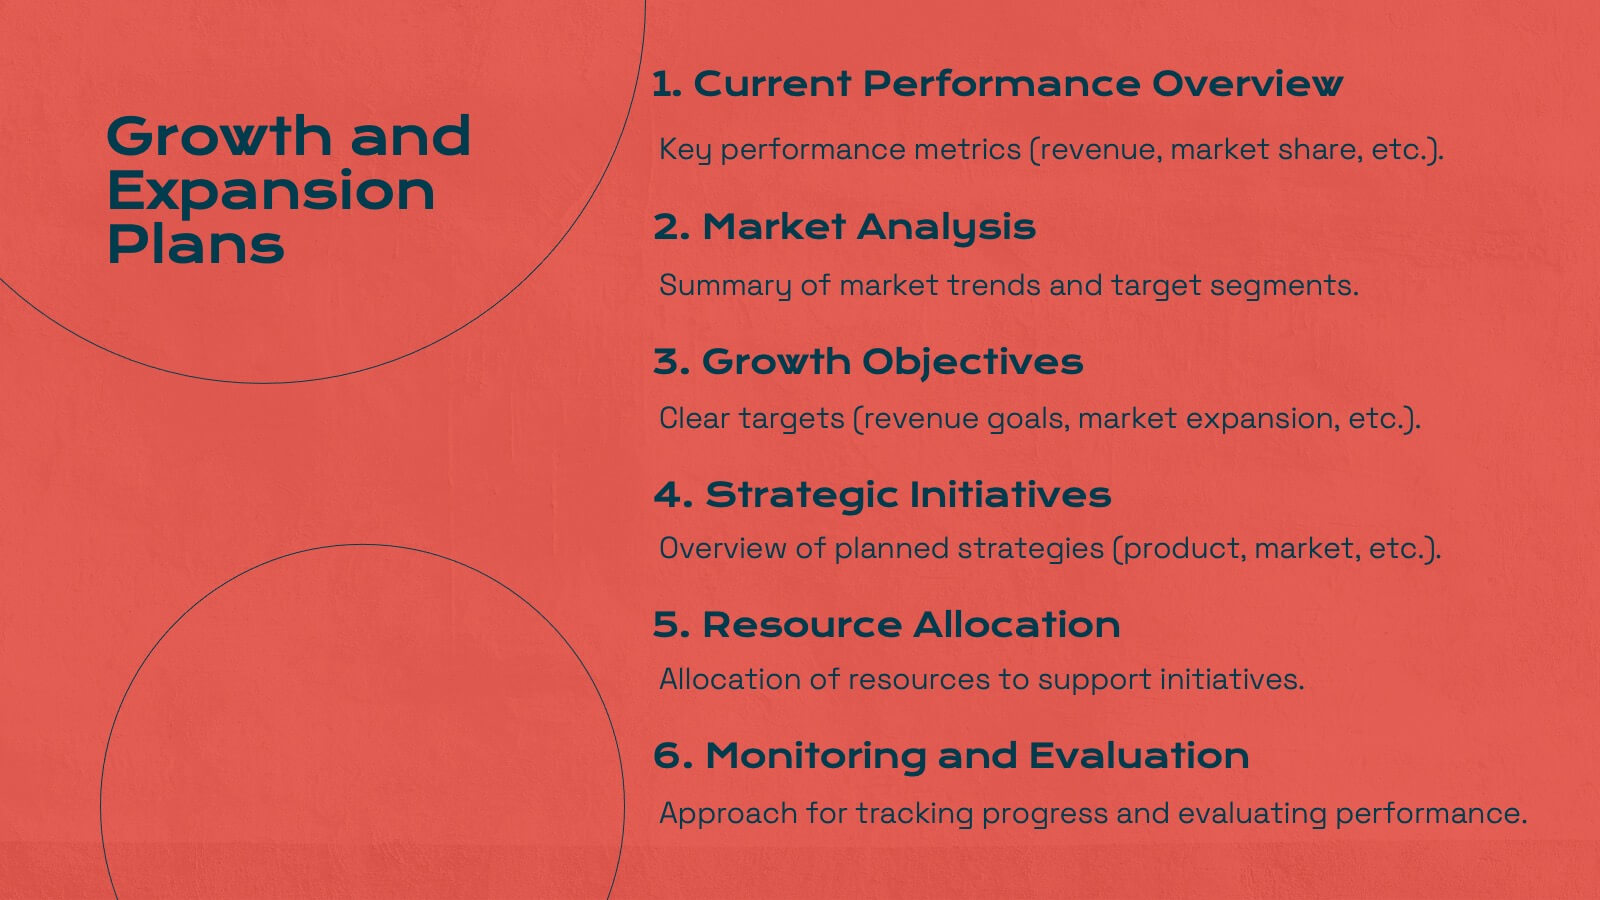
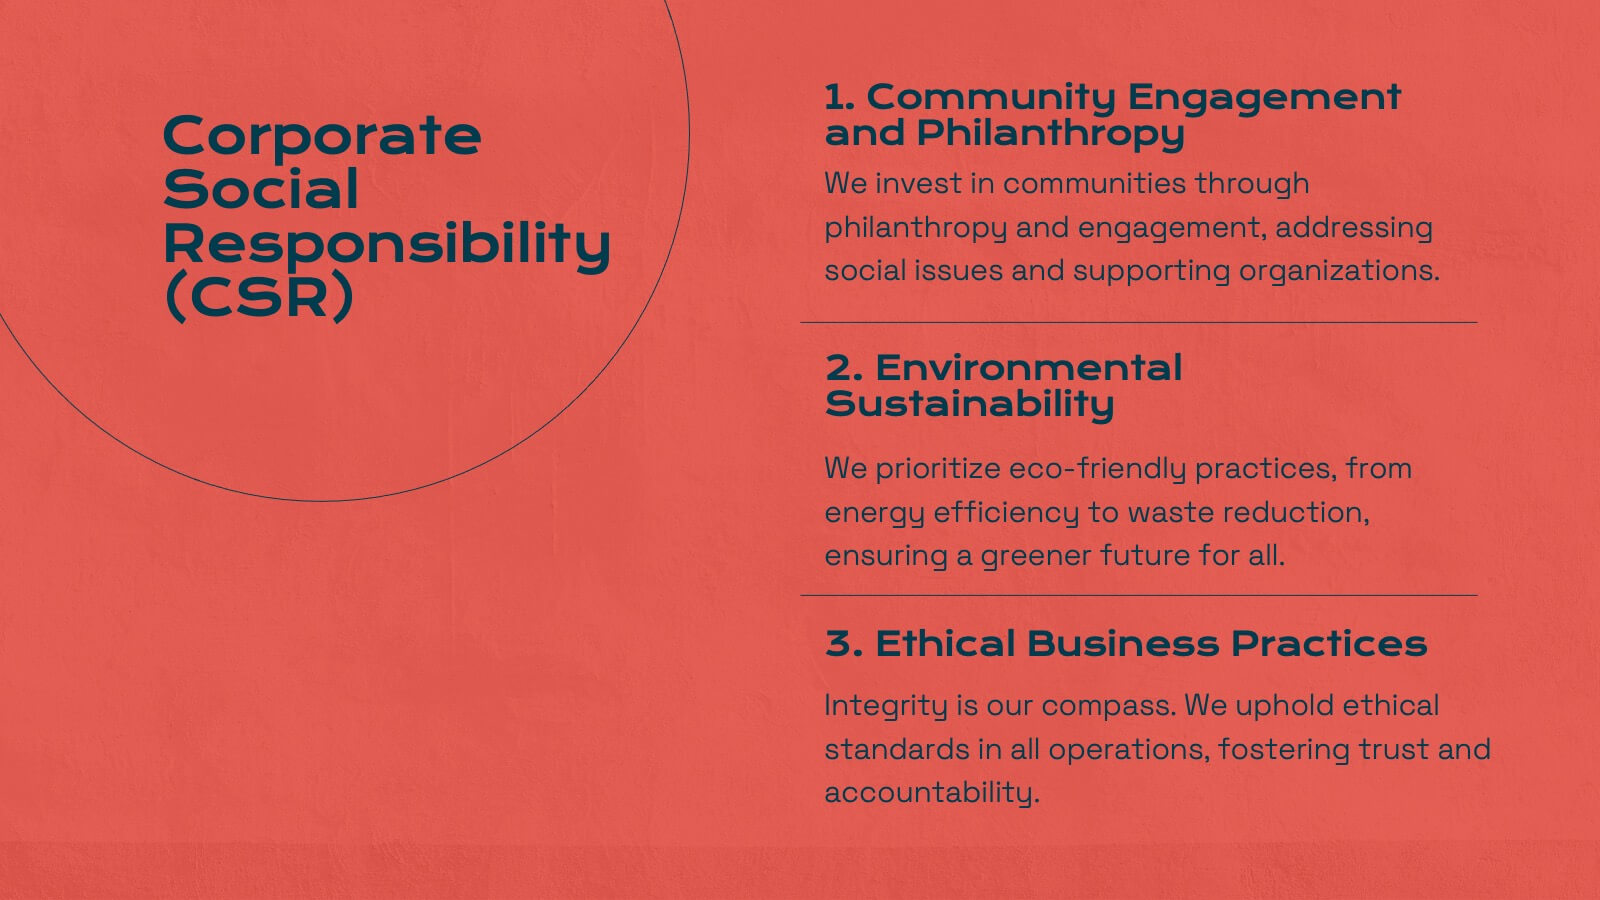
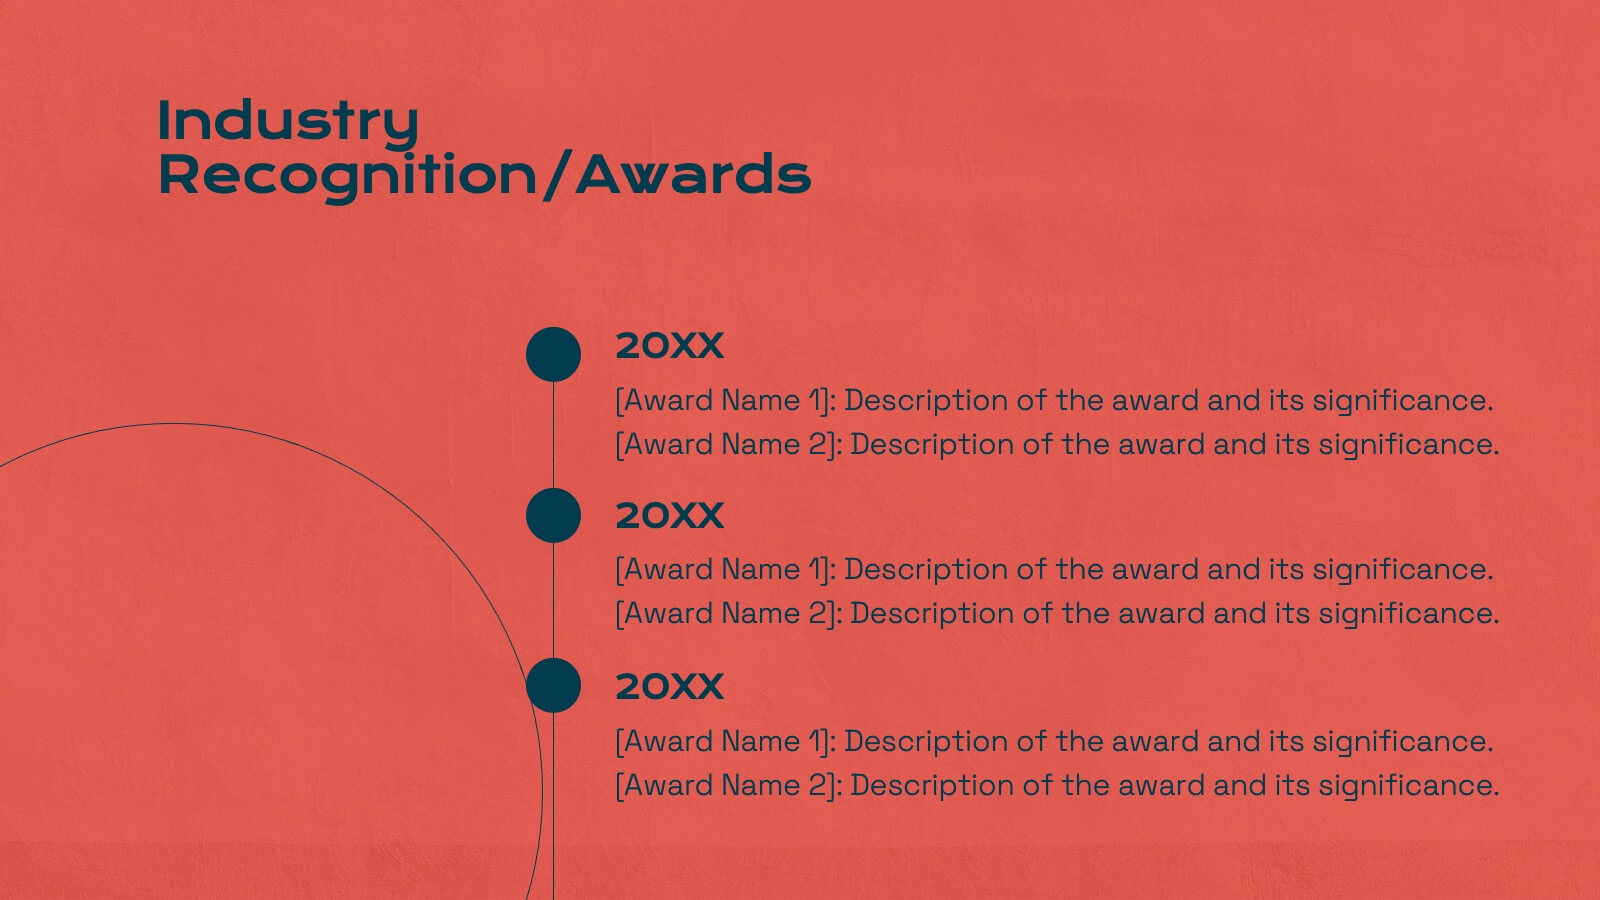
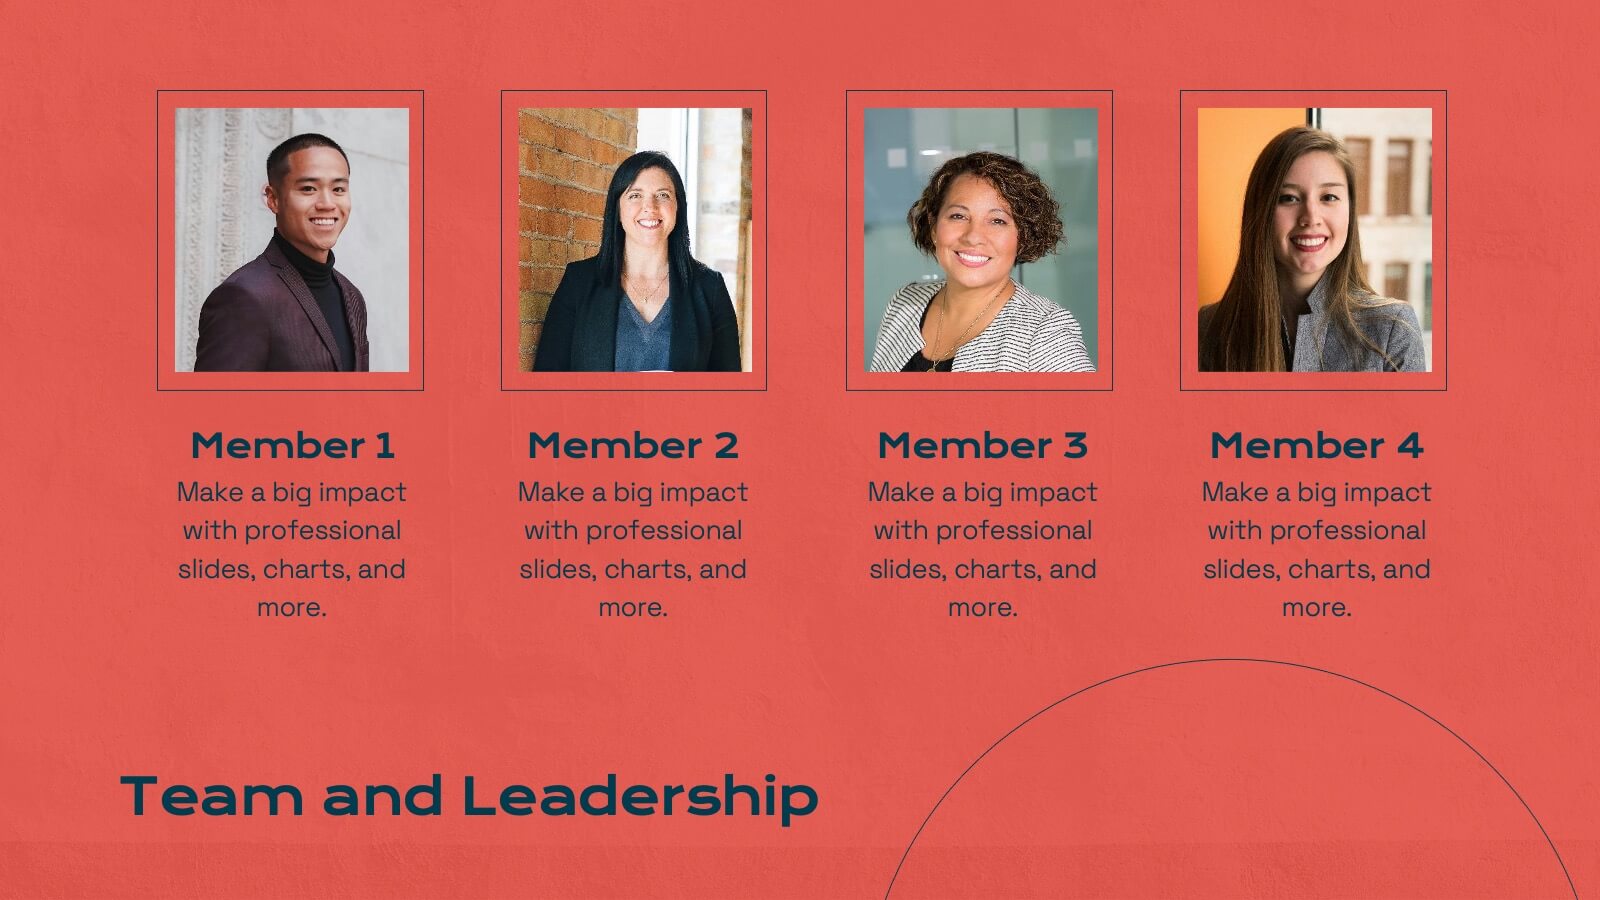
Titan Marketing Research Report Presentation
Energize your marketing research presentations with this bold, vibrant template. Perfect for detailing company history, market presence, and competitive landscapes, it features a striking red design that captures attention. Highlight key insights like target audience, financial highlights, and growth plans to engage your audience. Compatible with PowerPoint, Keynote, and Google Slides, it ensures seamless presentations on any platform.


5 diapositivas
Step-by-Step Planning Roadmap Presentation
Clarify each phase of your strategy with the Step-by-Step Planning Roadmap Presentation. This engaging slide design uses a staircase-style layout with labeled checkpoints (A–E) and matching text boxes to clearly communicate sequential goals or stages. Great for project roadmaps, implementation plans, or business timelines. Fully customizable in PowerPoint, Keynote, and Google Slides.


10 diapositivas
Concentric Circles Business Model Presentation
Visualize Your Business Strategy with Clarity using this Concentric Circles Business Model Presentation template. This design helps you illustrate core business concepts, hierarchical structures, and strategic layers in a simple yet engaging format. Ideal for business planning, process optimization, and strategic growth presentations, this template makes complex relationships clear and easy to understand. Fully editable and available for PowerPoint, Keynote, and Google Slides.


20 diapositivas
Nightshade Design Portfolio Presentation
The Design Portfolio Presentation Template offers 20 slides to showcase your creative work, including design briefs, elements, processes, and feedback. Perfect for professionals to highlight projects with a modern, vibrant layout. Fully editable and compatible with PowerPoint, Keynote, and Google Slides.


6 diapositivas
Lean Six Sigma Framework Slide Presentation
Bring your audience in with a bold, energetic layout that makes each stage feel clear and engaging. This presentation explains the DMAIC framework in a streamlined way, helping users outline process improvement steps with confidence and clarity. Fully customizable and compatible with PowerPoint, Keynote, and Google Slides.


22 diapositivas
Tempest Product Strategy Report Presentation
Accelerate your product strategy with this bold presentation template! Ideal for outlining your product's market opportunity, unique selling proposition, and revenue model, it includes slides for competitive analysis, marketing strategy, and financials. Impress stakeholders with dynamic visuals and clear, structured content. Compatible with PowerPoint, Keynote, and Google Slides for seamless presentations on any platform.


2 diapositivas
Jobs to Work From Home Illustrations
Empower your remote workforce with our jobs to work from home illustrations pack. These are designed to ignite the spark of remote work possibilities and bring a burst of energy to your presentations! Fully compatible with PowerPoint, Google Slides, and Keynote, they're easy to add to any presentation. Step into the world of remote work with these dynamic illustrations that capture the essence of modern work trends. Download the jobs to work from home illustrations today!


5 diapositivas
Product Marketing Slide Presentation
Spark interest instantly with a bold, circular layout that transforms product insights into a clean, memorable story. This presentation helps you explain features, audience needs, and value propositions in an organized, visual flow that keeps attention on what matters most. Fully customizable for PowerPoint, Keynote, and Google Slides.