


Características


¿Tienes alguna pregunta?
Recomendar


6 diapositivas
Next-Gen Wireless Solutions Overview Presentation
Give your wireless solutions pitch a sleek, professional edge with this futuristic globe-style layout. Perfect for tech-driven topics, this infographic highlights six key areas in a clear, visually engaging format. Fully customizable and easy to use in PowerPoint, Keynote, and Google Slides—ideal for product overviews, innovation briefings, or strategy updates.


6 diapositivas
Corporate Team Management Presentation
Highlight the interconnected roles of your corporate team with this sleek Corporate Team Management slide. The circular flow design emphasizes collaboration, leadership, and operational structure—making it ideal for showcasing team roles, department functions, or workflow cycles. Each of the six editable segments includes a title and description area with clean iconography. Fully compatible with PowerPoint, Keynote, and Google Slides.


7 diapositivas
Business Continuity Plan Infographic Presentation
A well-written business plan helps entrepreneurs focus on their next steps, anticipate challenges and overcome them before they occur. This template will guide you through the process of writing a professional, successful and effective business plan. This template design is highly visual, vibrant and engaging with neutral colors. It uses the best parts of a business plan, such as graphs and charts, to visualize your ideas. This business plan infographic is a sharp visual aid for investors, partners, board members and anyone else who needs to know more about what you do and how you plan to grow.


8 diapositivas
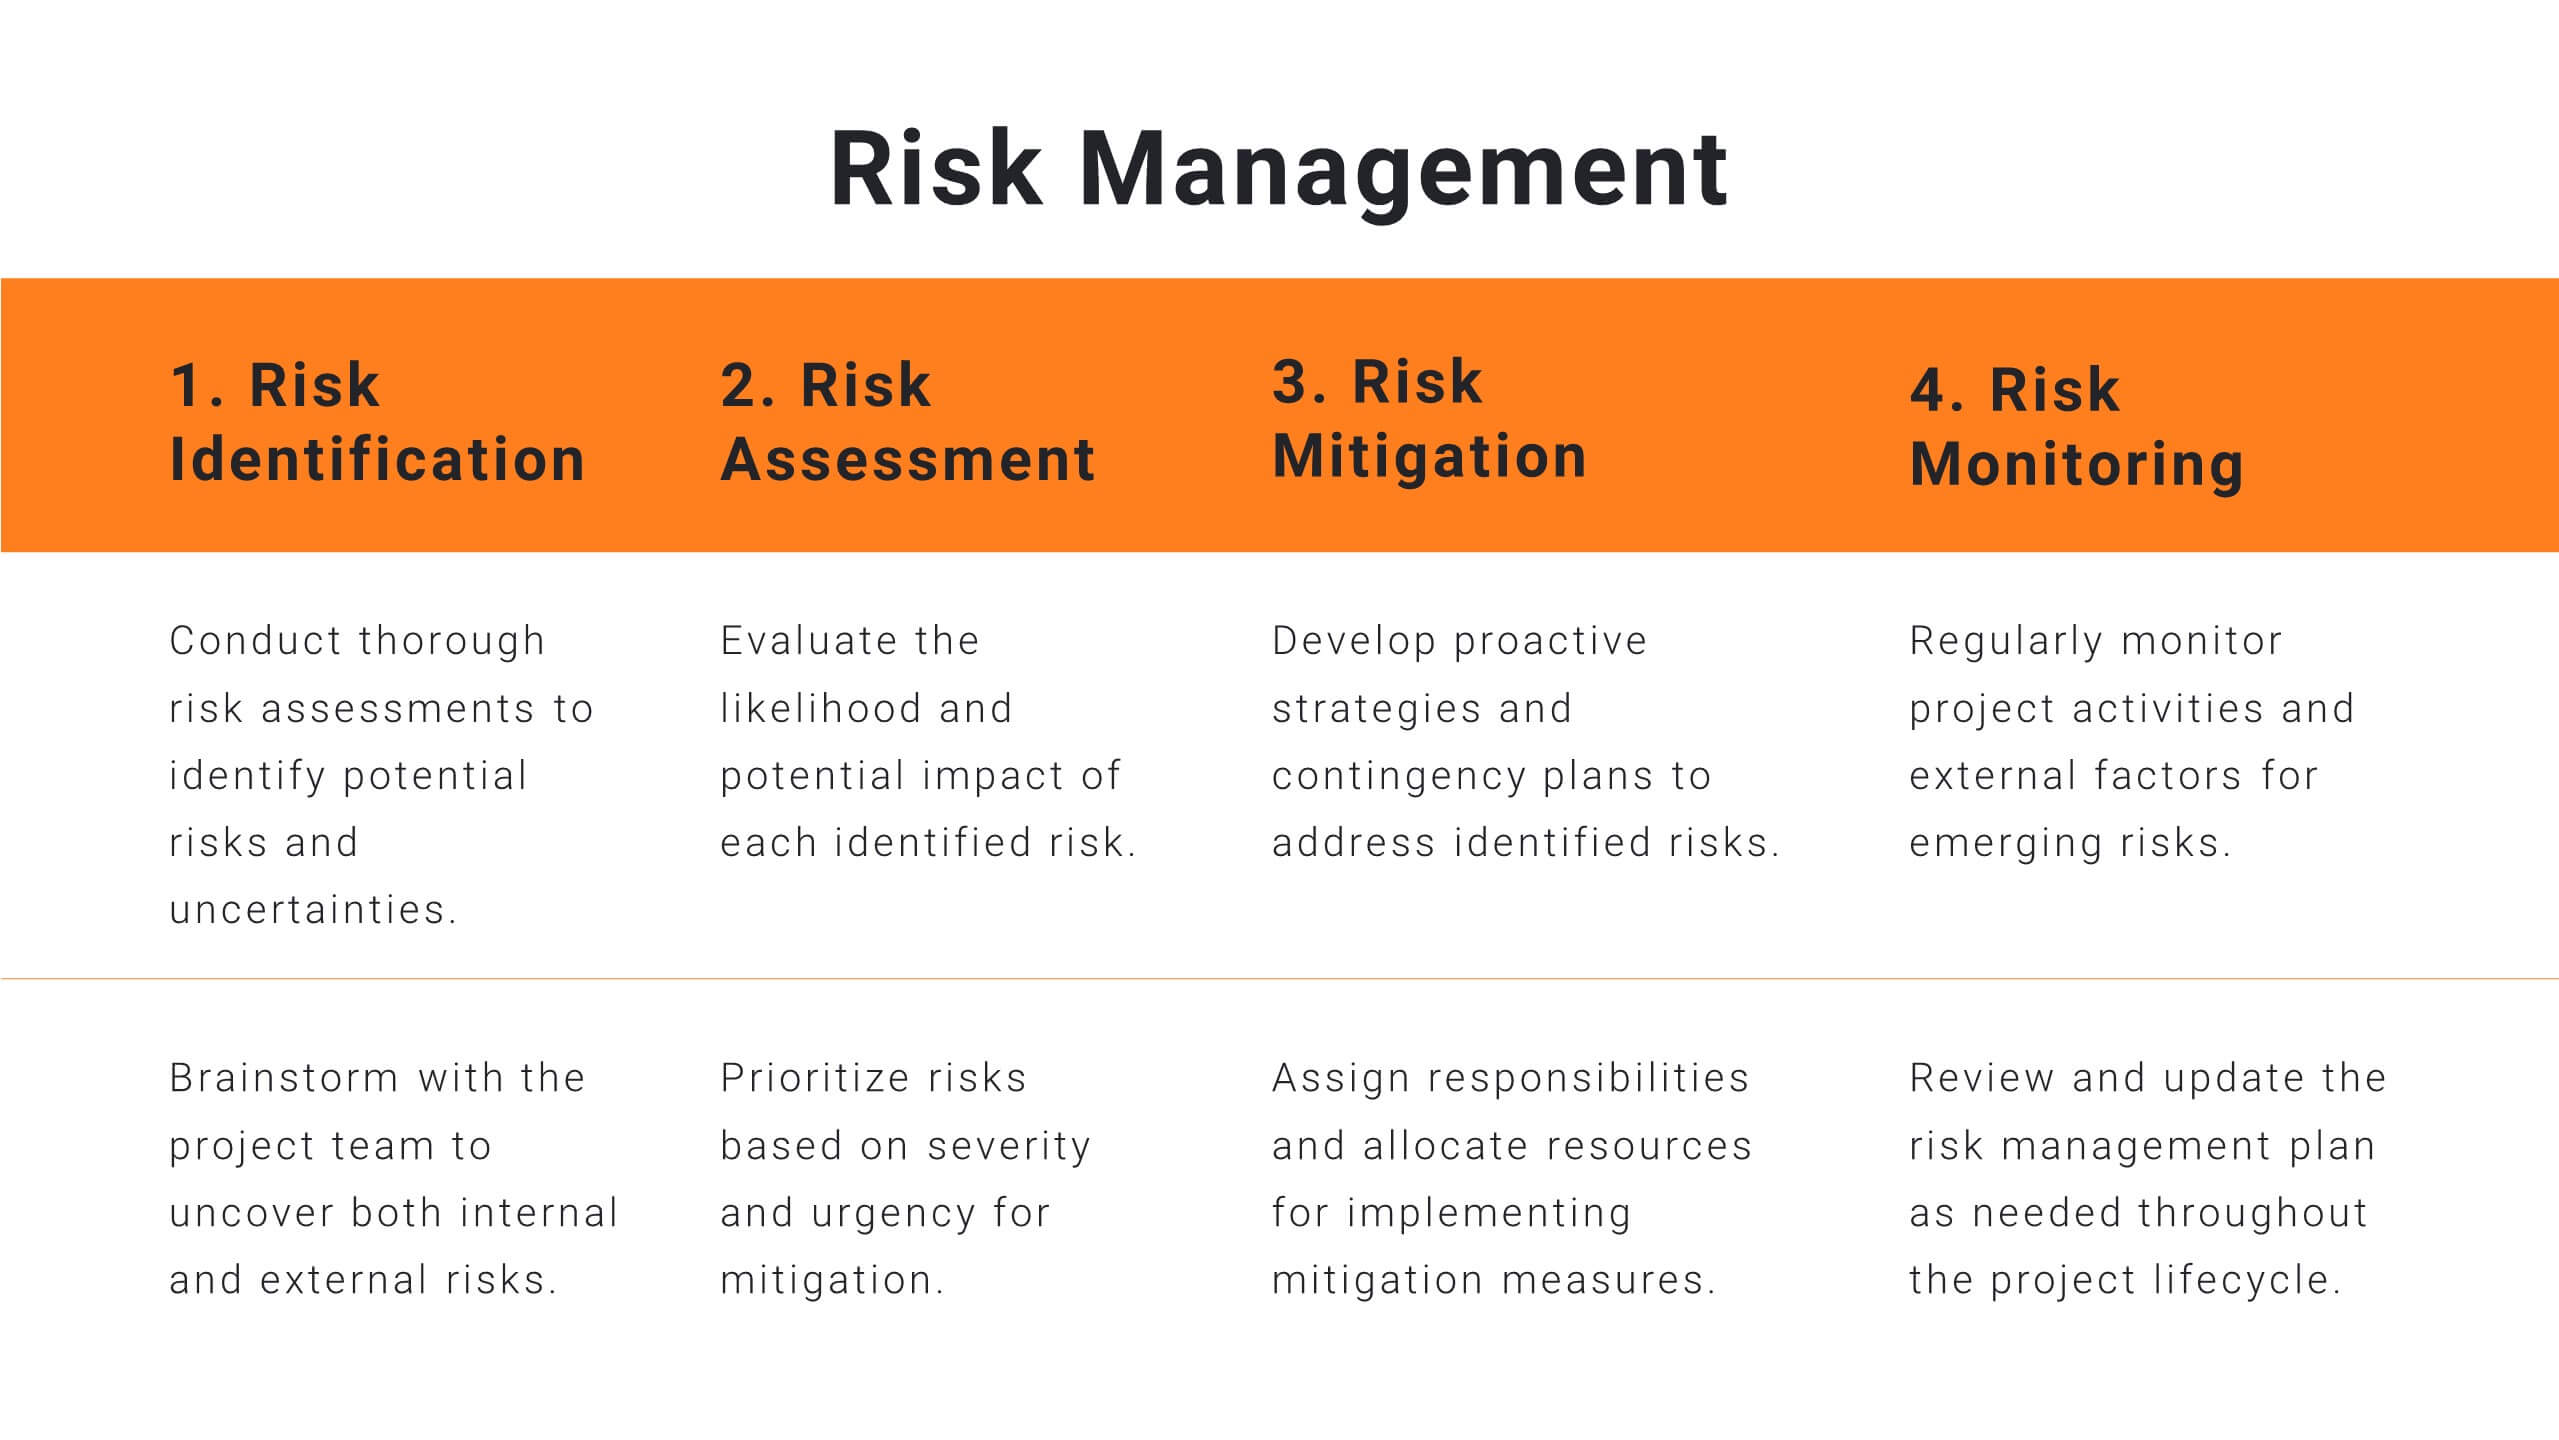
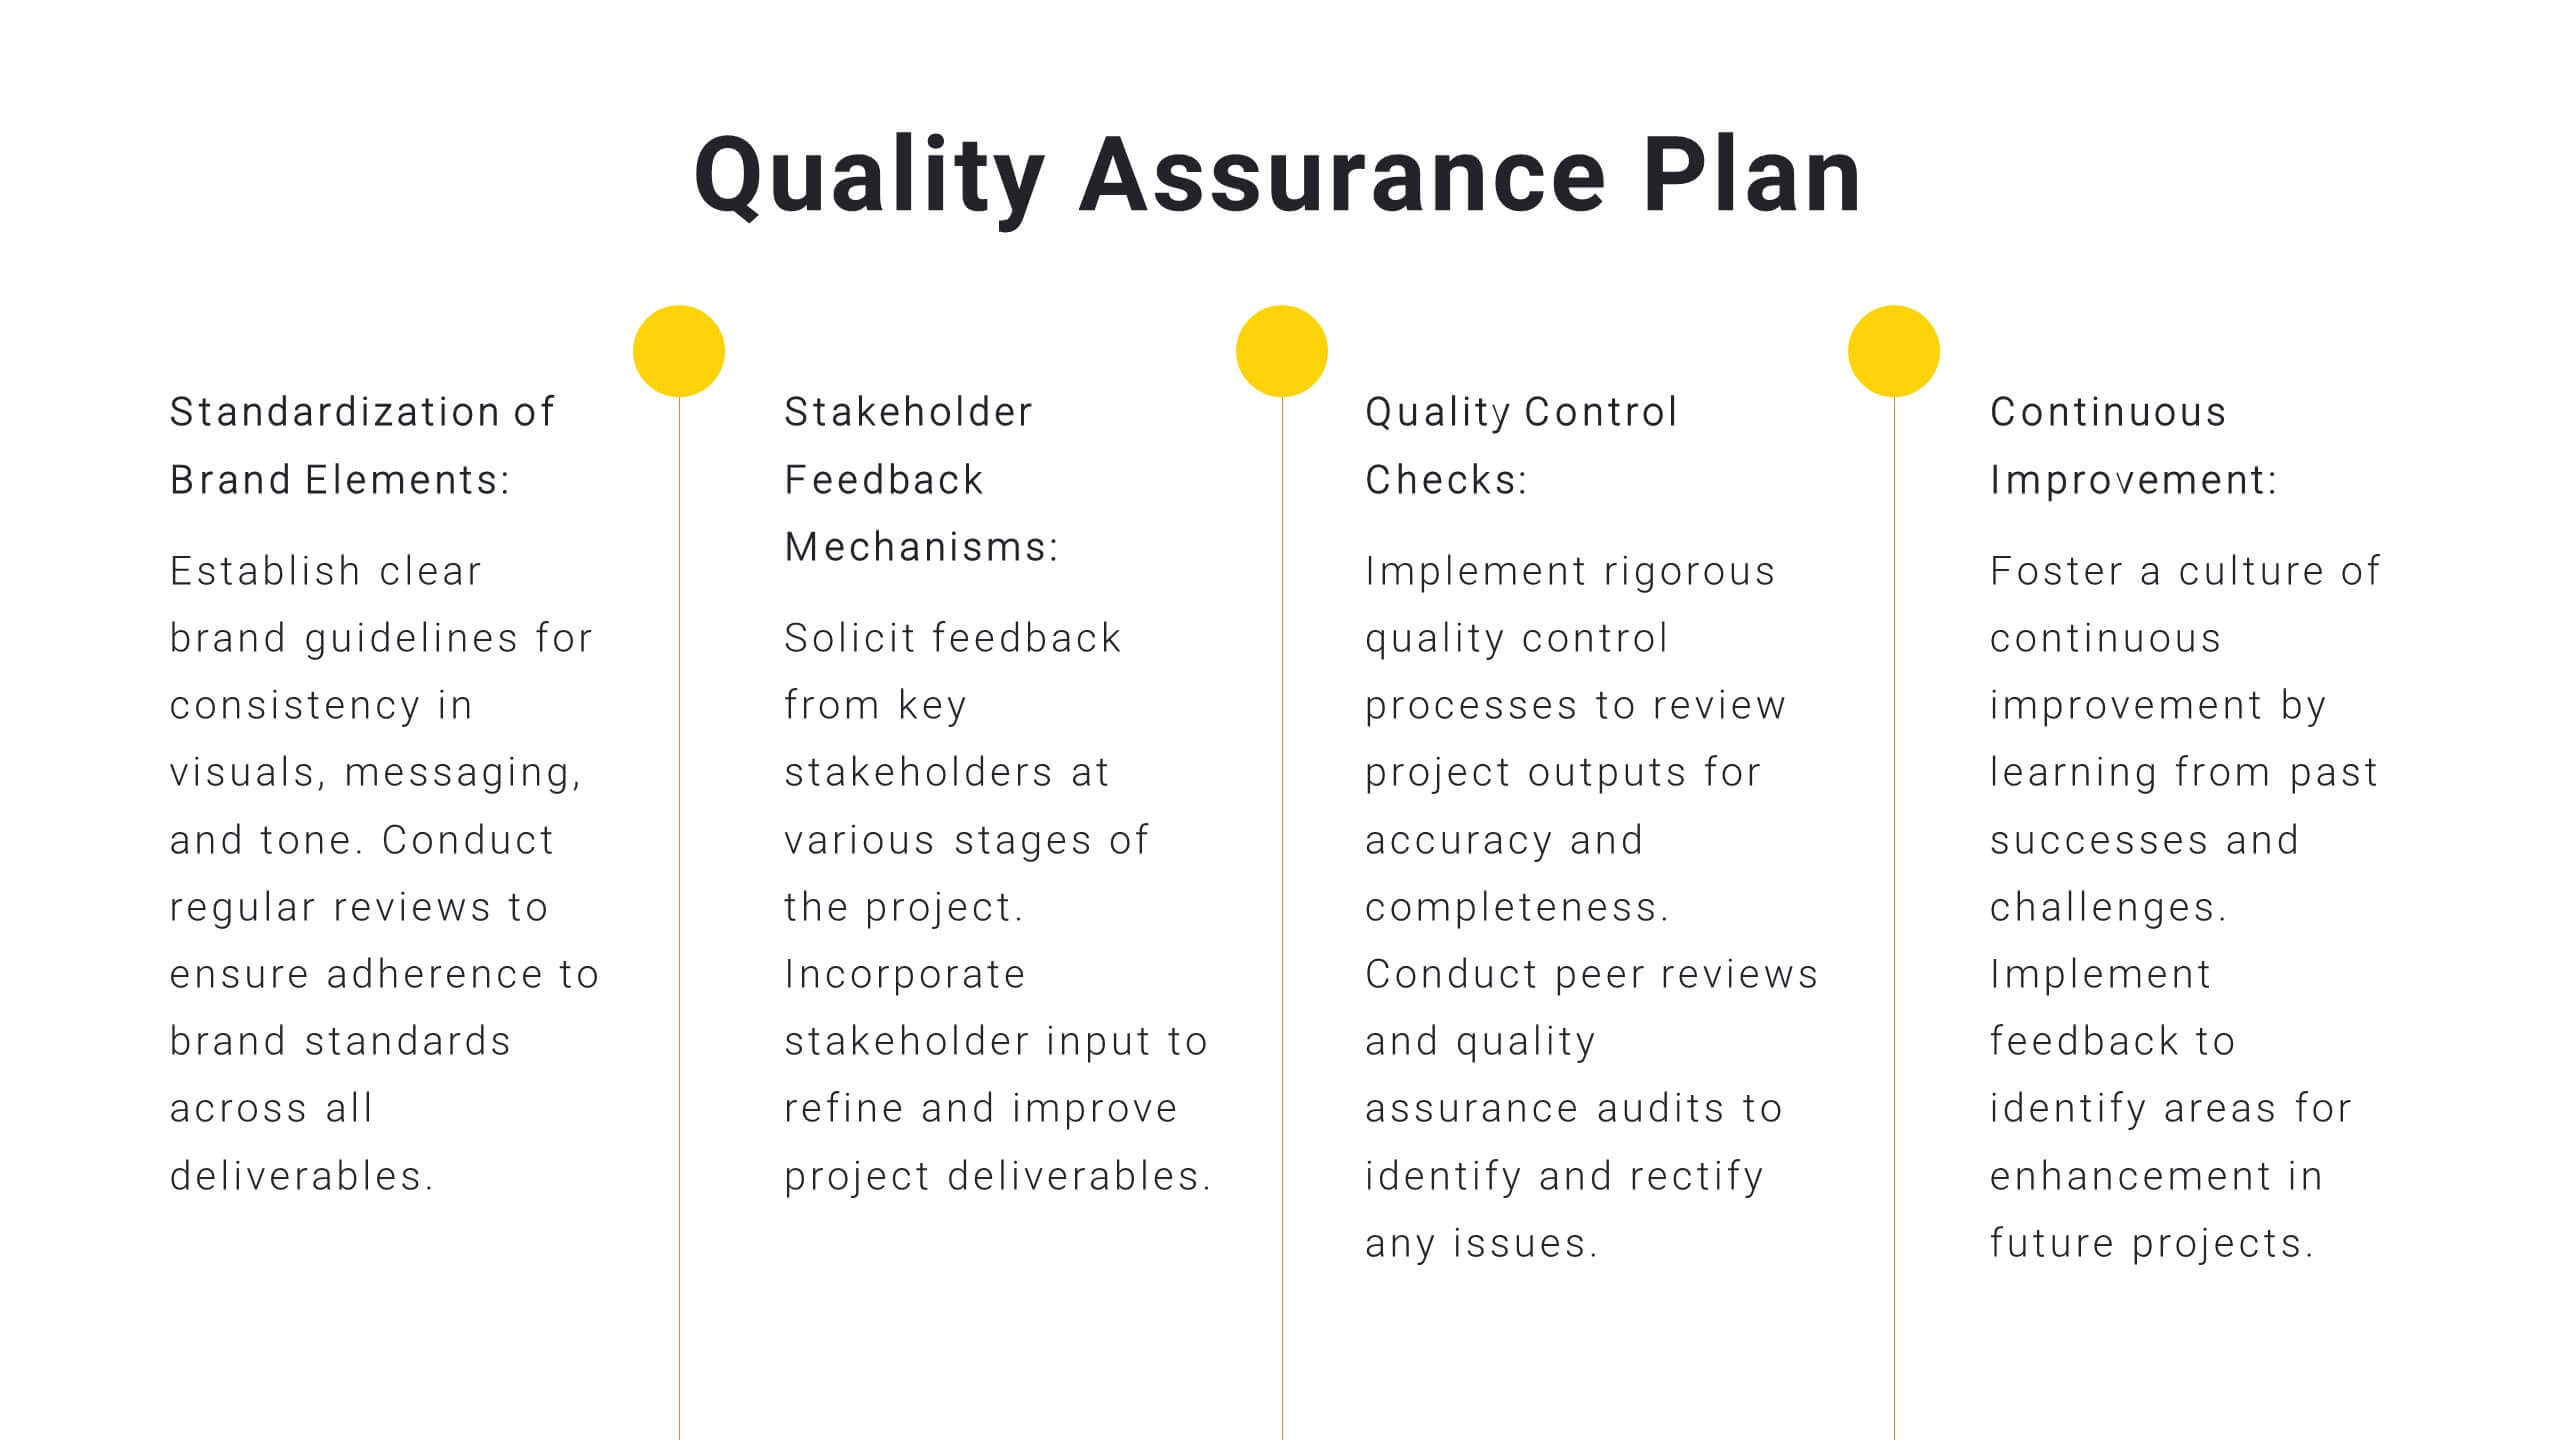
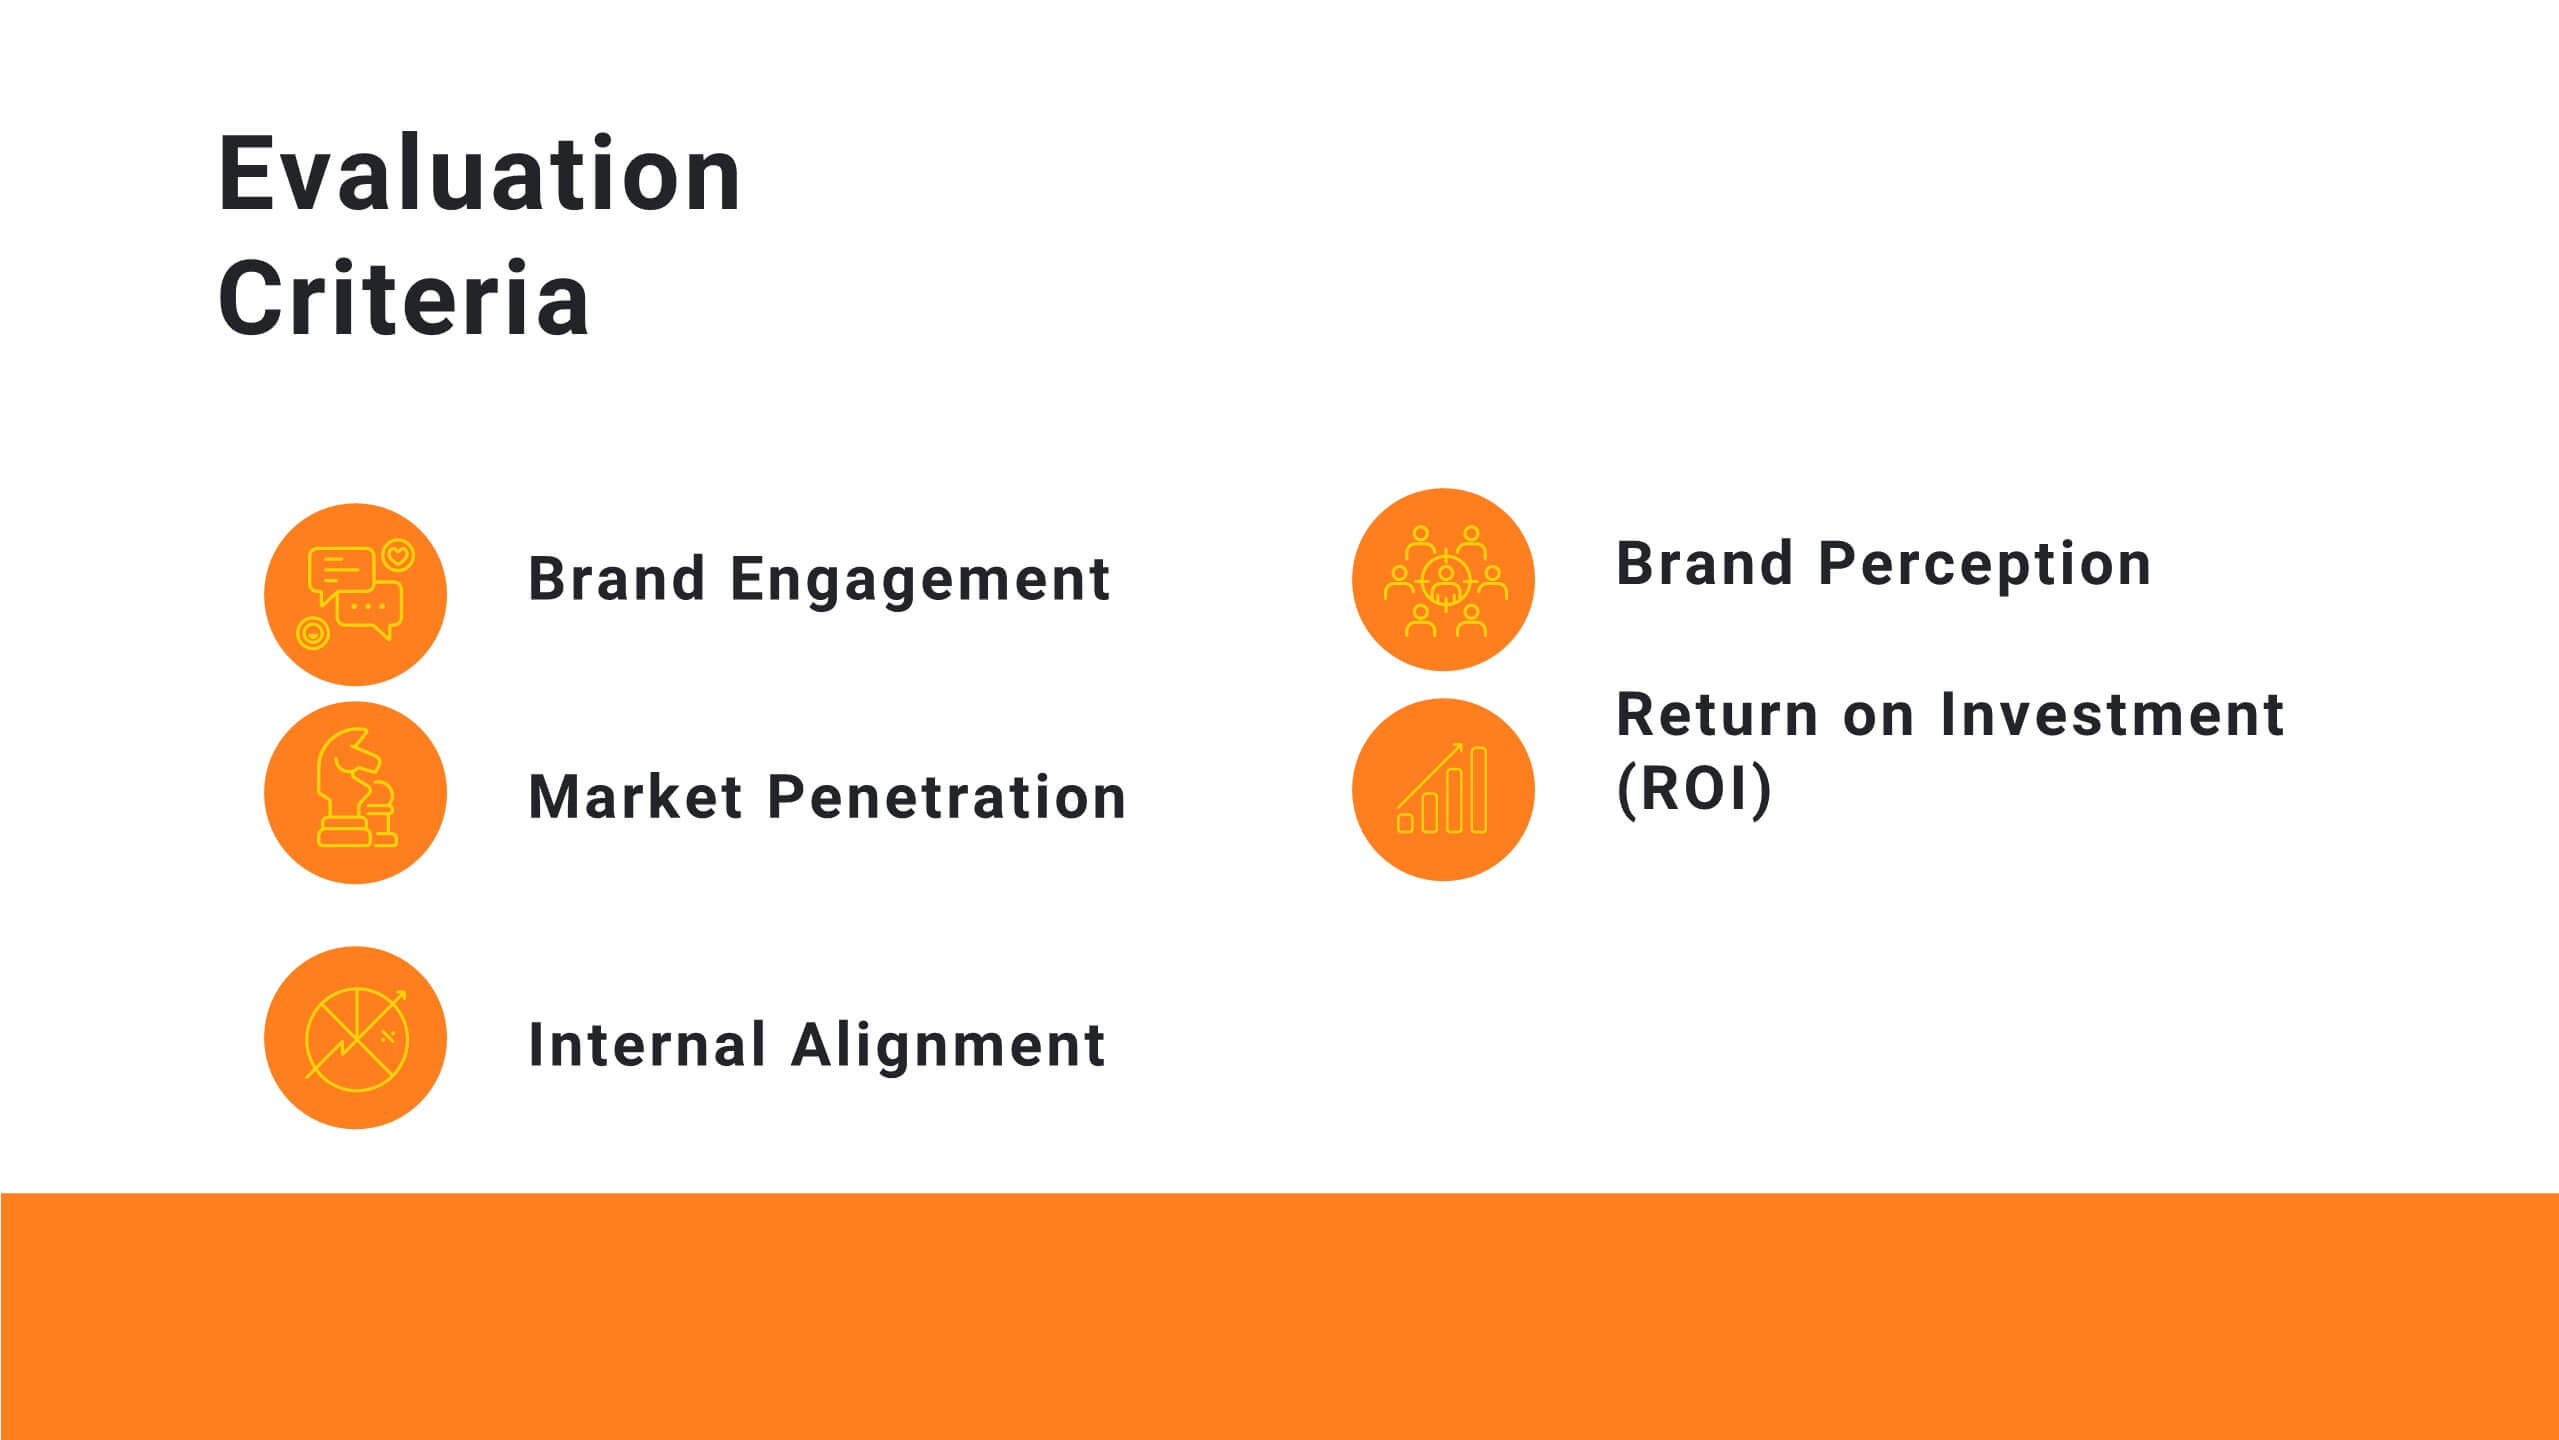
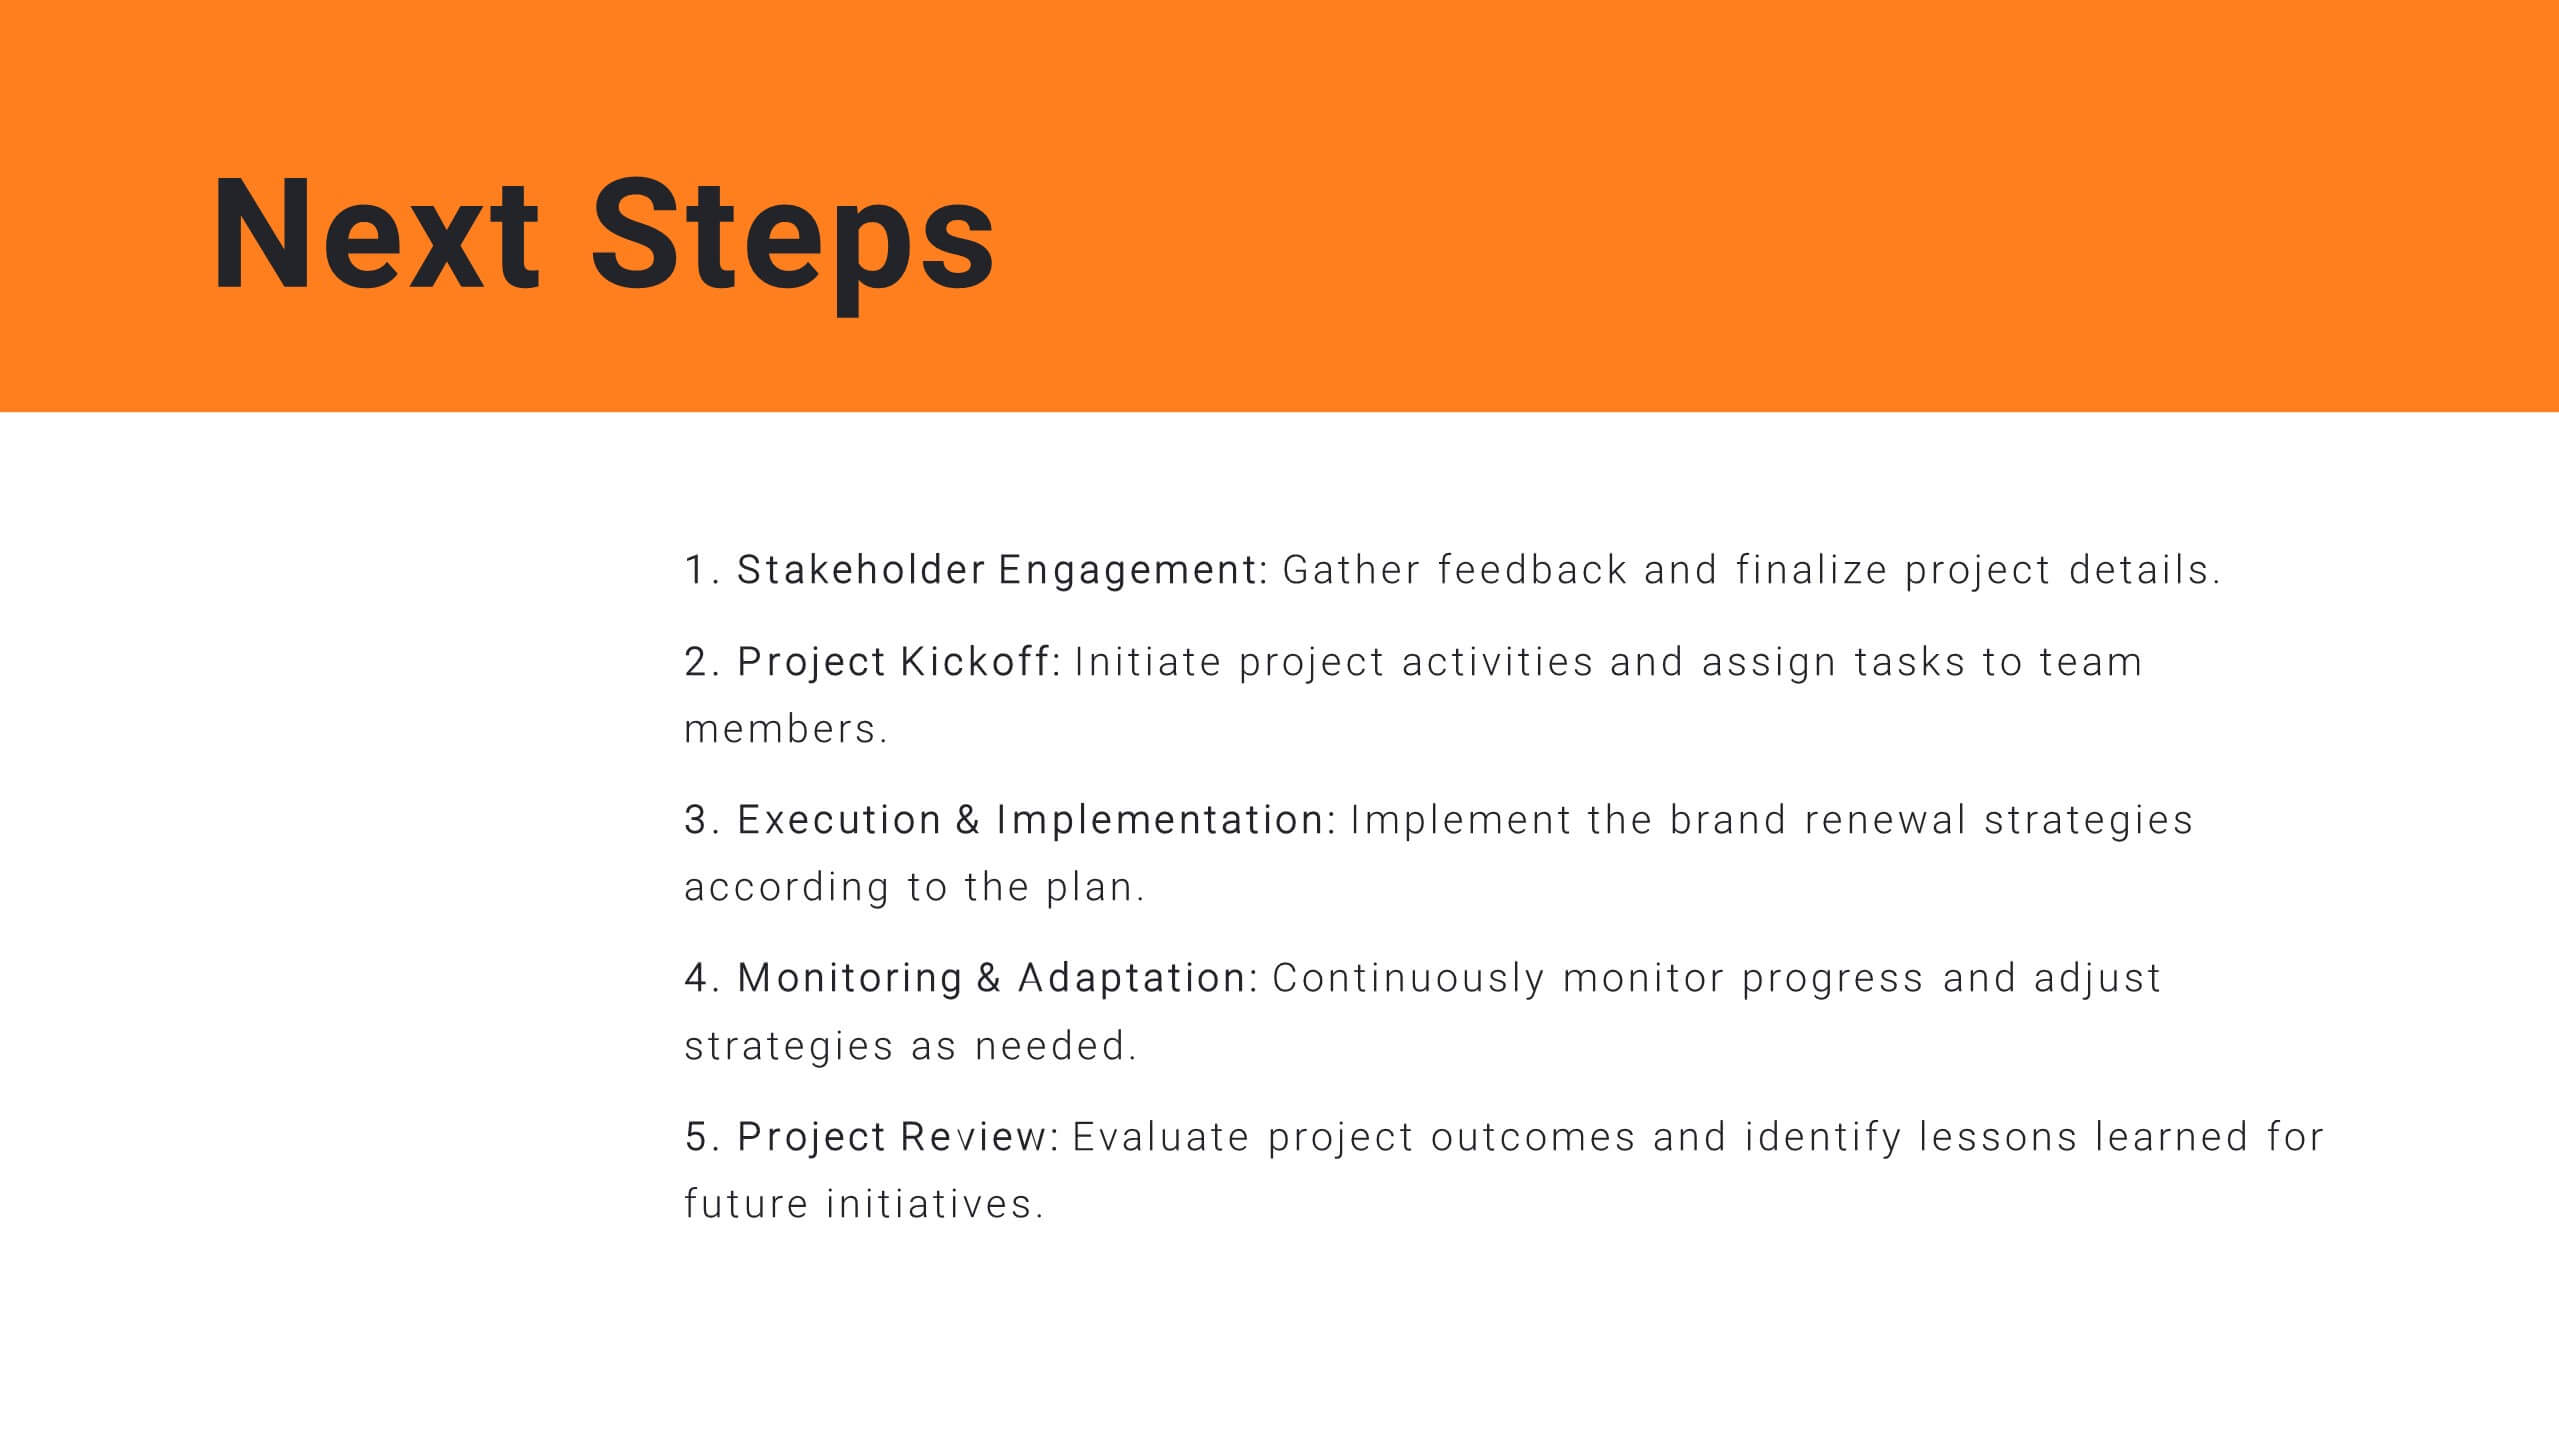
Corporate Risk Assessment and Planning Presentation
Navigate business uncertainties with the Corporate Risk Assessment and Planning template, offering a vivid and structured layout designed for professionals to meticulously detail and analyze potential risks in various business scenarios. It uses hexagonal and circular elements to emphasize the interconnectedness of various risk factors, supporting clear visualization and effective strategic planning. This template is compatible with PowerPoint, Keynote, and Google Slides, making it a versatile tool for comprehensive risk management presentations.


5 diapositivas
Strategic Framework Slide Presentation
Turn your strategy into a story that flows with clarity and precision using this clean, timeline-based presentation design. Ideal for illustrating project phases, corporate planning, or growth roadmaps, it keeps information structured and engaging. Fully editable and compatible with PowerPoint, Keynote, and Google Slides for seamless customization.


15 diapositivas
Business Plan Infographic Presentation
Businesses are important components of a healthy economy and society. They create jobs, drive innovation, encourage entrepreneurship, and contribute to the well-being of society. With this template you can create a clear and effective business Infographic for your pitches, or projects. The design is made to enhance your message and inspire your audience. This template can be used for presenting any business information whether it be data, statistics, facts etc. It is compatible with Powerpoint, keynote and google slides so all the elements are editable, and can be changed to fit your needs.


7 diapositivas
Work From Home Online Infographic
Work from home online refers to a work arrangement where individuals can perform their job responsibilities remotely, usually from their homes, using internet-connected devices like computers, laptops, tablets, or smartphones. Unveil the modern realm of remote work with our work from home online infographic. This visually engaging and informative template takes you on a journey through the digital landscape of remote work, showcasing its advantages, best practices, and the tools that enable seamless virtual collaboration. This infographic isn't just a visual guide it's a roadmap to thrive in the evolving world of work.


6 diapositivas
Funding Request Project Proposal
Visually communicate your project's financial needs using this tiered Funding Request Project Proposal slide. With a stacked layout ideal for outlining budget categories or funding stages, it’s perfect for grant applications, investor decks, or internal pitches. Fully customizable in PowerPoint, Keynote, and Google Slides.


5 diapositivas
Geometric Design Elements
Make your message stand out with this bold, 3D geometric infographic layout. Ideal for visualizing layered concepts, structural data, or multi-dimensional strategies. Each triangular section is color-coded and fully editable to align with your brand or topic. Compatible with PowerPoint, Keynote, and Google Slides.


6 diapositivas
Sales Funnel Performance Presentation
Visualize your customer journey with this Sales Funnel Performance Presentation. The clean funnel diagram allows you to clearly represent each stage—awareness, interest, decision, and action—using vibrant, stacked layers. Customize the six labeled steps and supporting icons to fit your brand strategy. Perfect for showcasing conversion metrics or campaign insights in PowerPoint, Keynote, or Google Slides.


21 diapositivas
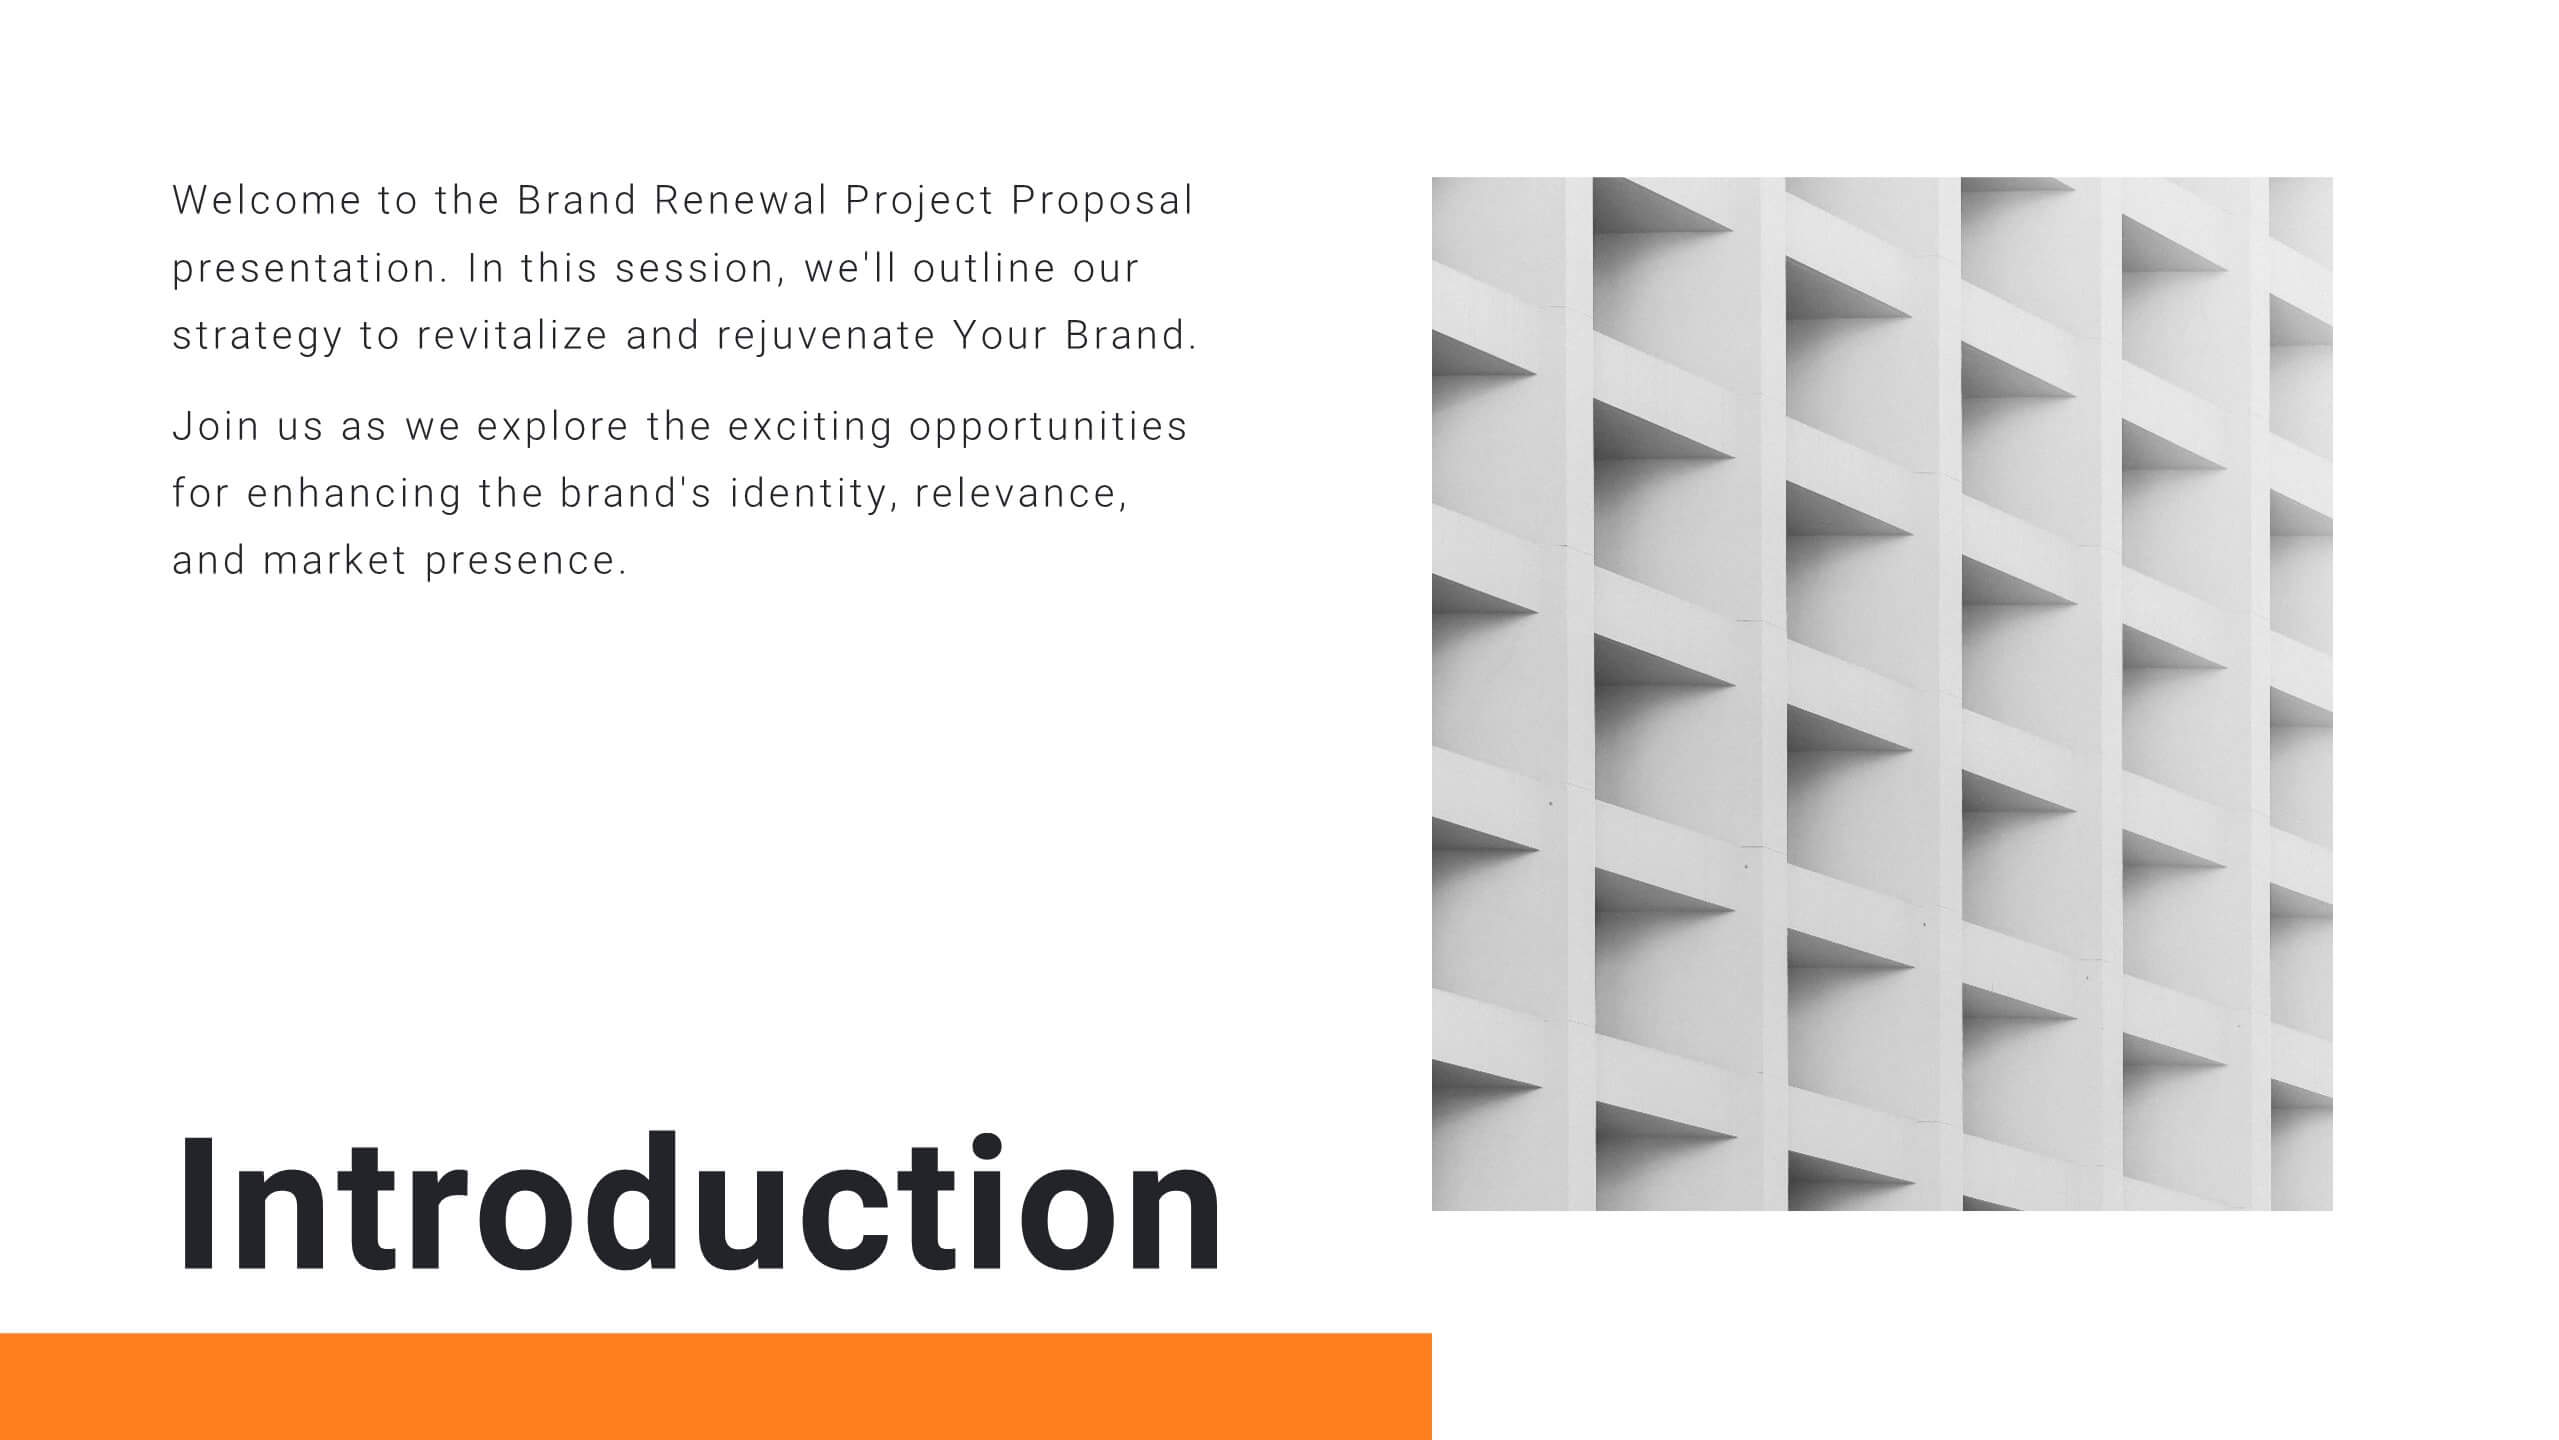
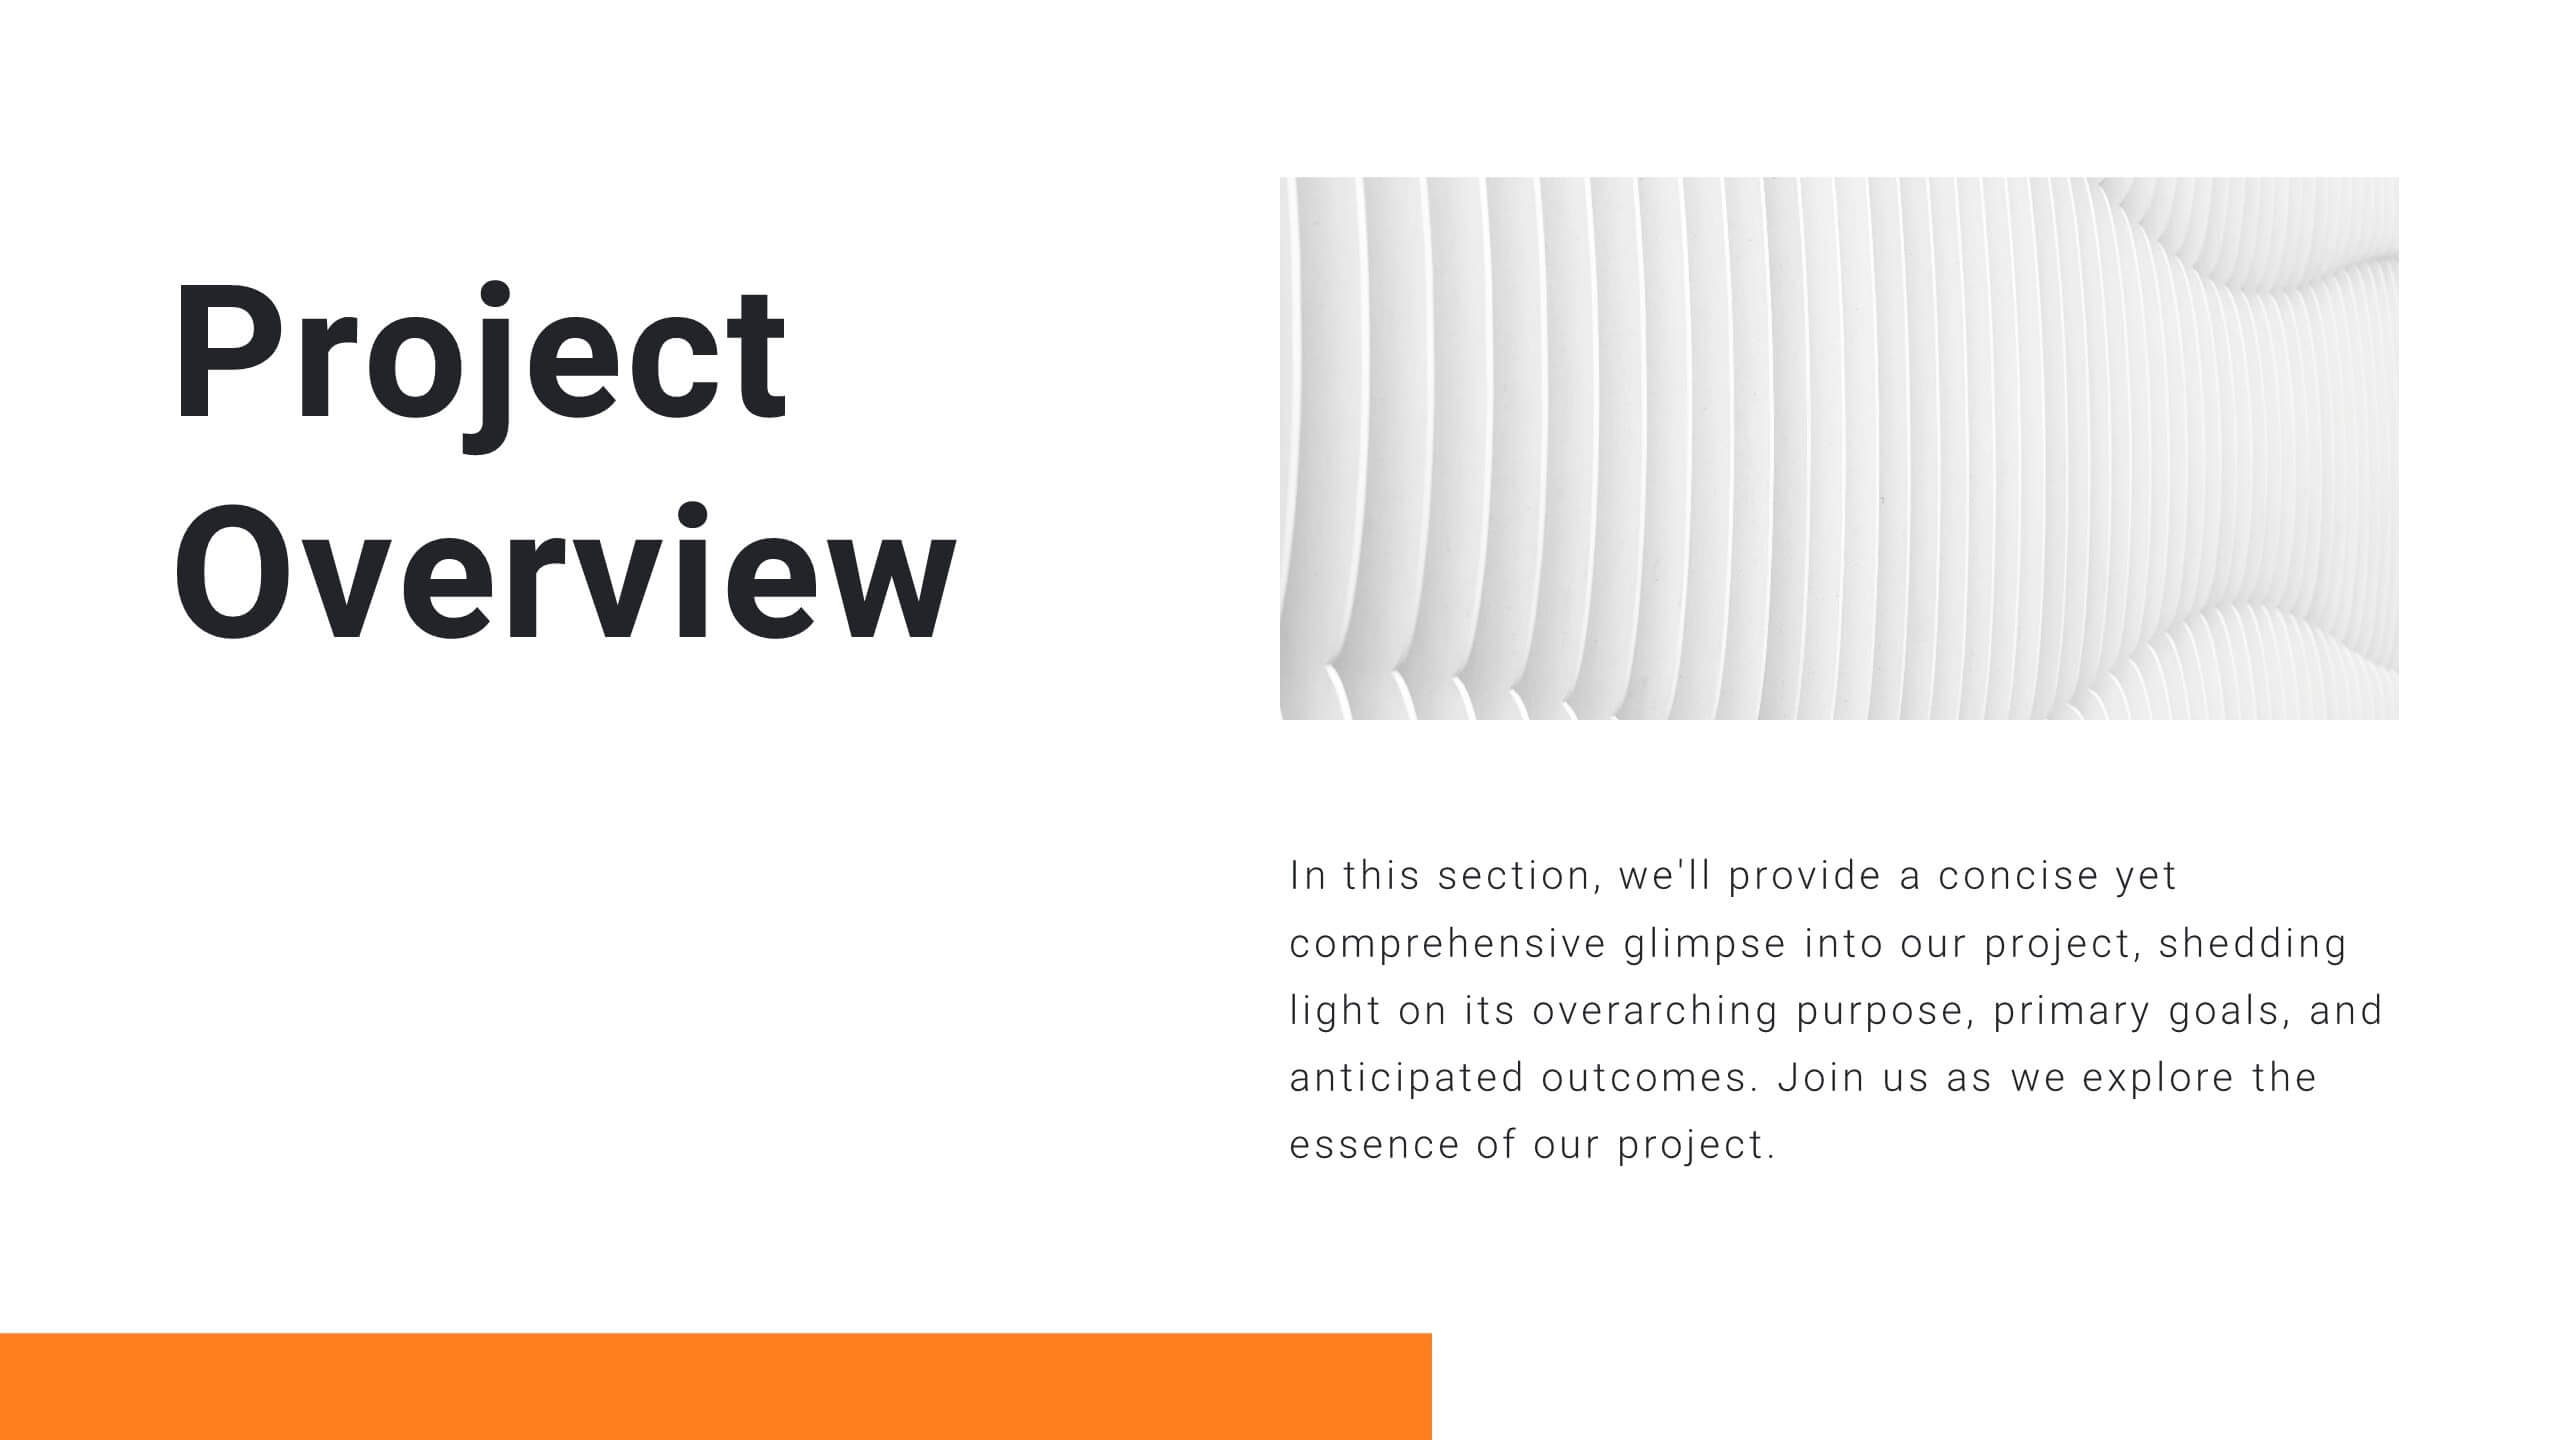
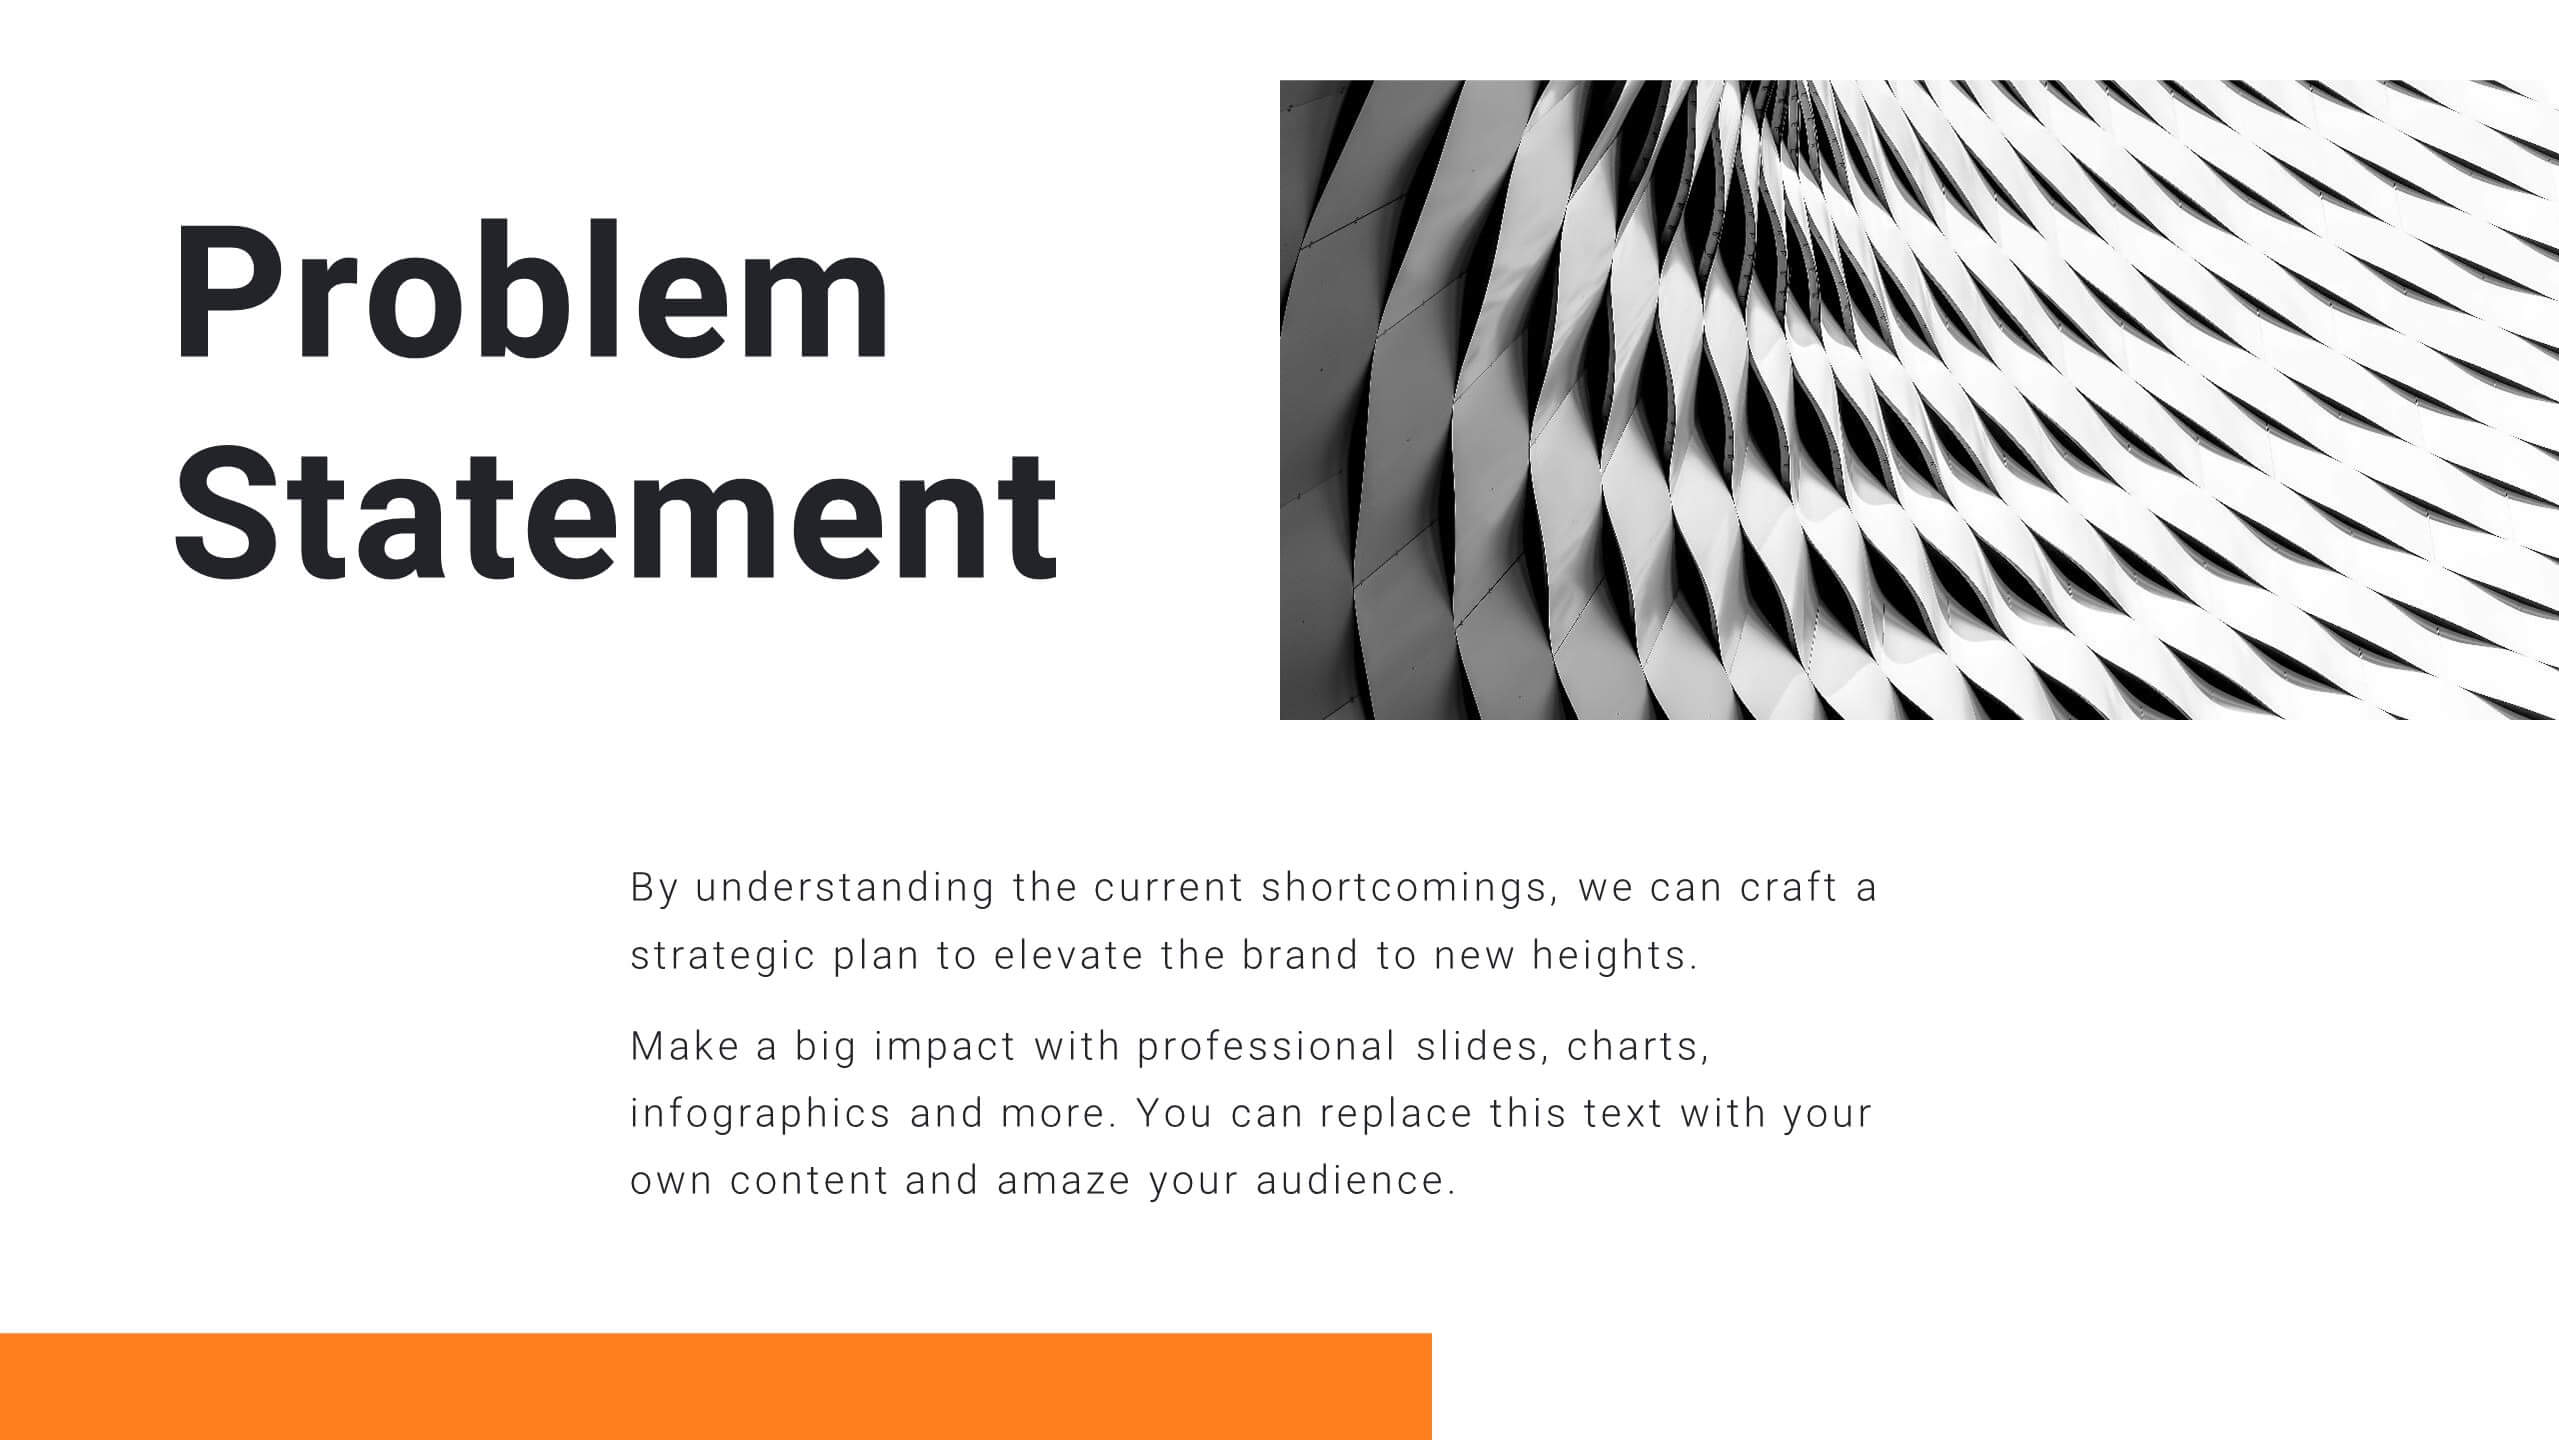
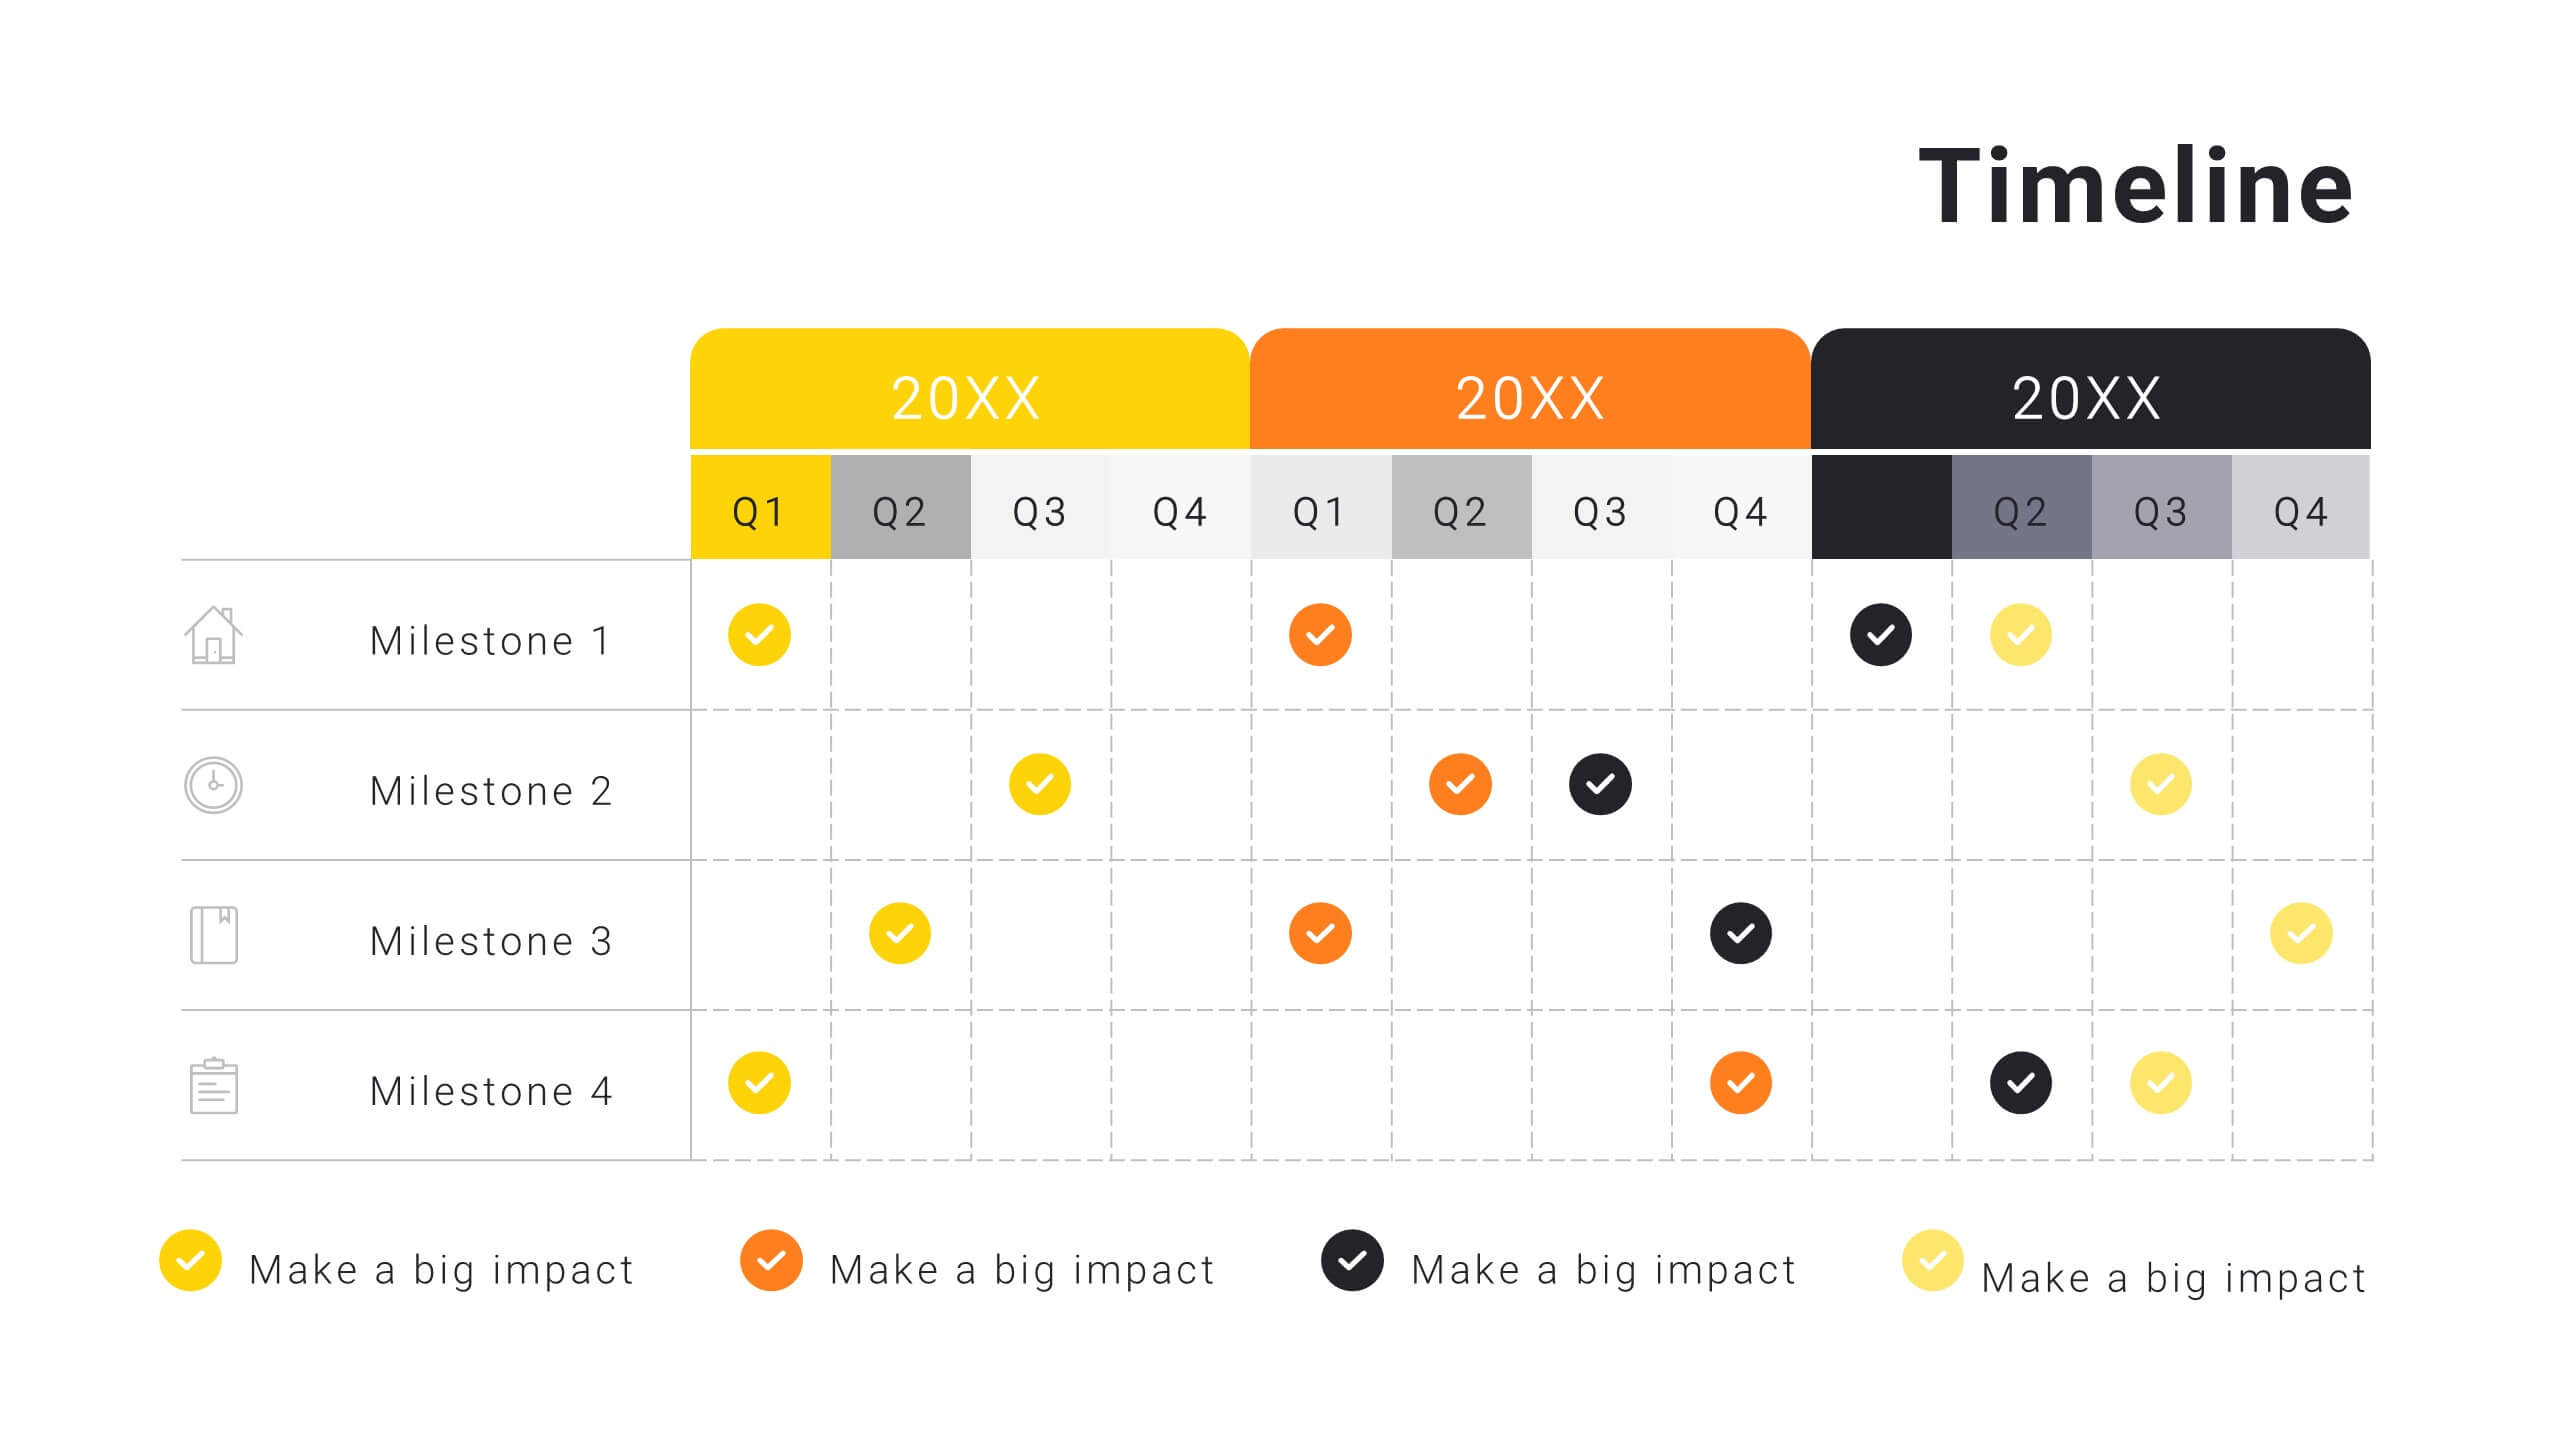
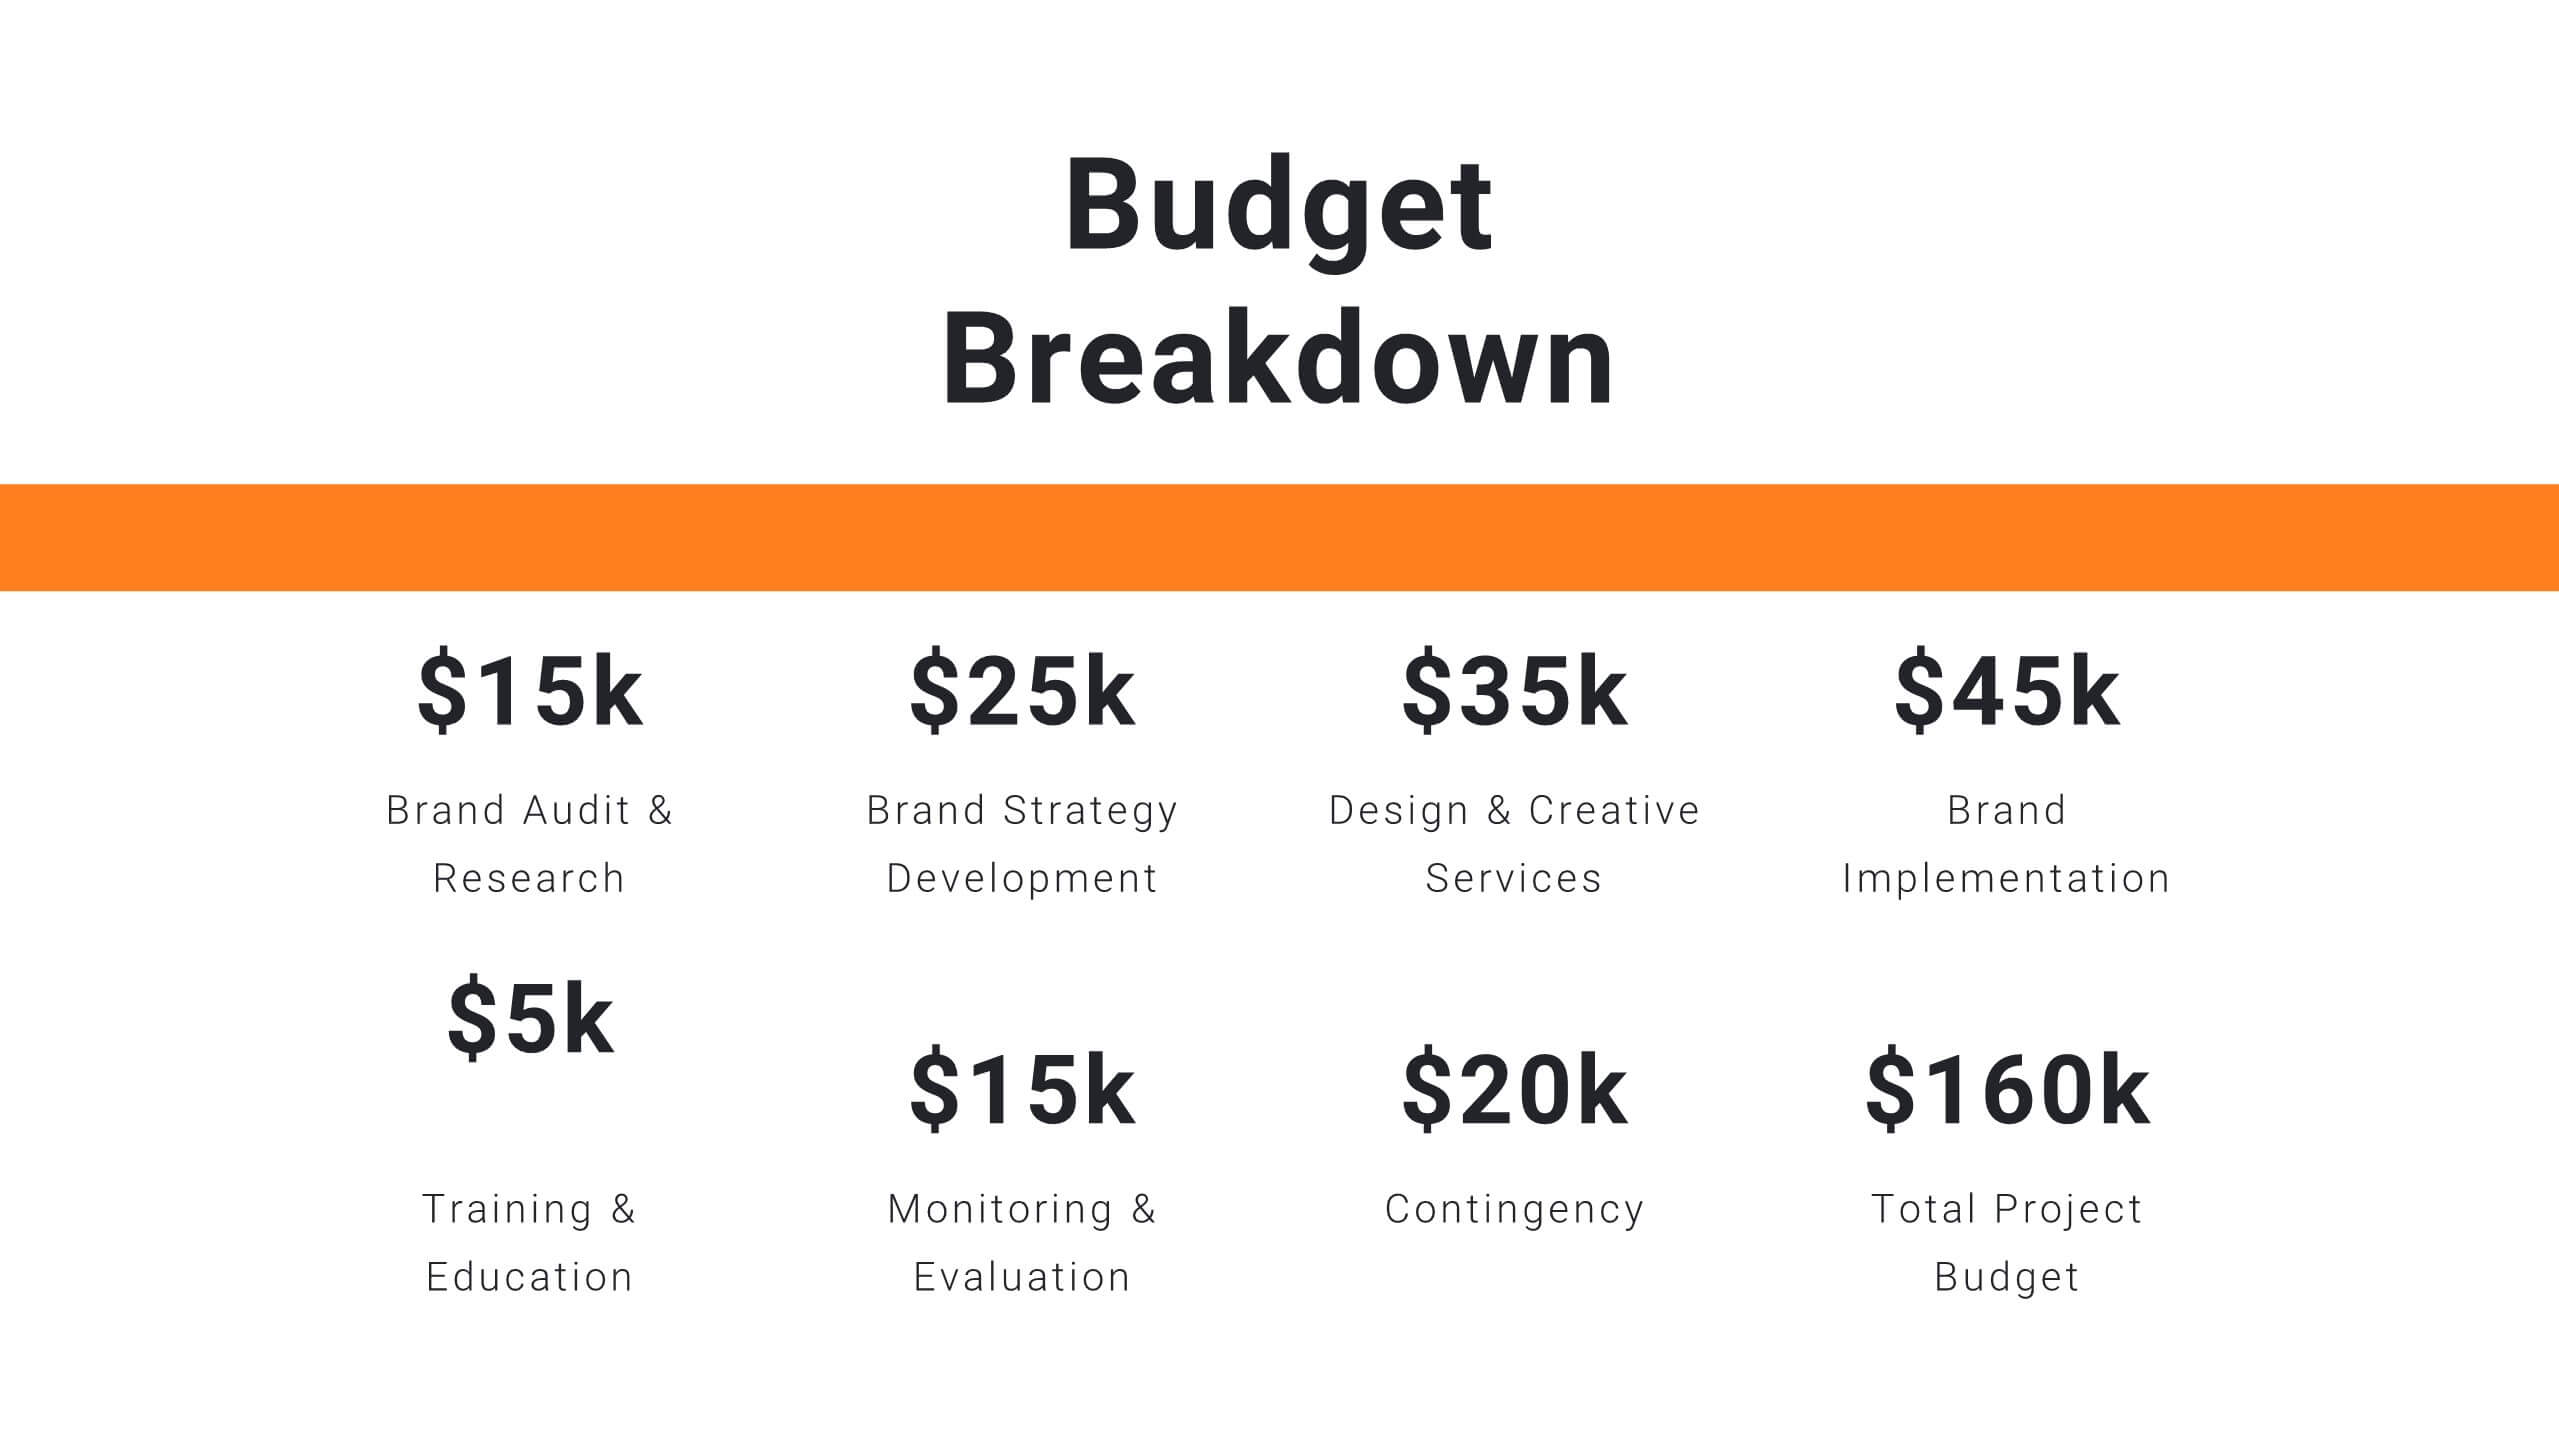
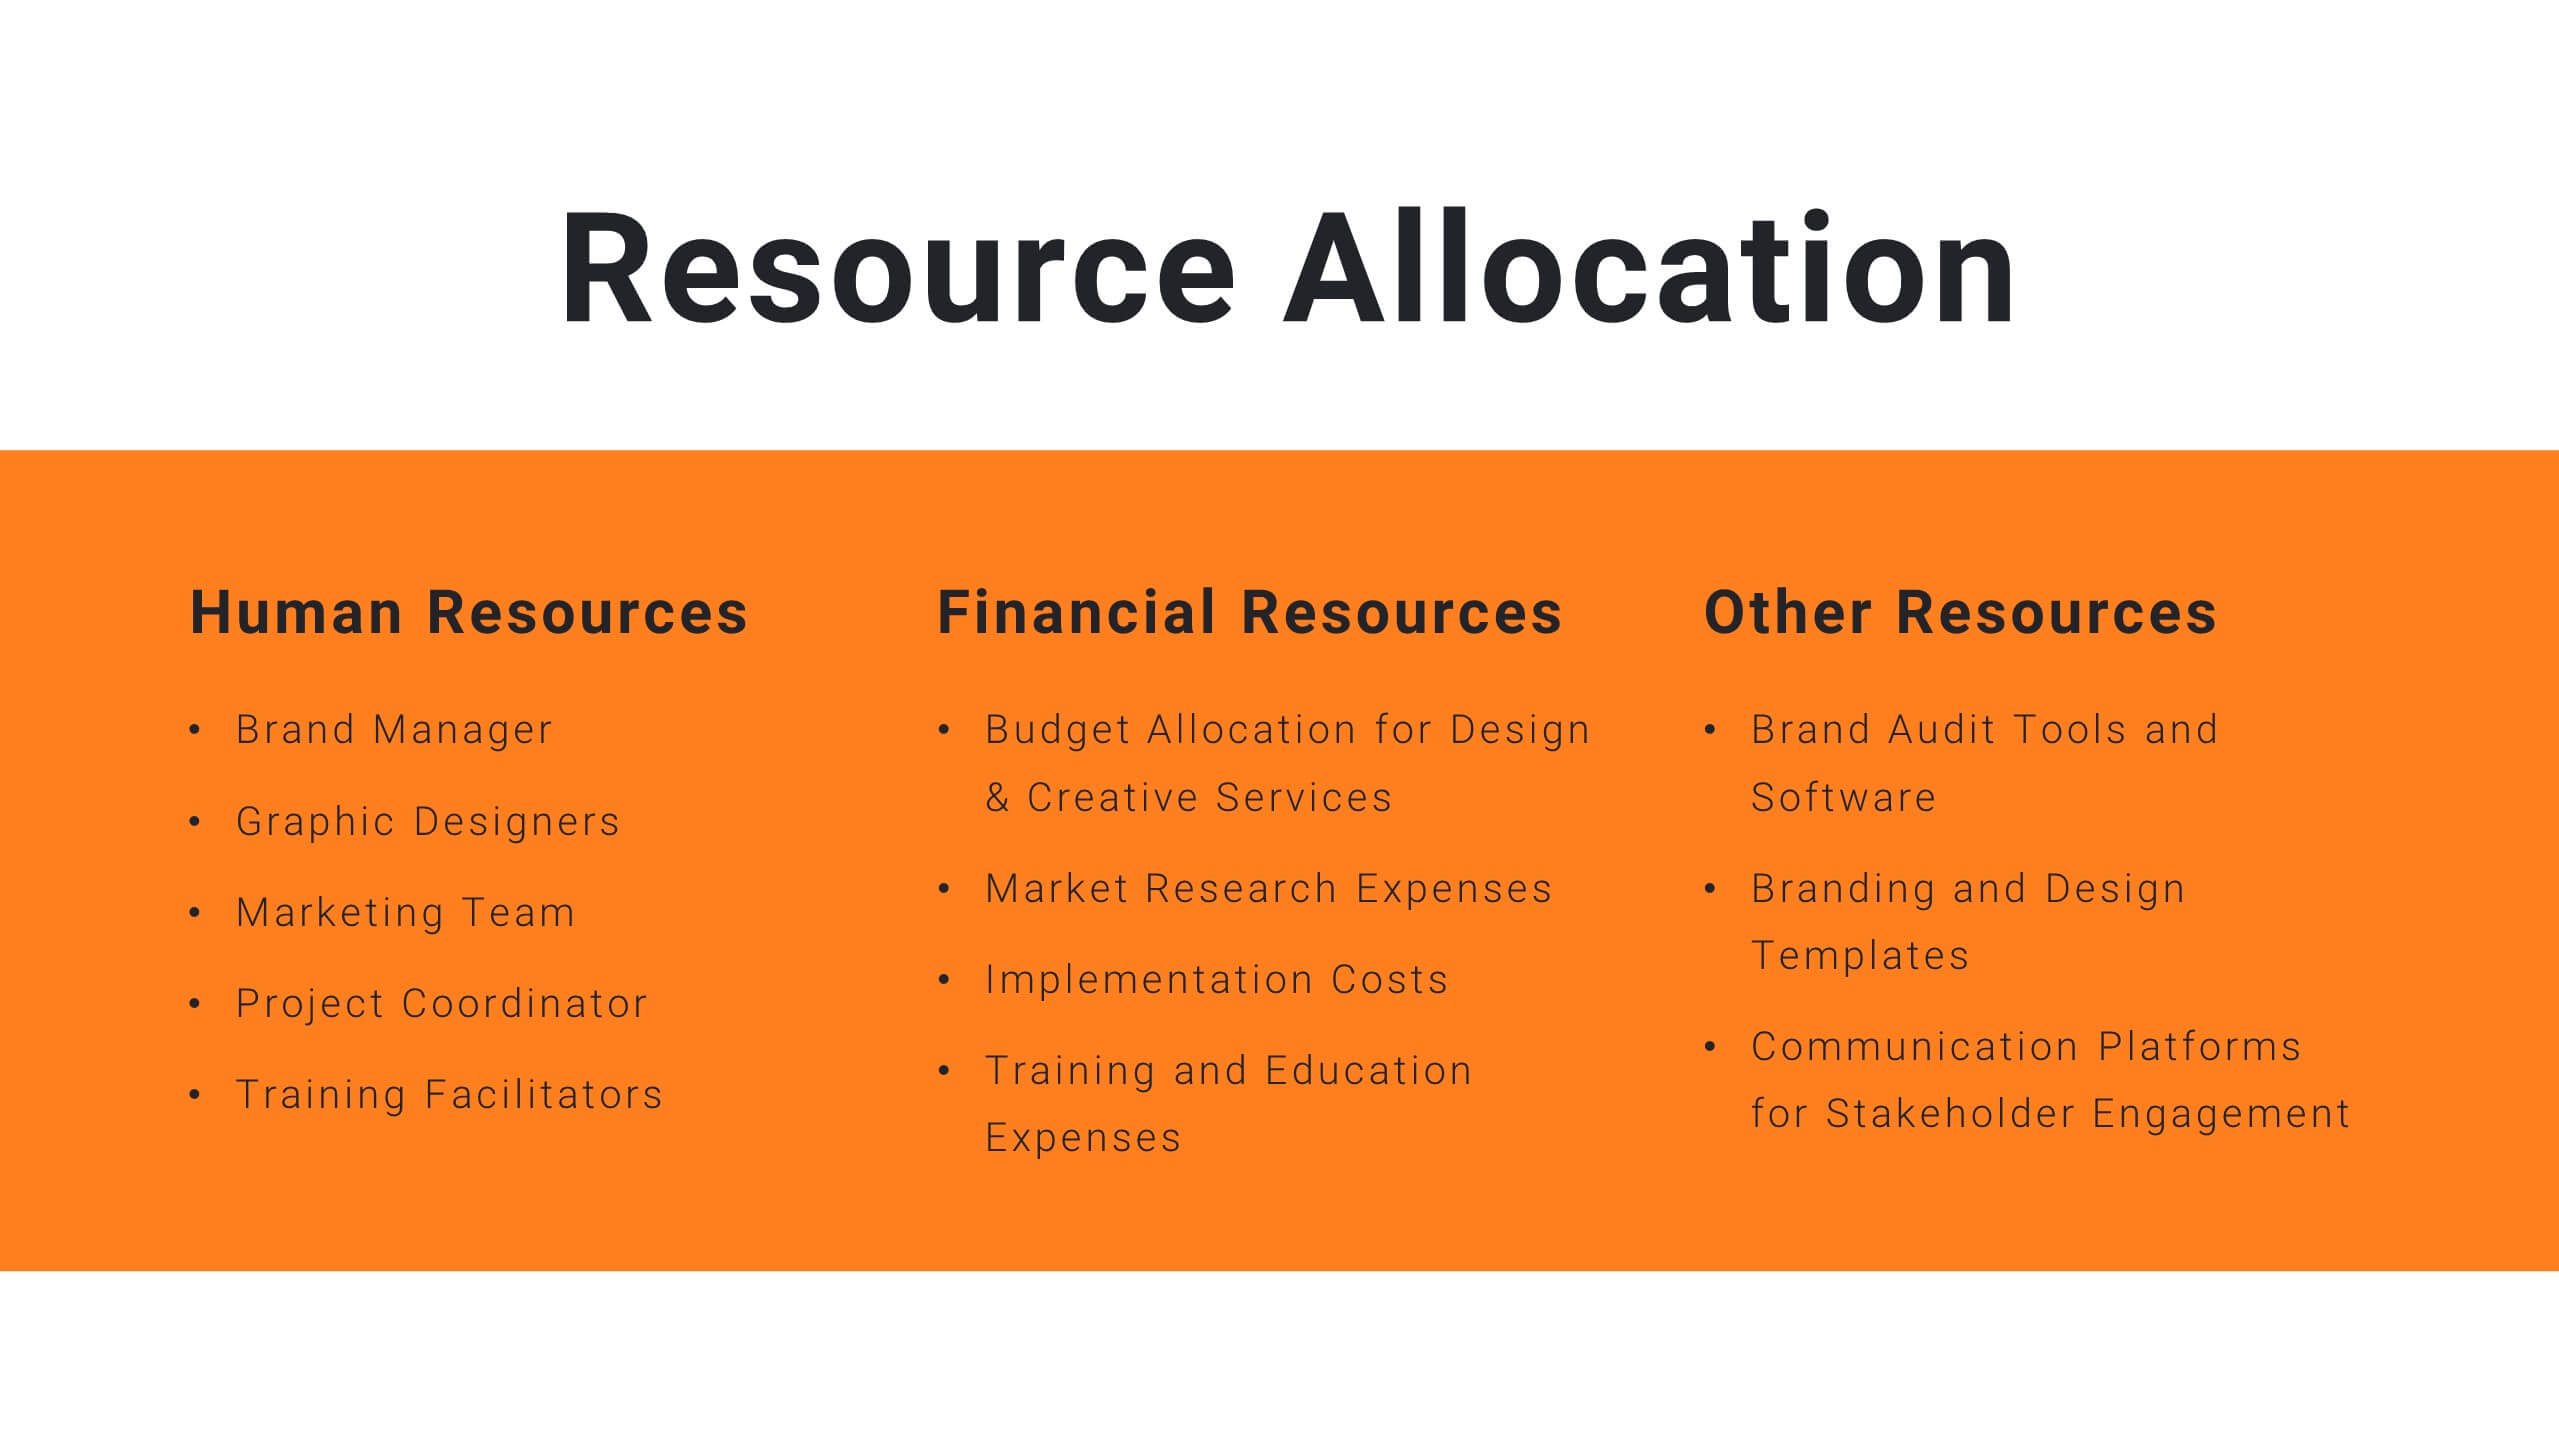
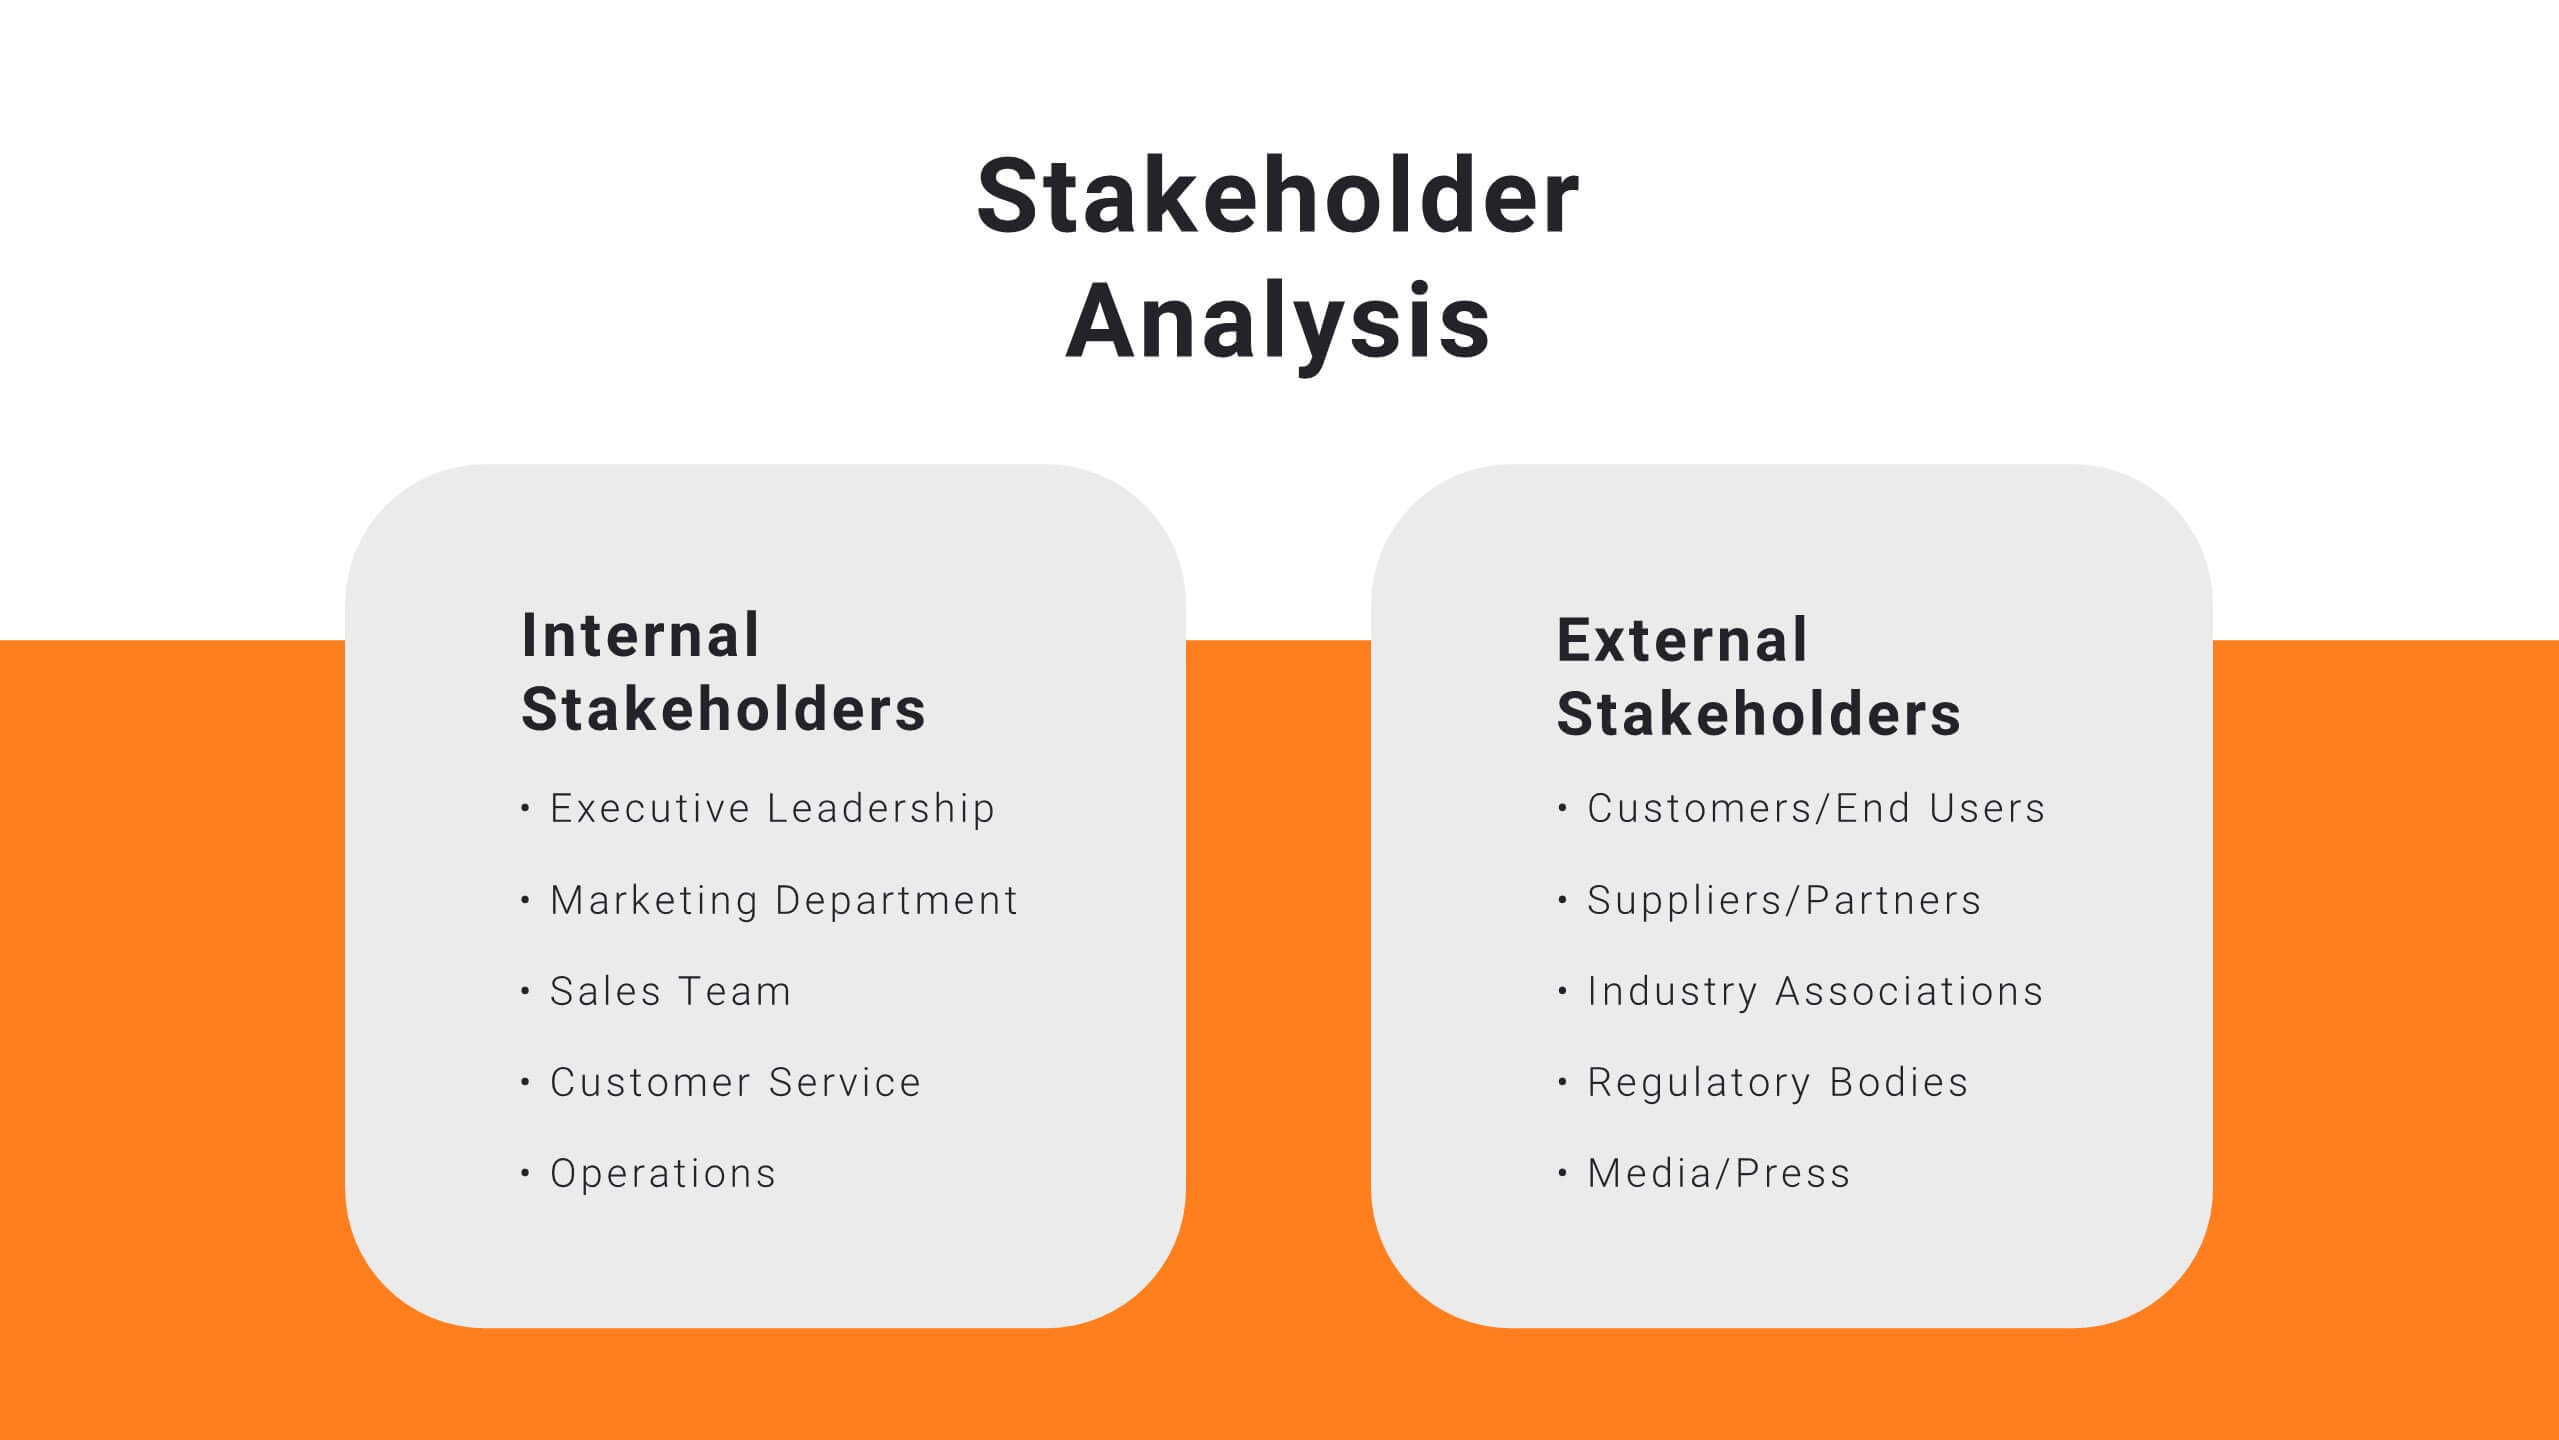
Harmony Project Management Plan Presentation
Plan your project efficiently with this comprehensive project management plan template! It covers all essential aspects including timeline, budget, resource allocation, and risk management. Ensure smooth project execution and achieve your objectives. Compatible with PowerPoint, Keynote, and Google Slides, it's designed to streamline your project planning and management process.


7 diapositivas
Business Strategy with 7S Model
Clearly map out your organizational alignment using this Business Strategy with 7S Model template. Perfect for strategy consultants, leadership teams, and business educators, it illustrates the interconnectedness of structure, strategy, systems, style, staff, skills, and shared values. Fully customizable in PowerPoint, Keynote, and Google Slides.


5 diapositivas
Business SWOT Infographics
Dive deep into organizational analysis with our business SWOT infographics. Crafted in engaging shades of blue and pink, this collection is an essential tool for businesses aiming to uncover their strengths, weaknesses, and threats. This template, brimming with creative graphics and icons, is specifically designed for business strategists, educational instructors, and company executives who are keen to present SWOT analysis with clarity. Compatible with Powerpoint, keynote, and Google Slides. Its vertical, creative styling makes complex information digestible, fostering understanding and strategic thinking in your business planning sessions.


6 diapositivas
Building Strong Business Relationships Presentation
Forge successful partnerships with the Building Strong Business Relationships template, crafted to effectively communicate the key elements of corporate collaboration and networking. With structured content areas and dynamic graphic elements, this template effectively presents business strategies. It's compatible with PowerPoint, Keynote, and Google Slides, making it versatile for various professional settings.


6 diapositivas
Consumer Decision Infographic
Consumer decision-making refers to the process through which individuals make choices about purchasing goods or services. This infographic template visually represents the process that consumers go through when making purchasing decisions. This template can be used to serve as a valuable tool to help your audience understand the steps consumers go through before making a purchase. This infographic is designed to provide insights for businesses to tailor their marketing strategies accordingly. Fully customizable and compatible with Powerpoint, Keynote, and Google Slides. Include statistics and data to highlight trends in consumer behavior.


4 diapositivas
Revenue Growth and Sales Forecast Layout Presentation
Present your key performance indicators with precision using the Revenue Growth and Sales Forecast Layout Presentation. This template features clear bar and donut charts to highlight revenue progression, product performance, and stock availability. Ideal for quarterly business reviews, financial reports, and sales team updates. Fully editable in Canva, PowerPoint, Keynote, and Google Slides.
6 diapositivas
Arrow Mapping for Growth Journey
Showcase progress and strategic development using the Arrow Mapping for Growth Journey Presentation. This vibrant arrow-style roadmap is designed to highlight five key stages—perfect for illustrating phases of growth, milestones, or business transformations. Use it to map out project timelines, organizational development, or customer onboarding flows. Fully editable in PowerPoint, Keynote, and Google Slides, it’s ideal for business strategists, consultants, and marketing teams.