


Características


¿Tienes alguna pregunta?
Recomendar


4 diapositivas
Mind Mapping for Idea Expansion Presentation
Visualize your concepts clearly with this Mind Mapping for Idea Expansion presentation. Designed to help structure brainstorming sessions or strategic planning, this template organizes ideas around a central theme with clean, radial layouts. Ideal for creative teams and professionals. Fully editable in Canva, PowerPoint, and Google Slides.


10 diapositivas
Quality Control with Six Sigma Framework Presentation
Enhance quality management with this Six Sigma Framework template. Highlight each phase—Define, Measure, Analyze, Improve, Control—in a clean, modern layout for effective presentations. Ideal for quality assurance teams, process analysts, and Six Sigma professionals. Fully editable in PowerPoint, Keynote, and Google Slides to match your brand and insights.


22 diapositivas
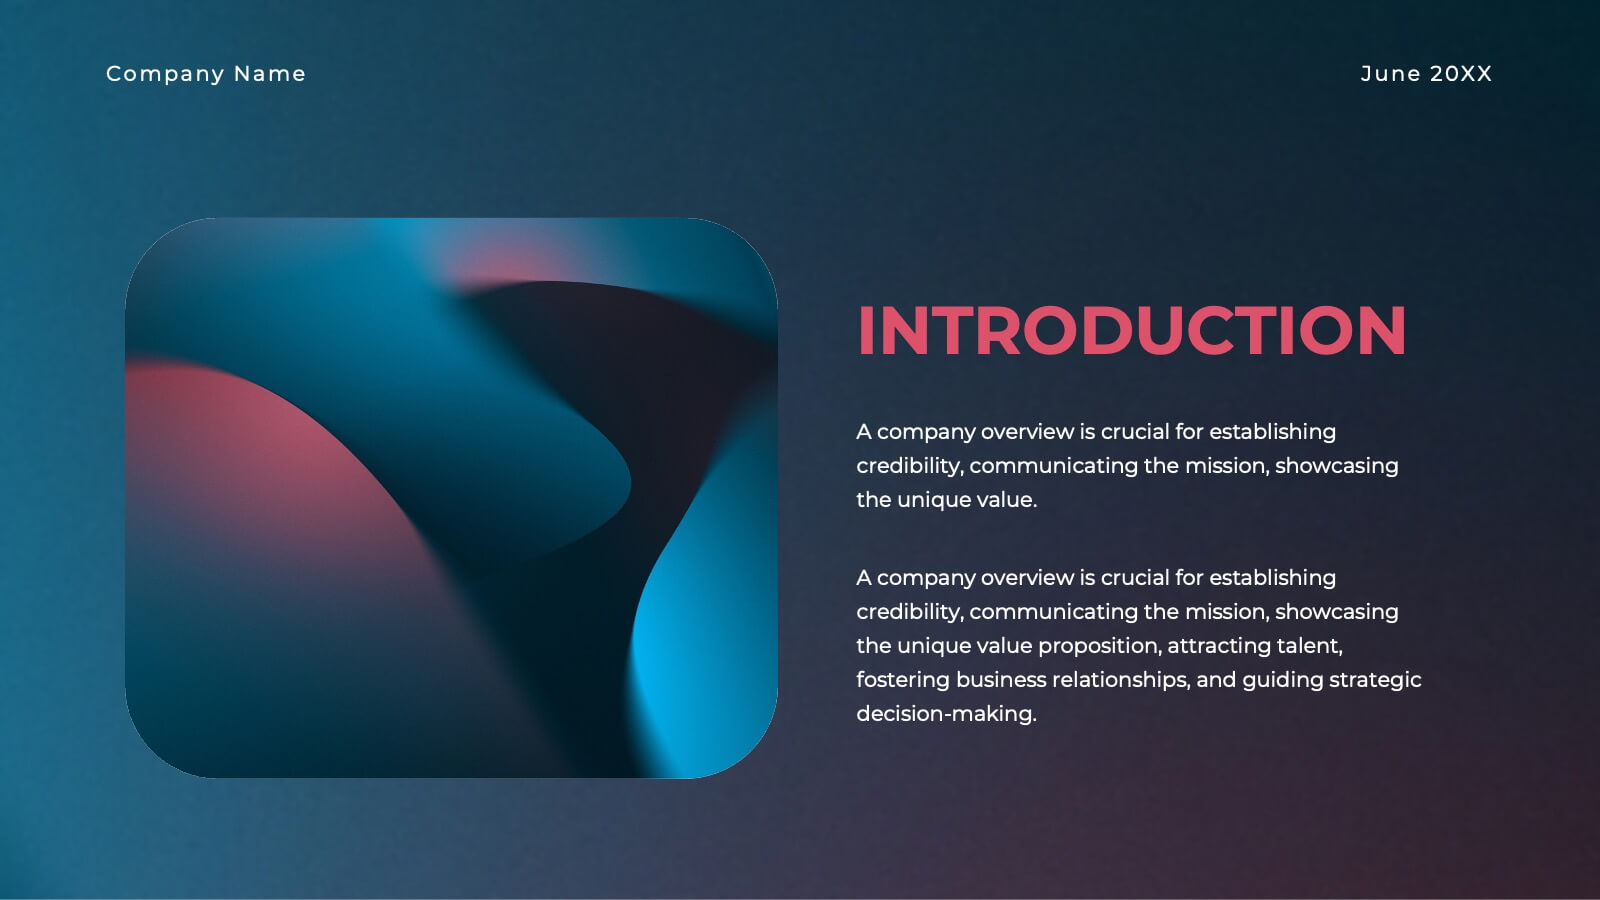
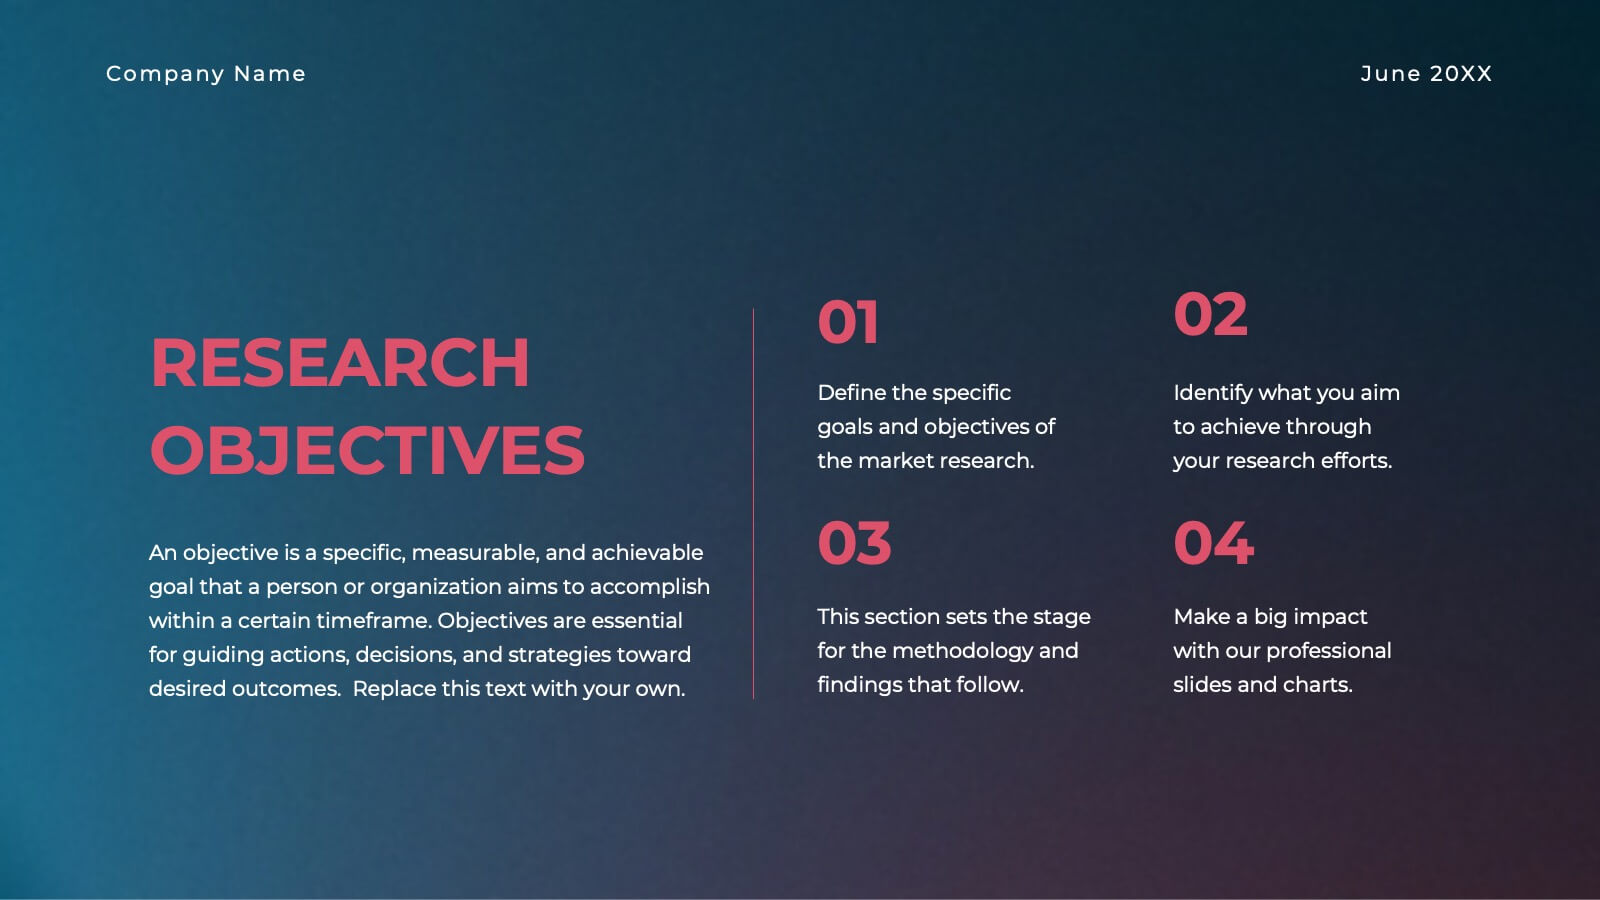
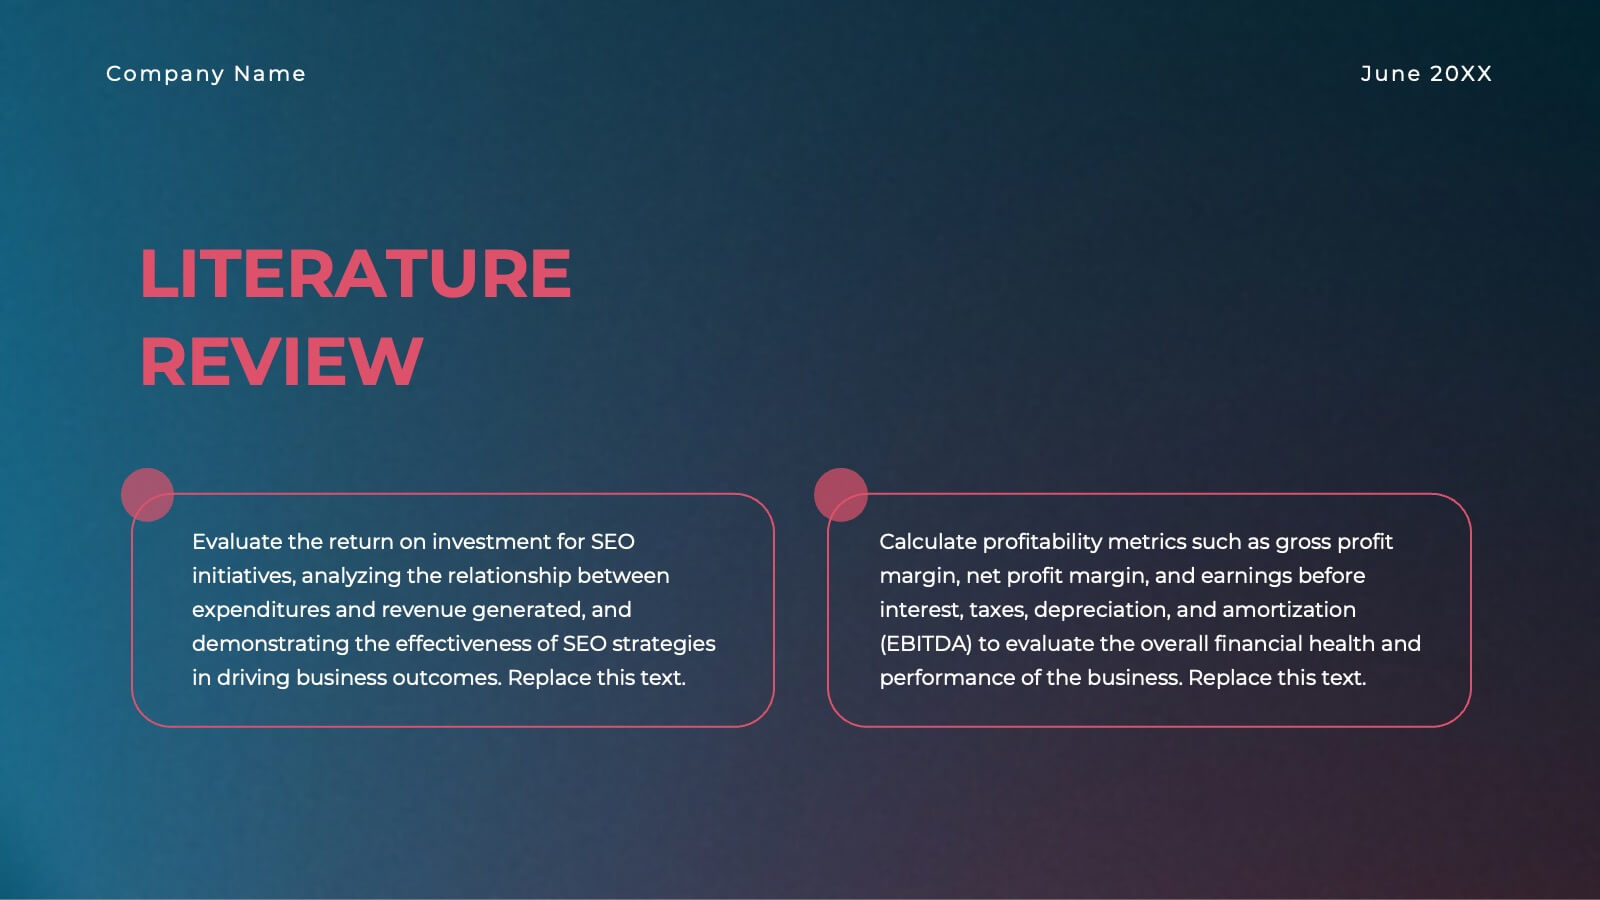
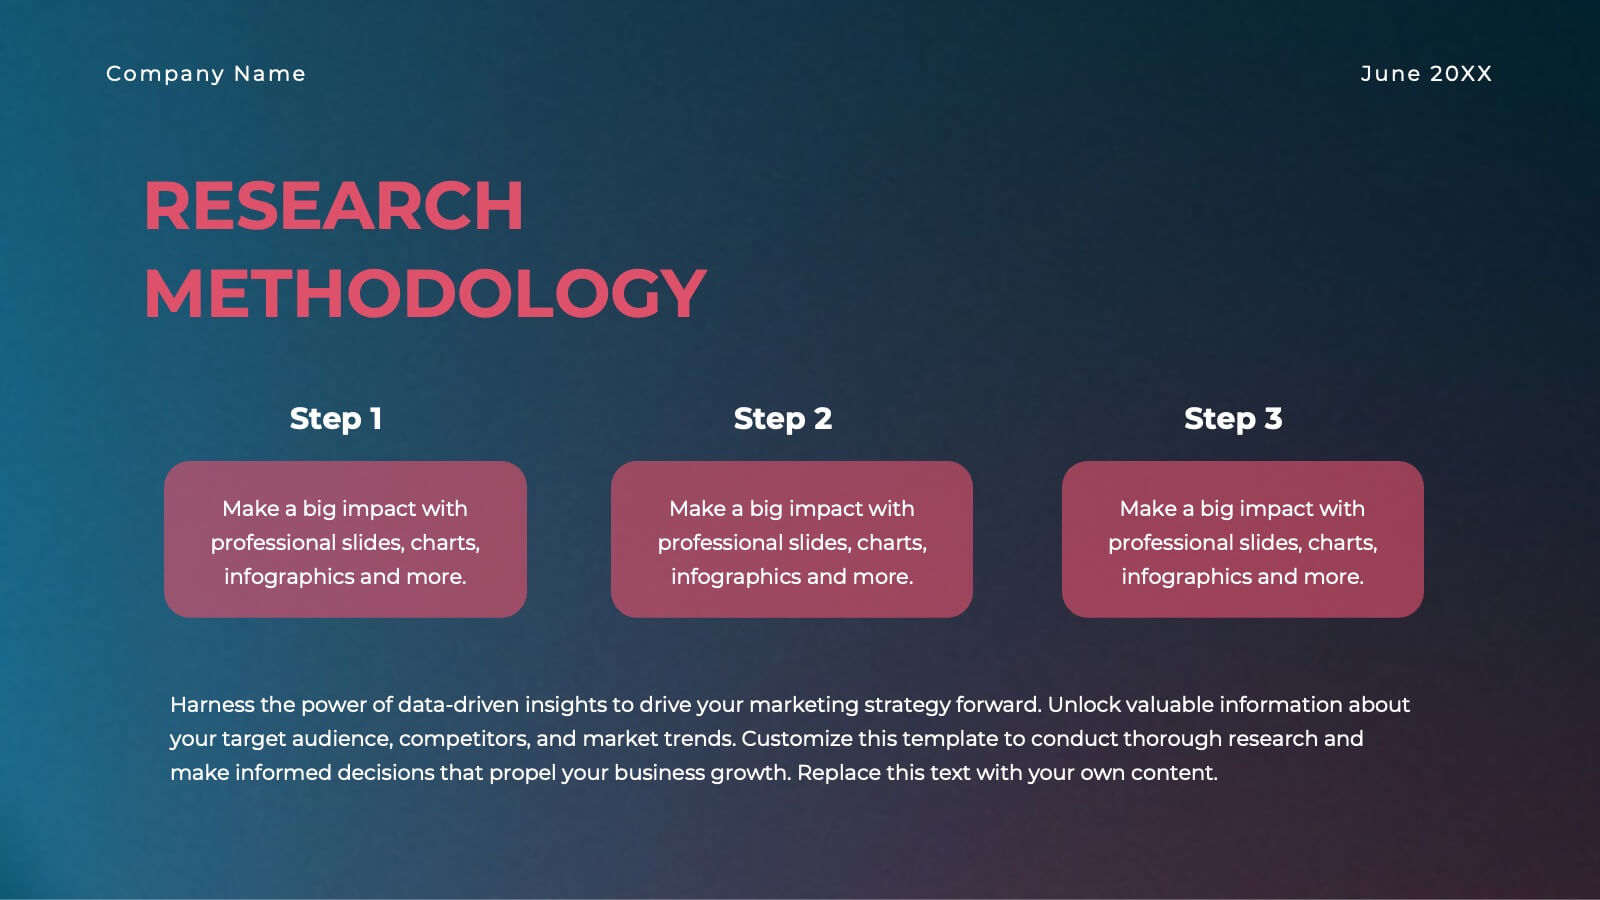
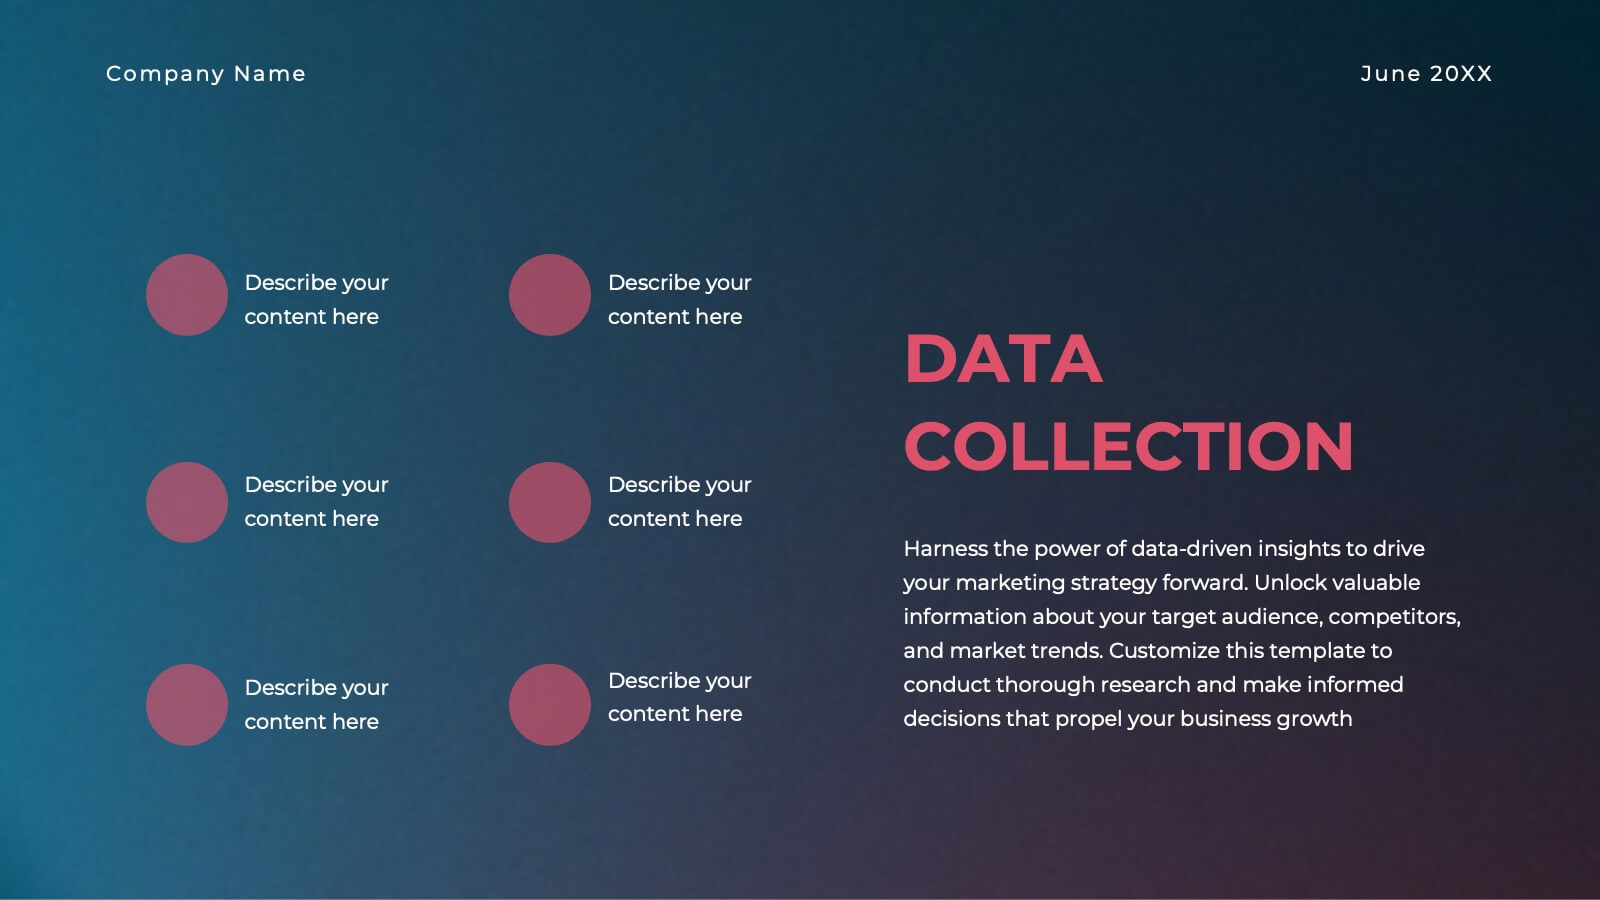
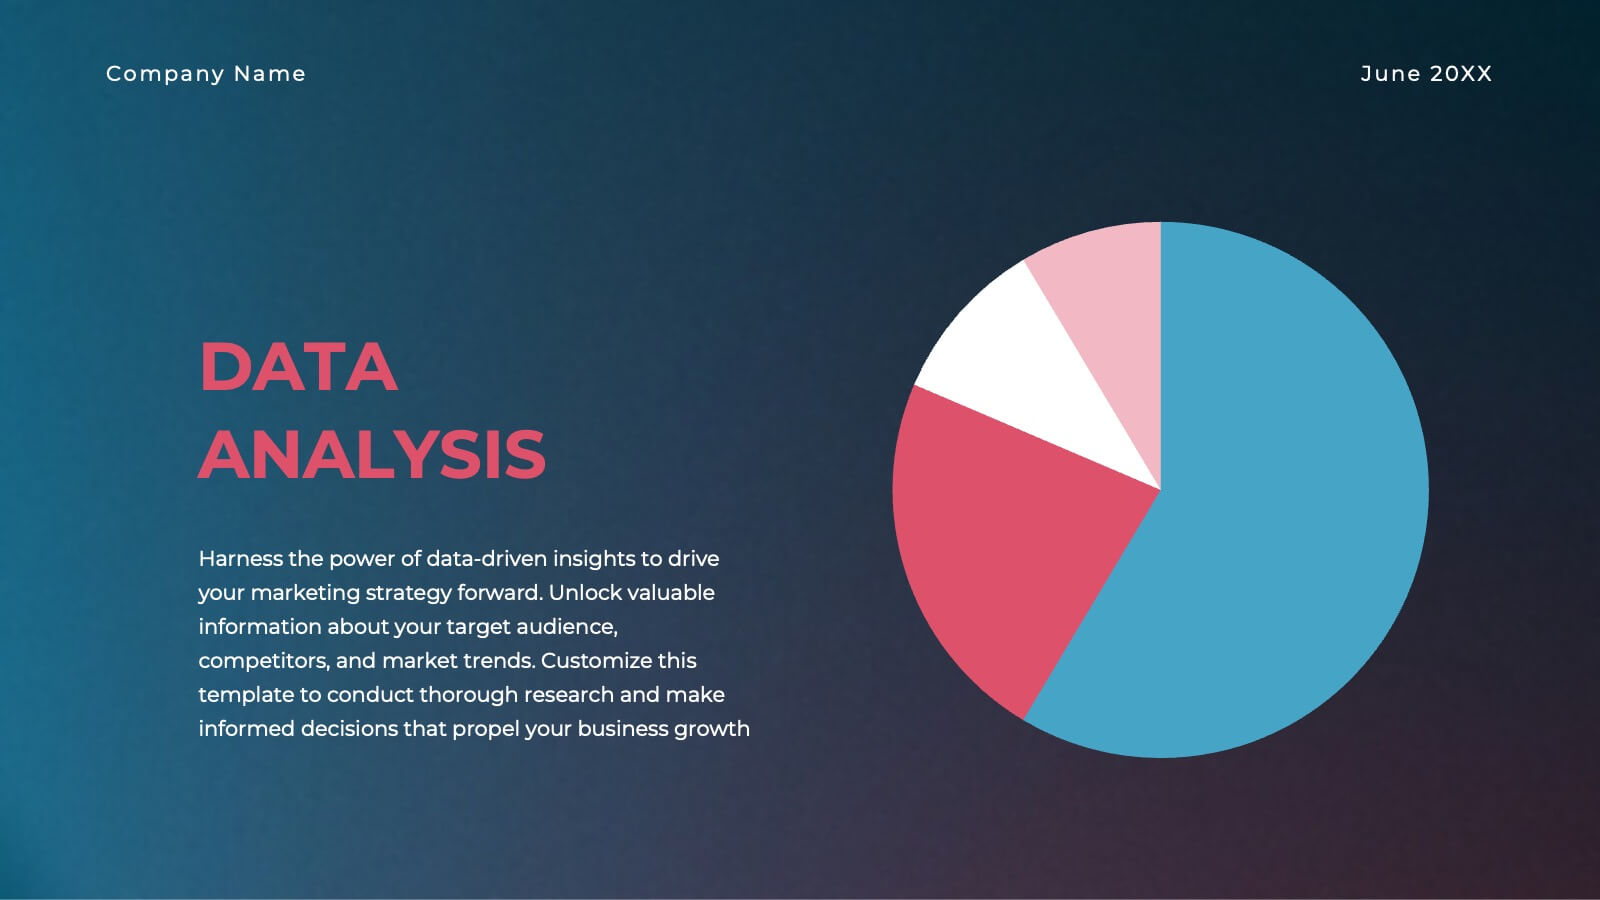
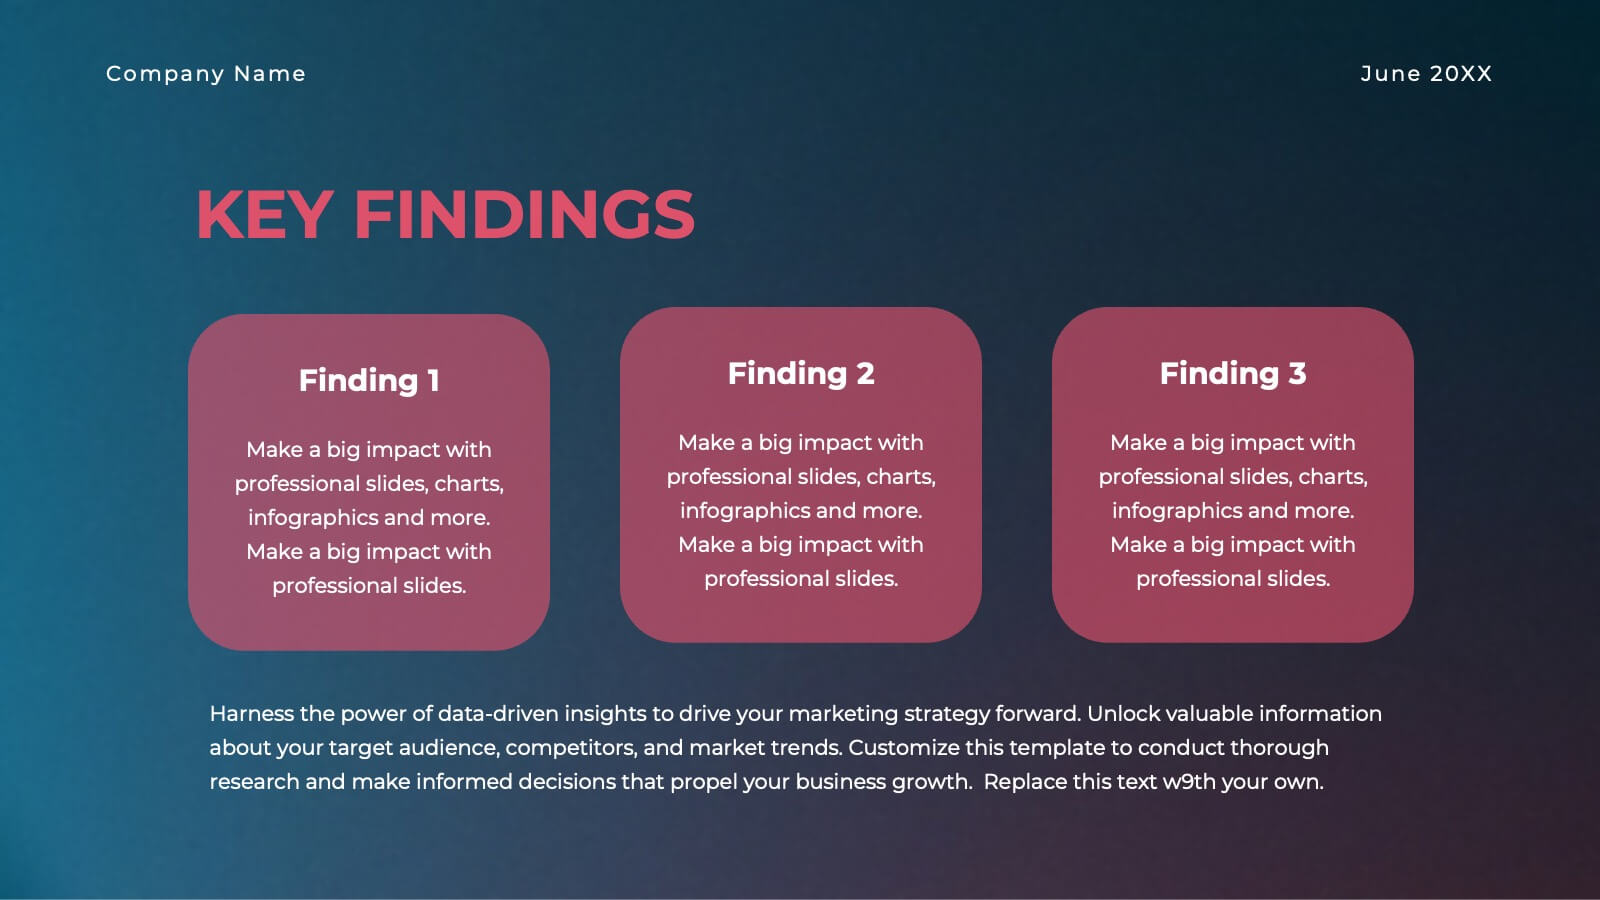
Gold Research Proposal Presentation
Present your research with impact using this sleek and modern research proposal template! Featuring sections for objectives, data collection, analysis, key findings, and recommendations, this template helps organize your research clearly and professionally. Fully customizable and compatible with PowerPoint, Keynote, and Google Slides, it's ideal for any research presentation.


8 diapositivas
Air Travel Trends and Safety Presentation
Explore global air travel dynamics with the 'Air Travel Trends and Safety' presentation template. Designed to deliver critical insights into aviation safety standards and travel patterns, this template facilitates impactful presentations for industry stakeholders. Tailored for use in platforms like PowerPoint, Keynote, and Google Slides, it serves as an essential tool for discussing regulatory impacts, operational safety, and market trends, ensuring your data is not only presented but persuasively communicated.


8 diapositivas
Economic Impact on Stock Market Presentation
Illuminate your financial presentation with the "Economic Impact on Stock Market" template, ideal for displaying the interconnected influences of economic variables on market performance. These slides feature clear, visual representations through pie charts and percentage indicators, allowing for an engaging analysis of trends and impacts. This template is fully compatible with PowerPoint, Keynote, and Google Slides, ensuring versatility across different presentation platforms.


4 diapositivas
Medical Research and Healthcare Trends Presentation
Stay ahead in the healthcare industry with the Medical Research and Healthcare Trends Presentation template. This structured layout highlights key statistics, research insights, and emerging trends in the medical field. Ideal for healthcare professionals, analysts, and policymakers, this fully customizable template is compatible with PowerPoint, Keynote, and Google Slides.


4 diapositivas
Design and Project Work Samples Presentation
Showcase your creative projects with this visually structured layout. Featuring a bold title area and three image slots for key works, it’s perfect for portfolios, proposals, or pitch decks. Fully editable in PowerPoint, Keynote, and Google Slides to suit your brand and project presentation needs.


6 diapositivas
Professional Title Infographic
This collection of professional presentation templates is meticulously designed to meet a variety of business needs, blending visual appeal with practical functionality. The templates are versatile, allowing professionals to effectively communicate complex data, strategic insights, and operational updates. One template is perfect for detailed data visualization, helping to highlight trends and insights that are crucial for data-driven decision-making. Another template focuses on team introductions, ideal for building a connection between your team and the audience, whether in stakeholder meetings or internal briefings. For marketing strategies, there's a template designed to outline customer demographics and behaviors, which is essential for tailoring marketing campaigns and product development. The collection also includes templates for financial reporting and pricing strategies, ensuring that financial data is communicated clearly and efficiently. Additionally, a strategic analysis template aids in outlining key business strengths, weaknesses, opportunities, and threats, supporting strategic planning and risk management. Overall, these templates are a valuable tool for any professional looking to present information clearly and compellingly in various business contexts.


2 diapositivas
Bold and Minimal Opening Presentation Layout
Make your first slide speak volumes with this bold yet minimal opening layout. Designed to grab attention while keeping things simple, this template helps you introduce your presentation with clarity and confidence. Great for modern business decks, it’s fully customizable and works seamlessly in PowerPoint, Keynote, and Google Slides.


6 diapositivas
Security Finance Infographics
The "Security Finance" infographic template is a sleek and authoritative visual tool, impeccably designed for PowerPoint, Keynote, and Google Slides. This template is an indispensable resource for financial analysts, security brokers, and investment advisors who aim to articulate the nuances of security finance including investment strategies, risk management, and portfolio diversification. This template methodically outlines the critical components of security finance, such as stocks, bonds, market analysis, and financial instruments. It's crafted to present complex financial concepts and data in a digestible and visually engaging format. This makes it an excellent aid for financial presentations, investor briefings, or educational seminars on capital markets and investment principles. The design is as professional as it is insightful, with a color scheme that is both sophisticated and indicative of financial acumen. This not only enhances the visual appeal of the presentation but also aligns with the seriousness and precision of financial discussions. Whether used in a corporate setting, a training module, or an academic lecture, this template ensures that the intricacies of "Security Finance" are communicated with clarity, sophistication, and visual impact.


4 diapositivas
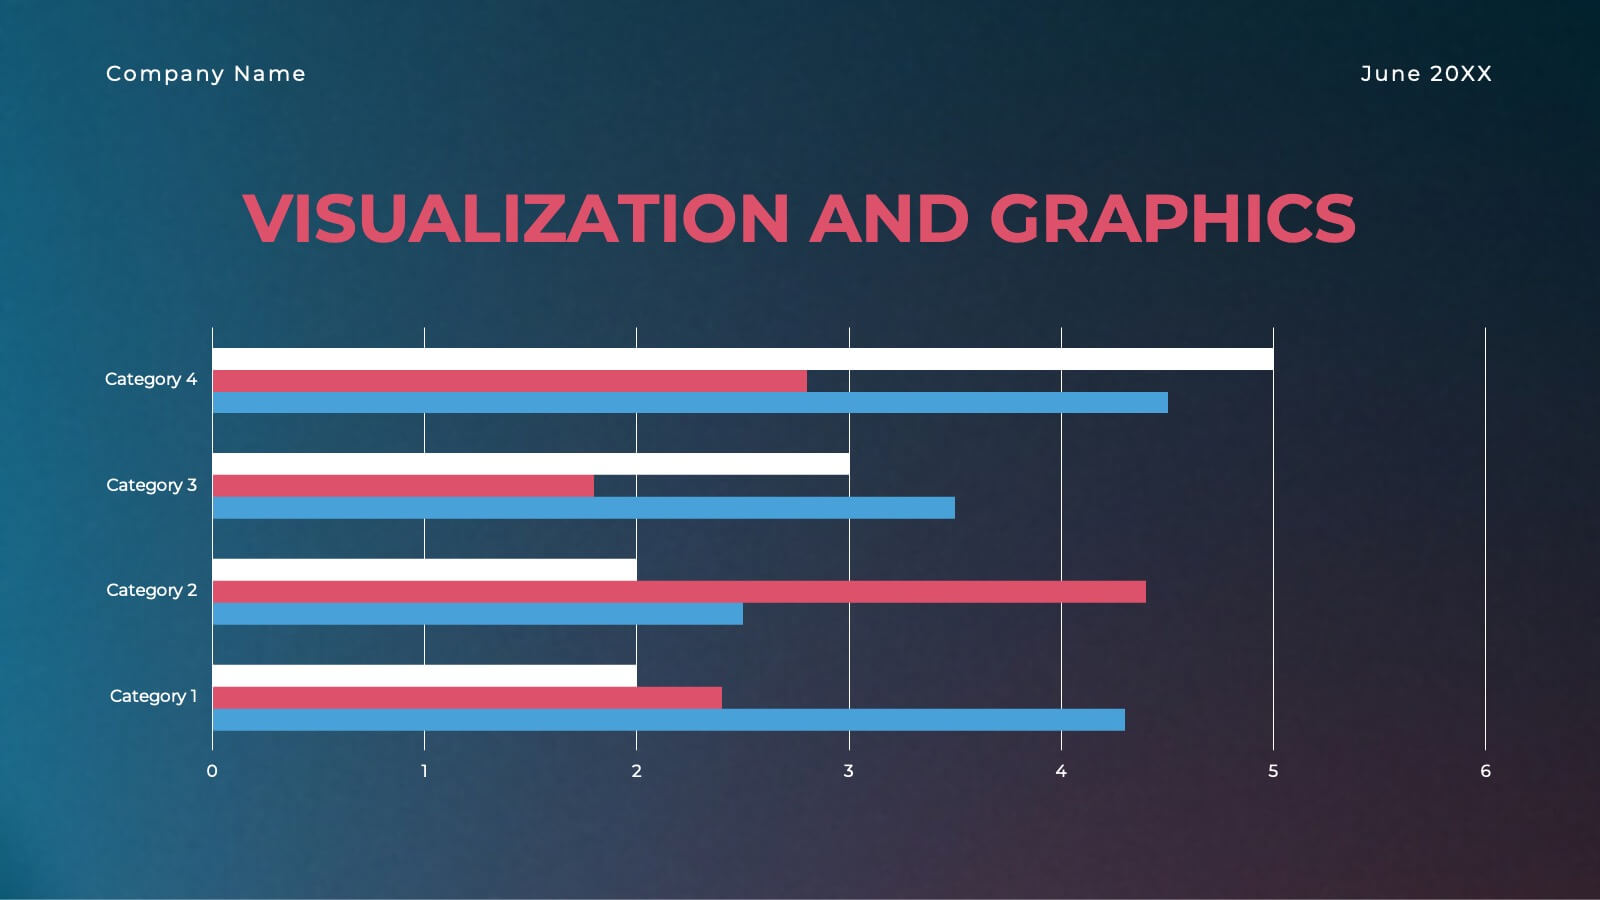
Employee Performance Feedback
Showcase progress clearly with this Employee Performance Feedback presentation. Featuring skill-based metrics, productivity scores, and analysis ratings, this layout uses visual data bars to evaluate team performance at a glance. Perfect for HR reviews, team assessments, or quarterly check-ins. Fully editable in PowerPoint, Keynote, and Google Slides.


5 diapositivas
Organizational Structure Framework
Visualize your company hierarchy with this tiered pyramid diagram. This presentation framework is designed to outline roles and responsibilities across four structured levels, using labels A to D for clear communication. Each section includes iconography and editable text blocks, perfect for leadership, operations, or team management slides. Fully compatible with PowerPoint, Keynote, and Google Slides.
5 diapositivas
Transportation Flow and Inventory Tracking Presentation
Track movement and stock like a pro with this clean shipping infographic layout. Featuring a cargo ship graphic and segmented titles, it's perfect for illustrating supply chain progress, delivery checkpoints, or inventory updates. Use it to present logistics insights with clarity. Fully compatible with PowerPoint, Keynote, and Google Slides.


10 diapositivas
Digital Device Showcase Presentation
Bring your content to life with a bold, modern slide that spotlights digital devices in a clean, eye-catching layout. This presentation helps you introduce product features, showcase app designs, or highlight tech concepts with clarity and style. Fully editable and easy to use, it works seamlessly in PowerPoint, Keynote, and Google Slides.


20 diapositivas
Celestique Photography Portfolio Template Presentation
This Photography Portfolio Presentation offers a sleek and modern design to showcase your work professionally. Featuring sections for project highlights, creative process, client testimonials, and pricing, it's fully customizable and easy to edit in PowerPoint, Keynote, and Google Slides. Perfect for photographers looking to impress potential clients.


6 diapositivas
Communication Plan Infographic
A communication plan is a strategic document that outlines how an organization or project team intends to communicate with various stakeholders. This infographic template is designed with a structured approach to deliver consistent and effective messages to ensure that all viewers are informed, engaged, and aligned. This template outlines the strategies and tactics for effectively conveying information within an organization or to a target audience. Compatible with Powerpoint, Keynote, and Google Slides. This serves as a quick reference guide for effective communication strategies and help your audience understand the key elements of your plan.


7 diapositivas
Stock Market Forecast Infographic Presentation
Introducing our brand new stock market infographic presentation template, the perfect tool for your next school project, classroom presentation or business adventure! Compatible with Powerpoint, Keynote, and Google Slides, our template is easy to use and customize to your liking. Our template features a fun and engaging color scheme, along with Infographics and editable text that make it easy to add your own personal touch. Whether you're presenting data or forecasting information, our template will help you stand out and make an impression on your audience. With our stock market infographic presentation, you can showcase your knowledge and impress your classmates and clients with your presentation skills.