


Características


¿Tienes alguna pregunta?
Recomendar


5 diapositivas
Strategic Growth Next Steps
Highlight your business roadmap with this rocket-themed infographic tailored for strategic growth. Ideal for showcasing step-by-step initiatives or departmental alignment, it features five labeled stages with ample space for insights and icons. Fully editable in PowerPoint, Keynote, and Google Slides—perfect for growth strategy, planning, or vision-setting decks.


4 diapositivas
3-Circle Venn Diagram Presentation
Visualize overlap and connection with clarity using the 3-Circle Venn Diagram Presentation. This minimalist slide is ideal for showing relationships between three ideas, strategies, or data sets. Each circle is color-coded for distinction, and intersections highlight shared elements. Perfect for business models, marketing segments, or product comparisons. Fully editable in PowerPoint, Keynote, and Google Slides.


20 diapositivas
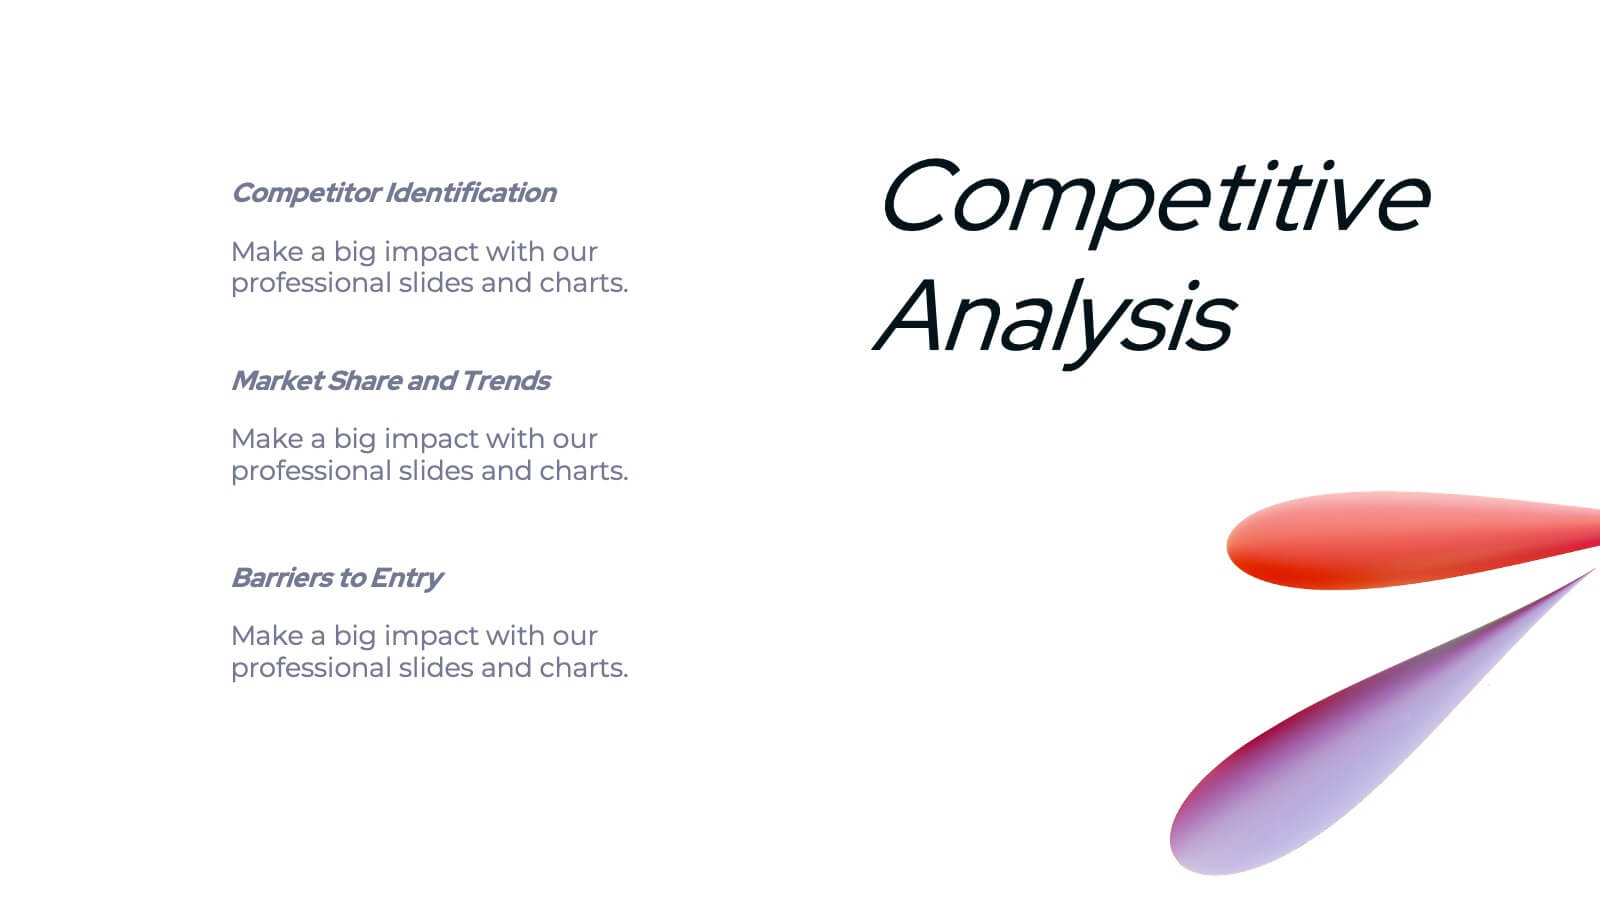
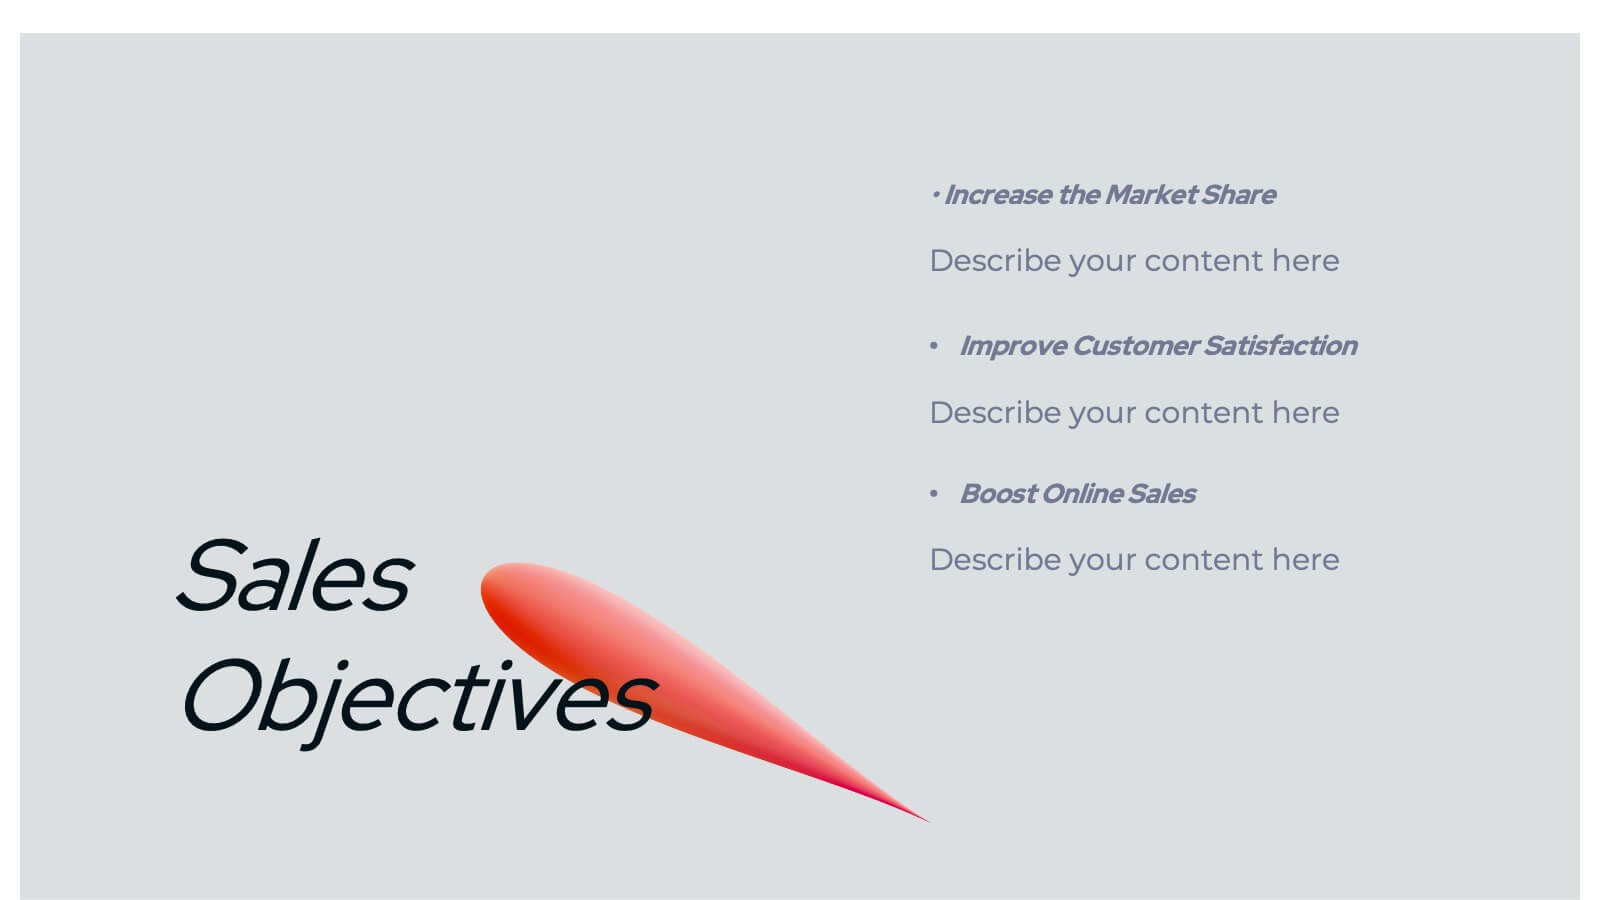
Spark Sales Performance Report Presentation
Deliver insights and strategies with this dynamic sales performance report presentation template. Featuring an elegant and modern design, it provides dedicated sections for agenda setting, company overview, service highlights, and customer value propositions. Present competitive analysis, sales objectives, and performance metrics with ease using clean, structured layouts. Visualize sales processes, team introductions, and pricing strategies through engaging, editable infographics and data slides. The template also includes areas for showcasing promotions, customer testimonials, future opportunities, and actionable next steps. Tailored for sales teams and managers, it offers a professional framework to review and strategize effectively. Fully customizable and compatible with PowerPoint, Google Slides, and Keynote, this template ensures seamless adaptation to your branding and needs. Impress your audience while highlighting achievements and paving the way for future growth!


4 diapositivas
Virtual Learning Experience Design Presentation
Bring your online classroom ideas to life with this modern and visual-first design! This infographic presentation breaks down the key components of virtual learning experience design—perfect for mapping student touchpoints, engagement strategies, and content flow. Fully editable and easy to use in PowerPoint, Keynote, and Google Slides for fast customization.


5 diapositivas
Patient Care and Hospital Management Presentation
Communicate critical aspects of Patient Care and Hospital Management with this structured presentation template. Featuring a unique IV-drip-inspired design, this layout visually represents the flow of healthcare processes, making it ideal for hospitals, medical institutions, and healthcare professionals. Use it to outline treatment protocols, patient management strategies, and operational workflows. Fully editable and compatible with PowerPoint, Keynote, and Google Slides for seamless customization.


5 diapositivas
Large Scale Data Insights Presentation
A clean, modern slide that makes complex information feel surprisingly easy to explain, this layout helps you break down large-scale data in a way your audience can instantly understand. Use it to outline key insights, visualize processes, or highlight system components. Fully compatible with PowerPoint, Keynote, and Google Slides.


5 diapositivas
Modern Tech Stack Overview Presentation
Showcase your technology architecture with this Modern Tech Stack Overview. Featuring a robotic hand and circular layout, it’s ideal for product demos, software architecture, or developer briefings. Designed for PowerPoint, Keynote, and Google Slides, this deck makes complex tech structures easy to understand and visually engaging for modern audiences.


8 diapositivas
Company Vision and Strategic Direction Presentation
Present your company’s long-term goals with clarity using the Company Vision and Strategic Direction Presentation. This clean, icon-led layout helps communicate your vision, focus areas, and roadmap in a linear, easy-to-follow format. Ideal for executive updates, investor decks, or team briefings. Compatible with PowerPoint, Canva, and Google Slides.
10 diapositivas
Educational Goals and Progress Tracking Presentation
Track academic milestones with ease using the Educational Goals and Progress Tracking Presentation. This timeline-style visual is perfect for mapping learning objectives, course progression, or academic achievements. Great for teachers, trainers, or student planning sessions. Fully editable in PowerPoint, Keynote, Canva, and Google Slides.


7 diapositivas
Venn Diagram Infographic Presentation Template
A Venn diagram is a type of chart that uses circles to show the similarities and differences between two or more sets of items. The circles overlap in the areas where the items have something in common, and the non-overlapping areas show the items that are unique to each set. This template is perfect for showing how different things are alike and different. This template includes lots of diagrams with circles that you can customize to show all the similarities between your different information. You can also add pictures and charts to make it look more appealing with your personal data.


10 diapositivas
Teamwide Business Implementation Plan Presentation
Visualize your implementation roadmap with this team-focused progress slide. Featuring circular avatars, percentage bars, and milestone titles, it’s ideal for highlighting departmental progress or execution timelines. Fully editable in PowerPoint, Keynote, and Google Slides—perfect for internal updates, leadership reviews, or showcasing collaborative performance across business functions.


26 diapositivas
Ioel Presentation Template
Here's the perfect kickstart to your business with a presentation template that you’ve been dreaming of! Ioel's crisp, bold font and a clean aesthetic that is engaging to any audience. This template will give your business a bolder and more professional image that you need. Ioel's bold blue background is eye-catching, making this template perfect for businesses seeking to make a great impression. This template will make it easy for you to create an attractive and professional-looking deck. Any business owner wishing to make an impression on their audience will want to use this presentation.


8 diapositivas
Benefits Table Template
Optimize your presentation of complex options with our "Benefits Table Template." Designed to clearly distinguish between different plans, this template enables you to showcase Plan A, Plan B, and Plan C with ease. Each column is distinctively colored and detailed to ensure your audience can grasp the variances in benefits at a glance. Ideal for comparing packages, costs, or strategic choices in a corporate setting, this template helps clarify decision-making processes. Compatible with PowerPoint, Keynote, and Google Slides, it is an invaluable tool for business analysts, sales teams, and marketers aiming to communicate effectively with their stakeholders.


6 diapositivas
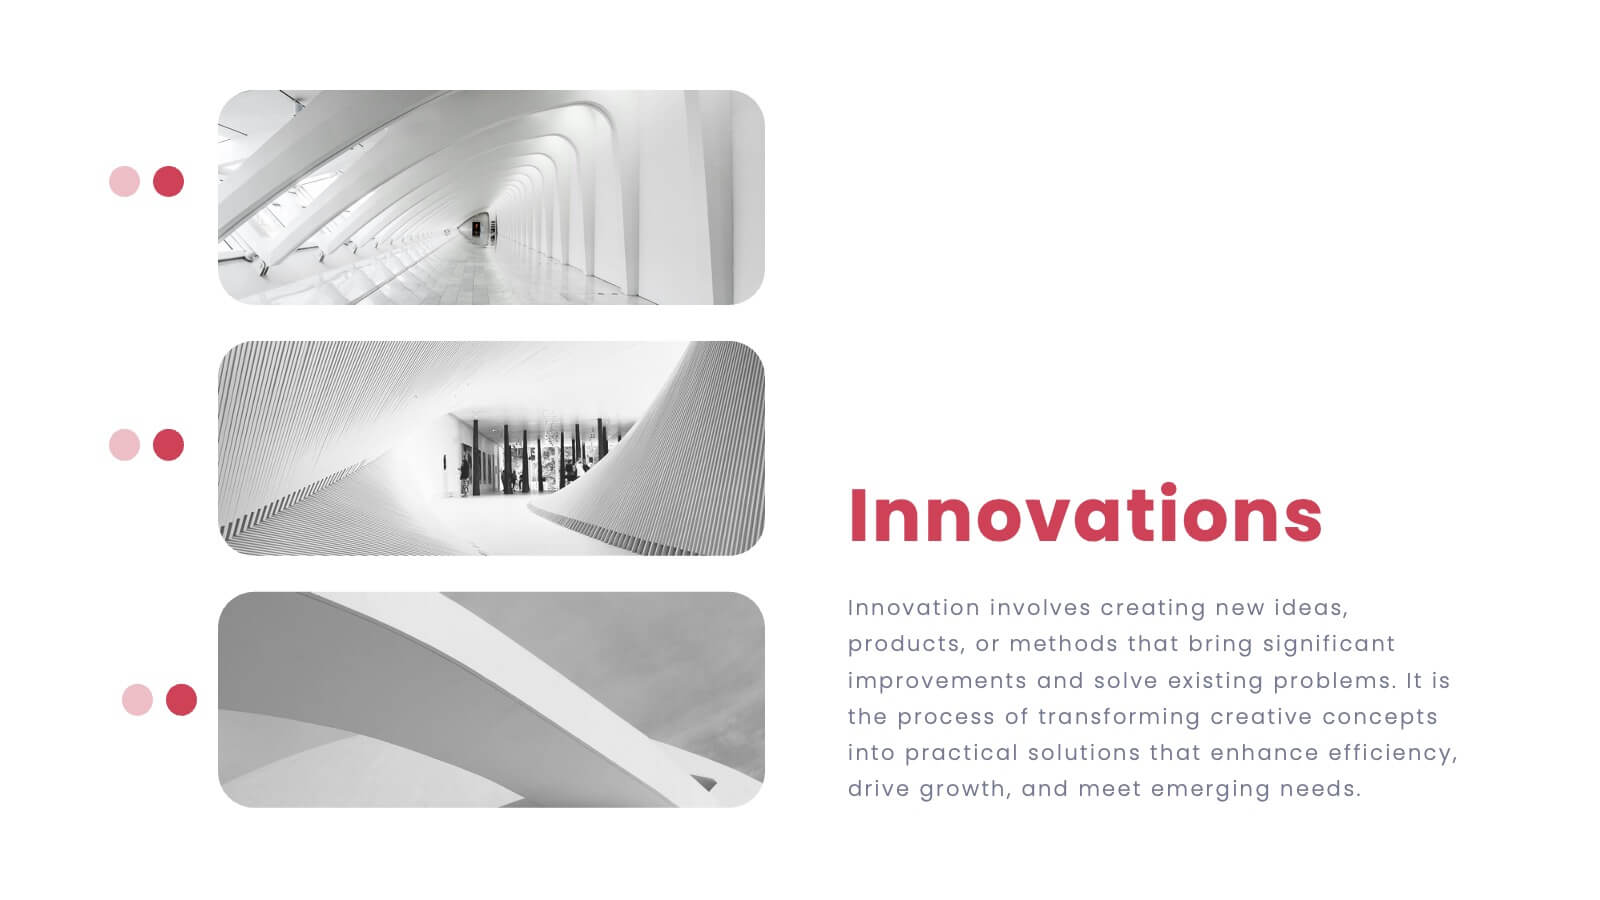
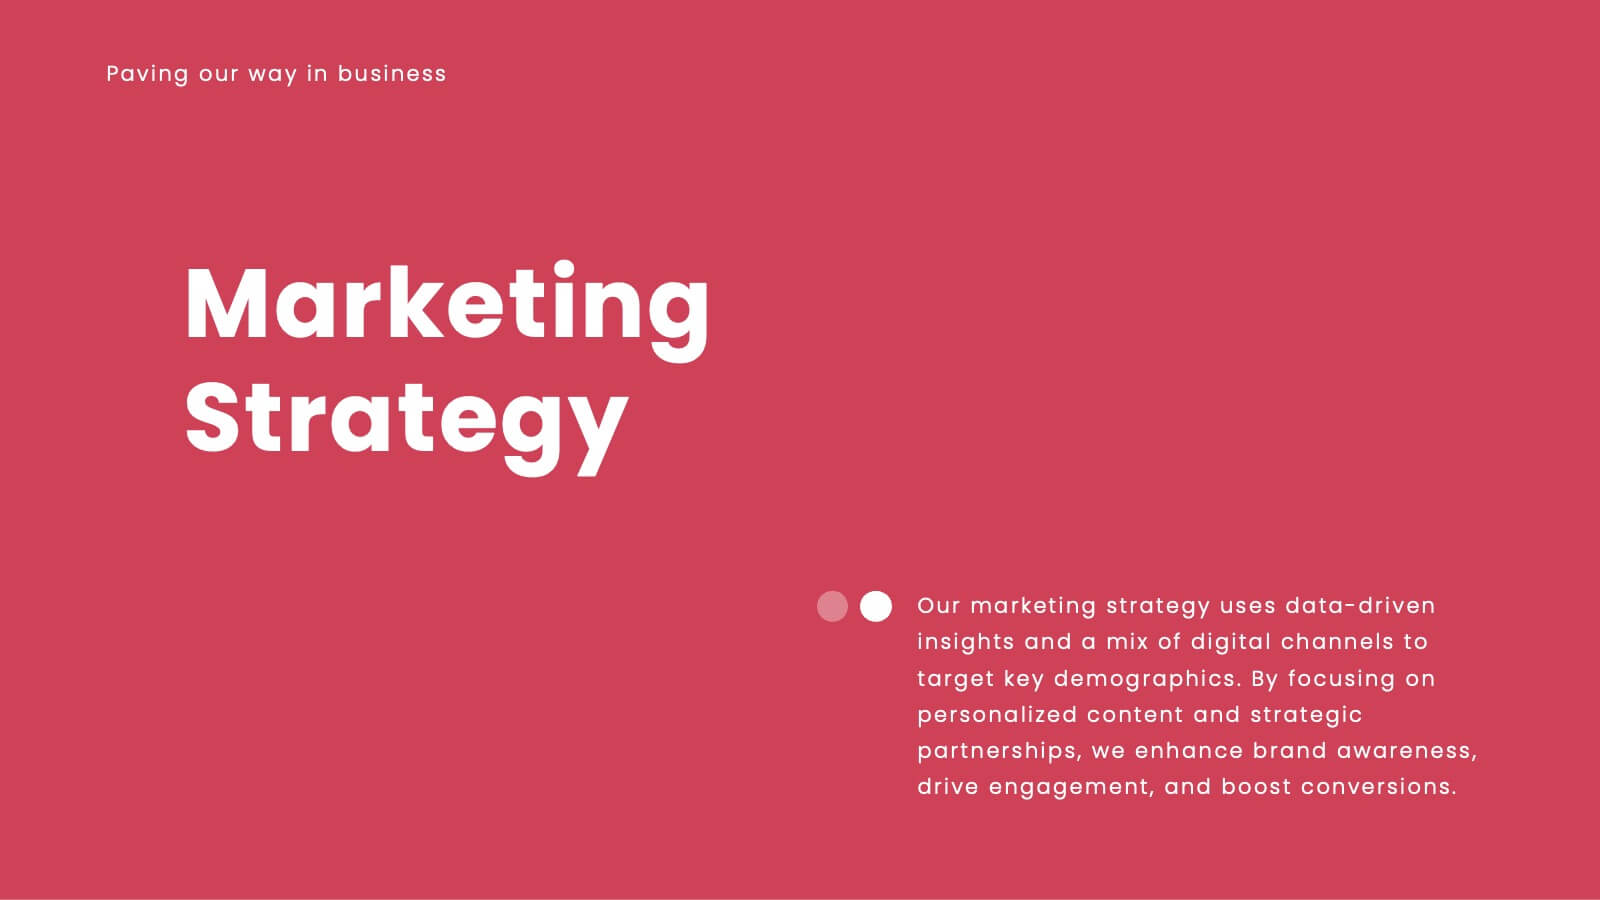
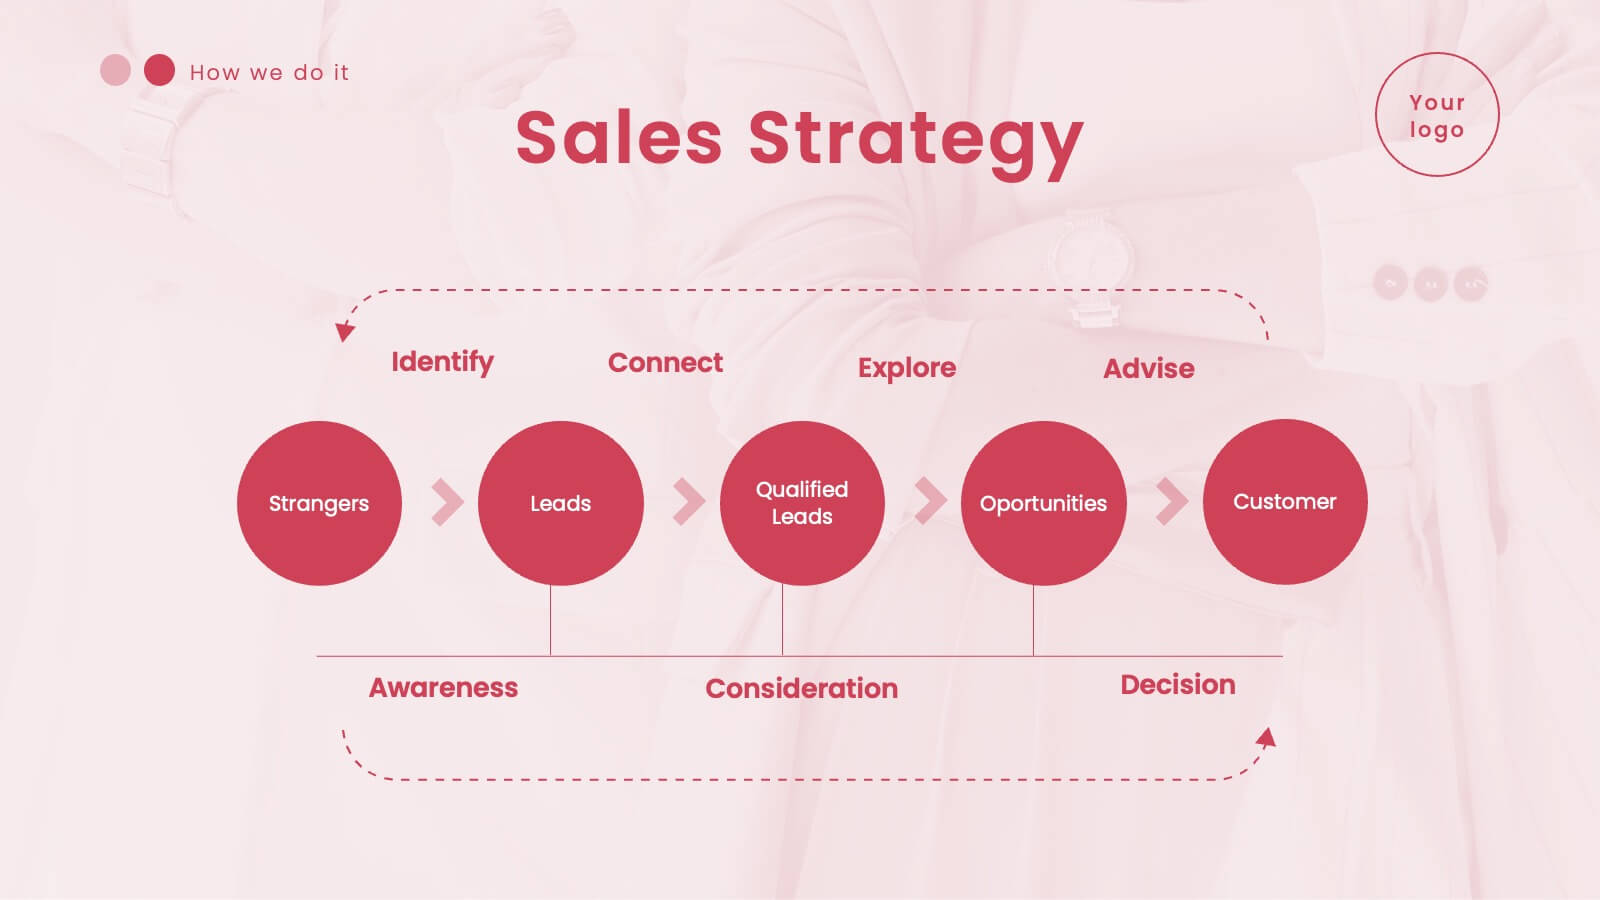
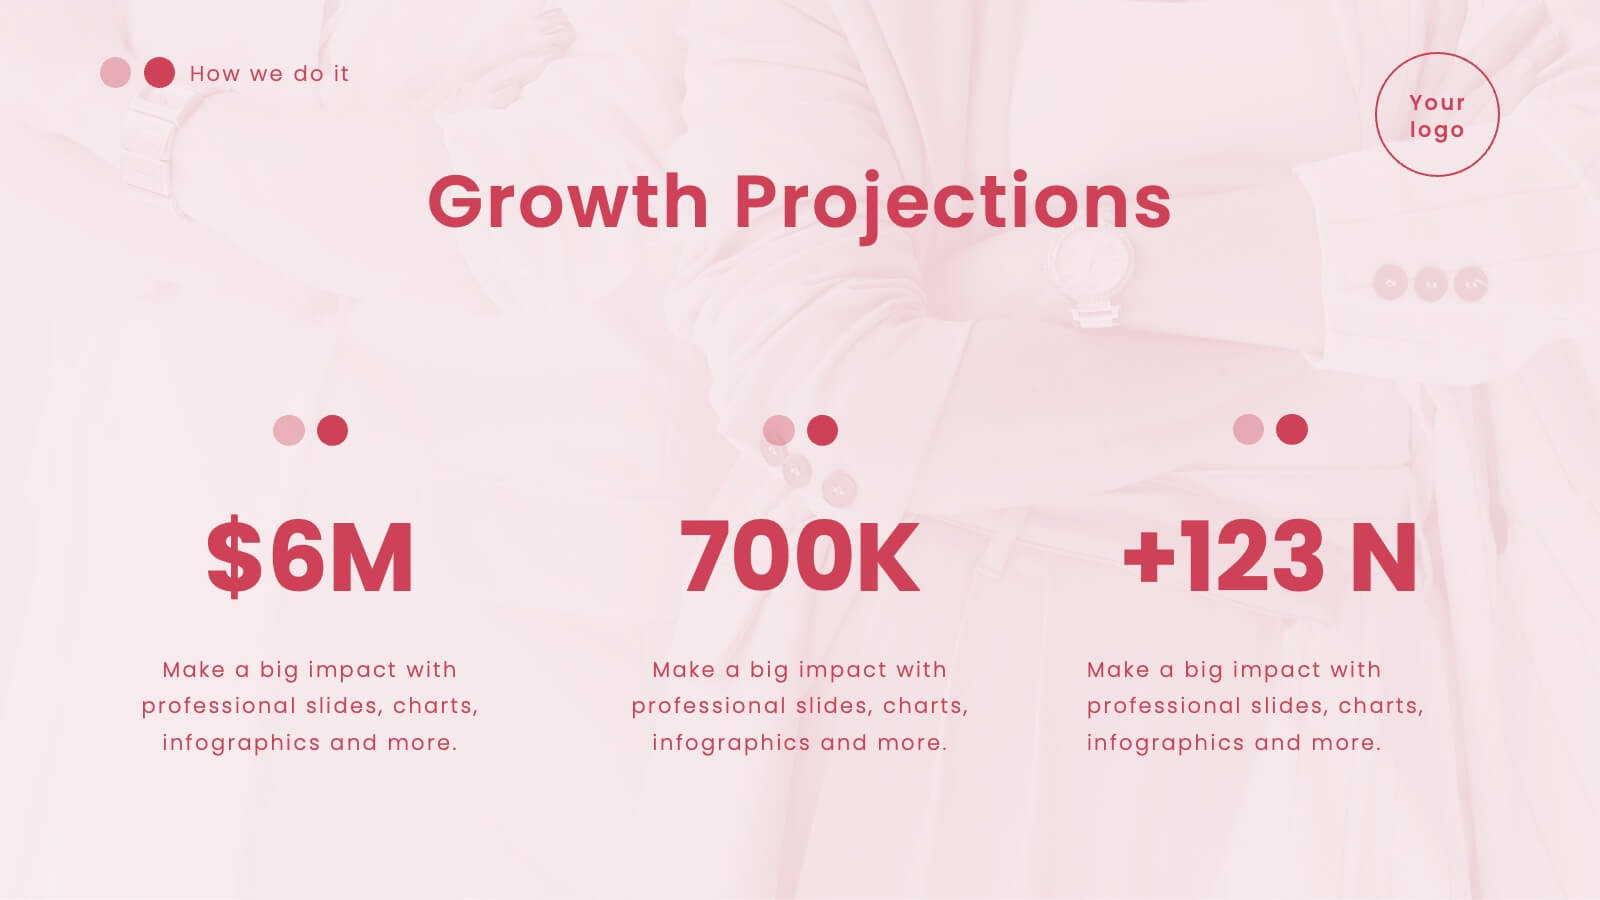
Innovation-Driven Culture and Vision
Present your strategy with clarity using the Innovation-Driven Culture and Vision Presentation. This clean, modern layout features five vertical icon markers to highlight key pillars of innovation. Ideal for leadership talks or team strategy meetings. Fully customizable in PowerPoint, Keynote, and Google Slides for easy edits and branding.

22 diapositivas
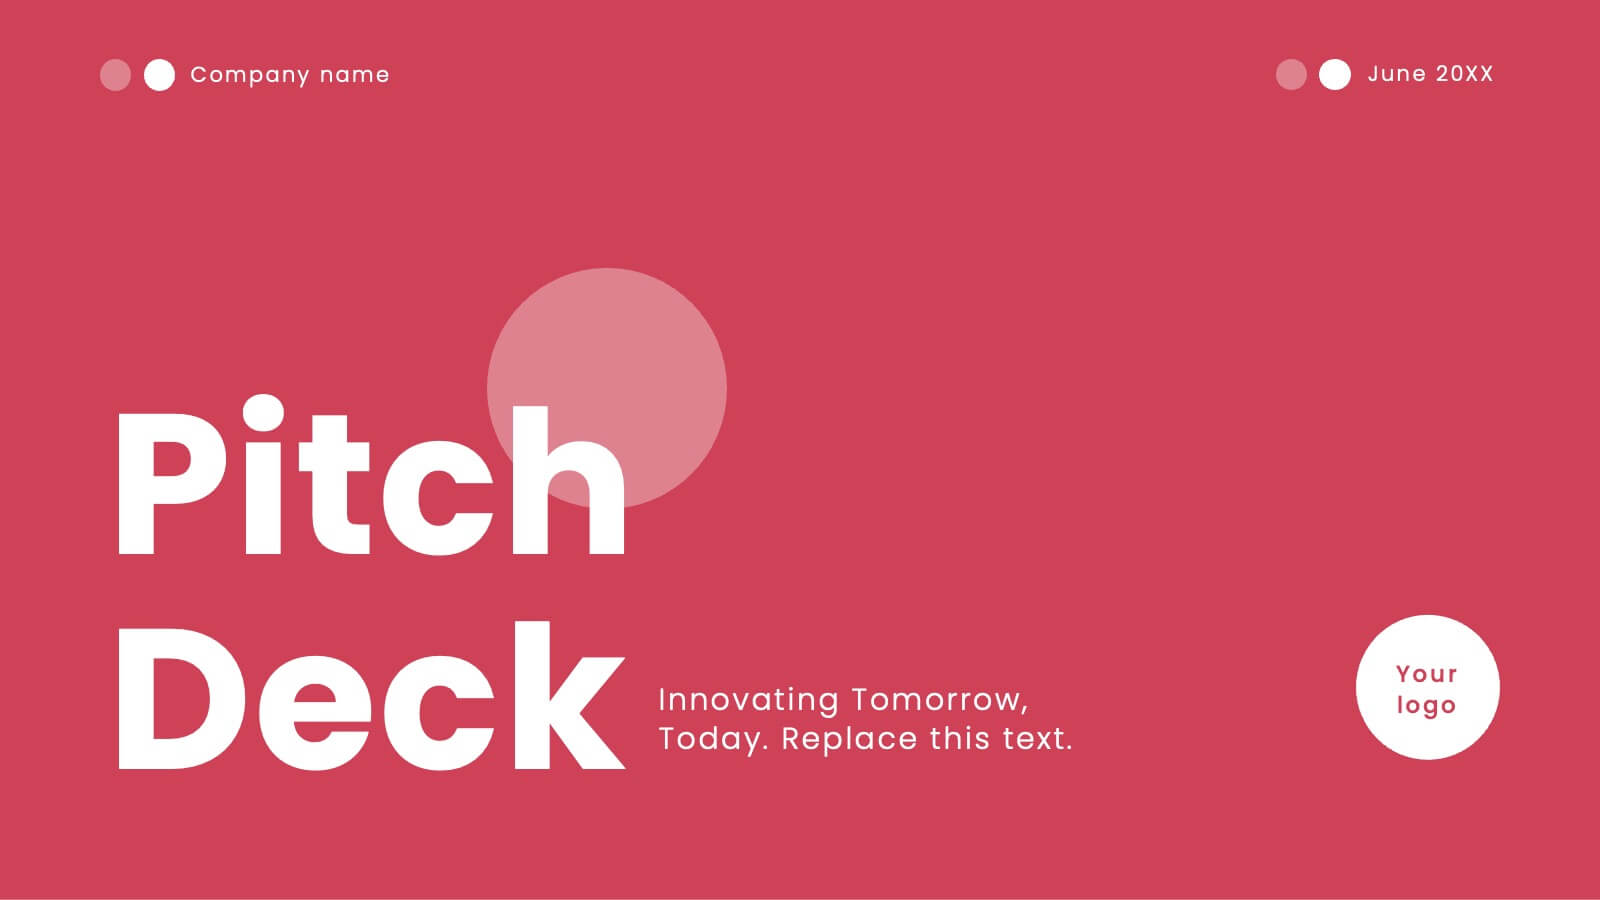
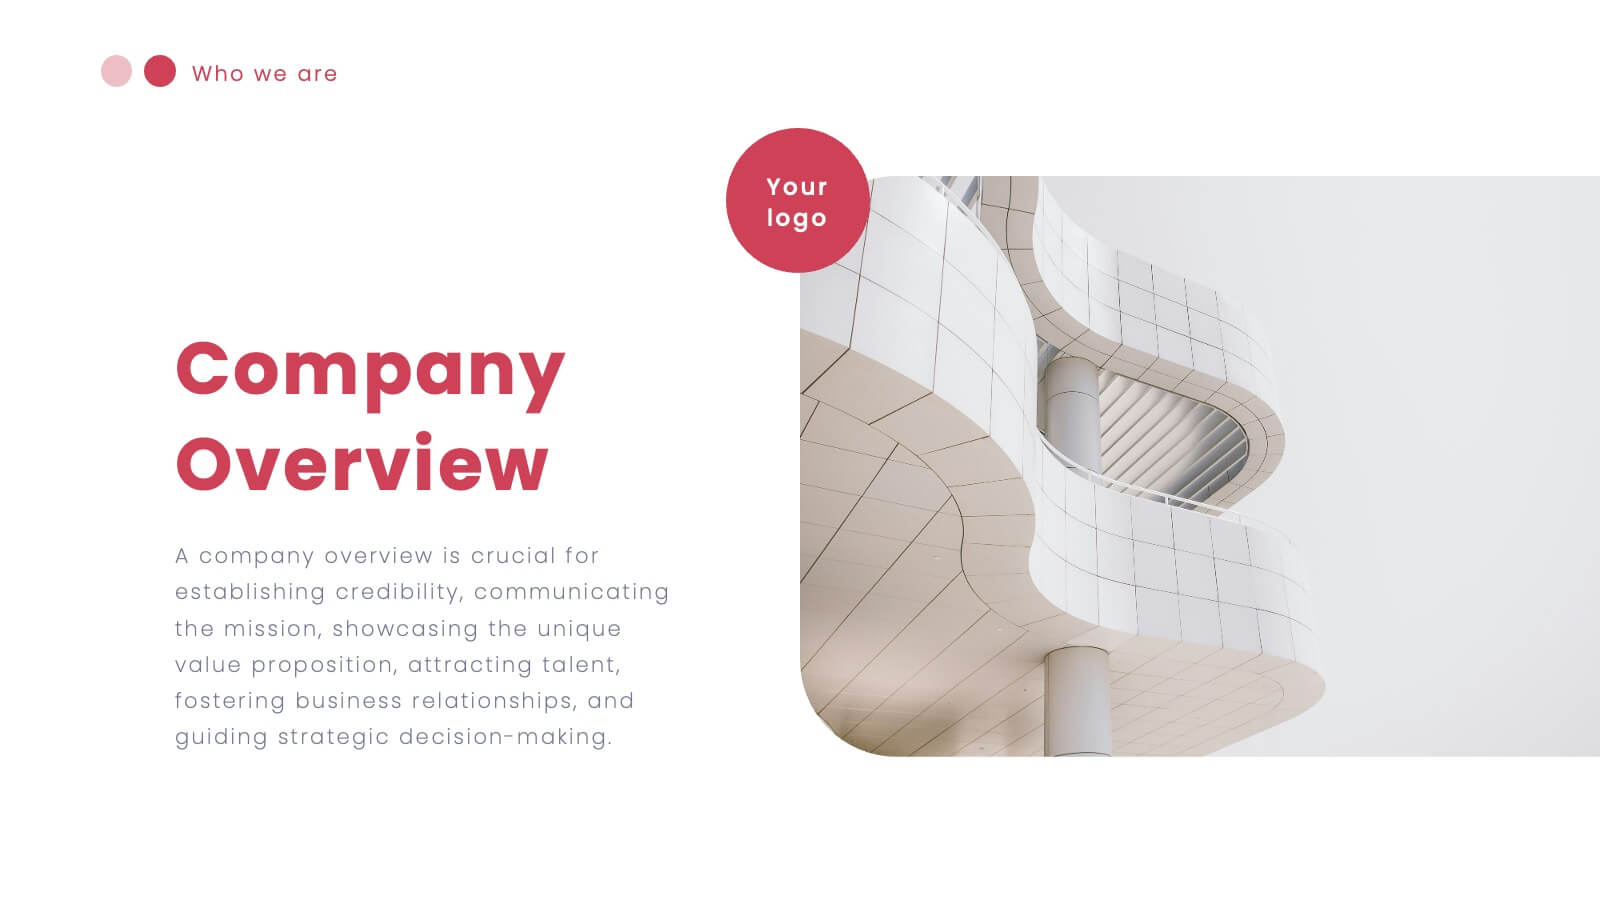
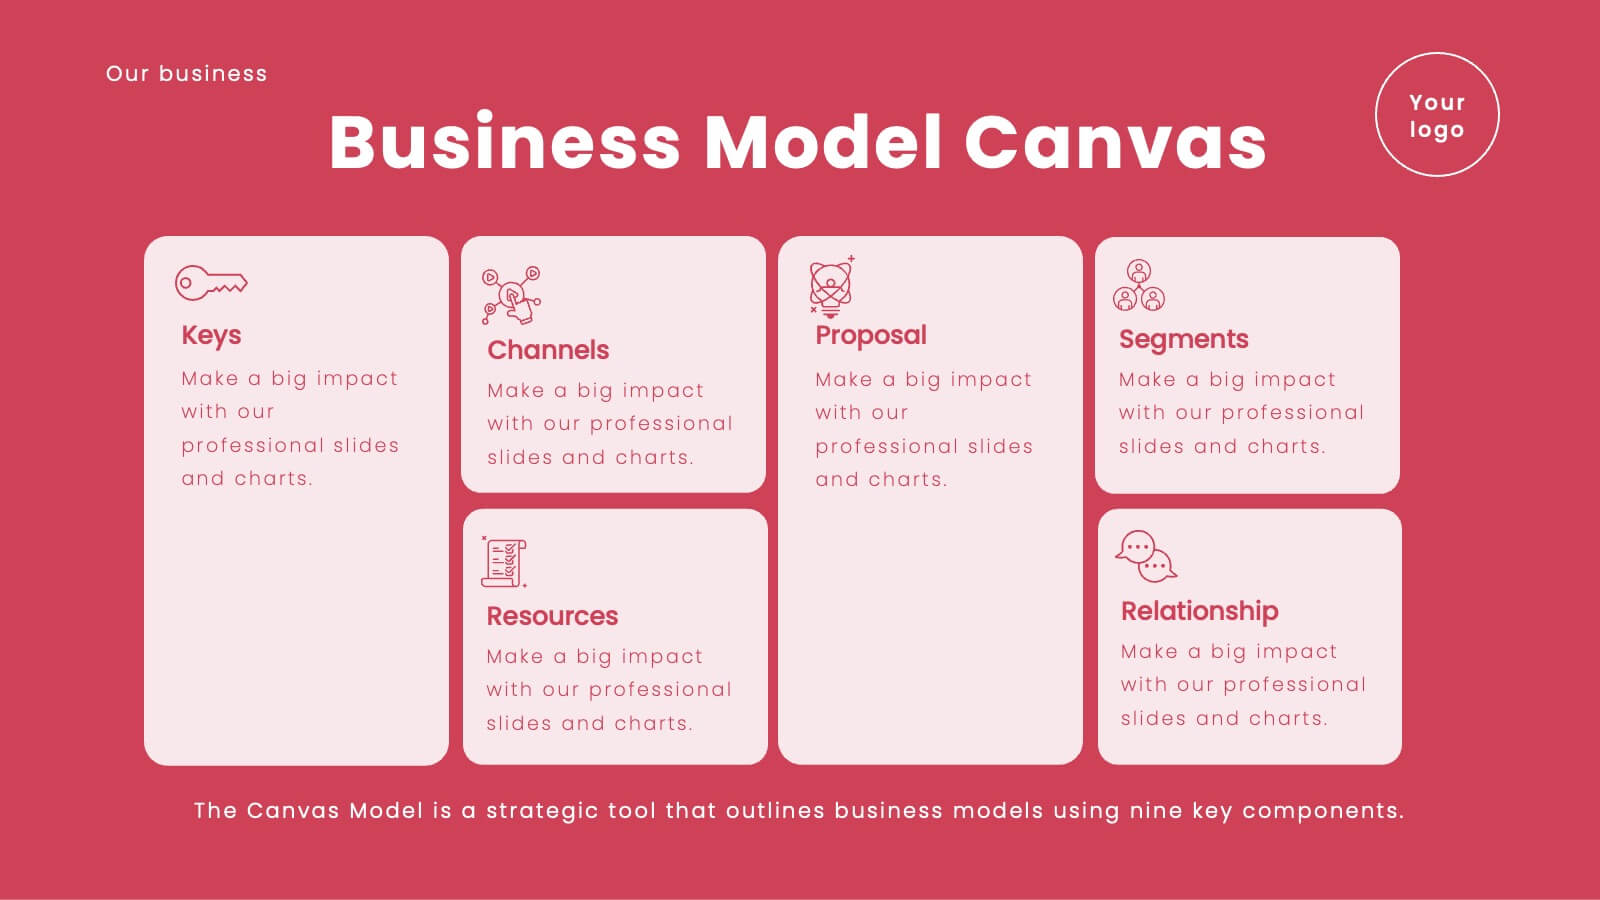
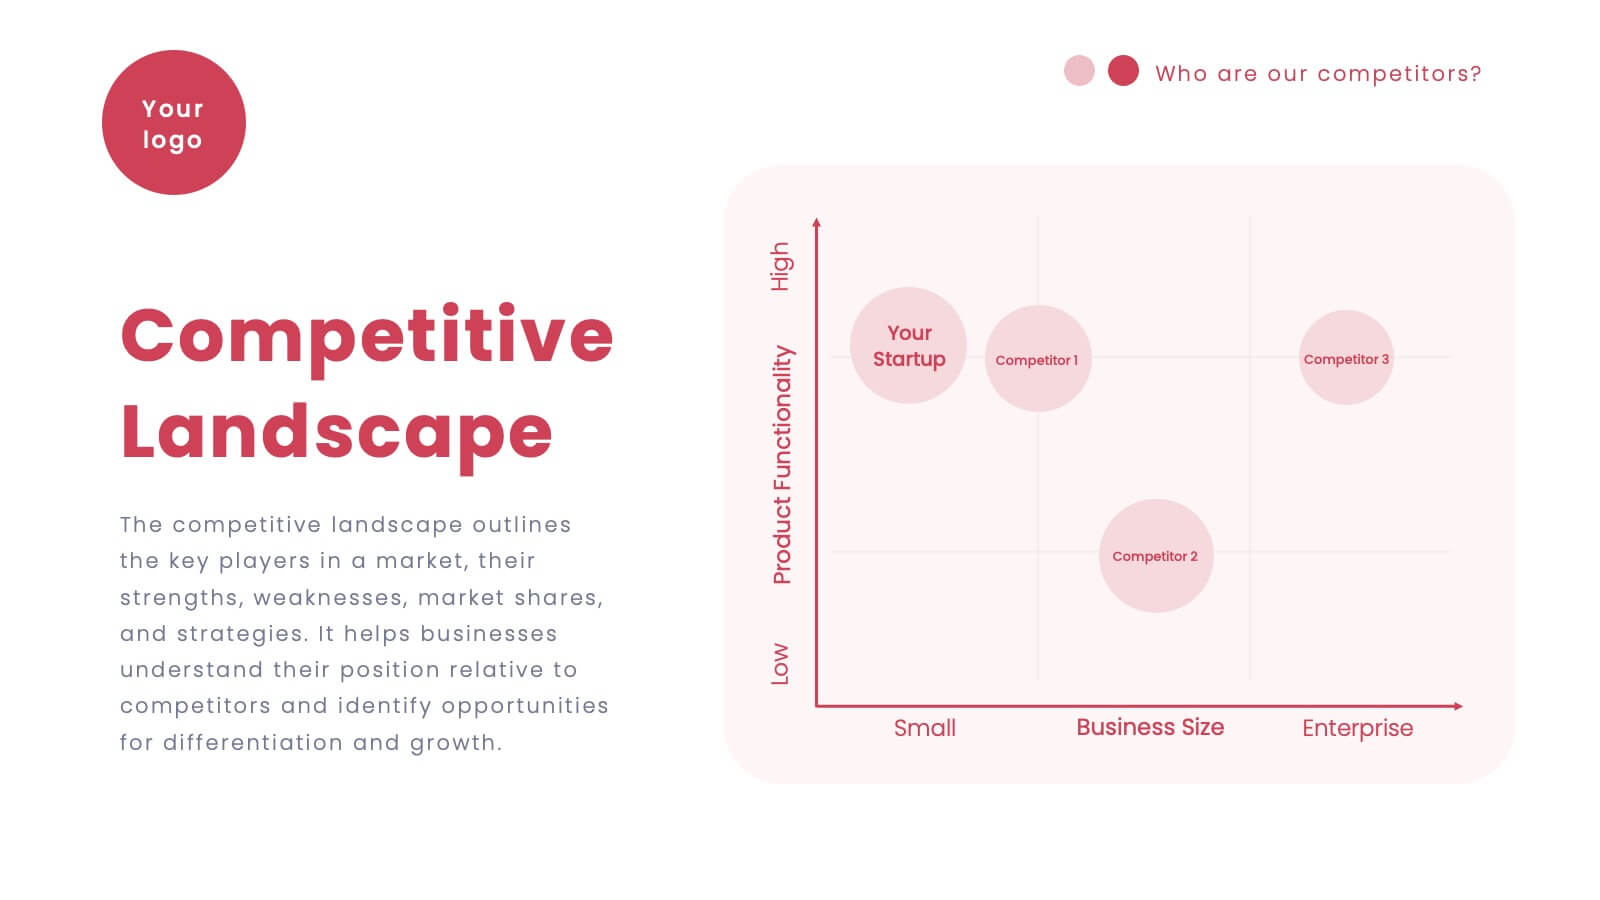
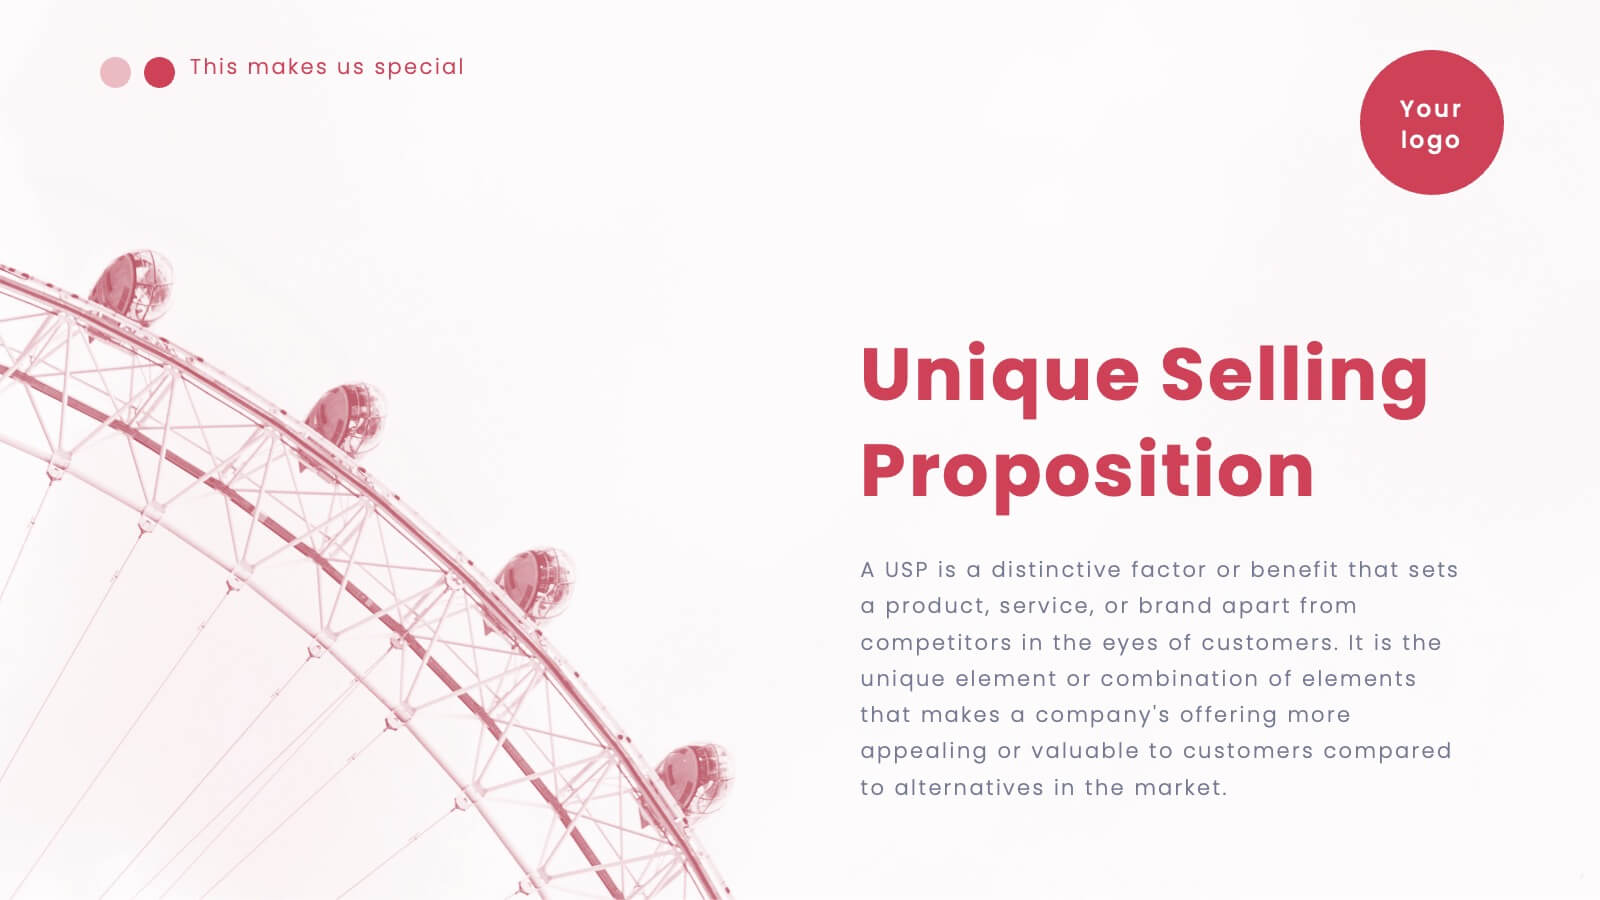
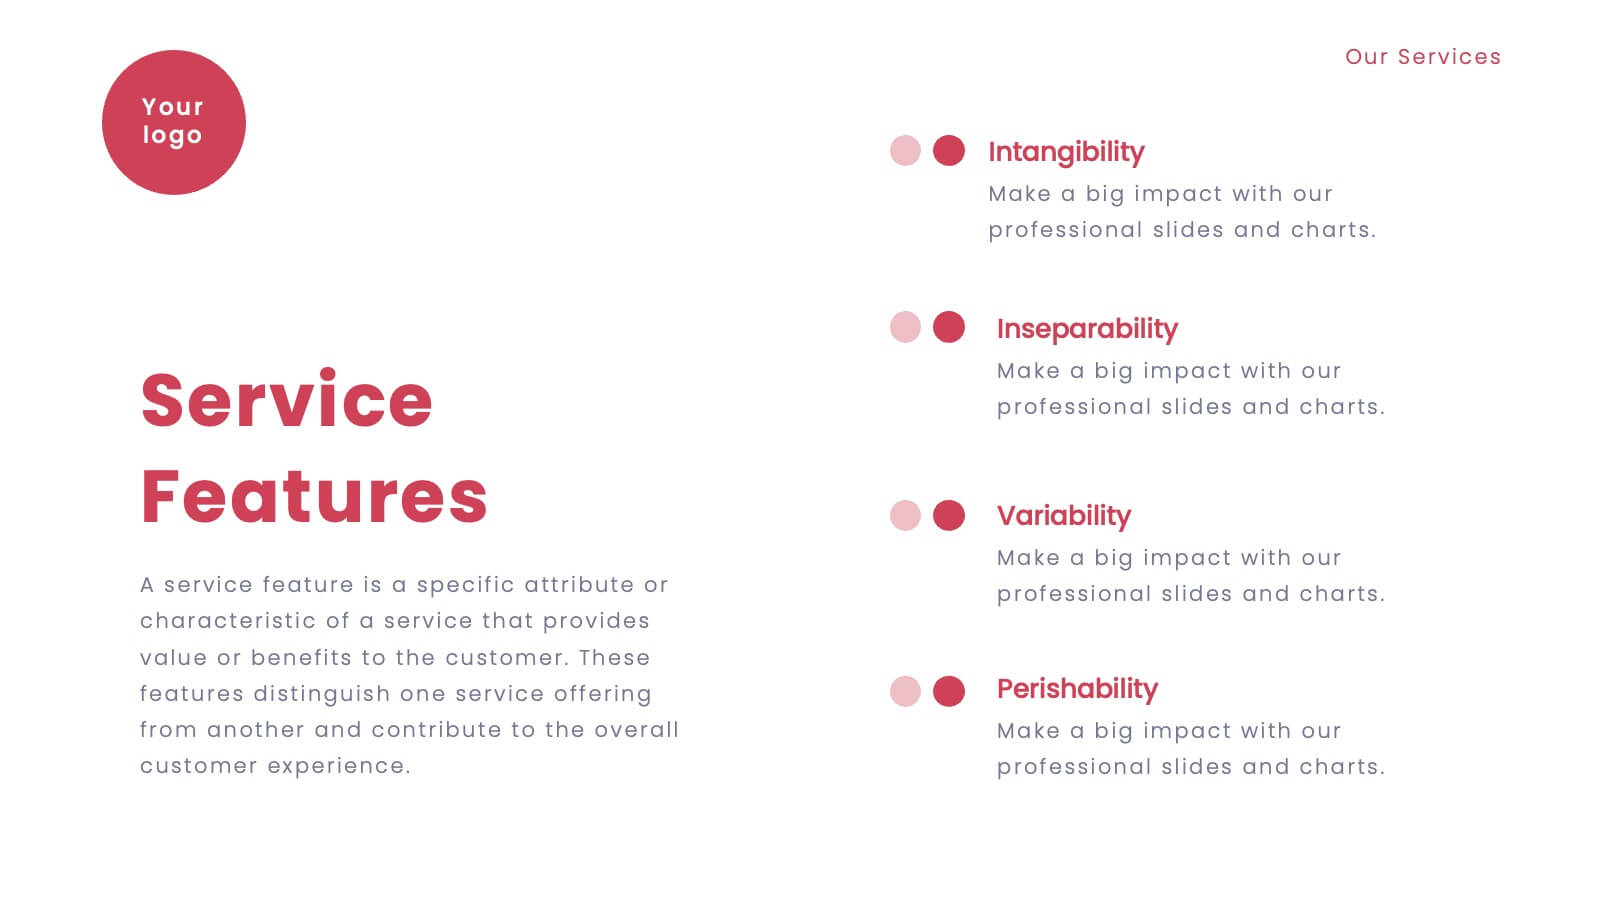
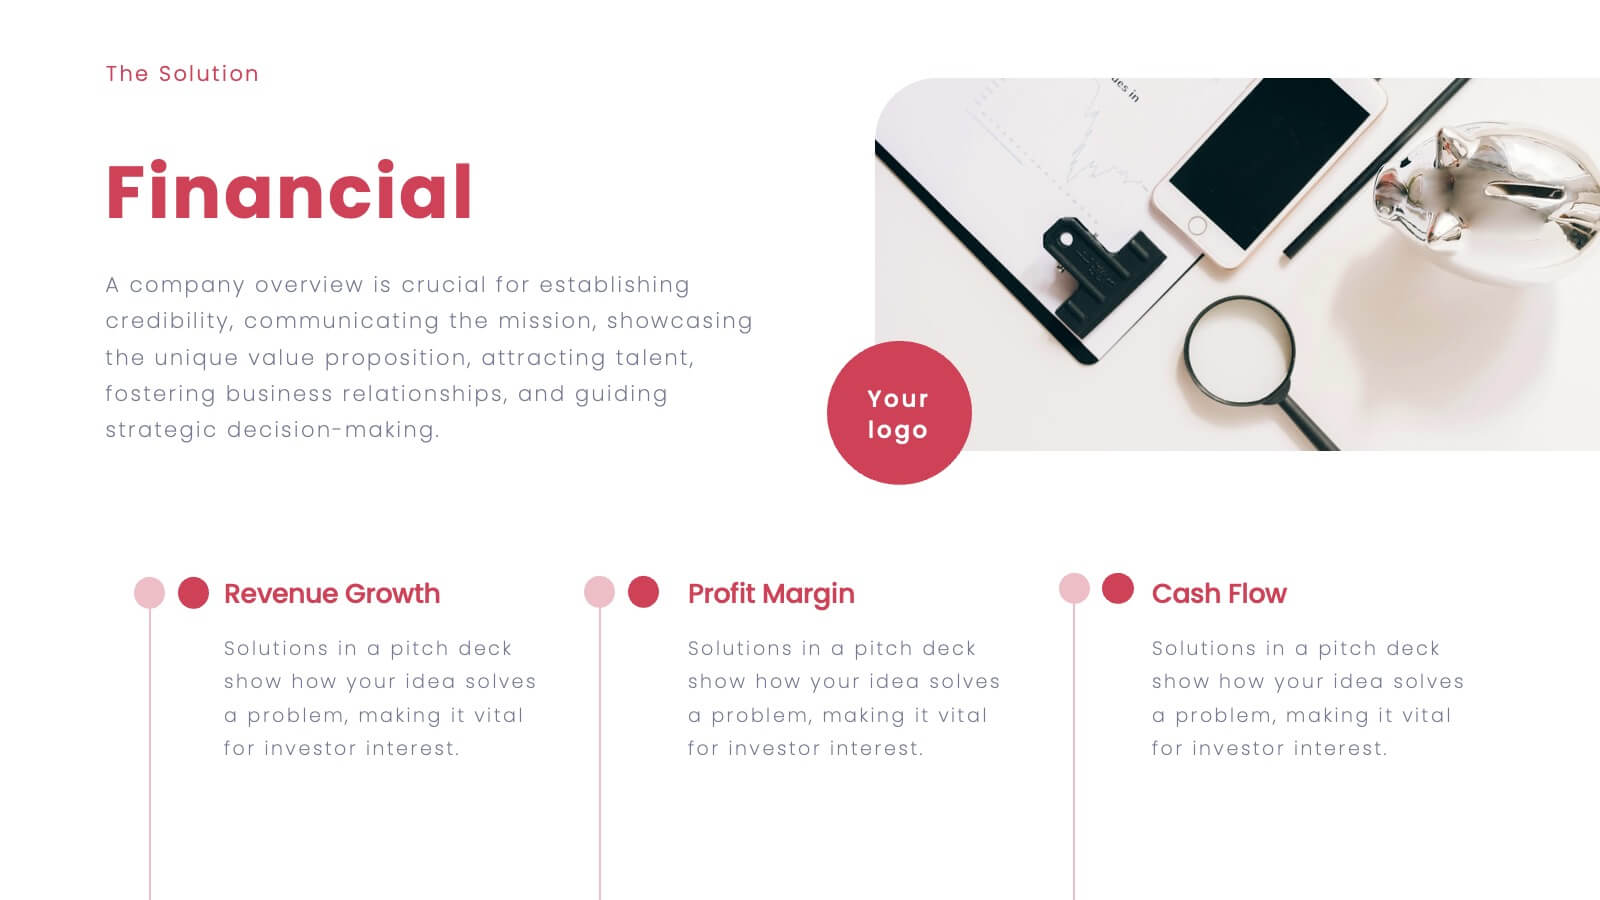
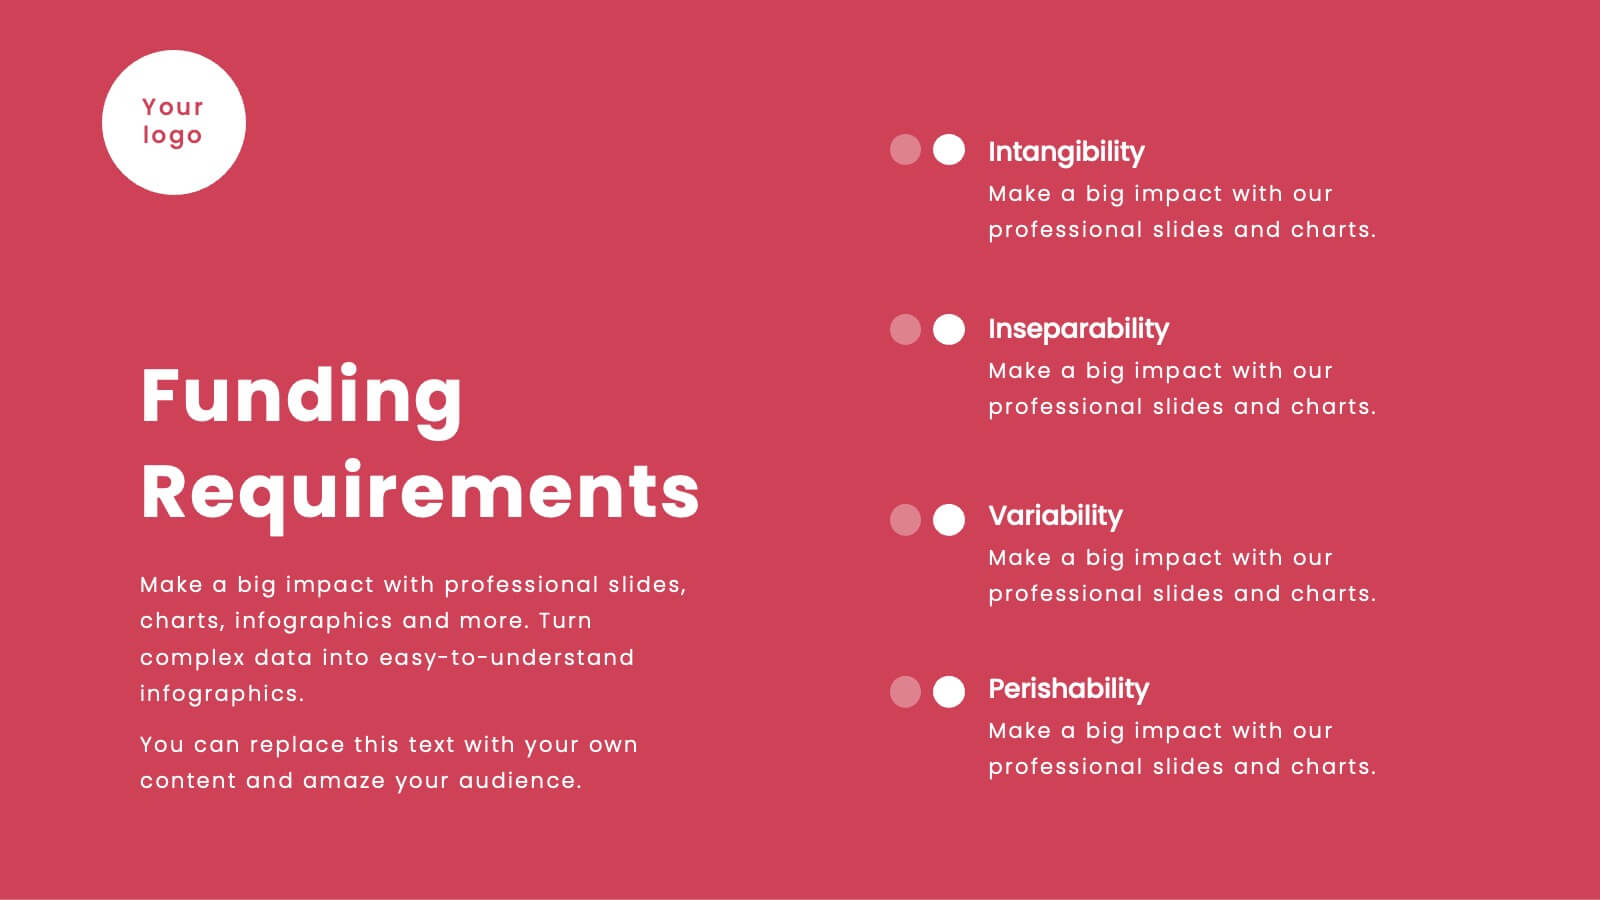
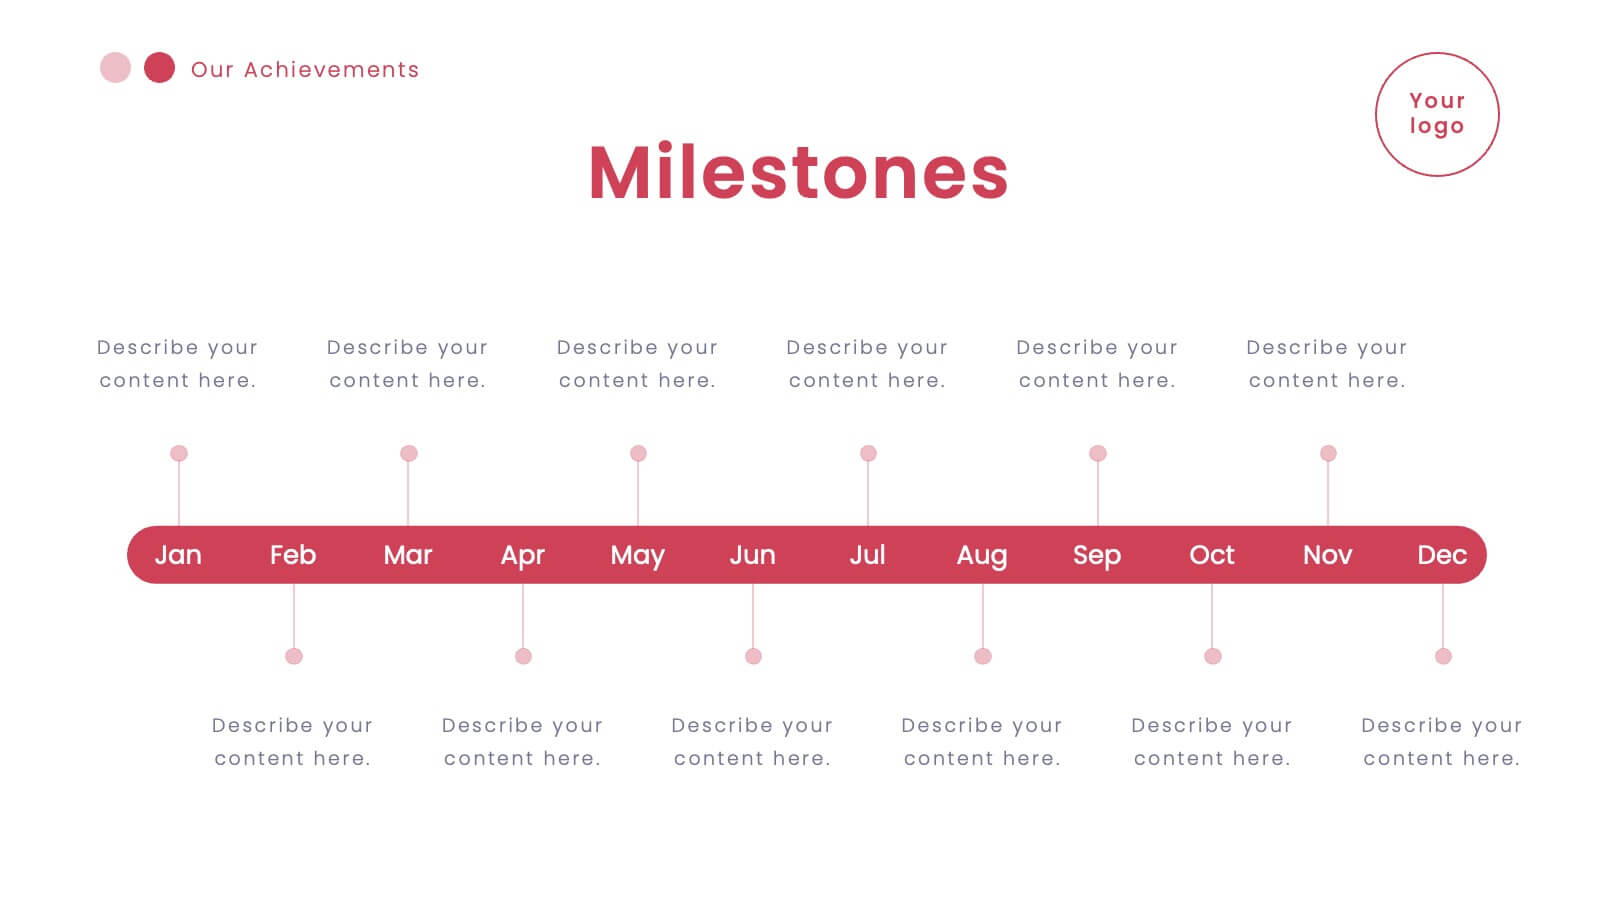
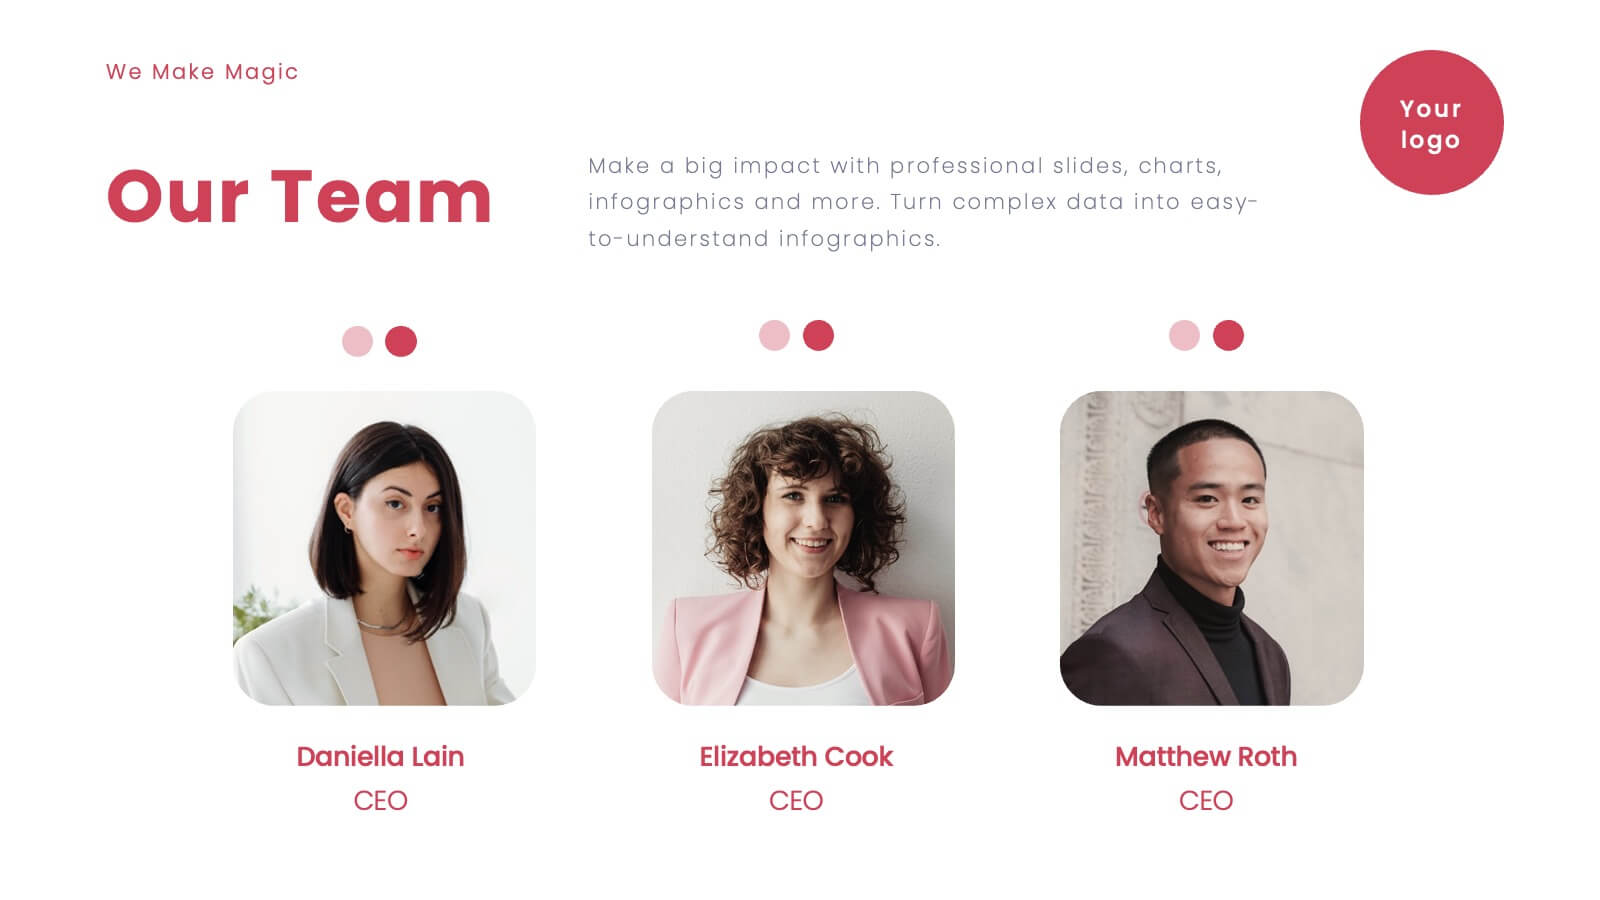
Vortex Startup Pitch Deck Presentation
Launch your ideas into action with this vibrant red pitch deck template, designed to captivate and inform potential investors. It covers everything from company overview to financials and market strategy, ensuring your vision is communicated effectively. Compatible with PowerPoint, Google Slides, and Keynote, this template is perfect for startups seeking to impress and engage.


5 diapositivas
Team and Client Feedback Collection Strategy
Gather actionable insights with the Team and Client Feedback Collection Strategy Presentation. This slide layout uses a balanced circular and rating-star design to showcase four core feedback sources—ideal for presenting survey outcomes, satisfaction metrics, and review strategies. Fully editable in PowerPoint, Keynote, and Google Slides.


21 diapositivas
Galactic Strategic Planning Report Presentation
Launch your strategic vision into the stars with this captivating Galactic-themed presentation template! Ideal for presenting a strategic planning report, it allows you to outline goals, action plans, and performance metrics with a sleek, cosmic design that captures attention. Compatible with PowerPoint, Keynote, and Google Slides for easy, seamless customization.