


Características
- 26 Unique slides
- Fully editable and easy to edit in Microsoft Powerpoint, Keynote and Google Slides
- 16:9 widescreen layout
- Clean and professional designs
- Export to JPG, PDF or send by email


¿Tienes alguna pregunta?
Recomendar


7 diapositivas
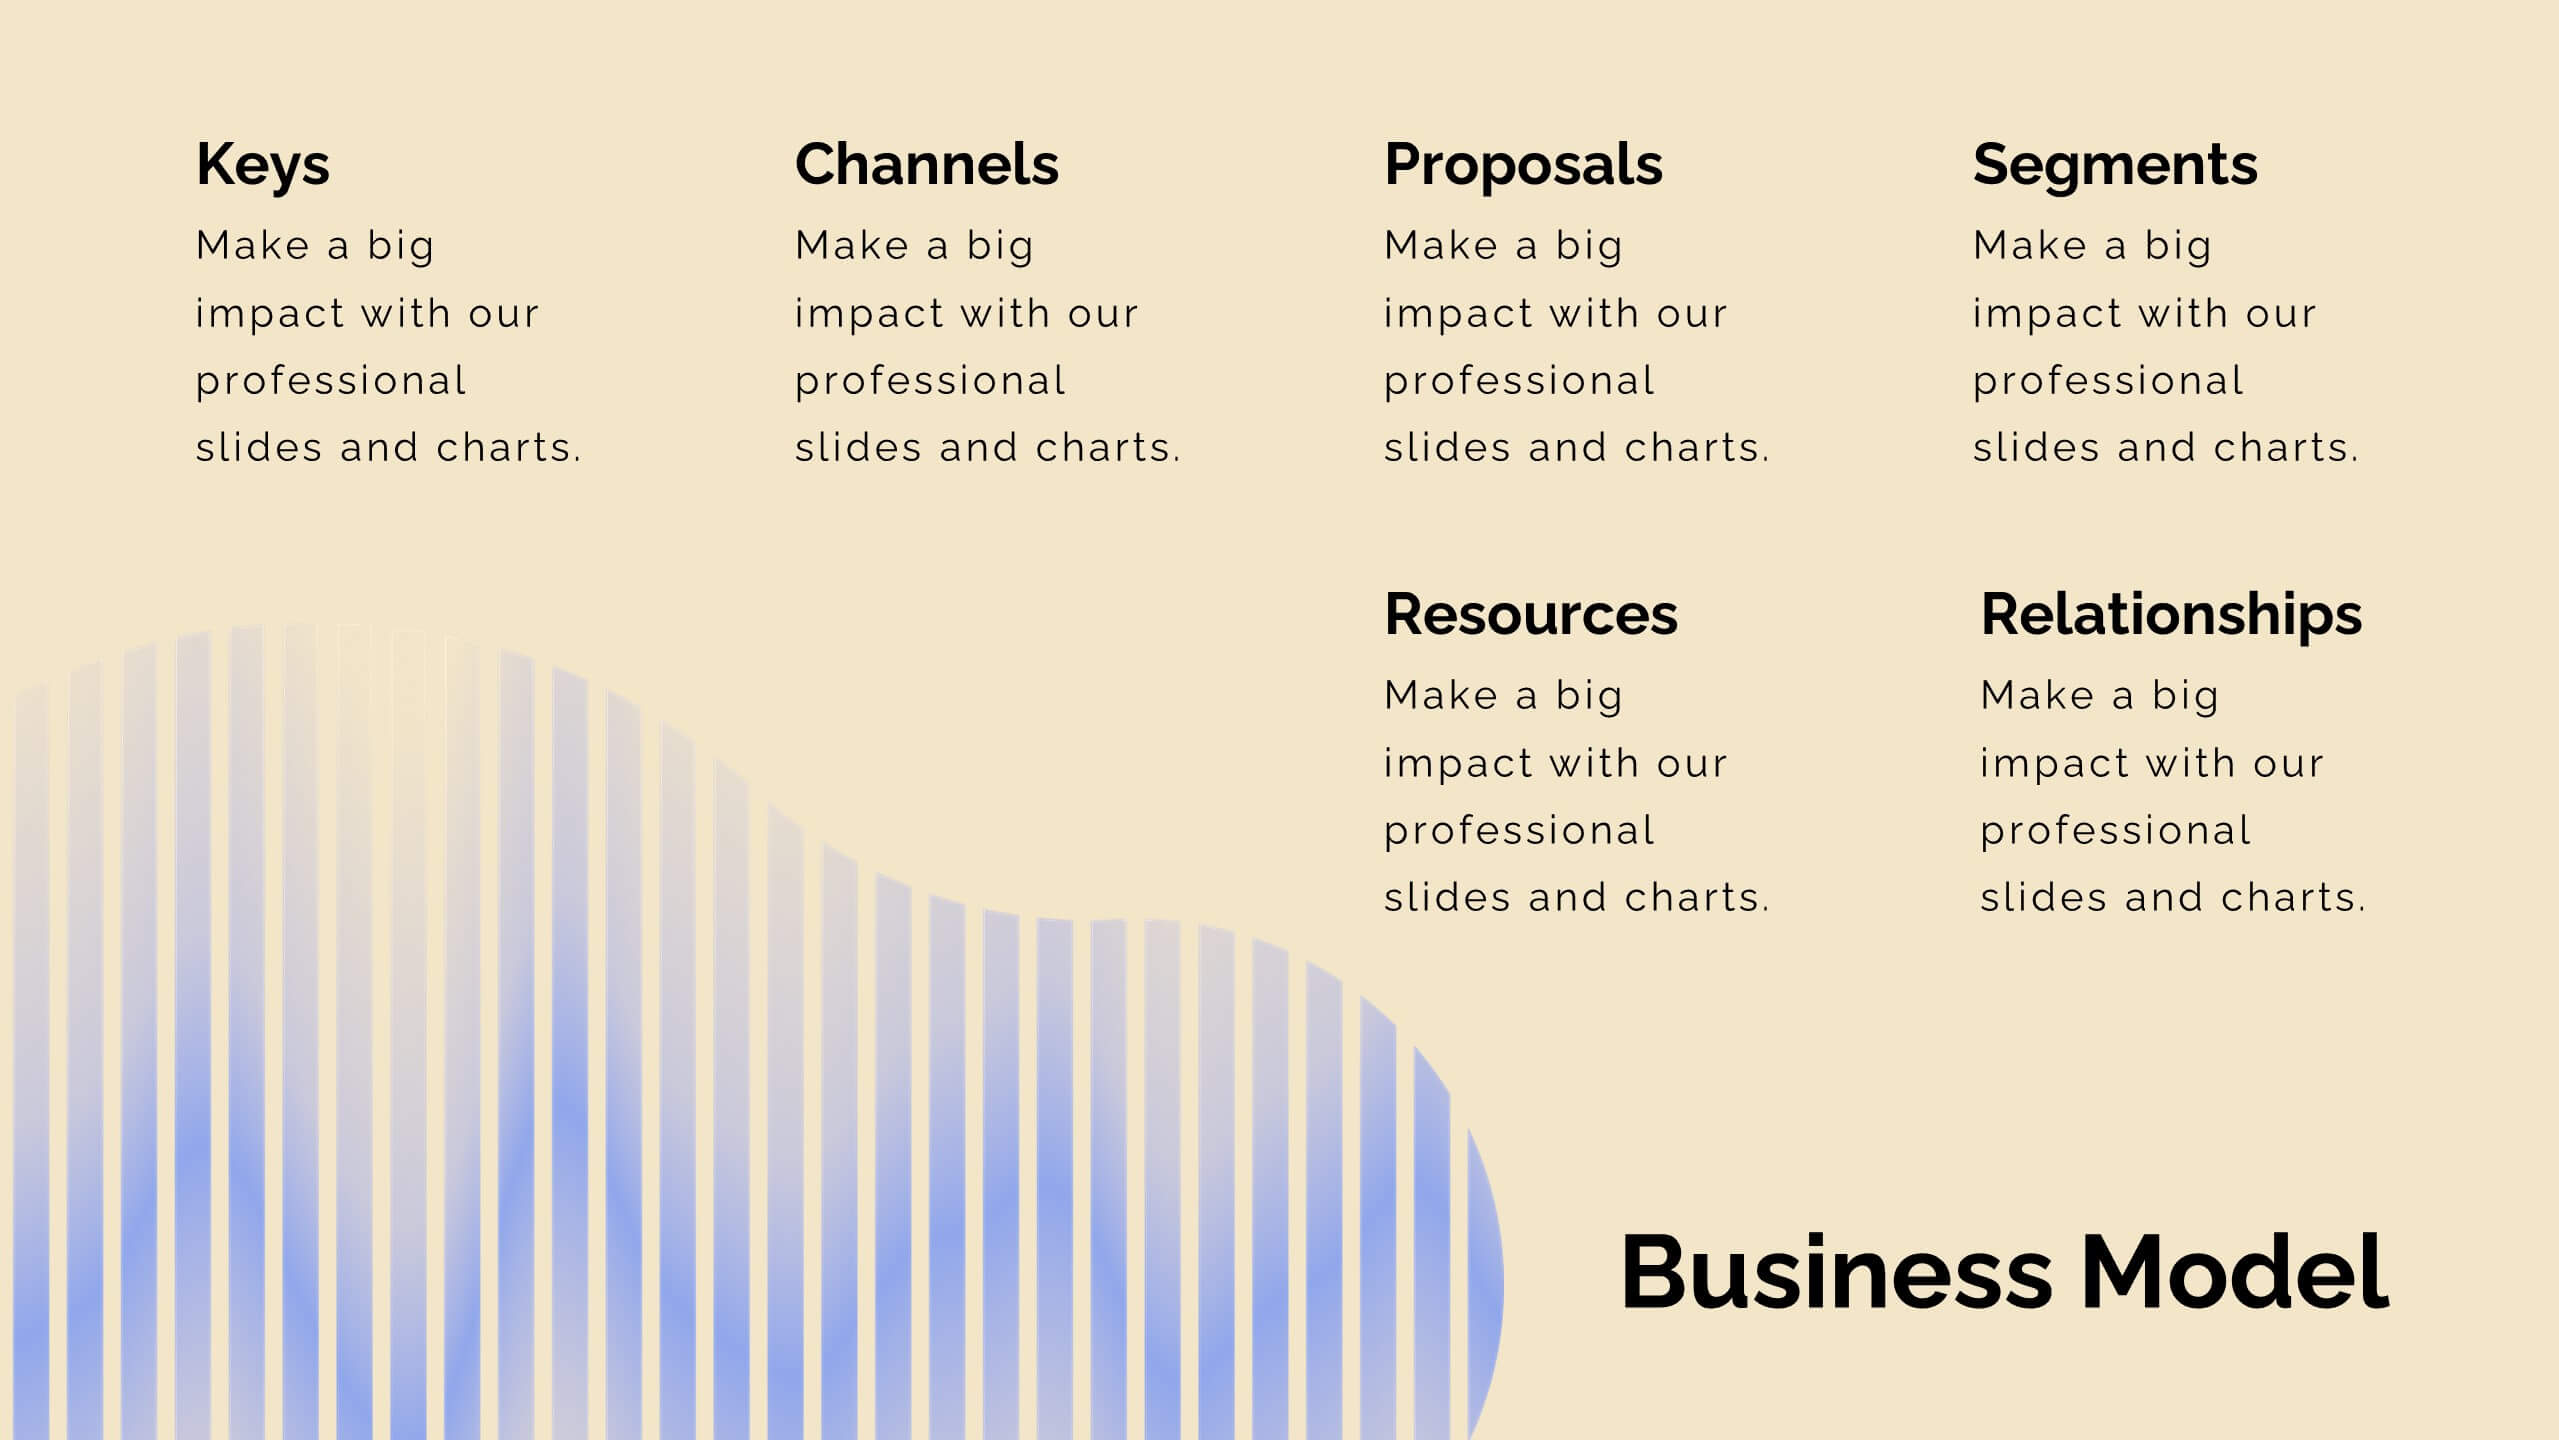
One-Page Business Model Overview Presentation
Simplify your business strategy with this One-Page Business Model slide. Perfect for pitches or internal reviews, it maps out key elements like partners, activities, customers, and revenue on a single page. Clean, customizable blocks help communicate your vision clearly—ideal for startups, entrepreneurs, and teams needing quick business clarity.


6 diapositivas
Business Triangle Model Presentation
Visualize the core components of business success with the Business Triangle Model template. This structured framework highlights three interconnected elements, making it ideal for strategic planning, risk assessment, and performance analysis. Customize it effortlessly to suit your needs. Compatible with PowerPoint, Keynote, and Google Slides for seamless integration.


6 diapositivas
Organizational Structure Overview Presentation
Map out your team’s structure with clarity using this simple organizational chart template. Ideal for showcasing departments, reporting lines, or team roles, it helps stakeholders quickly understand who’s who and how responsibilities are divided. Perfect for internal meetings, onboarding decks, or company overviews. Works with PowerPoint, Keynote, and Google Slides.


6 diapositivas
Strategic PESTEL Presentation
Kickstart smarter strategy sessions with a clean, colorful layout that makes external factor analysis feel effortless. This presentation helps teams map trends, identify risks, and understand the broader environment shaping business decisions. Clear visuals keep insights organized and actionable. Fully compatible with PowerPoint, Keynote, and Google Slides.


4 diapositivas
Client Proposal Overview Presentation
Present your ideas with confidence using a sleek and structured layout that turns client insights into a compelling story. Ideal for outlining project goals, value propositions, or proposal summaries, this template keeps every detail polished and professional. Fully compatible with PowerPoint, Keynote, and Google Slides for effortless customization.


4 diapositivas
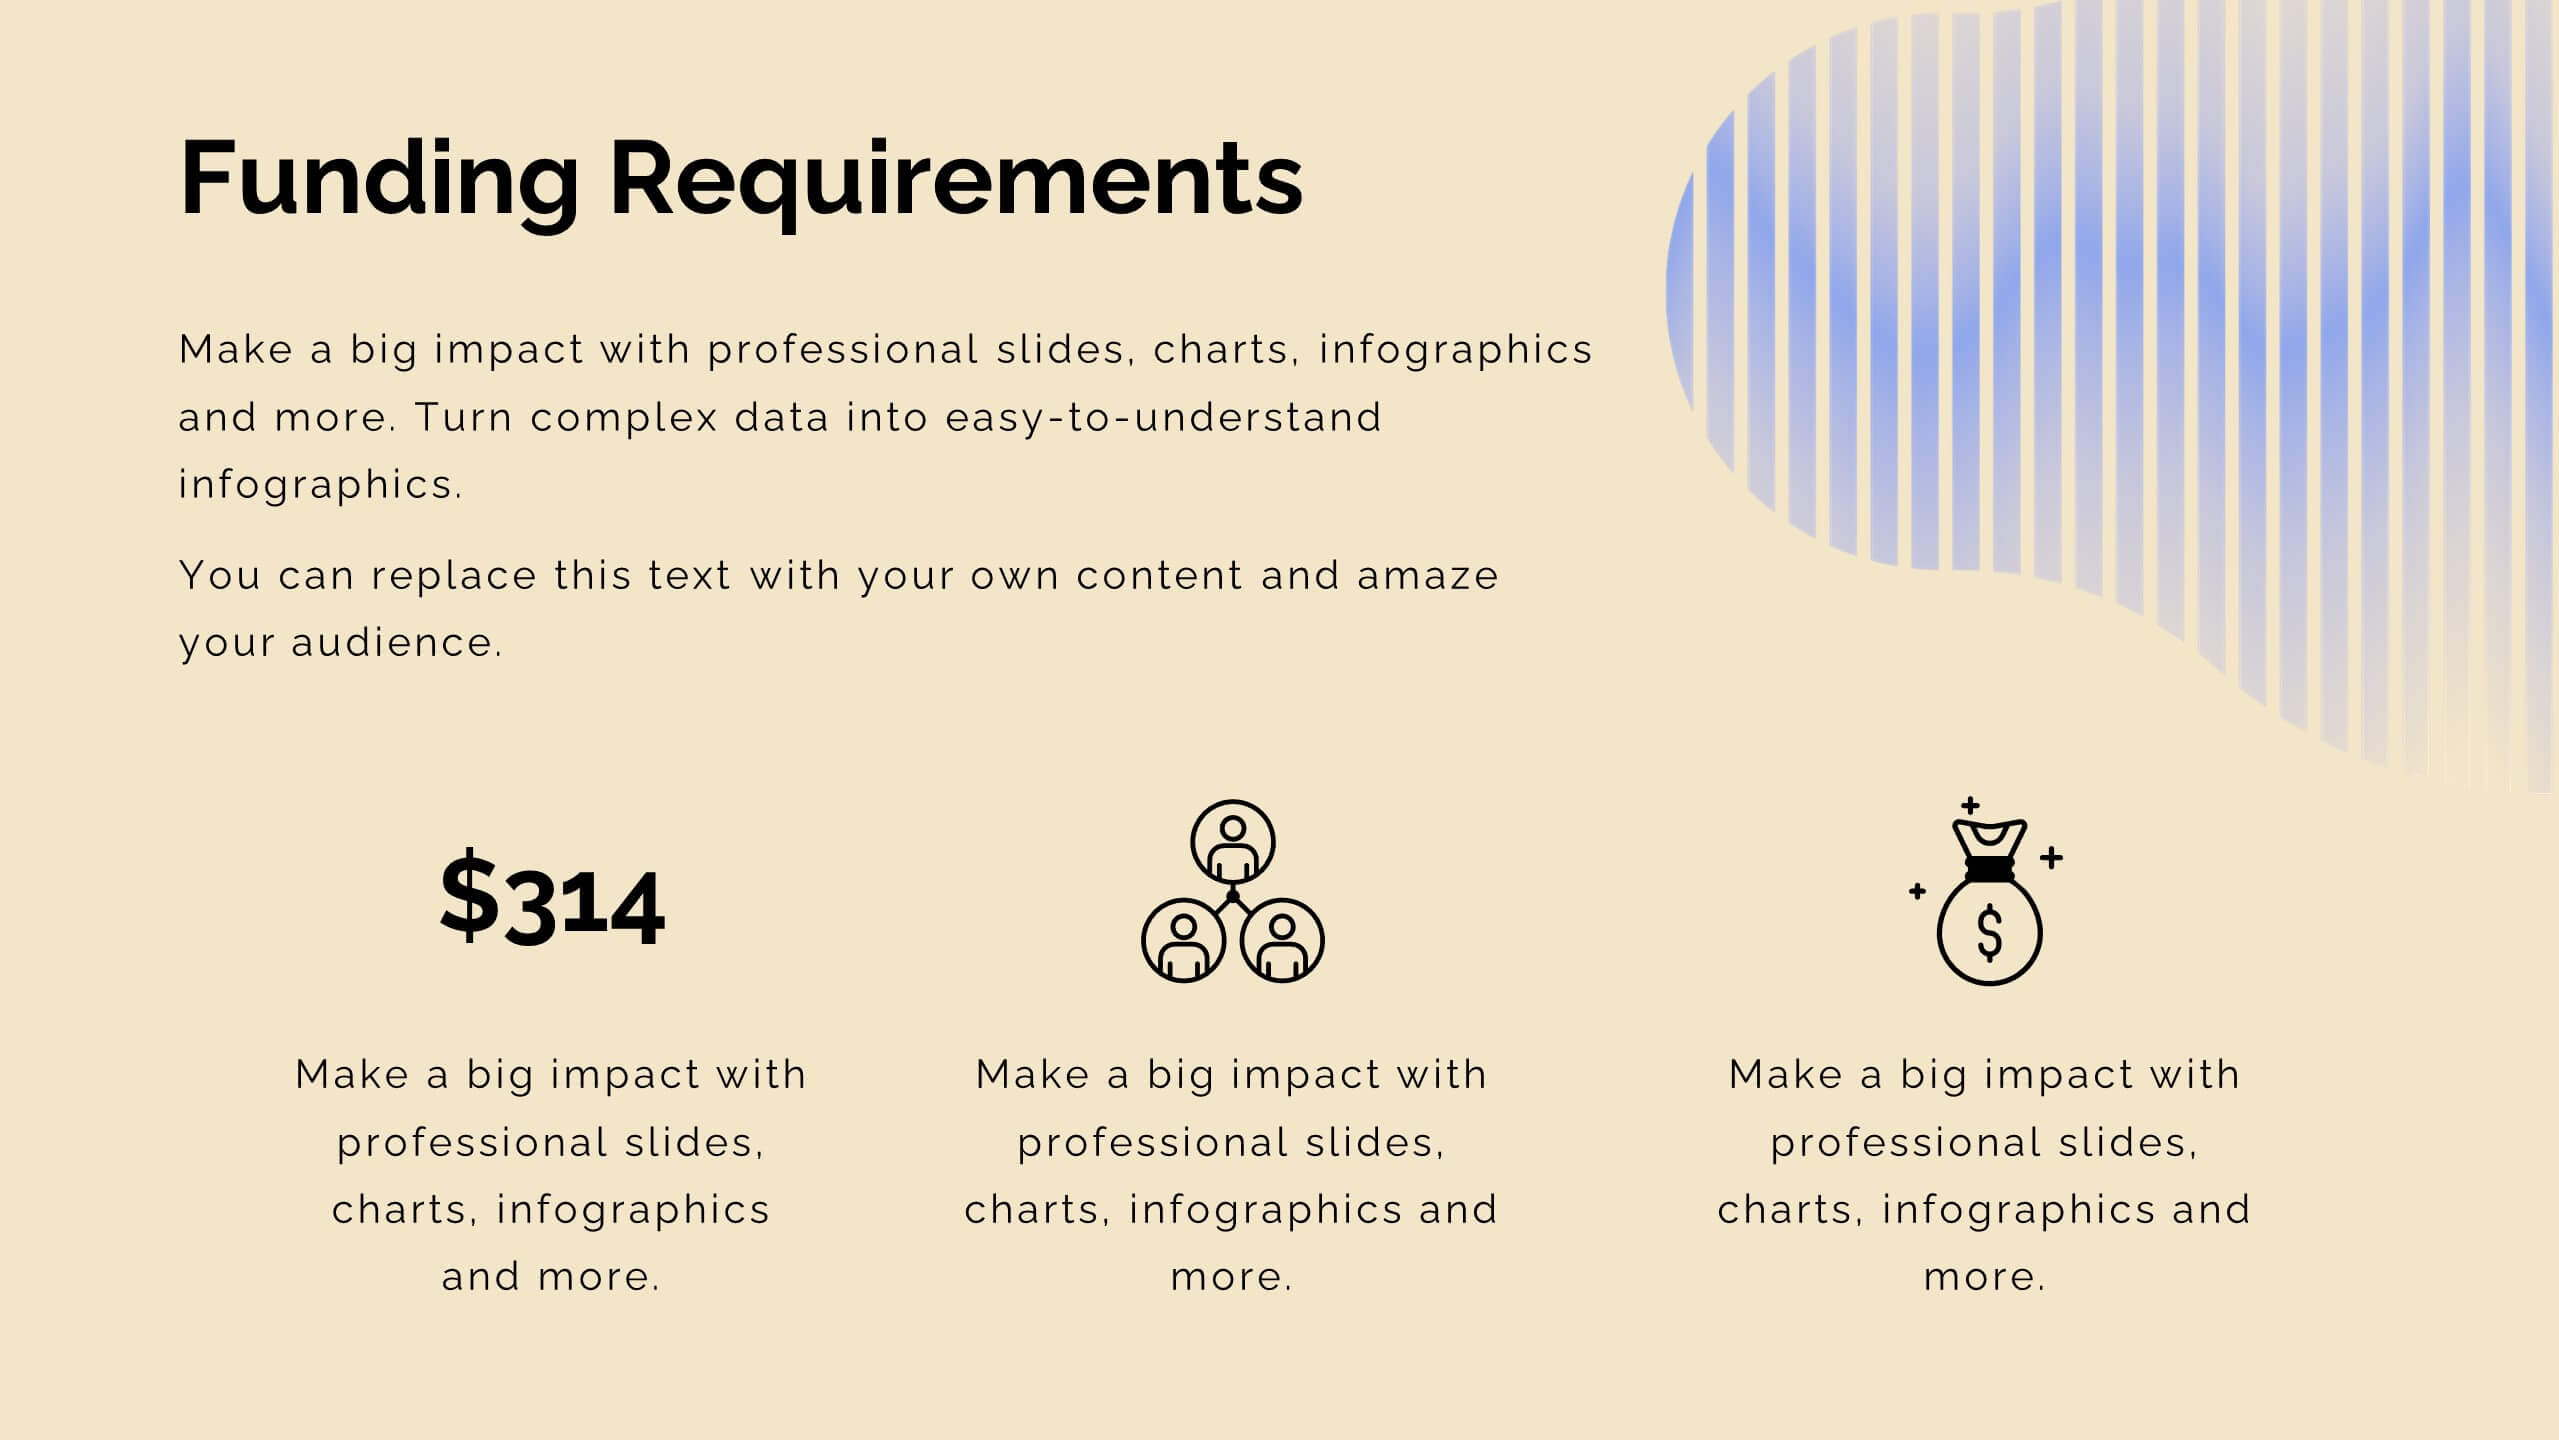
Key Business Statistics Presentation
Transform raw numbers into a compelling visual story with a clean and structured layout that highlights key insights effortlessly. Ideal for showcasing progress, analytics, and results, this design helps simplify complex data for clear communication. Fully editable and compatible with PowerPoint, Keynote, and Google Slides for seamless customization.


4 diapositivas
Elegant Watercolor Background Presentation
Add a touch of sophistication to your presentation with soft watercolor textures that create a calming, professional atmosphere. Perfect for creative projects, proposals, or portfolios, this elegant design blends artistry with clarity. Fully compatible with PowerPoint, Keynote, and Google Slides for seamless customization and a refined visual finish.


5 diapositivas
Product Development and Market Growth
Showcase each stage of your product’s journey with this 5-step column chart—from idea to market expansion. Perfect for product managers, startups, and marketing teams. Fully customizable in PowerPoint, Keynote, or Google Slides to match your brand and message effortlessly.


20 diapositivas
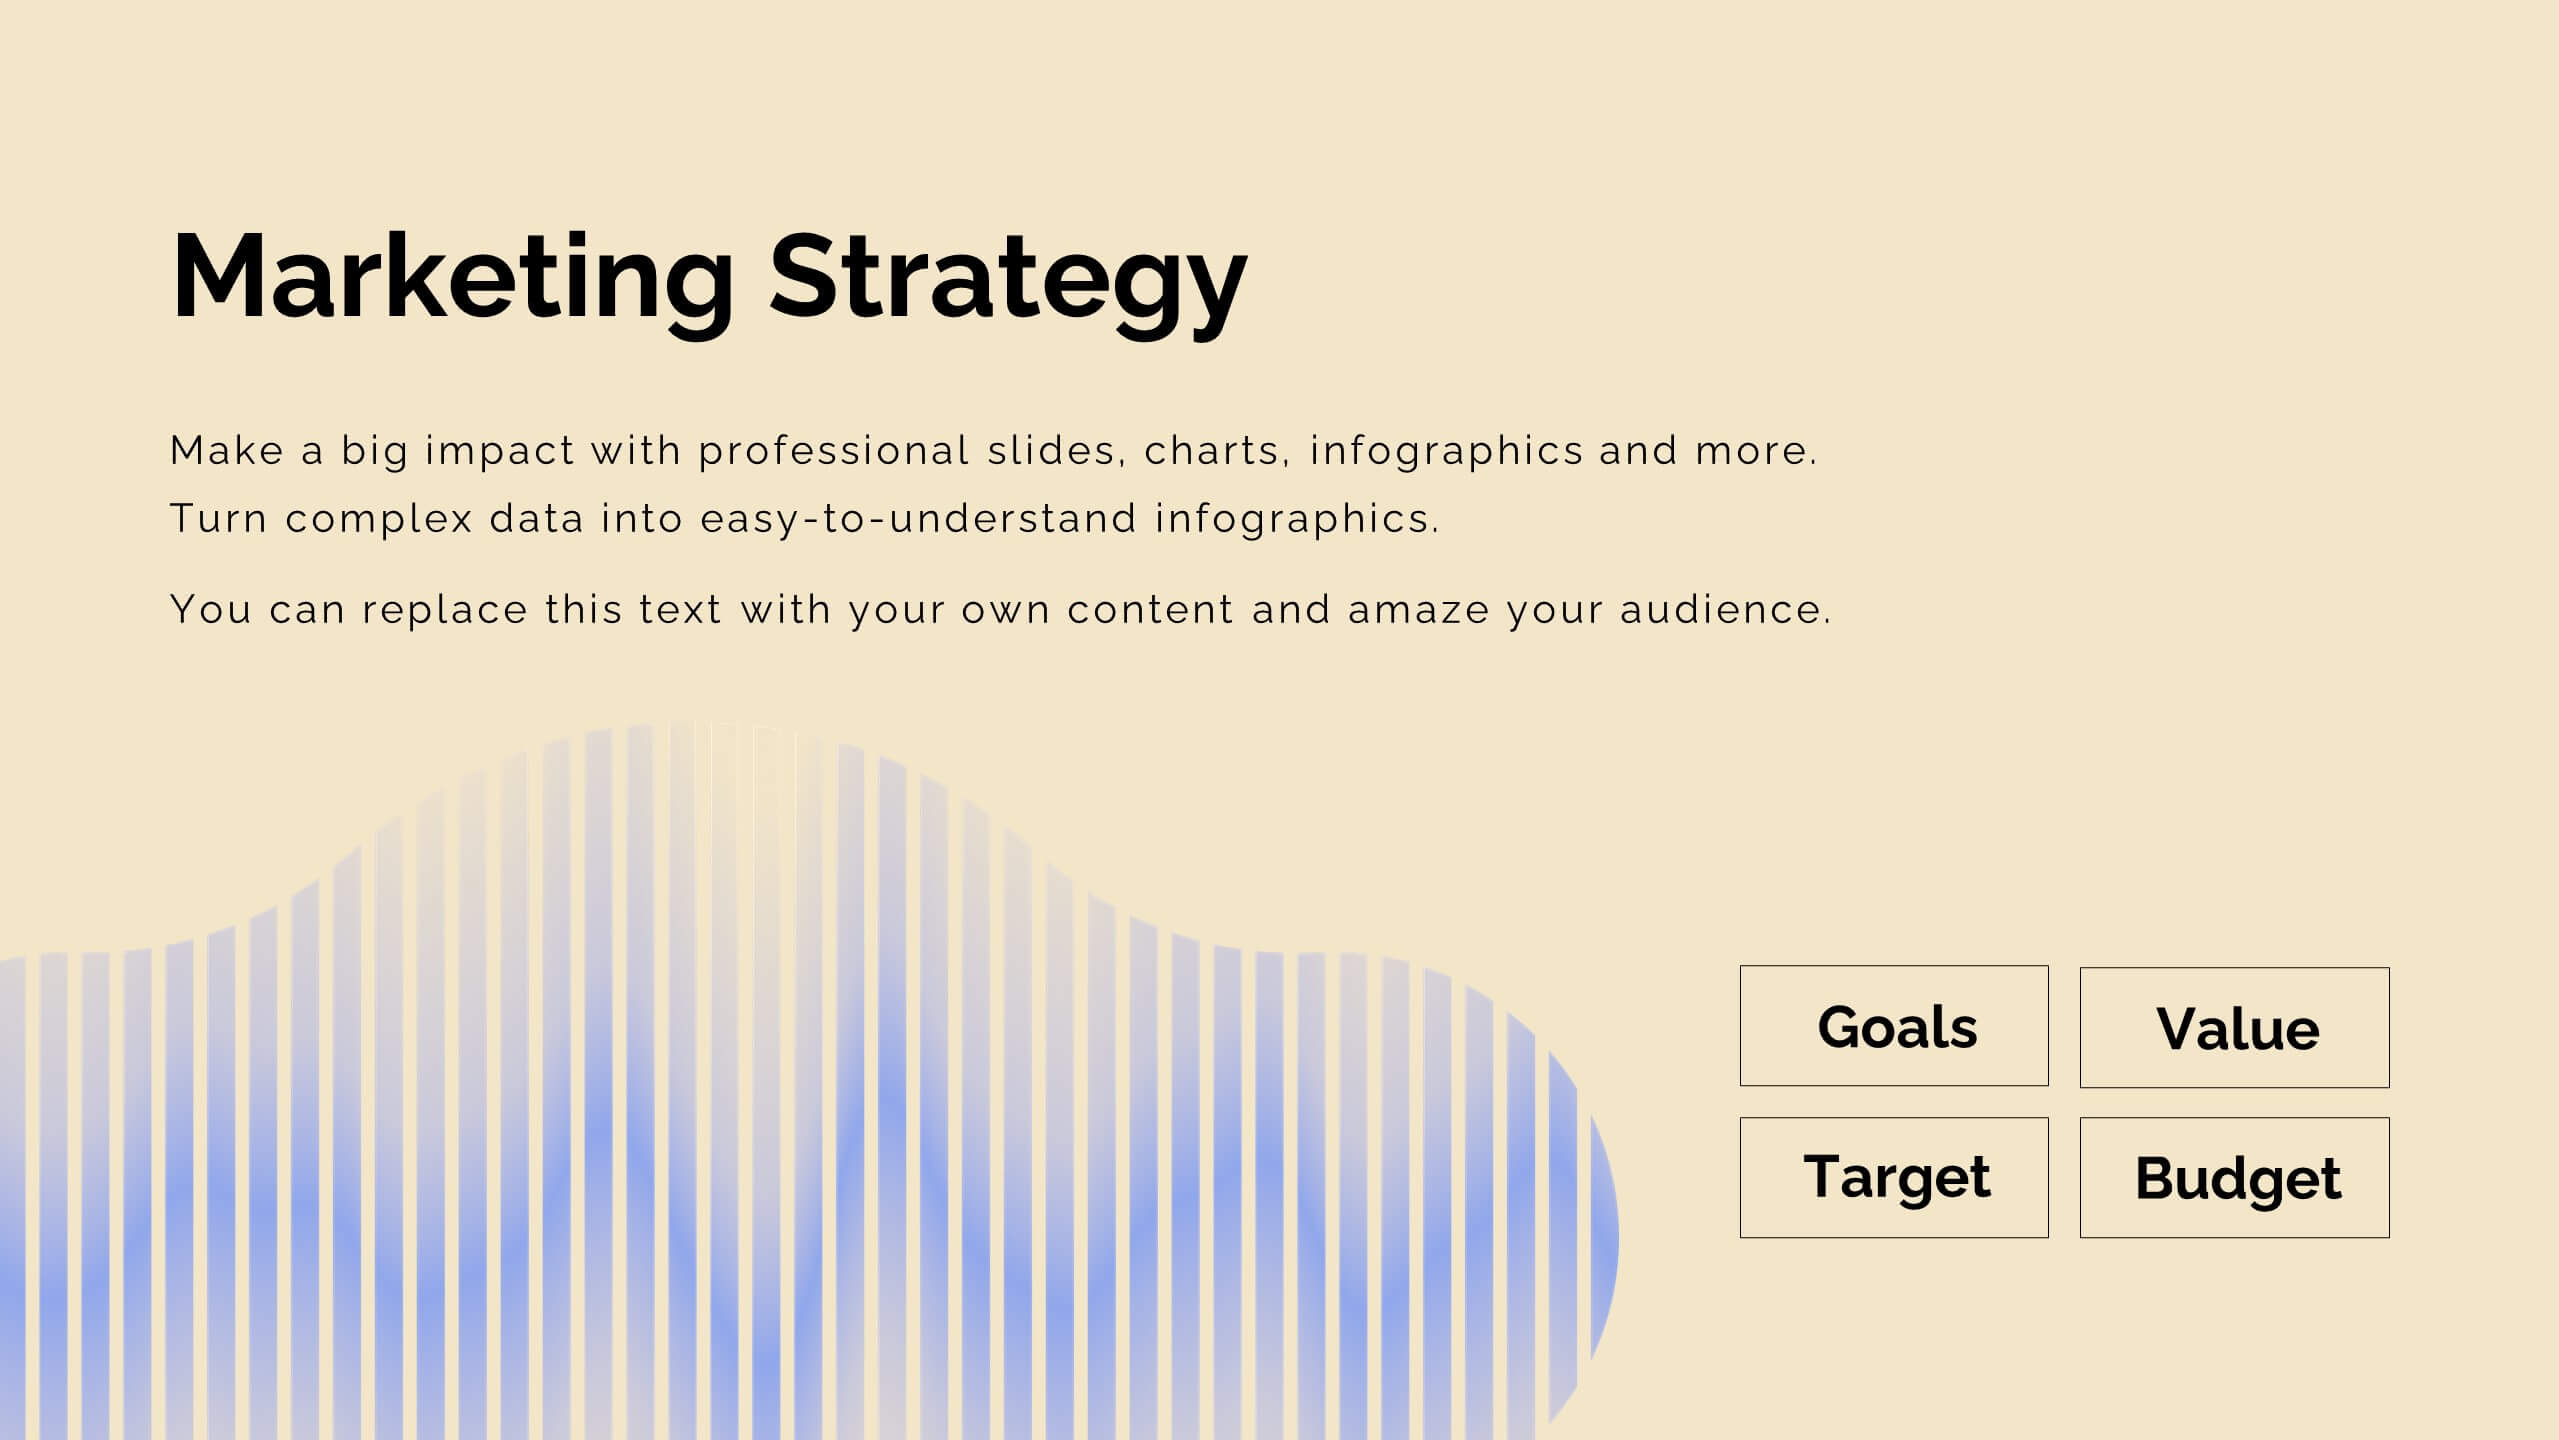
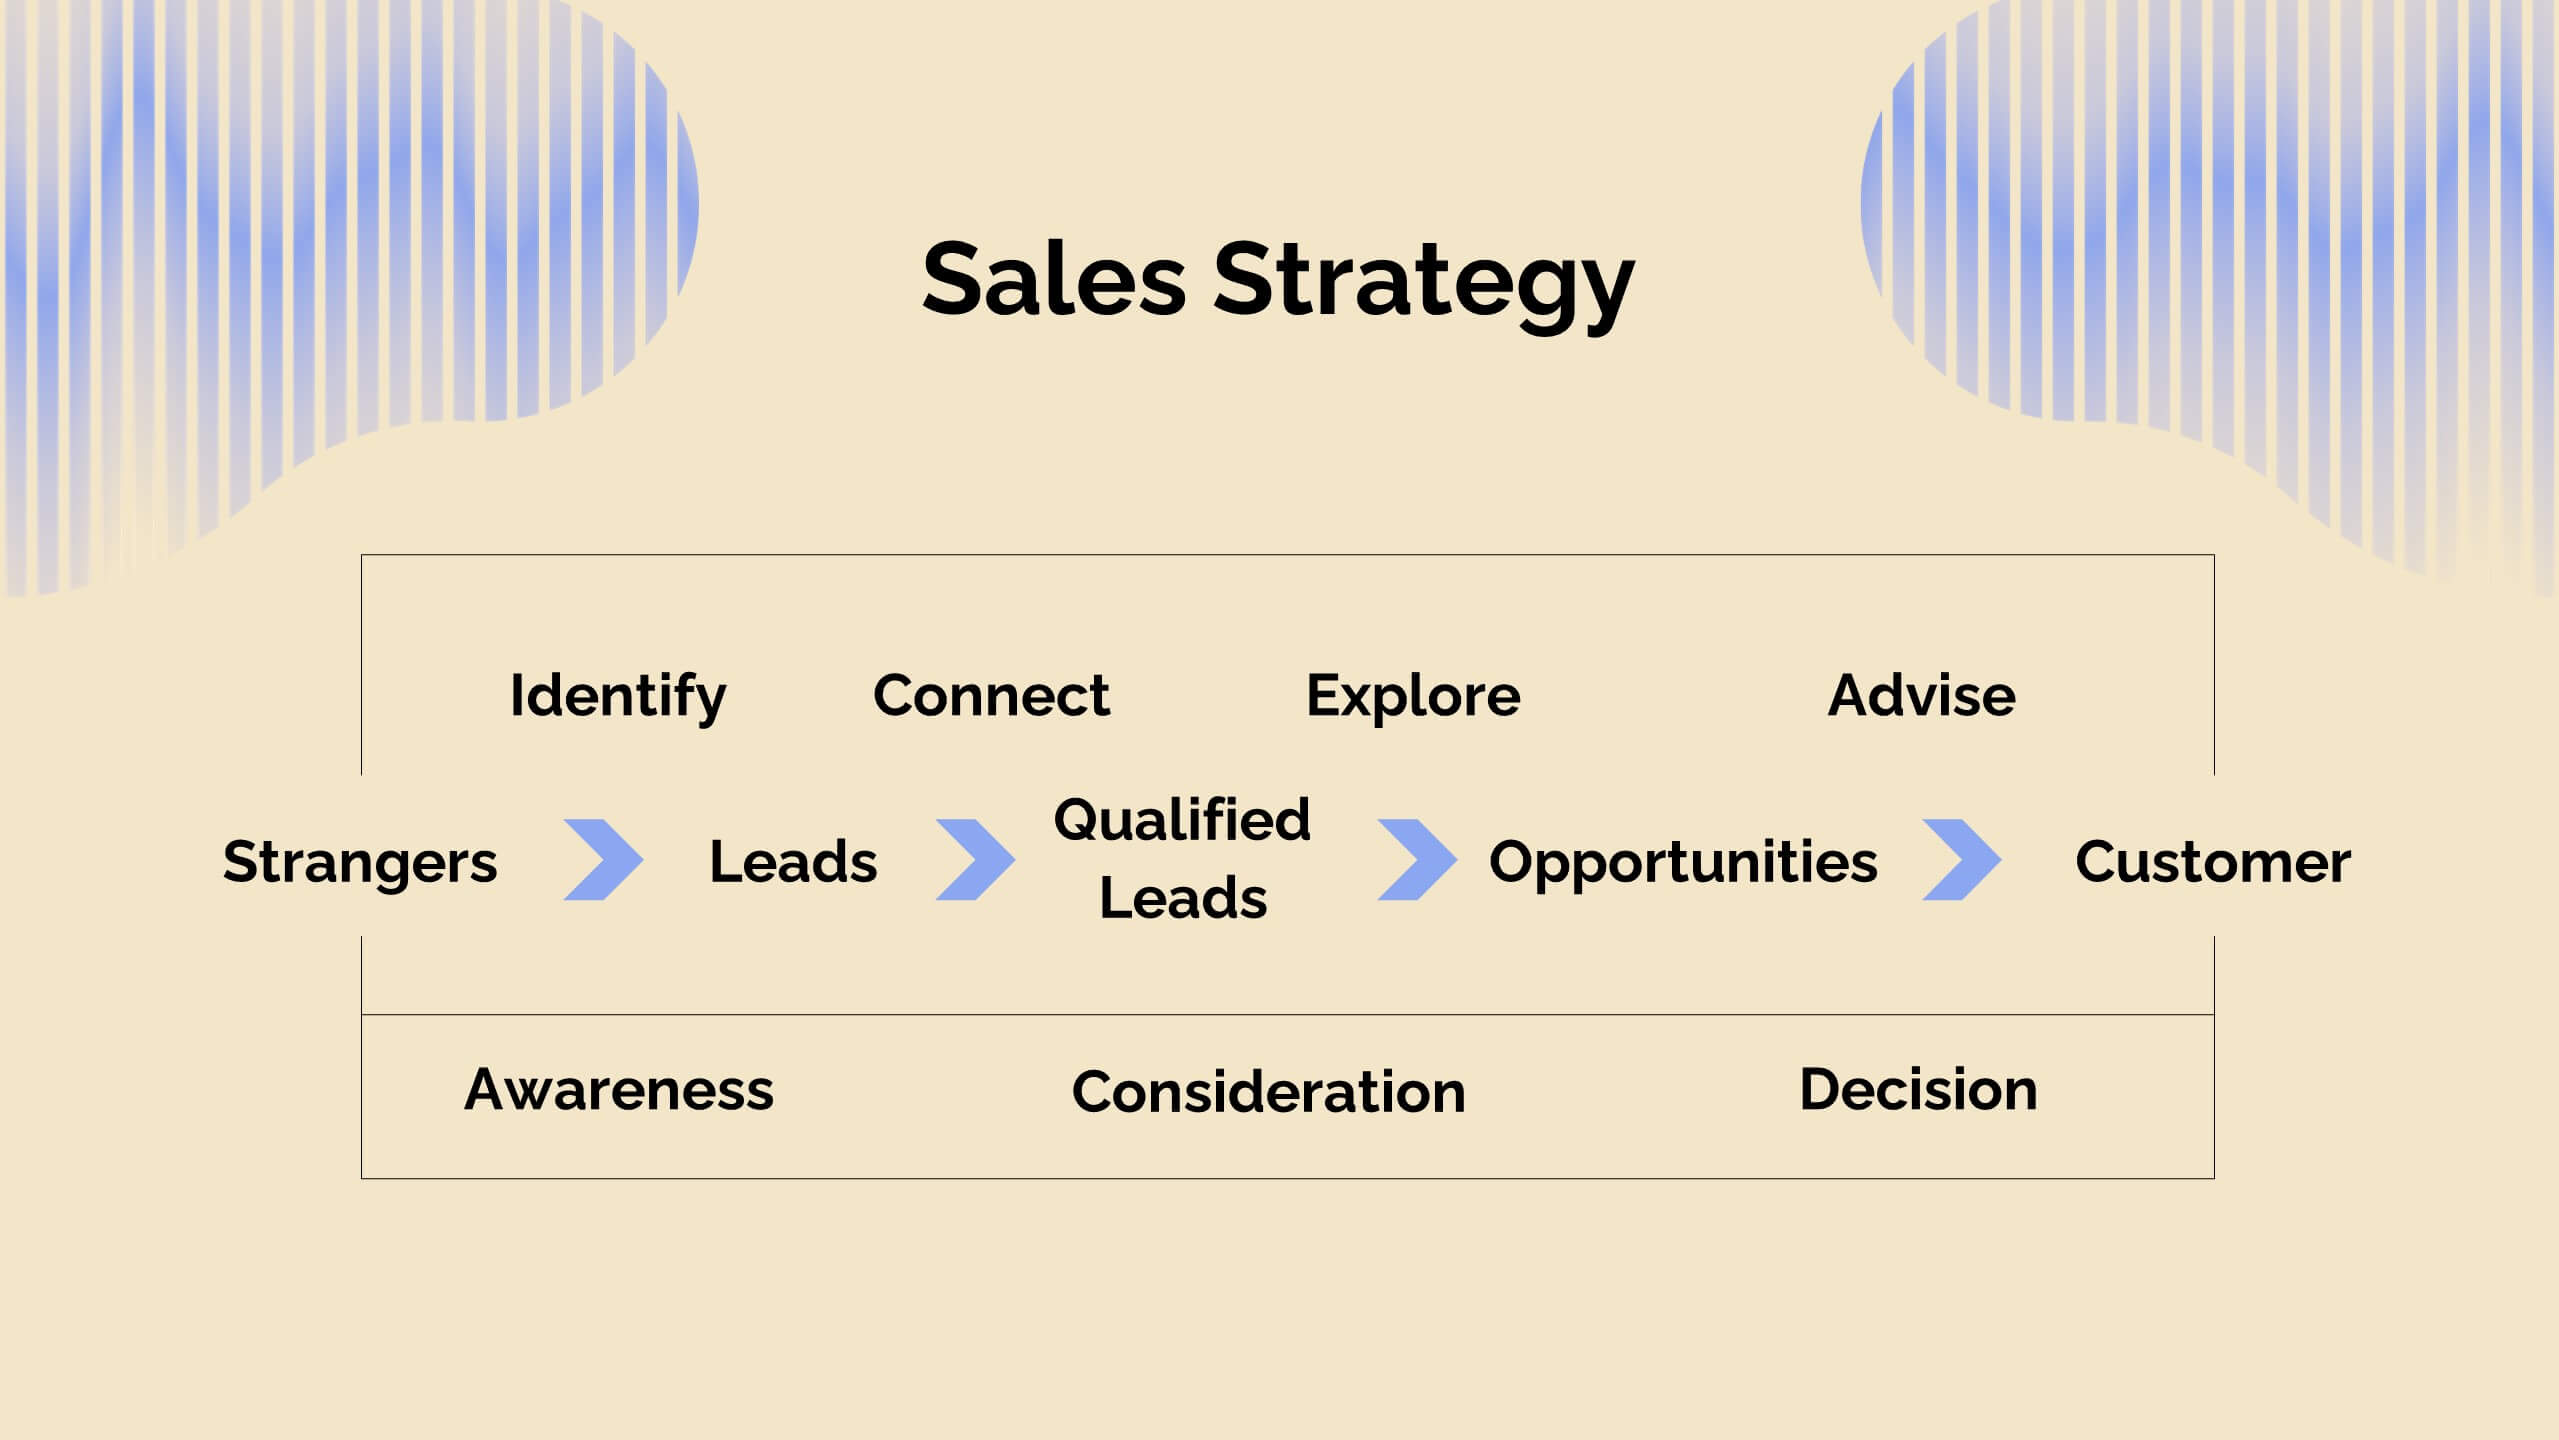
Unity Sales Proposal Presentation
Boost your sales strategy with this comprehensive sales proposal template! Perfect for outlining objectives, processes, and customer value propositions. Ideal for sales teams aiming to close deals and impress clients. Compatible with PowerPoint, Keynote, and Google Slides, this template ensures your sales presentations are clear, persuasive, and professional. Drive your sales success today!


26 diapositivas
Startup Presentation
Elevate your startup's story with this Startup Presentation template. It features slides for your mission, innovation highlights, market analysis, and growth strategy. Perfect for engaging potential investors and partners. This versatile template is compatible with PowerPoint, Keynote, and Google Slides, making it easily accessible for all your presentation needs.


4 diapositivas
Objectives and Key Results Overview Presentation
Set your goals, define success, and visualize progress with a sleek, easy-to-follow layout that connects objectives to measurable outcomes. Ideal for business strategy, team performance, or quarterly reviews, this presentation keeps your message clear and professional. Fully compatible with PowerPoint, Keynote, and Google Slides for effortless editing.


4 diapositivas
Business Role Structure Diagram Presentation
Bring your team structure to life with a clear, engaging visual that makes every role instantly understandable. This presentation helps you map relationships, outline responsibilities, and communicate workflow with ease. Designed for simple customization and professional clarity, it supports PowerPoint, Keynote, and Google Slides for seamless editing across platforms.


23 diapositivas
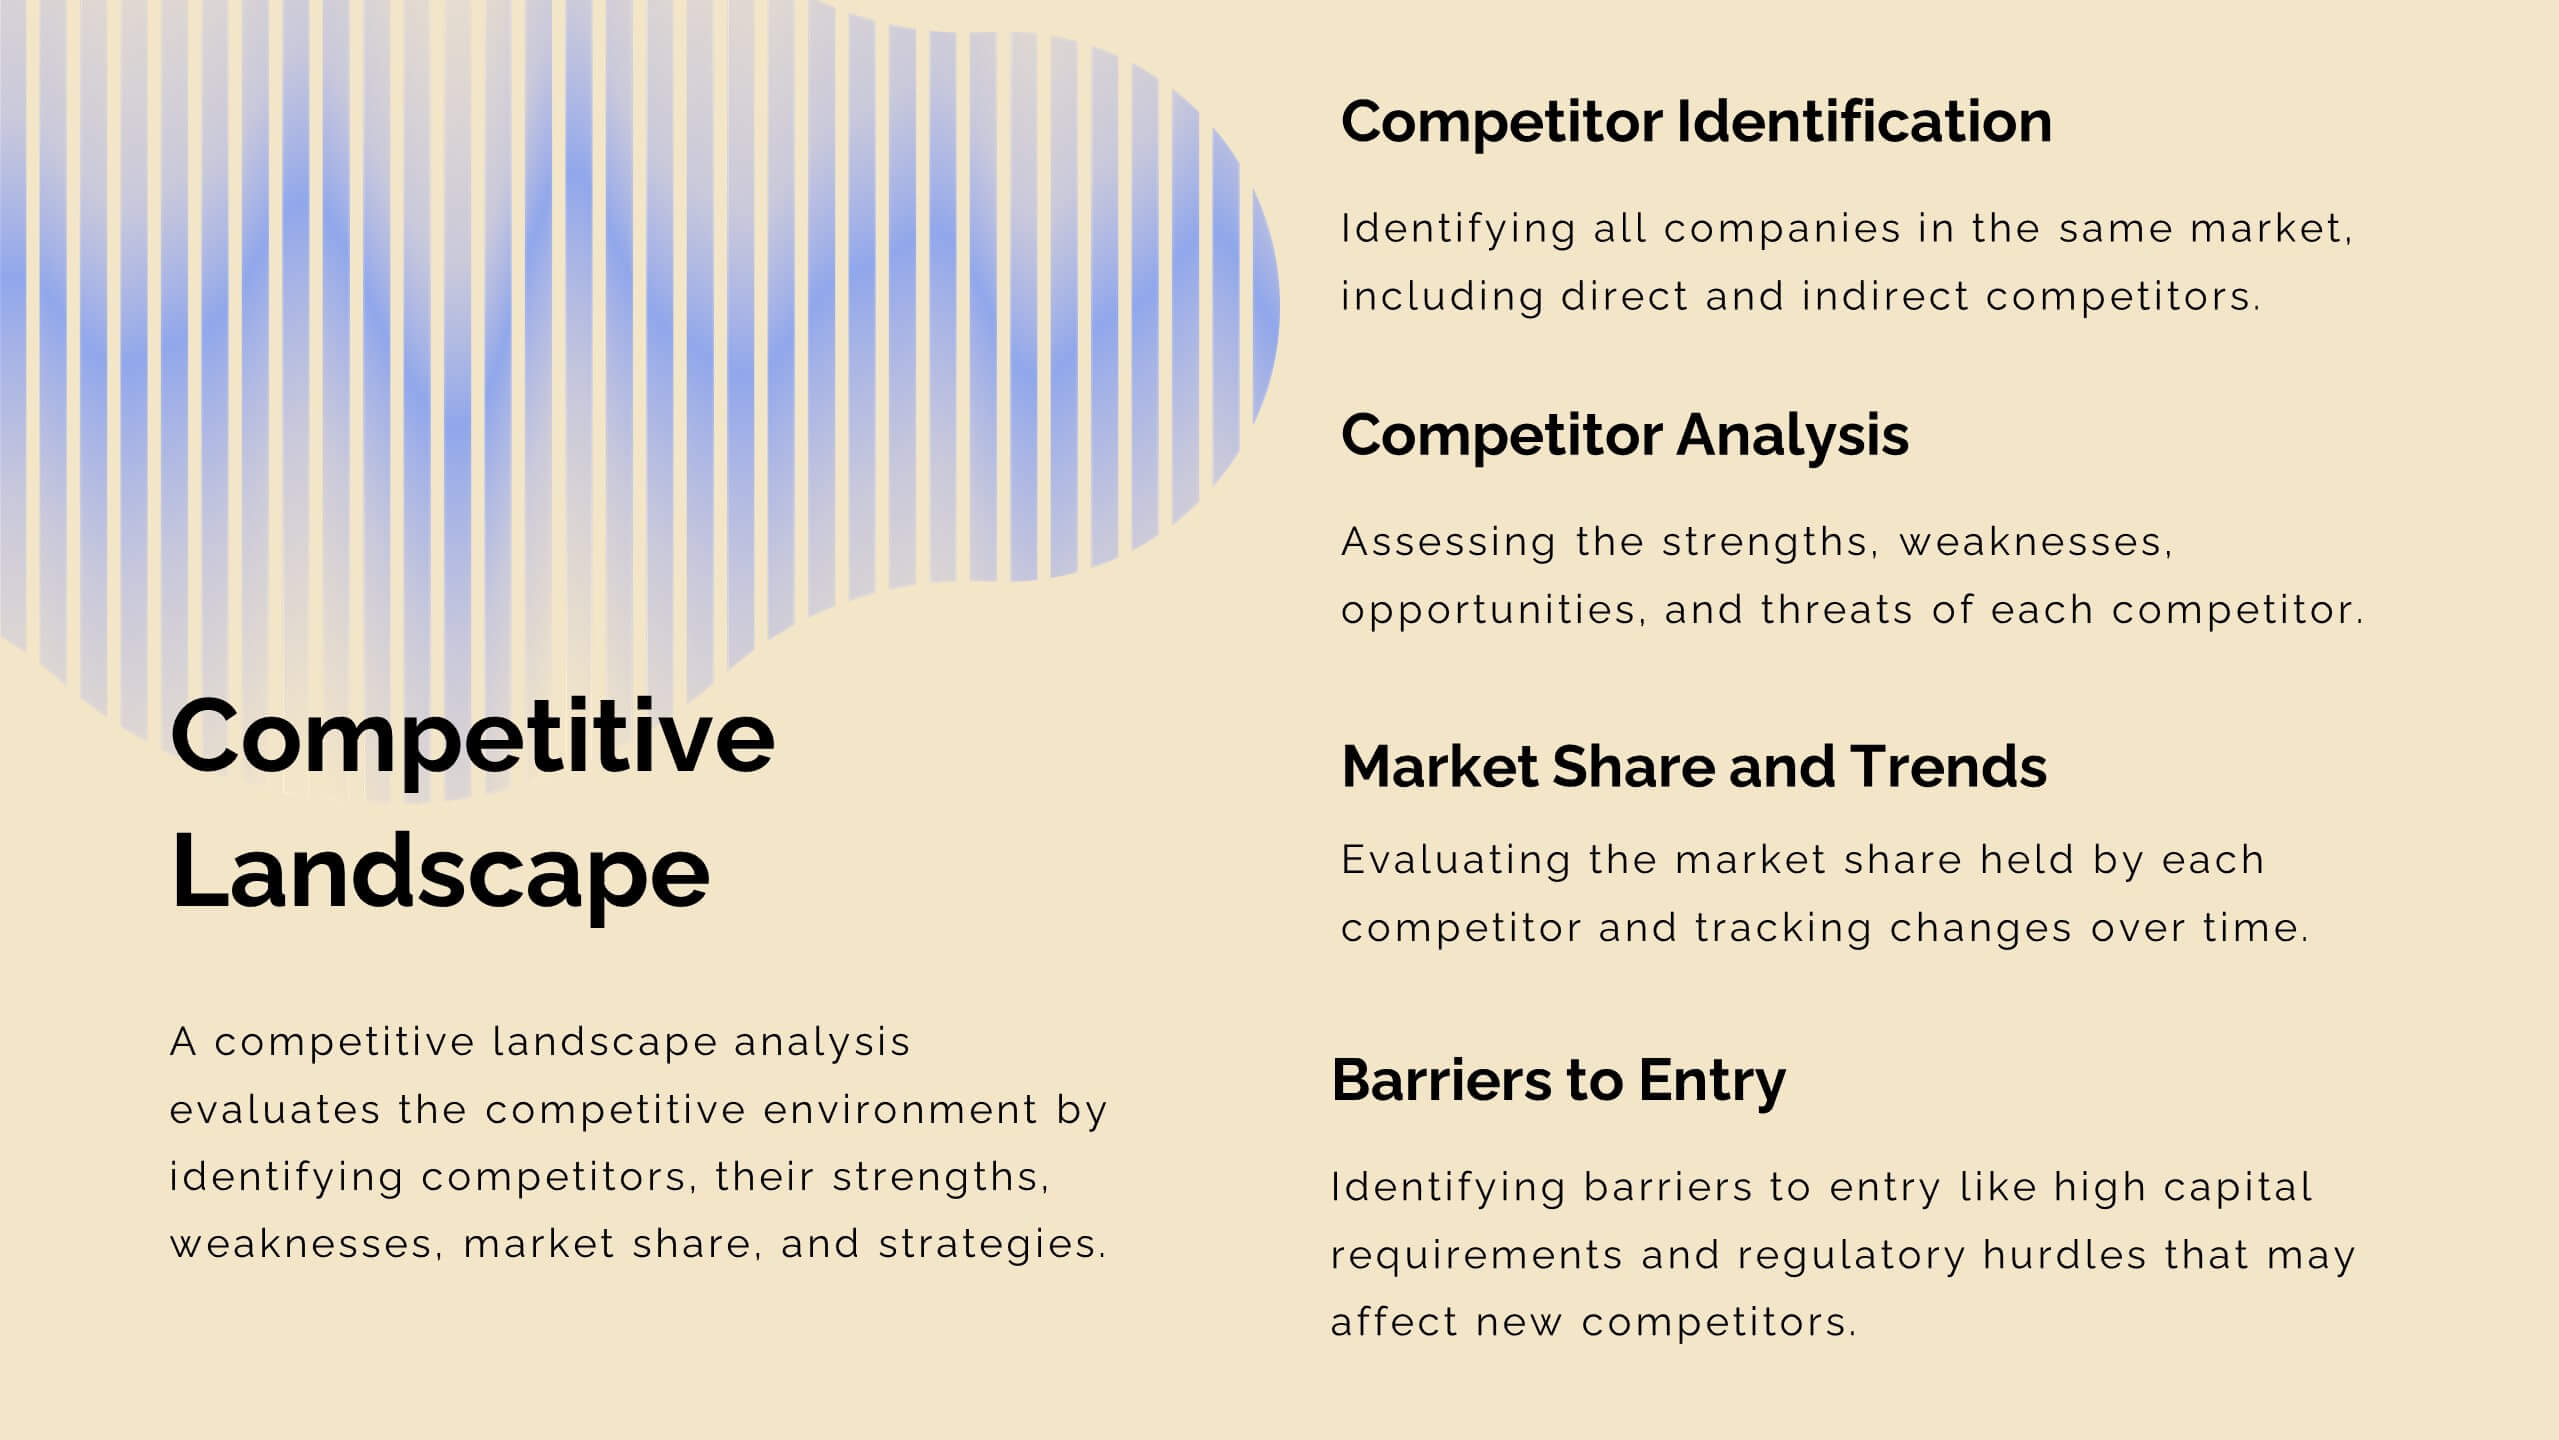
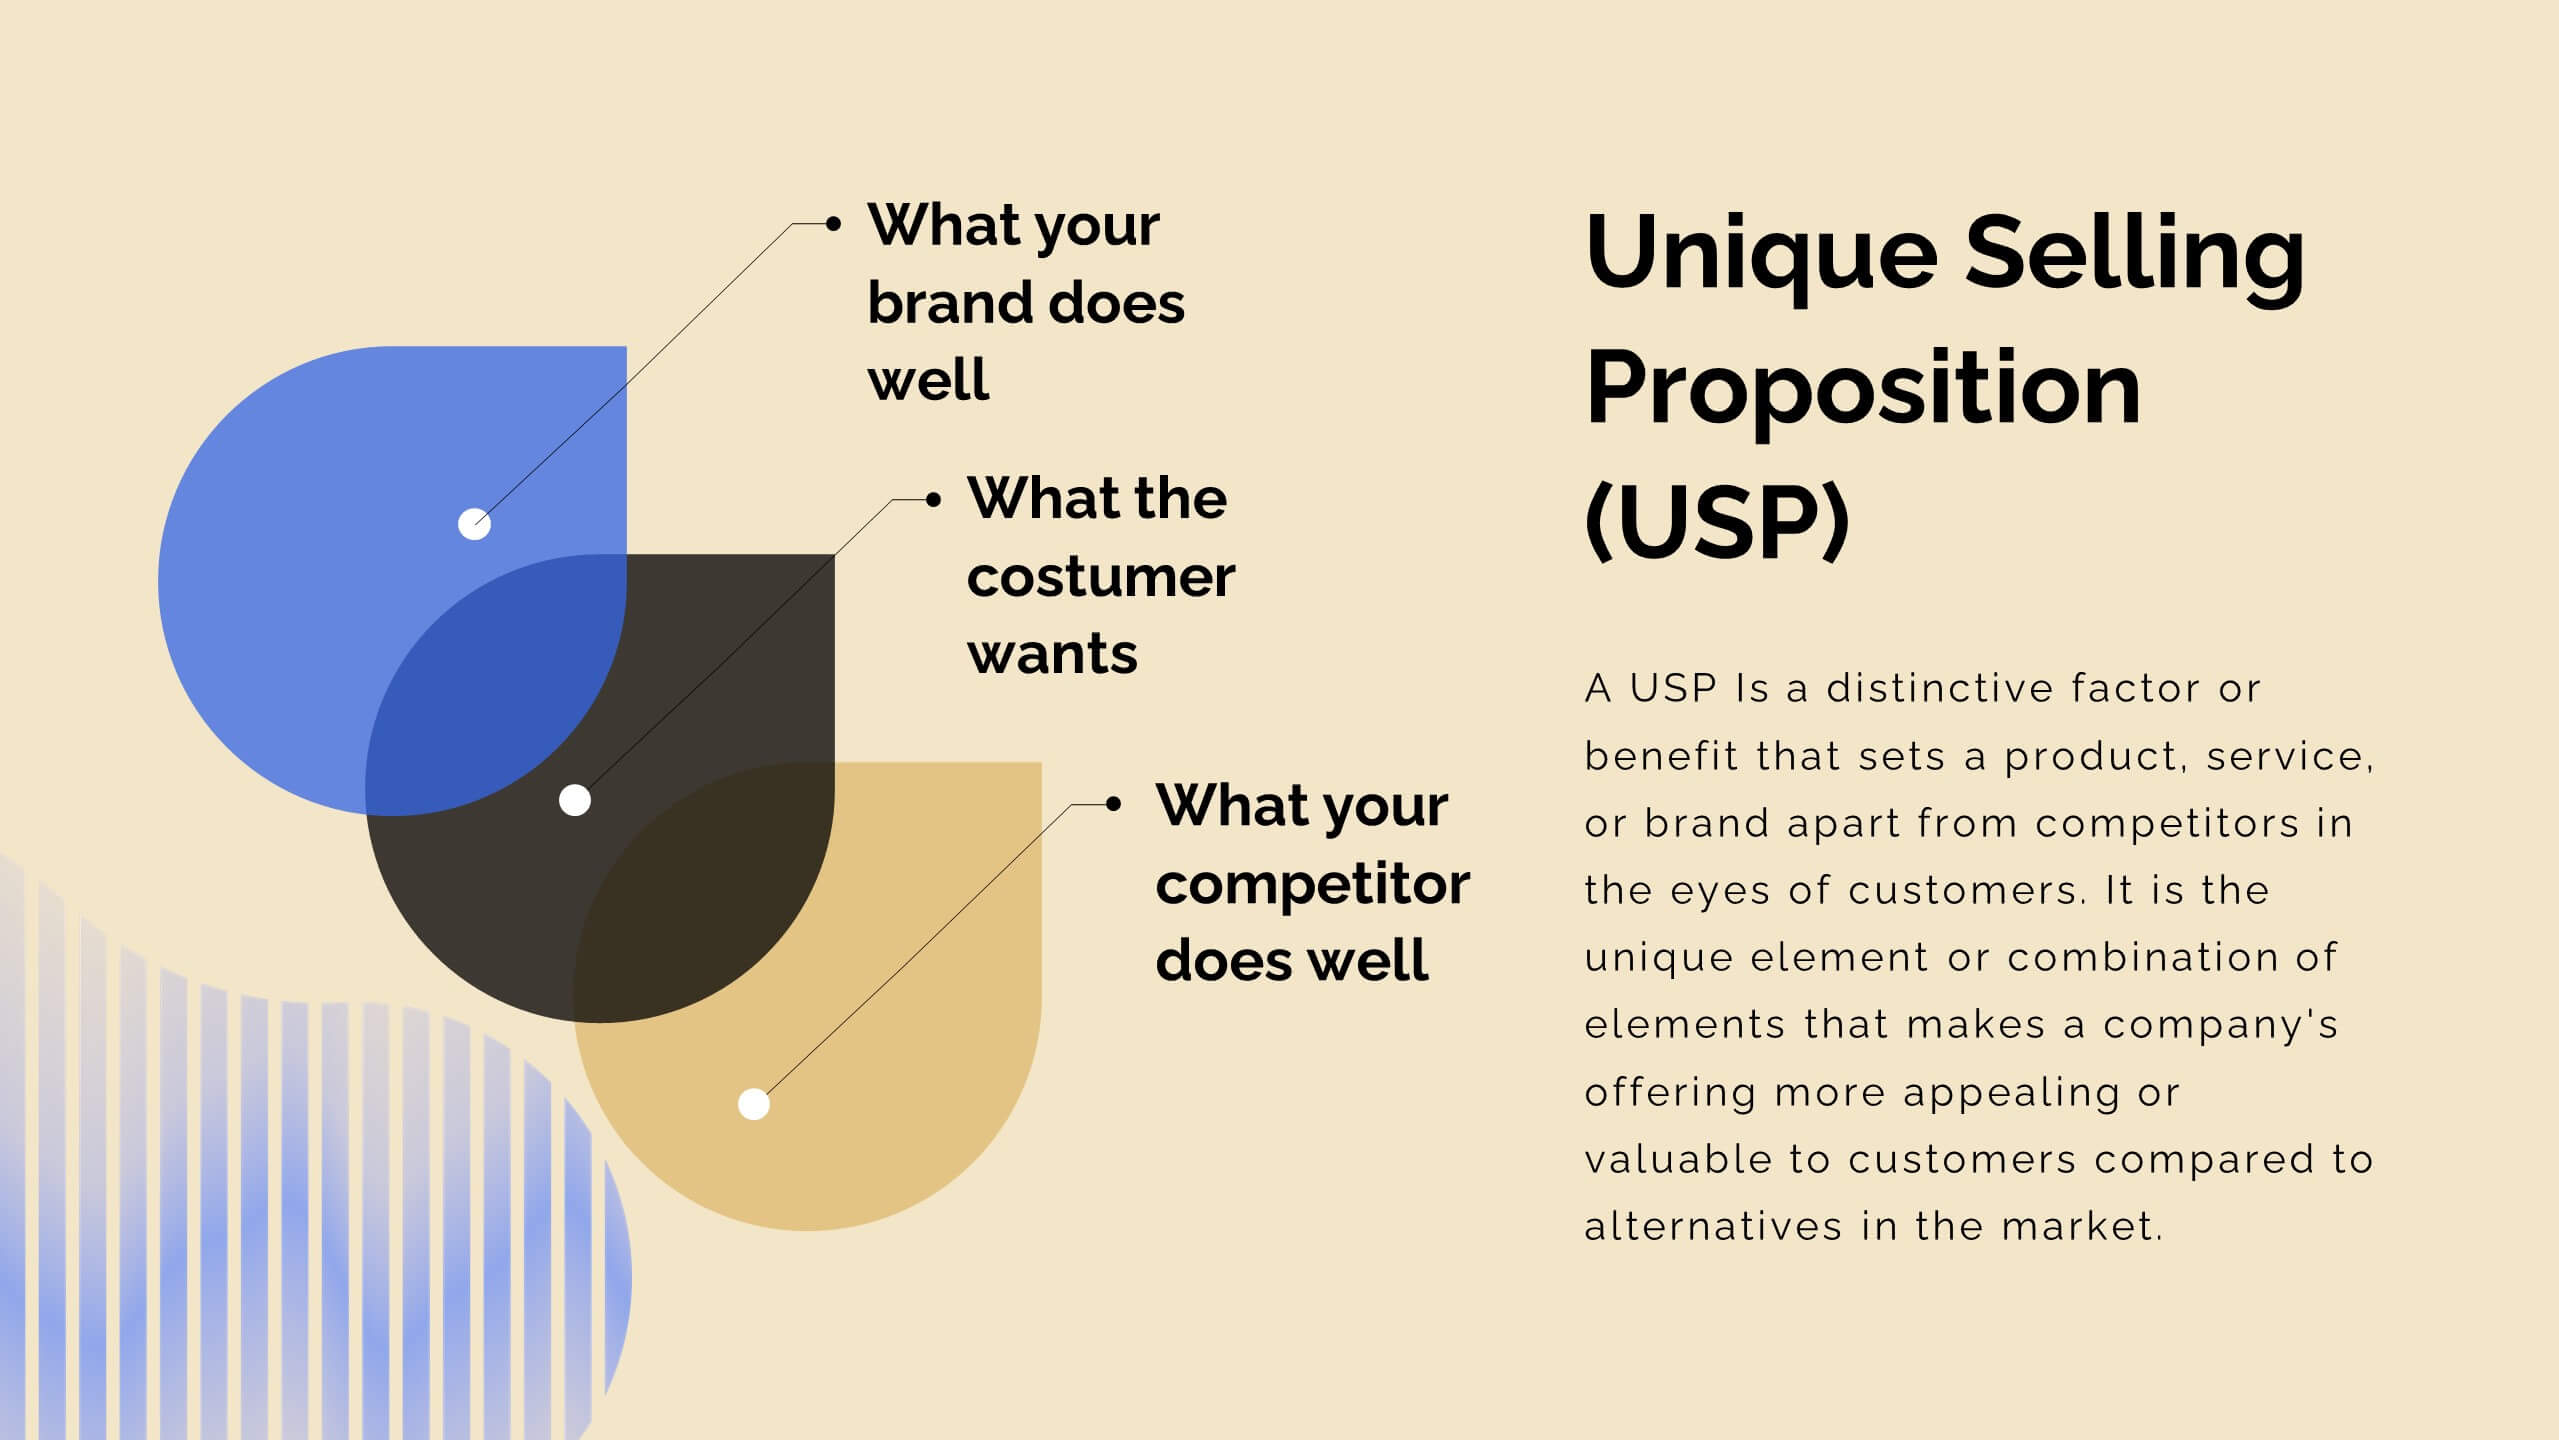
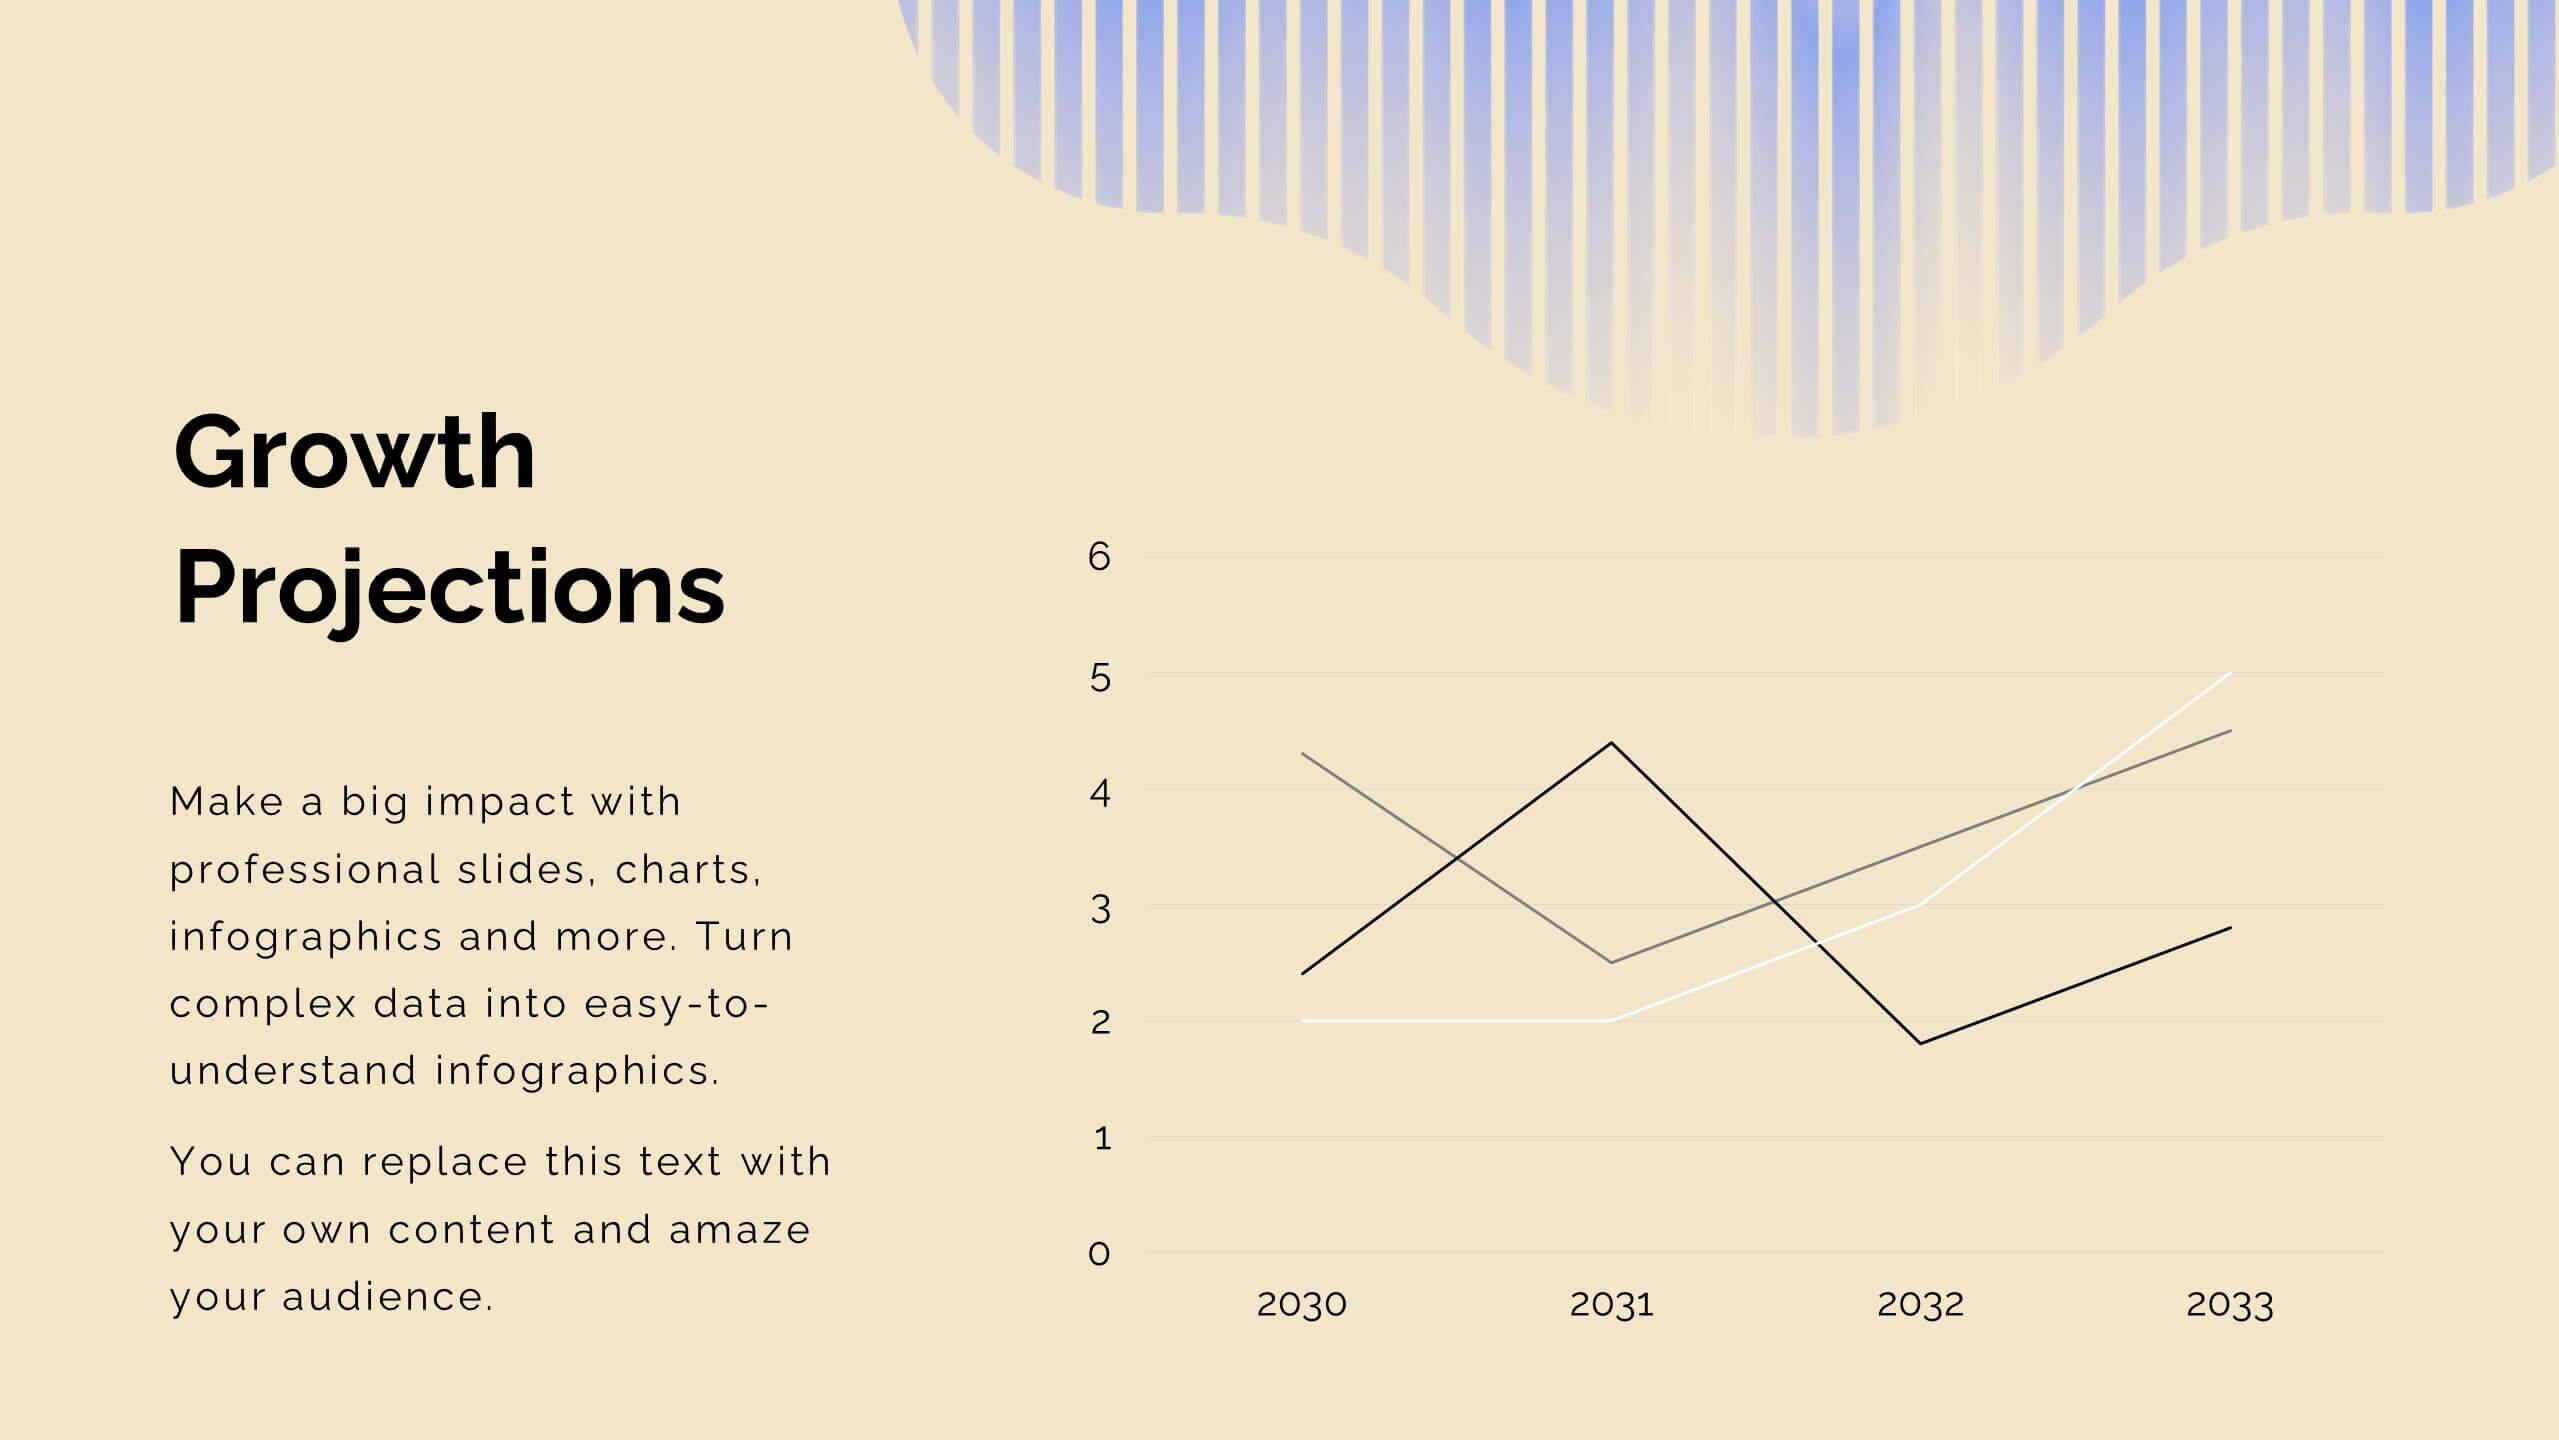
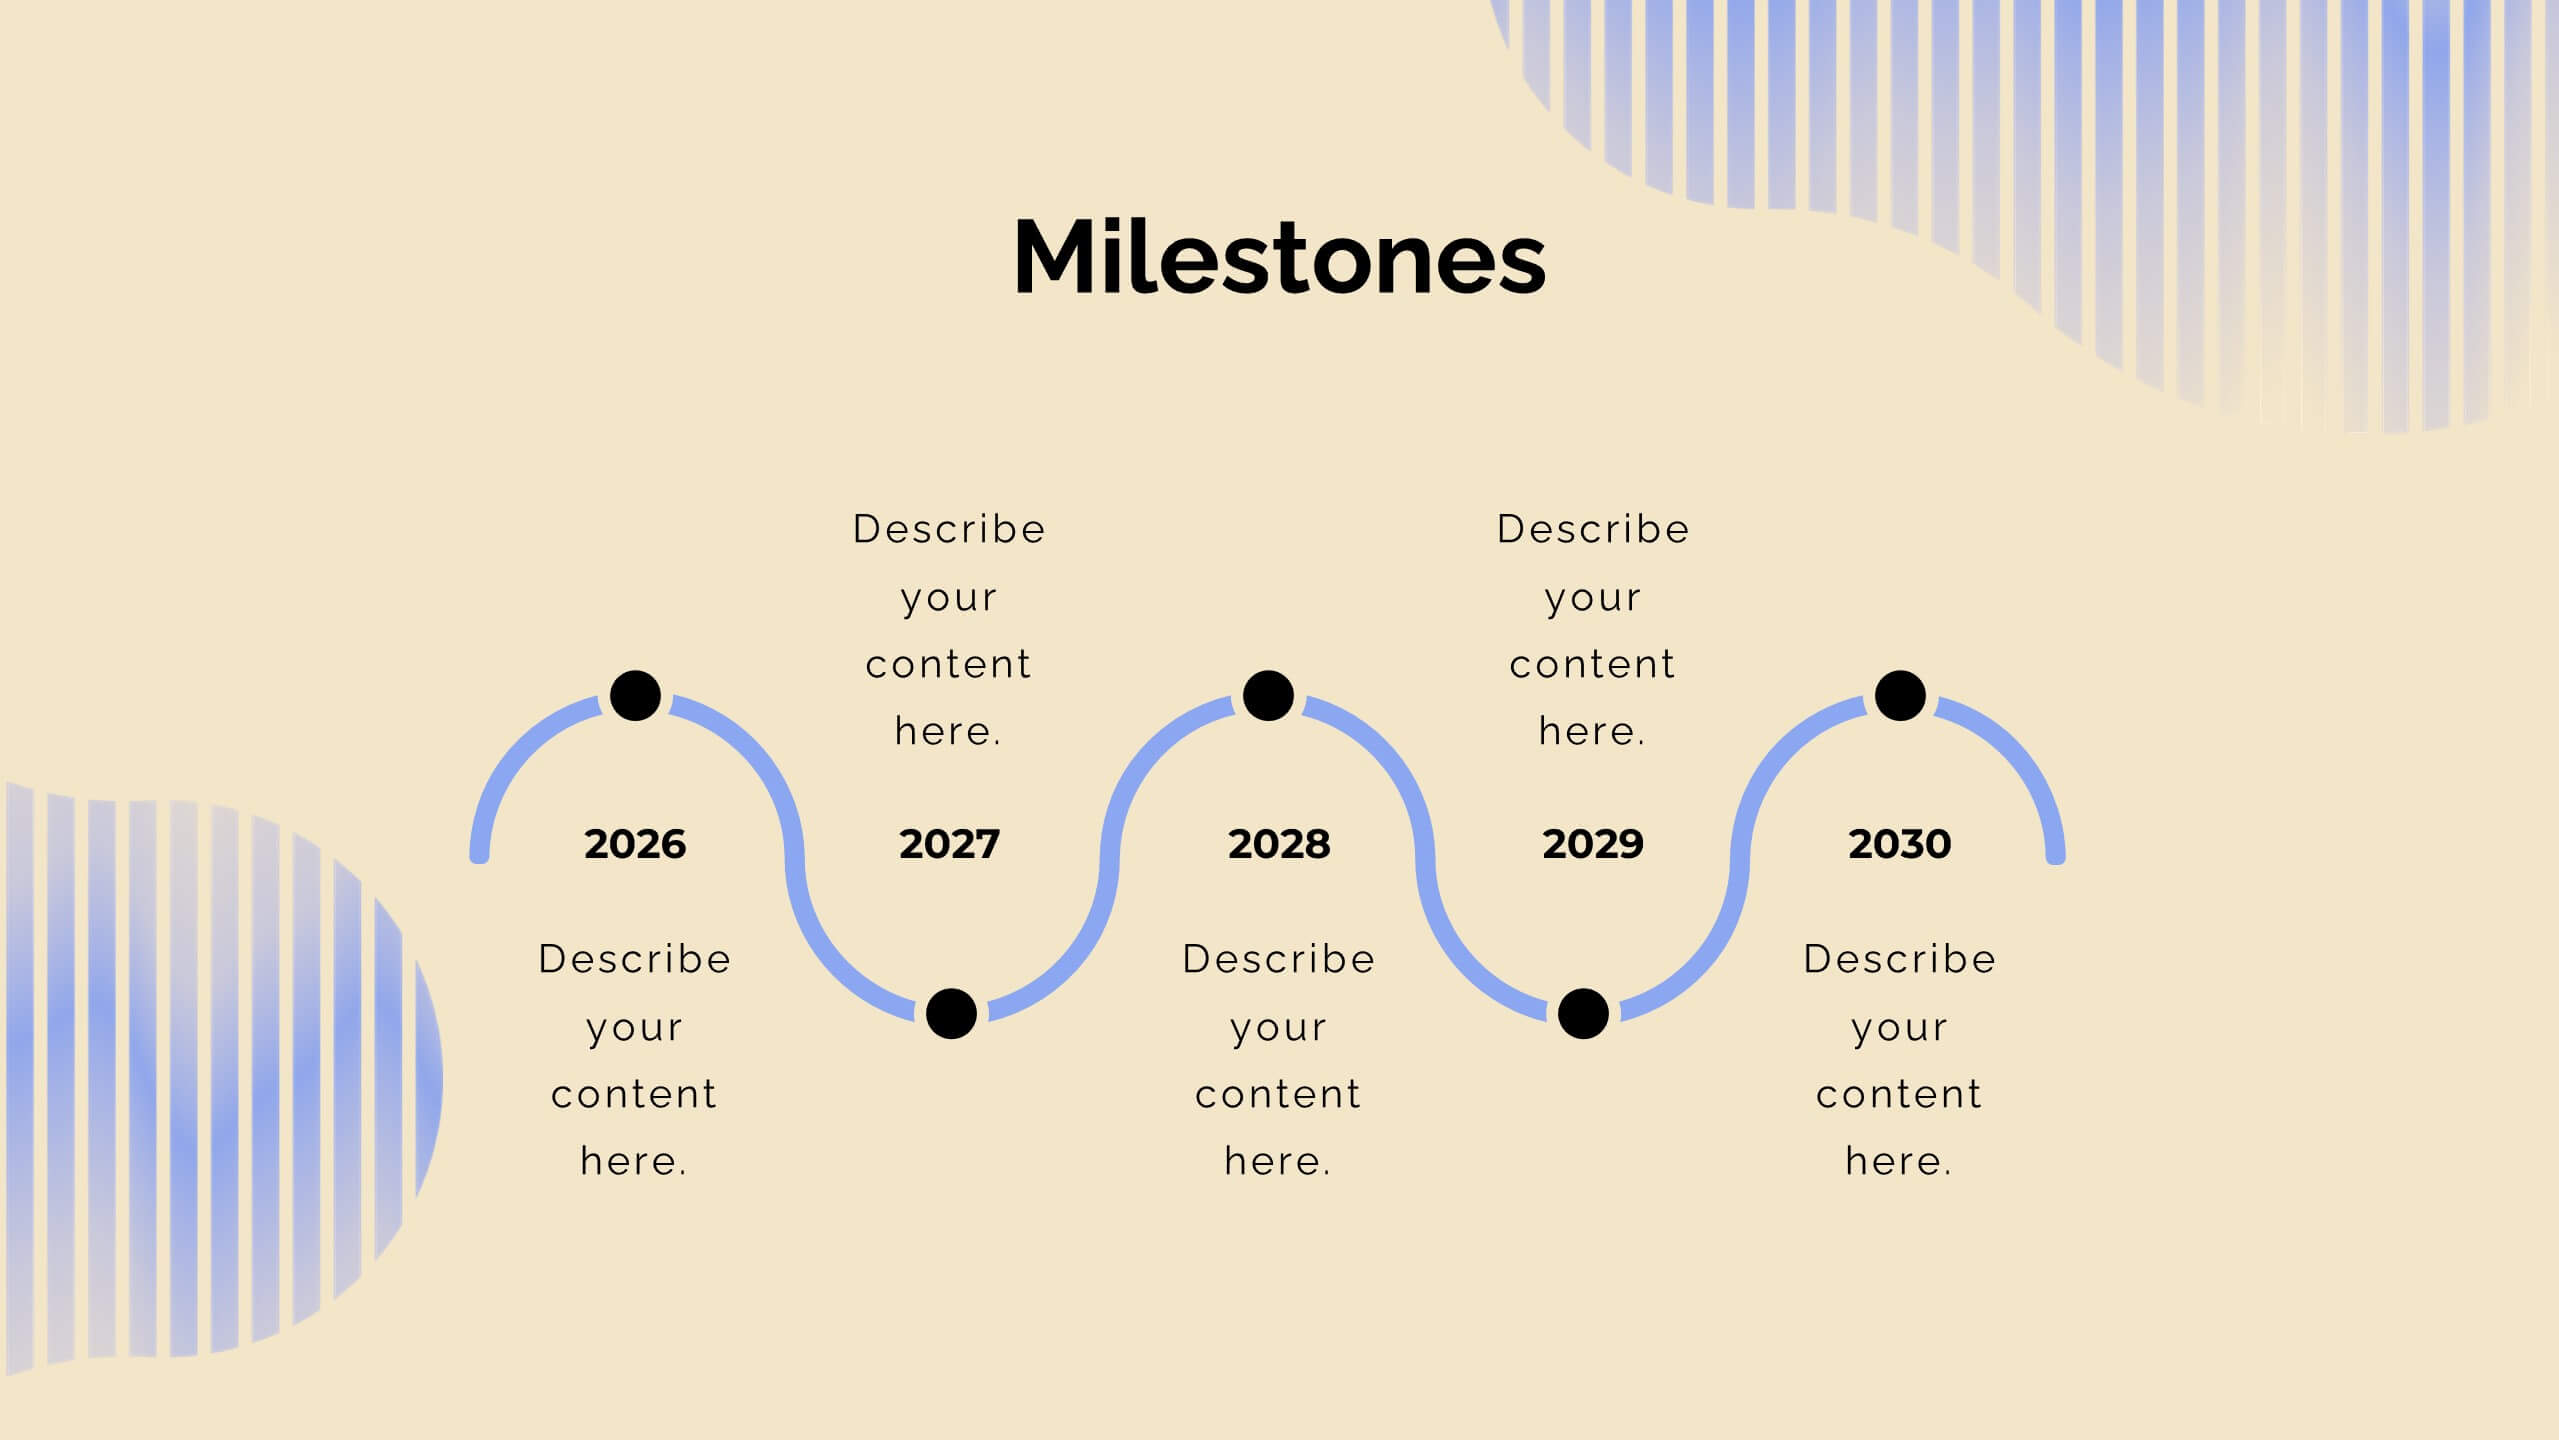
Journey Product Roadmap Presentation
Embark on a seamless journey through your product’s lifecycle with this comprehensive roadmap template! Perfect for illustrating key milestones, business models, and market opportunities, it’s your go-to for clear and engaging presentations. Dive into competitive analysis, showcase your unique selling proposition, and outline your growth projections with style. Compatible with PowerPoint, Keynote, and Google Slides.


2 diapositivas
Small Business Success Illustrations
Get your business on the right track with our small business success illustrations pack! These illustrations will help you with your next business presentation and make it more engaging and catchy. Fully compatible with Powerpoint, Keynote, and Google Slides. You can use these in your website, blog or social media posts. Turn your vision into a reality—download the small business success illustrations pack today!


3 diapositivas
Designing a Loyalty Program Presentation
Build stronger customer connections with a sleek, modern layout that highlights how reward systems drive retention and engagement. This design is perfect for visualizing loyalty strategies, program tiers, and user benefits with clarity and style. Fully editable and compatible with PowerPoint, Keynote, and Google Slides for effortless customization.


6 diapositivas
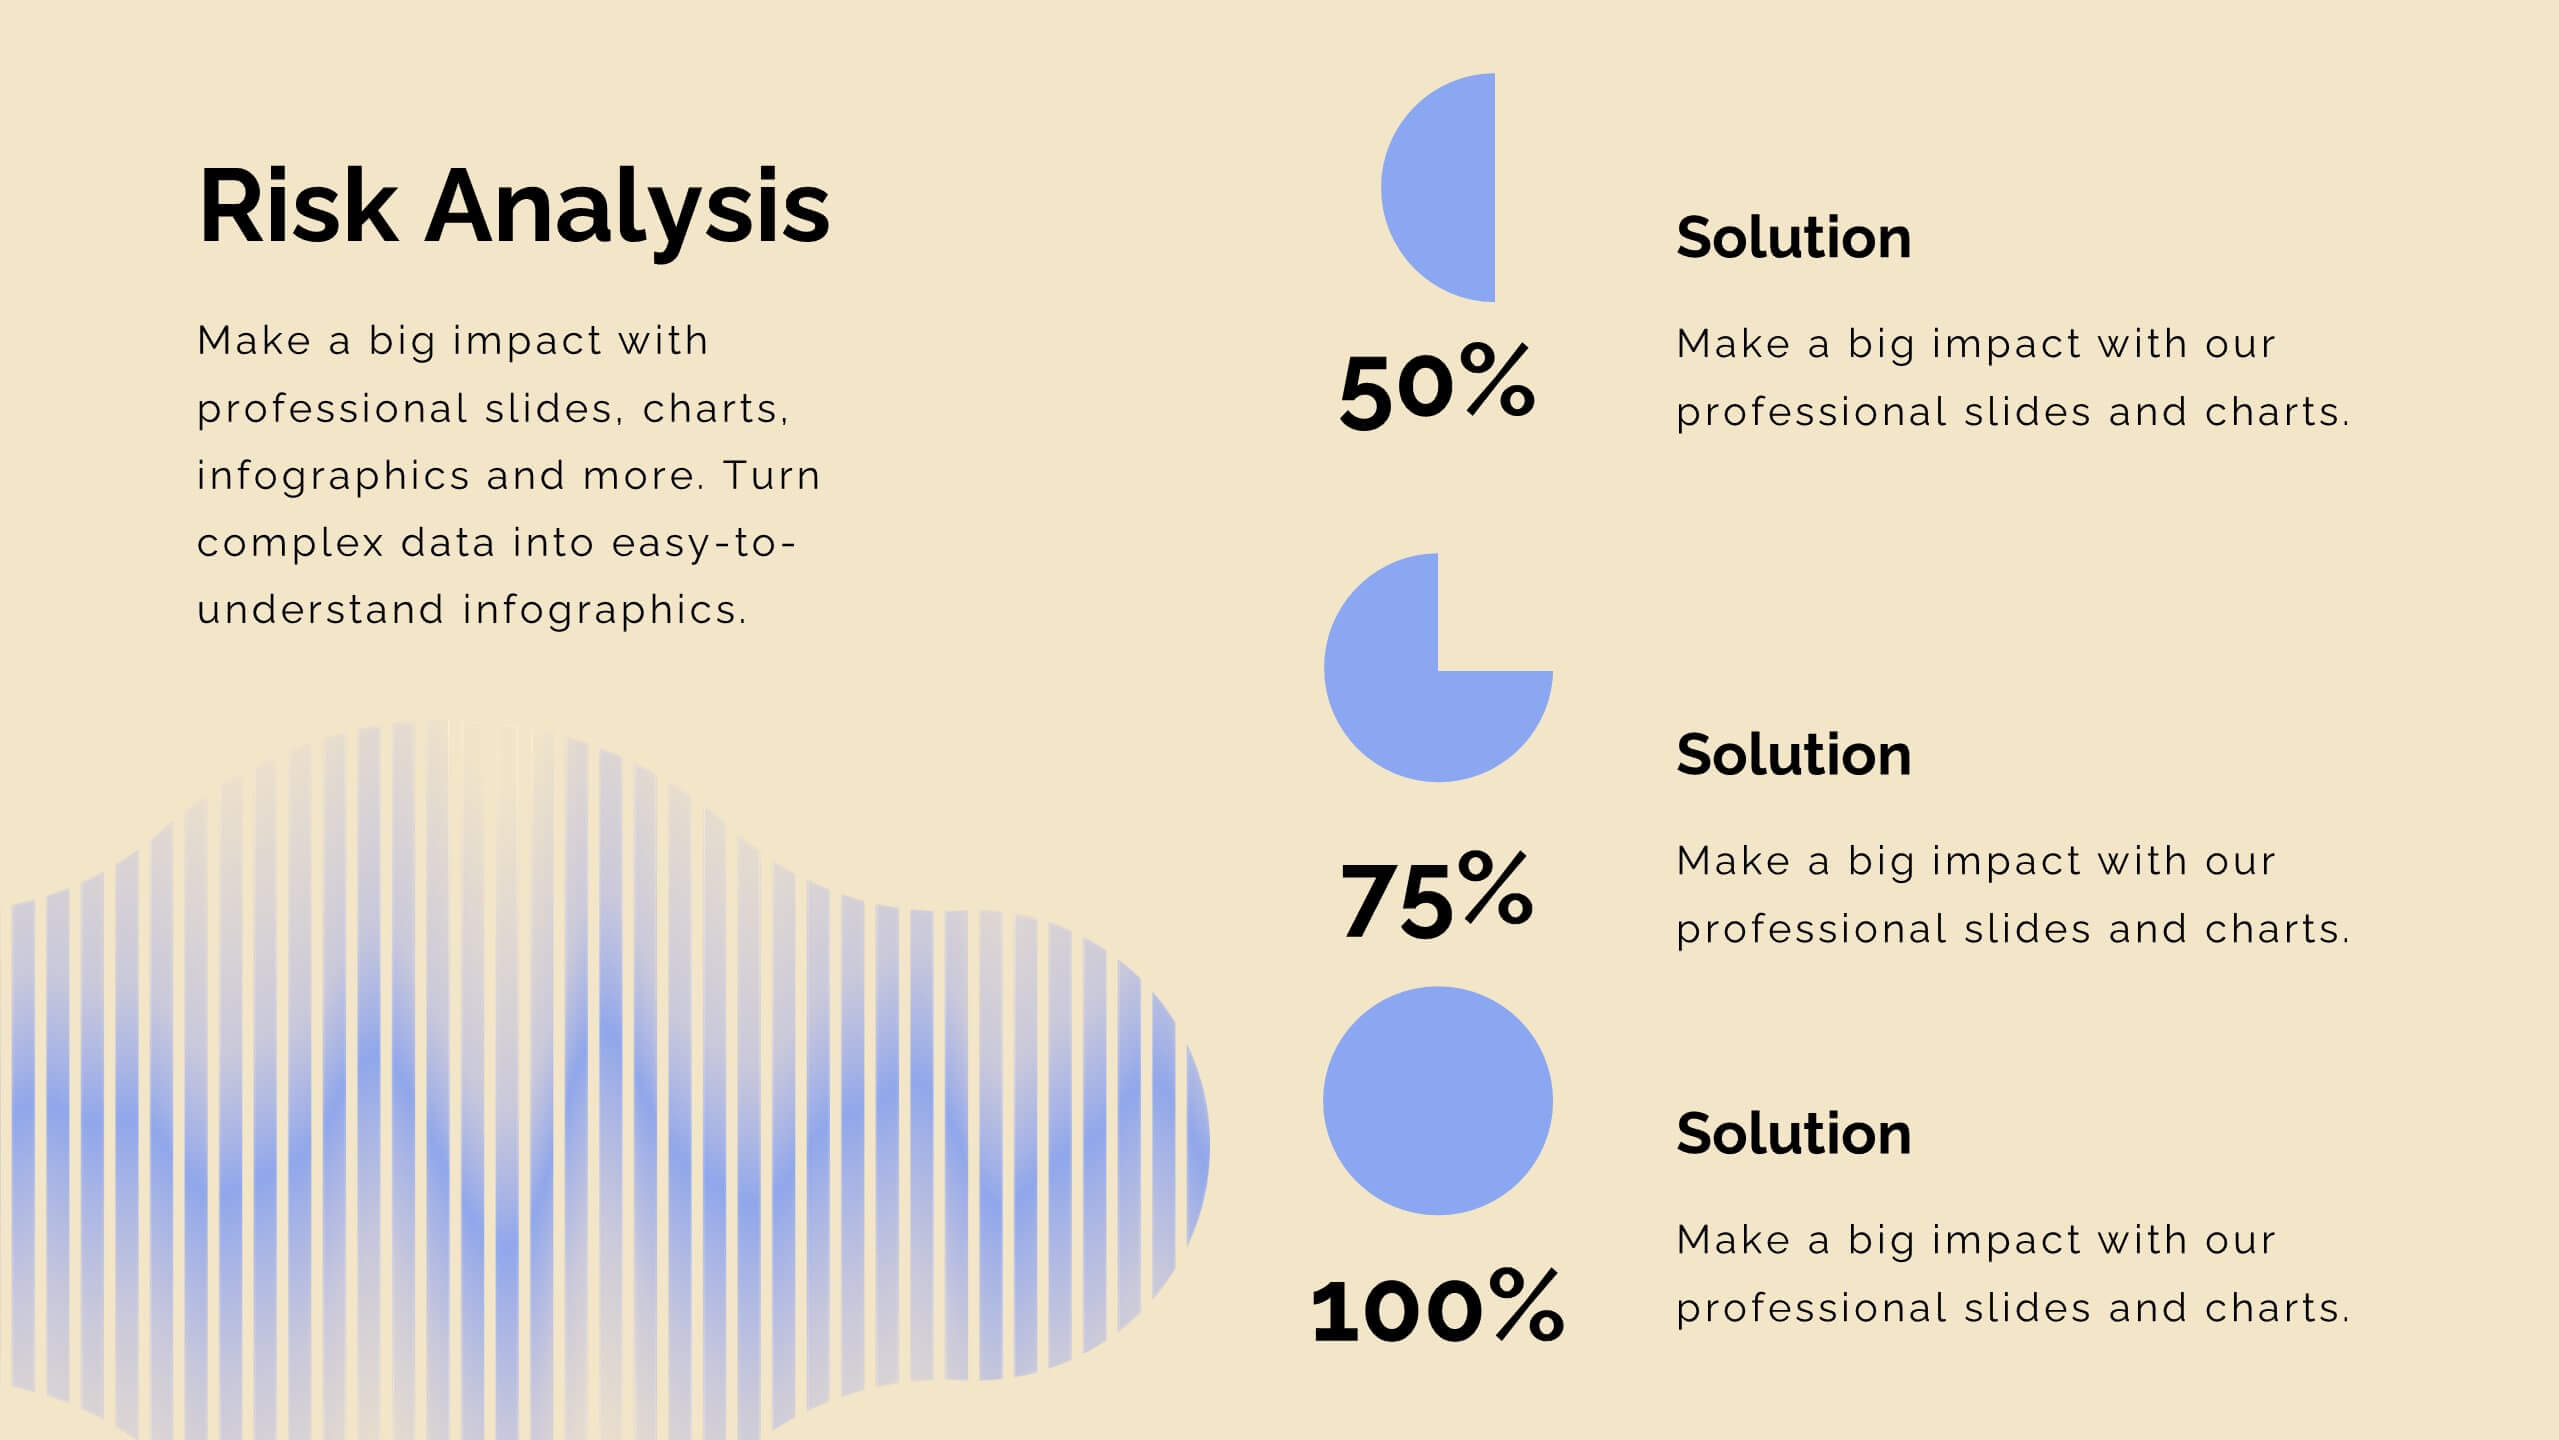
Security Strategy and Risk Management Presentation
Keep your data safe and your strategy sharp with this modern, professional template built to explain protection frameworks, risk mitigation, and security planning. Its clean visuals make complex concepts easy to understand for teams and clients alike. Fully compatible with PowerPoint, Keynote, and Google Slides for effortless editing and presentation.


7 diapositivas
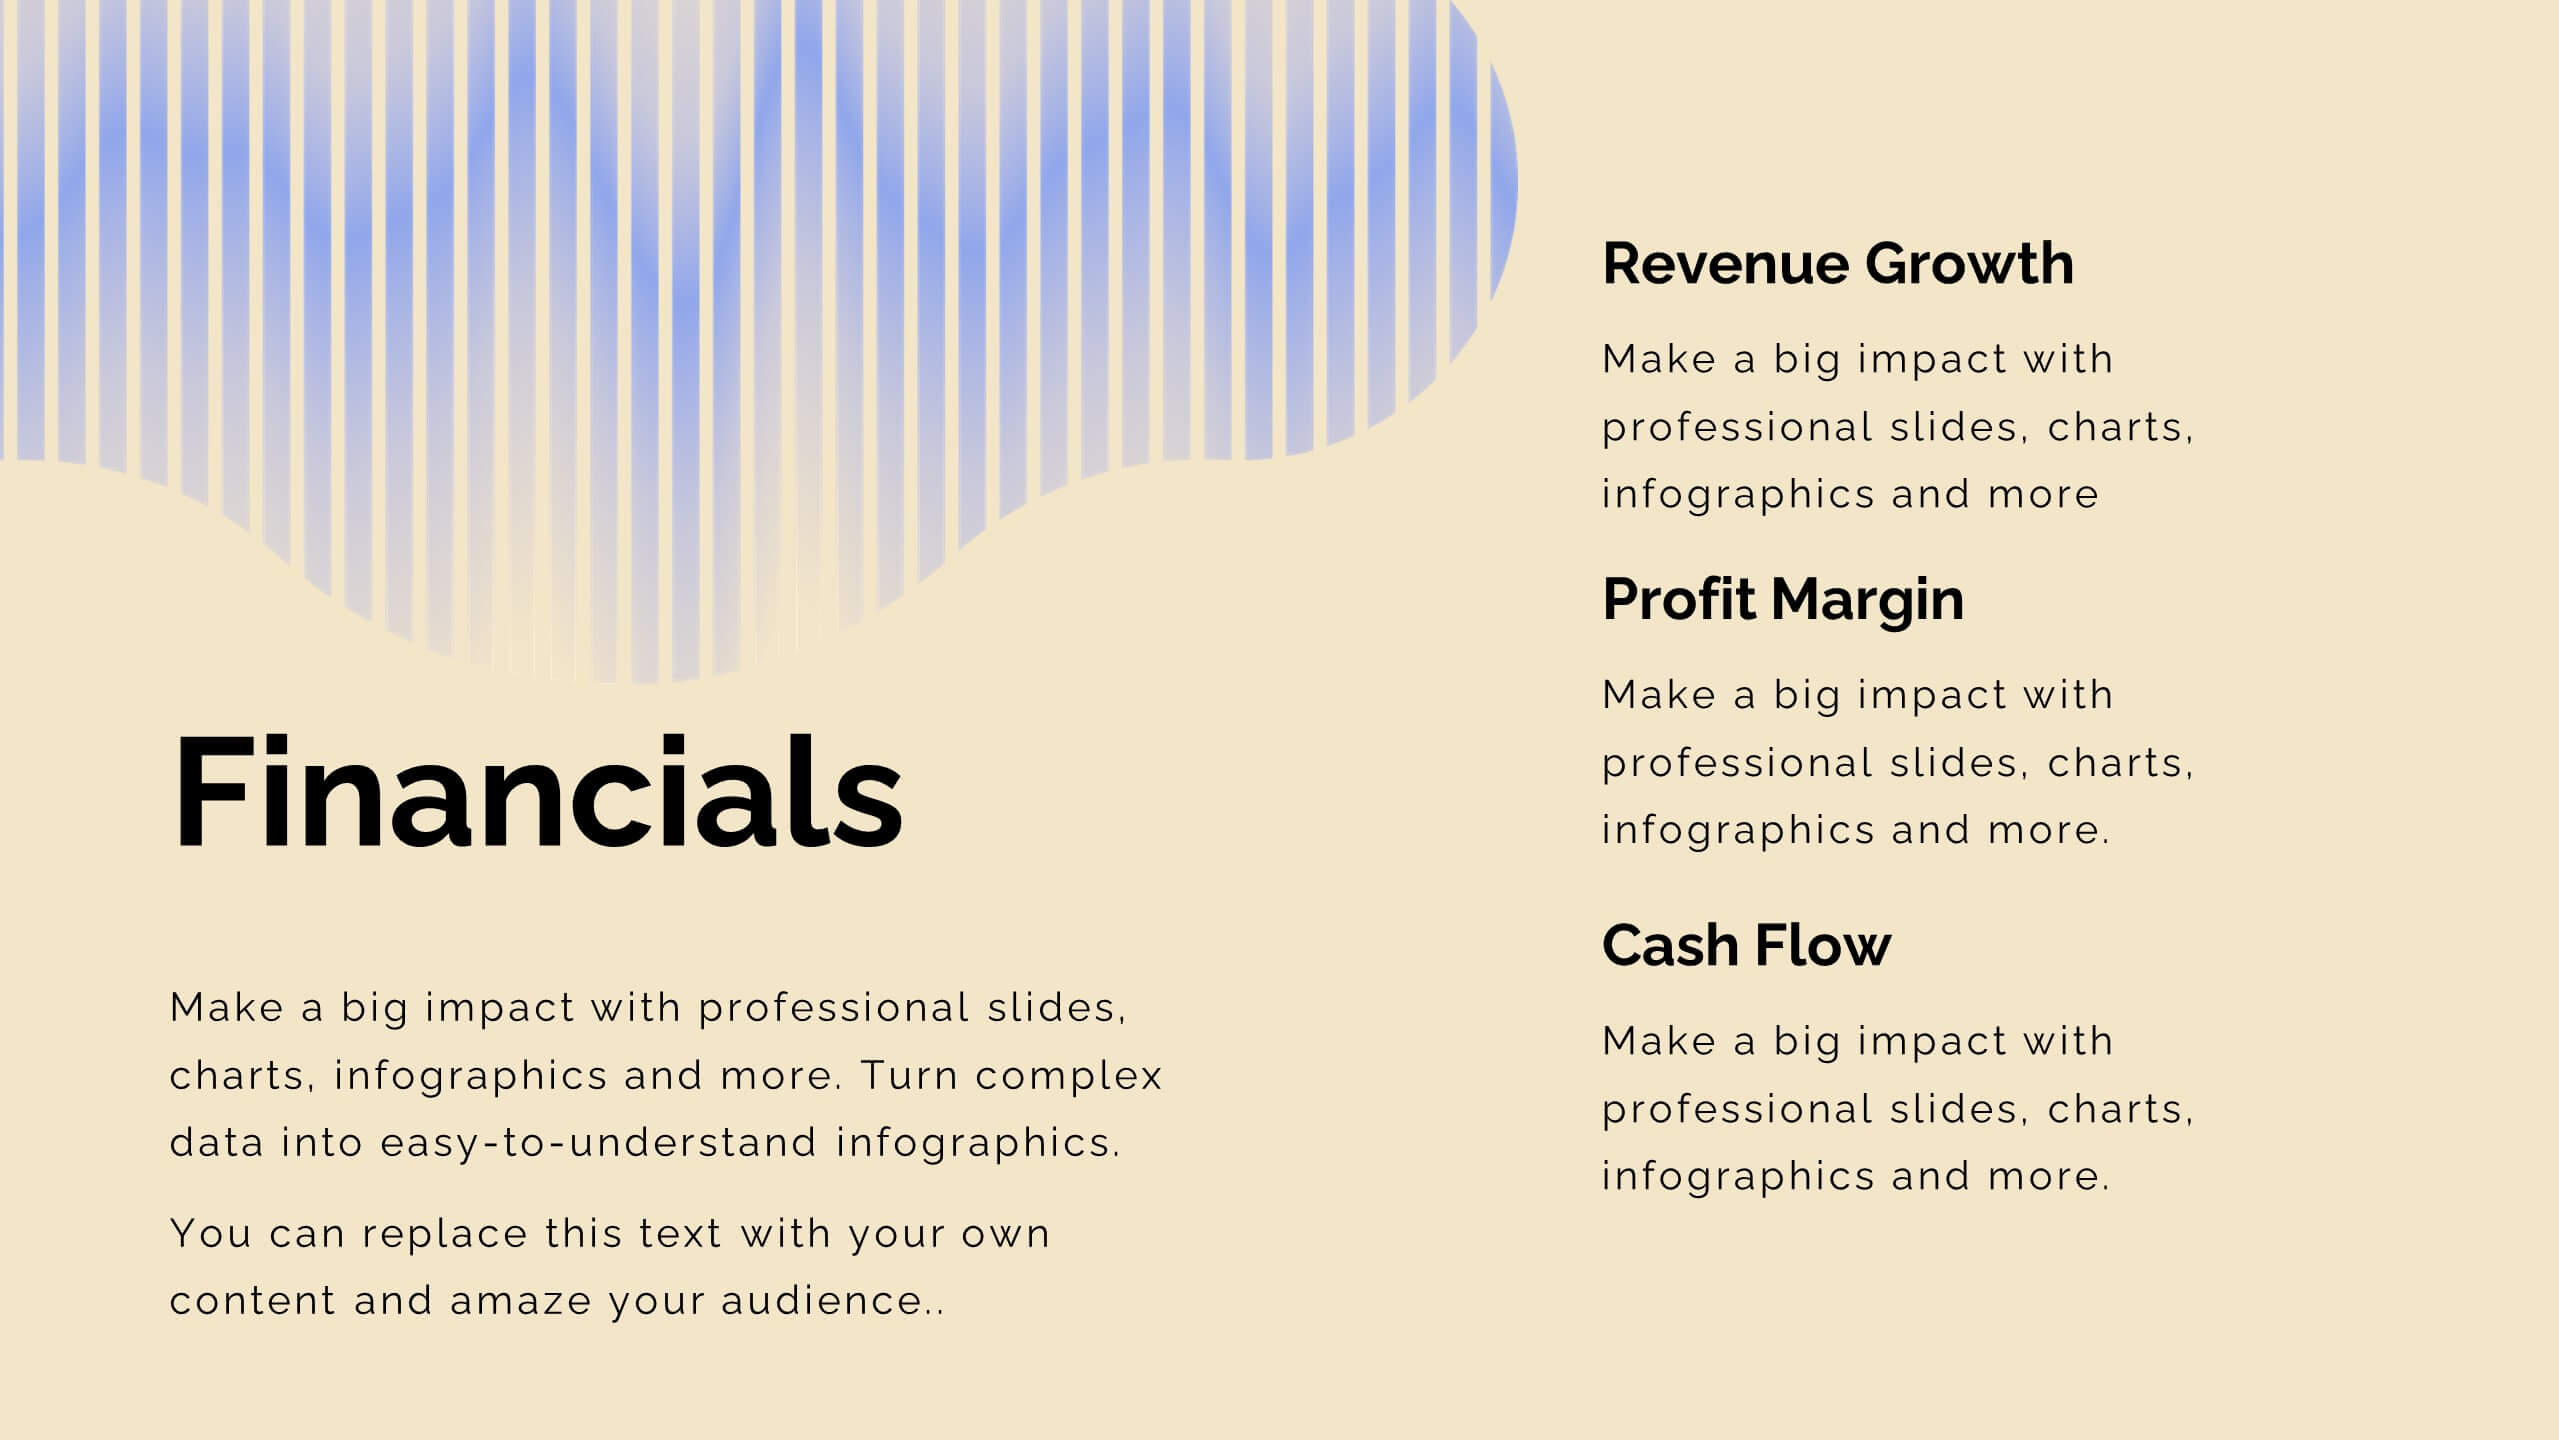
Strategic Business Execution Playbook Presentation
Streamline your execution roadmap with this Strategic Business Execution Playbook. Featuring a sleek, step-by-step layout, it’s ideal for showcasing business stages, workflows, or strategic planning phases. Easy to customize in PowerPoint, Keynote, and Google Slides, this template helps teams visualize priorities and align goals with precision and clarity.