


Características


¿Tienes alguna pregunta?
Recomendar


5 diapositivas
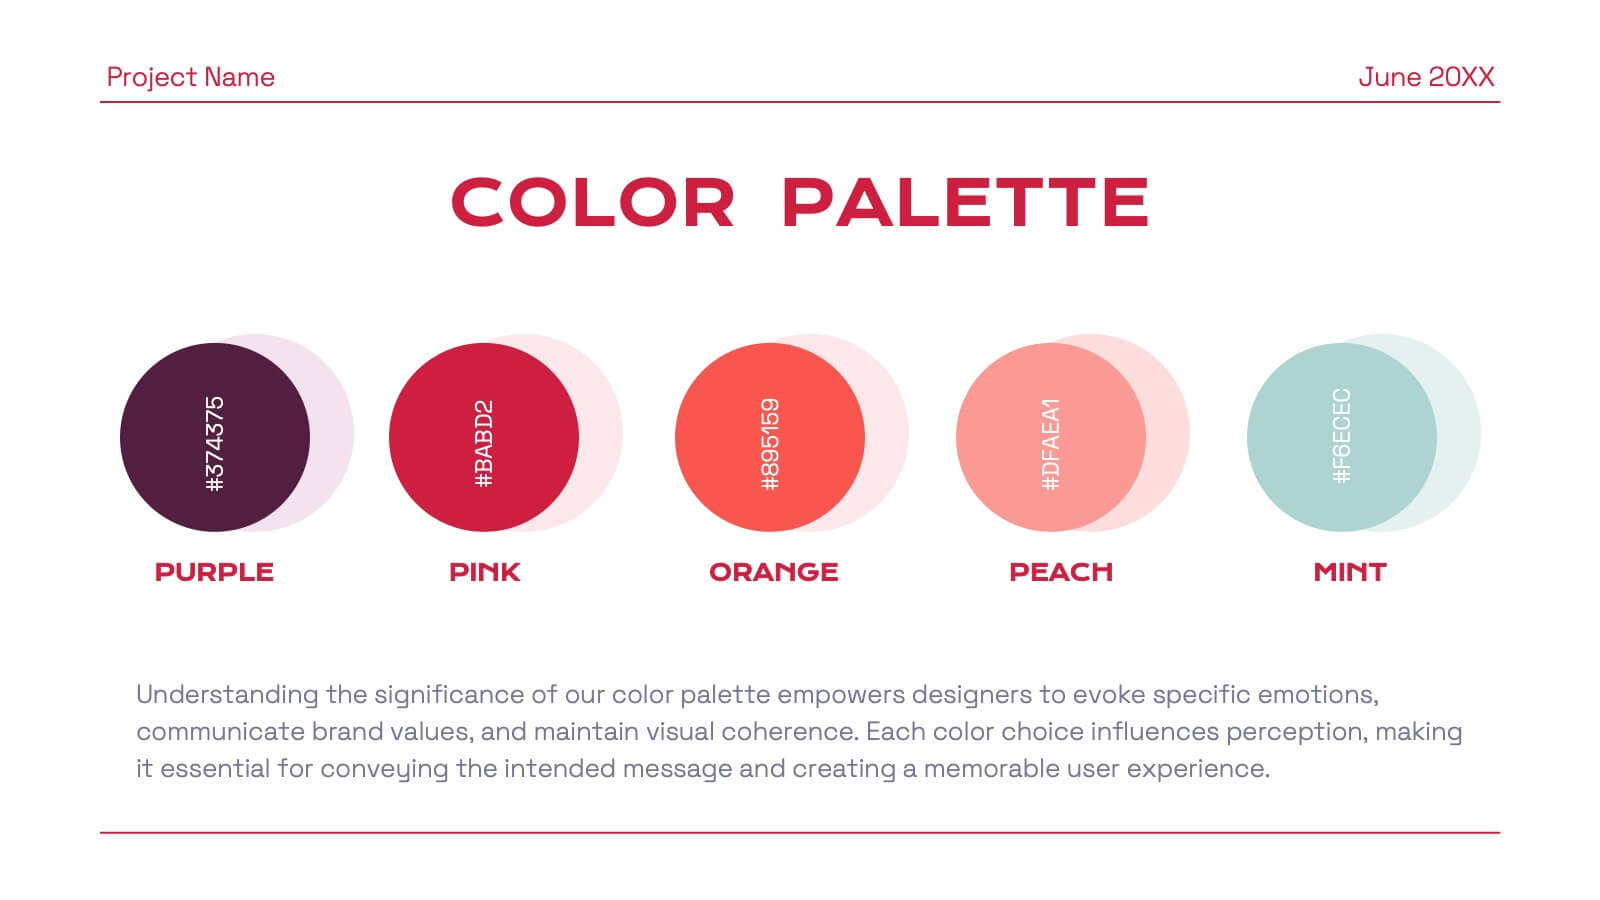
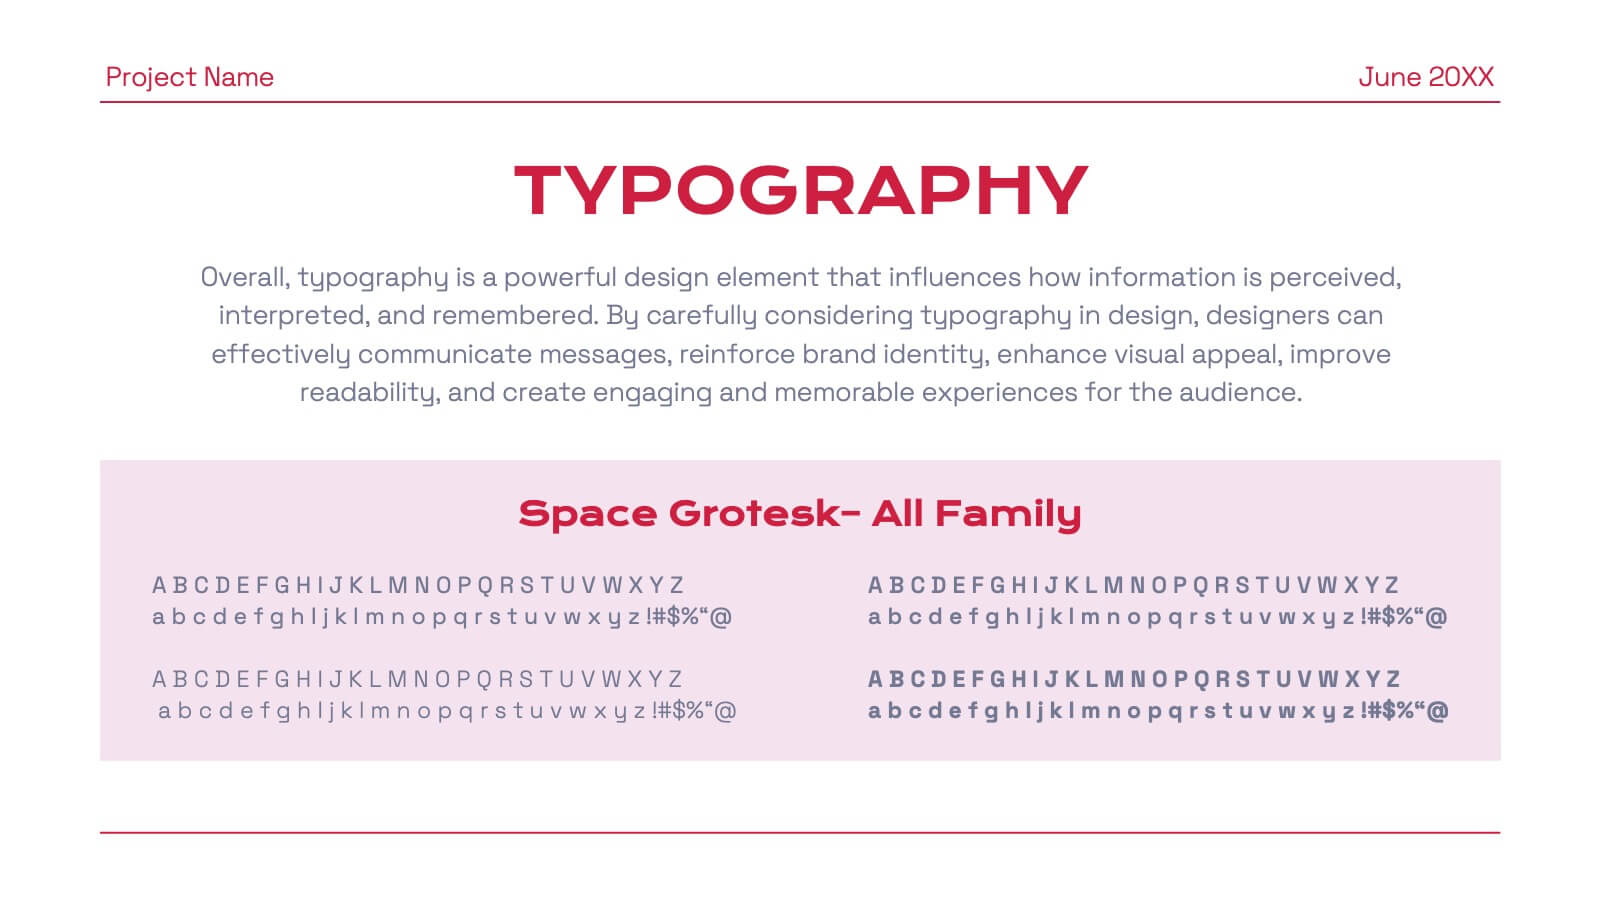
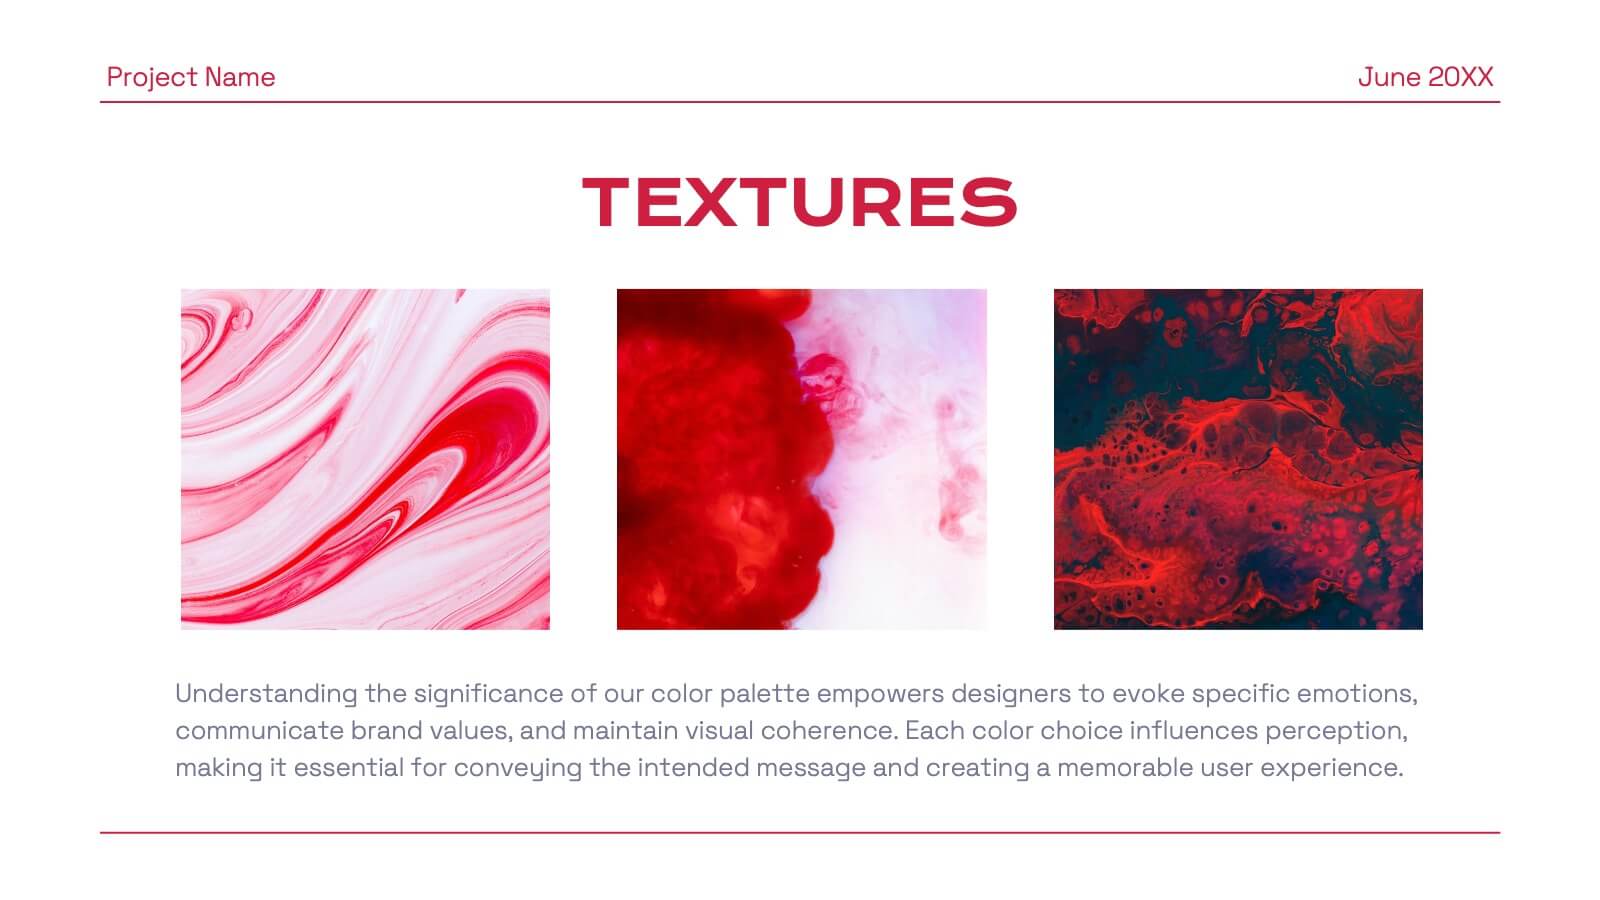
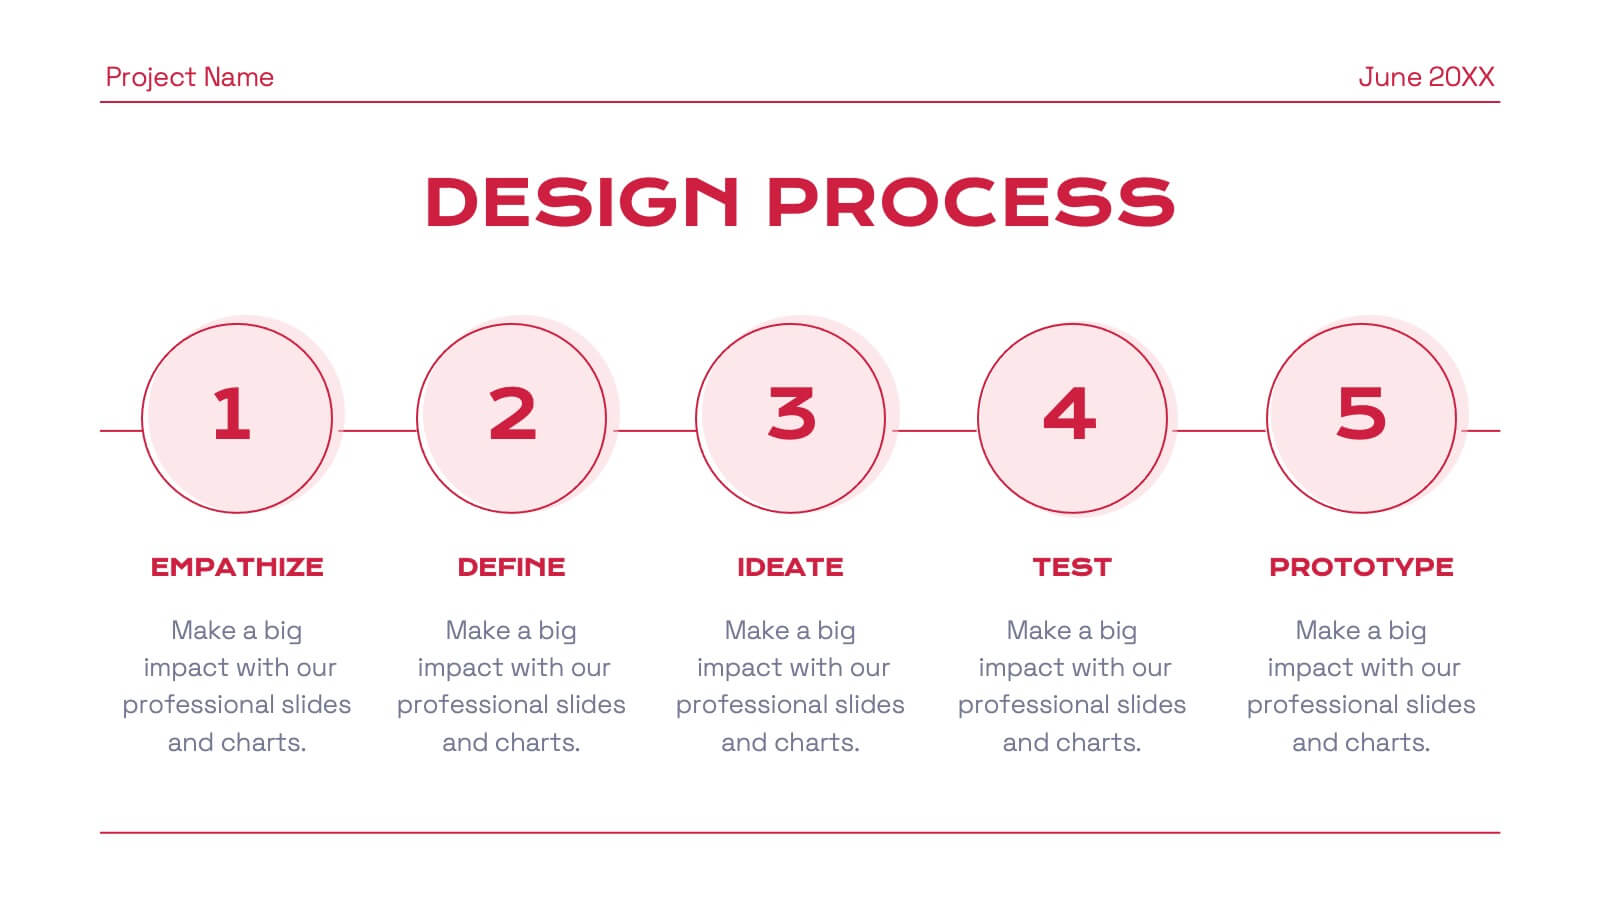
Empowered Leadership and Influence Strategy
Showcase impactful leadership journeys with the Empowered Leadership and Influence Strategy Presentation. This slide features a bold mountain-style layout that symbolizes growth, with five colorful peaks representing key leadership steps or principles. Perfect for professional development workshops, executive coaching, or team-building presentations. Fully editable and compatible with PowerPoint, Keynote, and Google Slides.


7 diapositivas
Relationship Polices Infographic
Navigate the intricacies of interpersonal dynamics with our relationship policies infographic. Adorned in the purity of white, complemented by shades of understanding blue and harmonious green, this template elucidates the principles and boundaries that shape healthy relationships. Detailed with relevant infographics, symbolic icons, and illustrative image placeholders, it provides a visual roadmap to successful connections and interactions. Impeccably designed for Powerpoint, Keynote, or Google Slides. An essential tool for HR professionals, relationship counselors, team leaders, or any organization emphasizing healthy interpersonal dynamics. Foster connections; let each slide guide the way to relationship excellence.


23 diapositivas
Skycrest Business Idea Pitch Deck Presentation
Present your innovative business idea with this bold pitch deck, featuring sections for problem statement, solution, business model, and financial projections. Ideal for capturing investor attention, this template supports PowerPoint, Keynote, and Google Slides, making it perfect for impactful presentations across multiple platforms.


4 diapositivas
Governance Policy Overview Presentation
Set the foundation for transparency and accountability with this visually engaging presentation design. Perfect for outlining organizational rules, compliance standards, and policy frameworks, it turns complex governance details into clear, structured visuals. Fully customizable and compatible with PowerPoint, Keynote, and Google Slides for effortless professional presentations.


5 diapositivas
Poaching Facts Infographics
Poaching refers to the illegal hunting, capturing, or killing of wildlife, typically for profit or personal gain. These compelling and informative infographic templates are designed to shed light on the issue of poaching and its impact on wildlife and ecosystems. They present key facts, statistics, and illustrations to raise awareness about the seriousness of poaching and the need for conservation efforts. By increasing awareness and understanding of the poaching crisis, these templates contribute to the collective efforts in protecting our precious wildlife and preserving the natural world.


5 diapositivas
Pandemic Prevention and Treatment Options Infographics
Pandemic Prevention is the proactive measures taken to reduce the risk of the spread and impact of infectious diseases on a global scale. These infographic templates are designed to communicate the essential information about pandemic prevention and treatment options. It provides a visually appealing and easy-to-understand overview of key concepts, preventive measures, and treatment options. Use this template to educate and empower your audience with the knowledge needed to navigate pandemics effectively and contribute to public health and safety. This template is perfect for healthcare professionals, educators, and organizations looking to share valuable information.


5 diapositivas
Healthcare Solutions in Modern Medicine Presentation
Present pharmaceutical and medical data with clarity using these modern healthcare infographics. Designed with pill packs, bandages, and capsules, this editable template is ideal for illustrating treatment comparisons, solution options, or patient care data. Perfect for medical professionals, health startups, and researchers using PowerPoint, Keynote, or Google Slides.


10 diapositivas
Water Cycle and Hydrological Study Presentation
Break down complex water cycle processes with this engaging diagram layout. Featuring a bottle-shaped center graphic with directional arrows, it’s perfect for illustrating hydrological stages or sustainability concepts. Fully editable in PowerPoint, Keynote, and Google Slides, making it ideal for educational, environmental, or scientific presentations. Clear, modern, and easy to use.


10 diapositivas
Digital Transformation Strategy Presentation
The "Digital Transformation Strategy Presentation" template is designed to clearly showcase the stages of digital transformation initiatives. It features a visually appealing layout with concentric circles or varying targets that focus on key elements of transformation strategy. This format is ideal for emphasizing the progression from planning to execution and monitoring of digital strategies. Each section is distinctly colored and provides a space for succinctly labeled titles and detailed descriptions, making it perfect for presenting strategic initiatives, technology implementation, or progress metrics in corporate settings. The template ensures that complex strategies are communicated in an understandable and visually engaging manner.


7 diapositivas
World Maps Medical Security Infographic
Introducing our world map medical security infographic, a template designed to spotlight global medical security concerns and solutions. With a pristine white backdrop punctuated by shades of blue, this infographic offers a tranquil yet informative ambiance, reminiscent of the medical field. Embedded within are custom graphics of the world map, tailor-made to highlight regions based on their medical security levels, accompanied by relevant icons that represent various aspects of healthcare protection and risks. It’s compatibility with platforms such as PowerPoint, Keynote, and Google Slides ensures seamless presentations across various devices and audiences.


23 diapositivas
Fama Business Idea Pitch Deck Presentation
Present your business idea with this impactful pitch deck, covering key areas like problem statement, solutions, competitive landscape, financials, and growth projections. With a bold design, it effectively showcases your startup’s value proposition. Compatible with PowerPoint, Keynote, and Google Slides for dynamic and professional investor presentations.


5 diapositivas
Digital Marketing Infographics
Digital Marketing refers to the use of digital channels, platforms, and strategies to promote products, services, and brands to reach and engage with target audiences. These infographic templates are perfect for explaining concepts, illustrating processes, showcasing data, or comparing information. They are commonly used in digital marketing to provide information to clients, educate consumers, and promote products and services. These Infographics can be shared on social media, websites, and blogs to increase engagement and drive traffic to a brand's online presence. Compatible with Powerpoint, Keynote, and Google Slides.


7 diapositivas
Network Marketing Infographic
Network marketing, is a business strategy where salespersons earn income through both direct sales of products or services and by recruiting new salespeople. This infographic template serves as a compass, guiding you through the intricate pathways of this business model and shedding light on the strategies and dynamics that lead to success. Compatible with Powerpoint, Keynote, and Google Slides. Illustrate a network of interconnected nodes to visualize the structure and growth potential of network marketing, demonstrating how each node represents a potential customer or distributor.


22 diapositivas
Eclipse Graphic Design Project Plan Presentation
Develop a winning marketing strategy with this dynamic template. Dive into current trends, consumer behavior, and innovative techniques. Perfect for social media, influencer marketing, and data-driven campaigns. Fully compatible with PowerPoint, Keynote, and Google Slides.


6 diapositivas
COVID-19 Impact on Business Presentation
Visually communicate the key effects of the pandemic with this clean and engaging slide layout. Featuring a central storefront icon surrounded by six customizable virus-themed icons, this design allows you to outline critical changes, challenges, or strategic shifts. Ideal for presentations on crisis management, business continuity, or recovery planning. Fully editable in PowerPoint, Keynote, and Google Slides.


6 diapositivas
Internal Communication Framework Presentation
Foster stronger collaboration with this visual internal communication framework template. Ideal for showcasing how information flows within departments, this layout helps clarify messaging channels, responsibilities, and feedback loops. Whether you're streamlining communication strategies or presenting team structures, it’s fully editable and works seamlessly with PowerPoint, Keynote, and Google Slides.


12 diapositivas
Predictive Analytics with Big Data Presentation
Unleash the power of Predictive Analytics with Big Data using this dynamic presentation template. Designed to highlight data-driven insights, AI-powered forecasting, and strategic decision-making, this template is ideal for data scientists, business analysts, and IT professionals. Fully customizable and available for PowerPoint, Keynote, and Google Slides, it ensures a visually compelling and structured presentation.