


Características


¿Tienes alguna pregunta?
Recomendar


7 diapositivas
Time Management Goal Infographic
Time management is the process of organizing and planning how to divide your time between specific activities effectively and efficiently to achieve desired goals or outcomes. This infographic template is designed to empower you in mastering time, optimizing productivity, and seizing the day. This infographic provides a visually striking way to illustrate time management strategies, tips, and hacks for anyone looking to make the most of their time. Fully customizable and compatible with Powerpoint, Keynote, and Google Slides. This showcases time-bound tasks, emphasizing the importance of setting deadlines and managing tasks within periods.


7 diapositivas
Brain Planning Infographic Presentation
Looking for a modern and personable brain Infographic? This template is the perfect choice! It contains all the elements you need to make a successful and engaging infographic. This template is perfect for brainstorming, business marketing, academic projects and personal infographics. You can use this template to help you plan, refine and present a successful pitch. From project to execution and profit this brain infographic breaks down the process into smaller, more manageable steps. Impress your audience with your facts and figures using this unique, colorful infographic!


26 diapositivas
Beauty Products Company Profile Presentation
A beauty products company is a business that specializes in the development, manufacturing, marketing, and sale of various beauty and skincare products. This presentation template is designed to showcase your cosmetics and skincare brand in the most captivating and alluring way possible. With a blend of elegance and modernity, this template is your beauty brand's ticket to leaving a lasting impression on clients, investors, and partners. Fully customizable and compatible with Powerpoint, Keynote, and Google Slides. The sophisticated color palette will reflect the elegance of your beauty company.


6 diapositivas
Europe Education Map Infographics
Explore our versatile Europe Education Map infographic template, a valuable resource for visualizing the educational landscape across the continent of Europe. This template is fully compatible with popular presentation software such as PowerPoint, Keynote, and Google Slides, allowing you to effortlessly customize it to meet your specific needs. The Europe Education Map infographic template provides a solid foundation for illustrating data related to educational institutions, literacy rates, and academic trends throughout Europe. Whether you're an educator, researcher, or interested in European education, this template offers a user-friendly platform to create informative presentations and educational materials. Impress your audience with this SEO-optimized Europe Education Map infographic template, designed for clarity and ease of use. Customize it to showcase educational opportunities, achievements, and regional insights, making it a valuable asset for your projects and presentations. Begin crafting your personalized infographic today!


5 diapositivas
Risk Management Bowtie Diagram Layout Presentation
Visualize risk pathways with clarity using the Risk Management Bowtie Diagram Layout Presentation. This design helps illustrate cause-and-effect relationships around a central risk event, making it ideal for identifying threats, controls, and consequences. Fully editable and easy to adapt in Canva, PowerPoint, Google Slides, and Keynote.


5 diapositivas
Compete-Free Market Space Creation Presentation
The Compete-Free Market Space Creation Presentation is designed to help illustrate a strategic shift toward innovation-led market growth. This circular diagram layout allows you to highlight four essential focus areas—each with customizable icons, titles, and supporting text. Ideal for presenting frameworks based on Blue Ocean Strategy, business differentiation, or uncontested market exploration. The clean, professional design supports storytelling with clarity and flow, making it perfect for consultants, business strategists, and executive teams. Fully editable in PowerPoint, Keynote, and Google Slides for maximum flexibility.


20 diapositivas
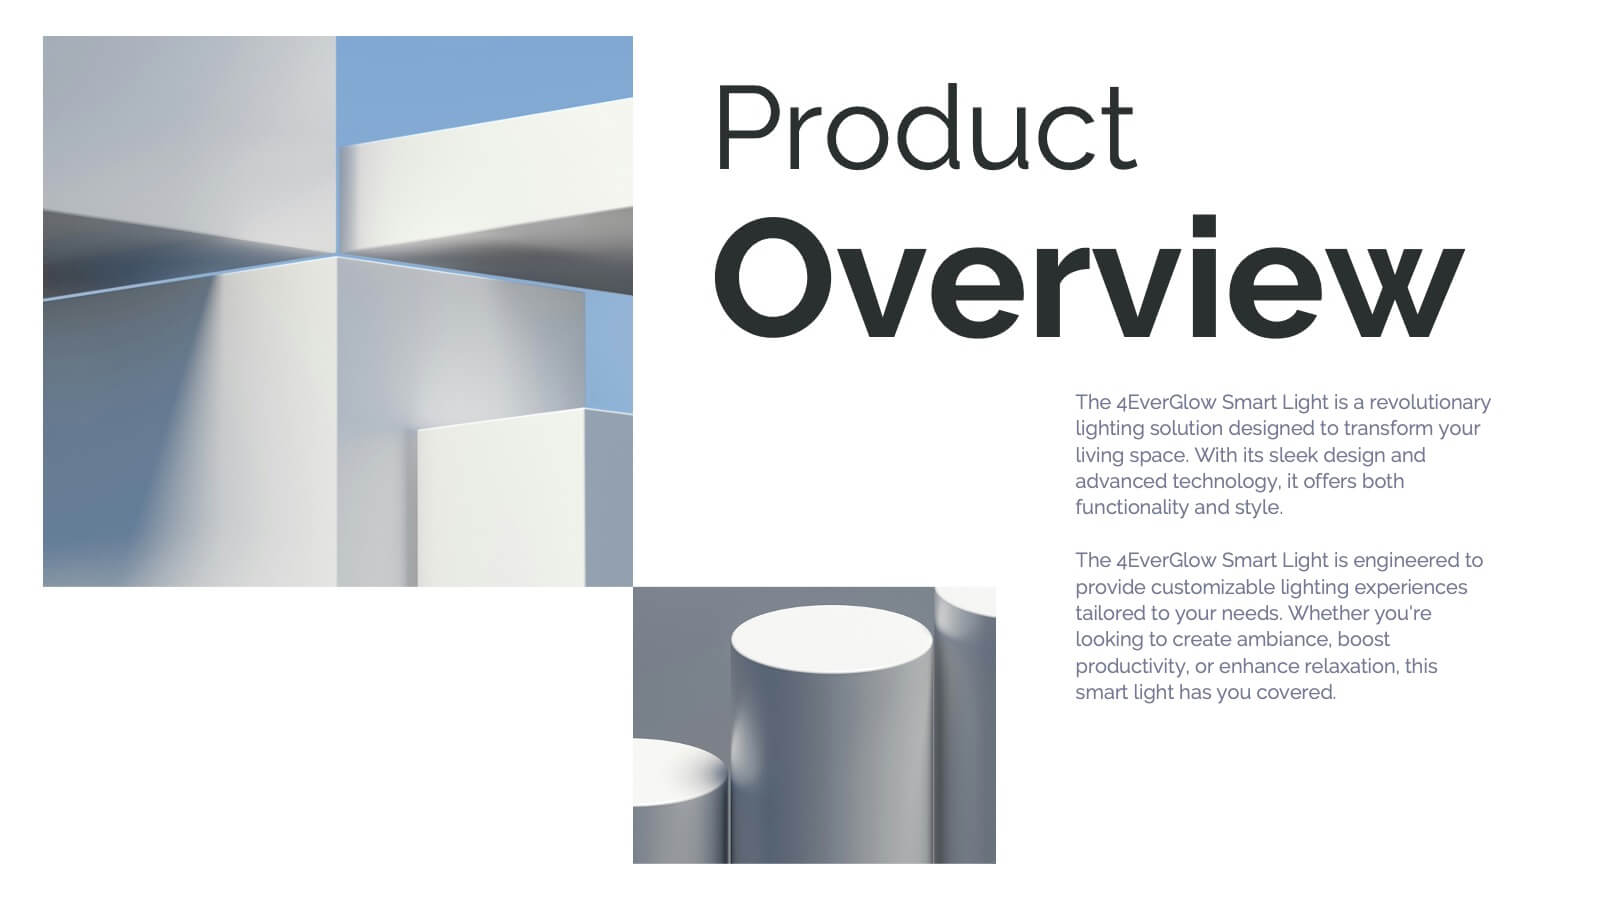
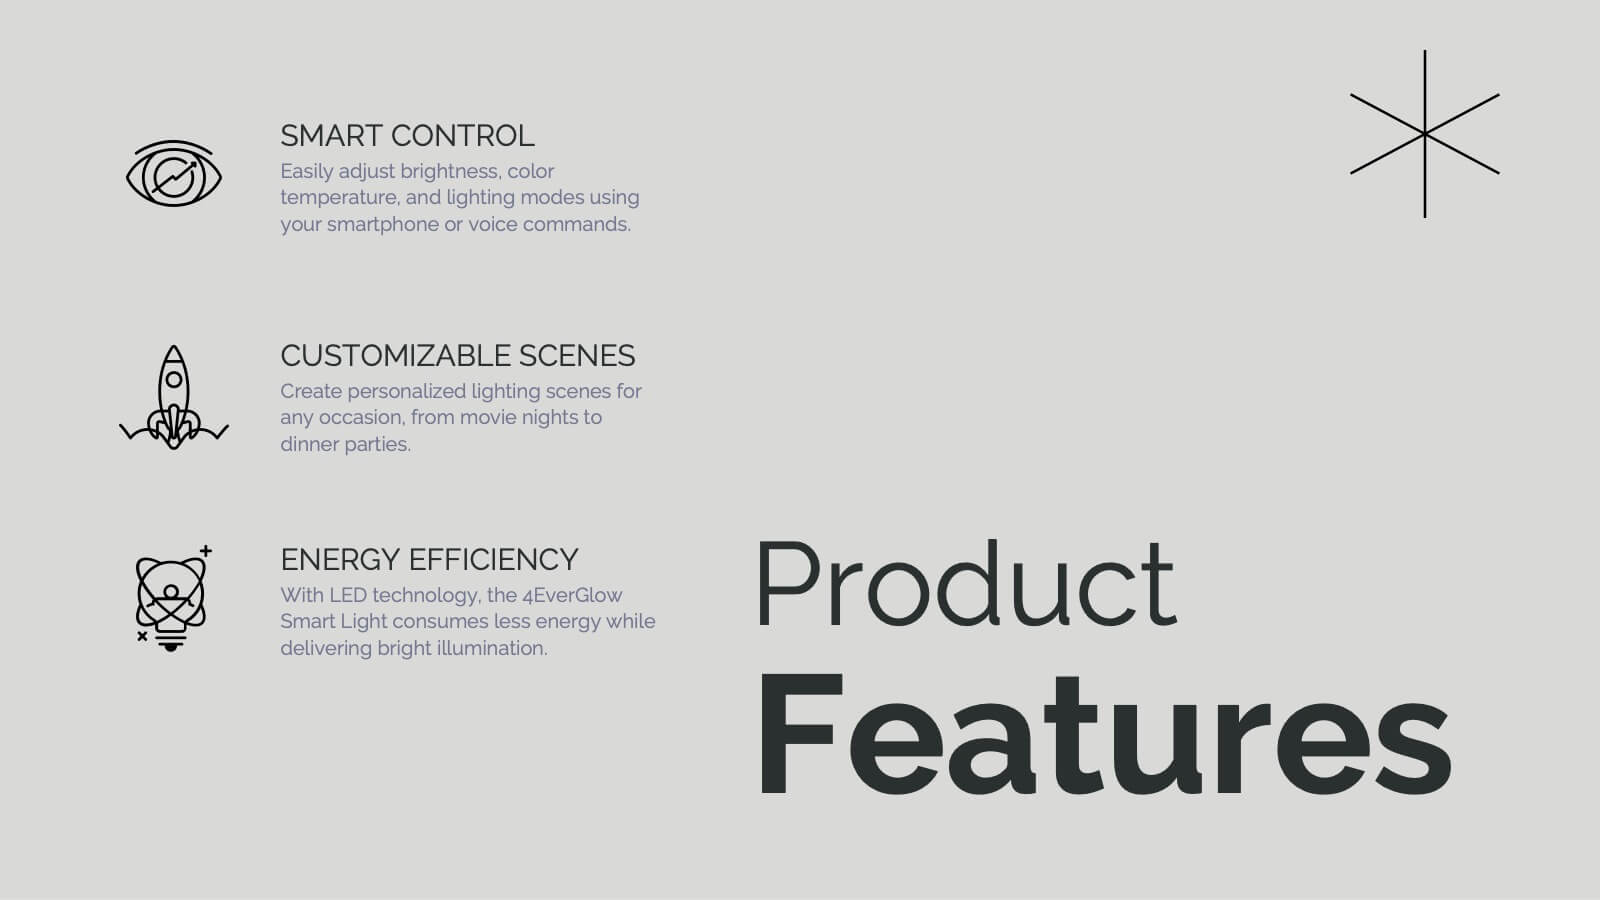
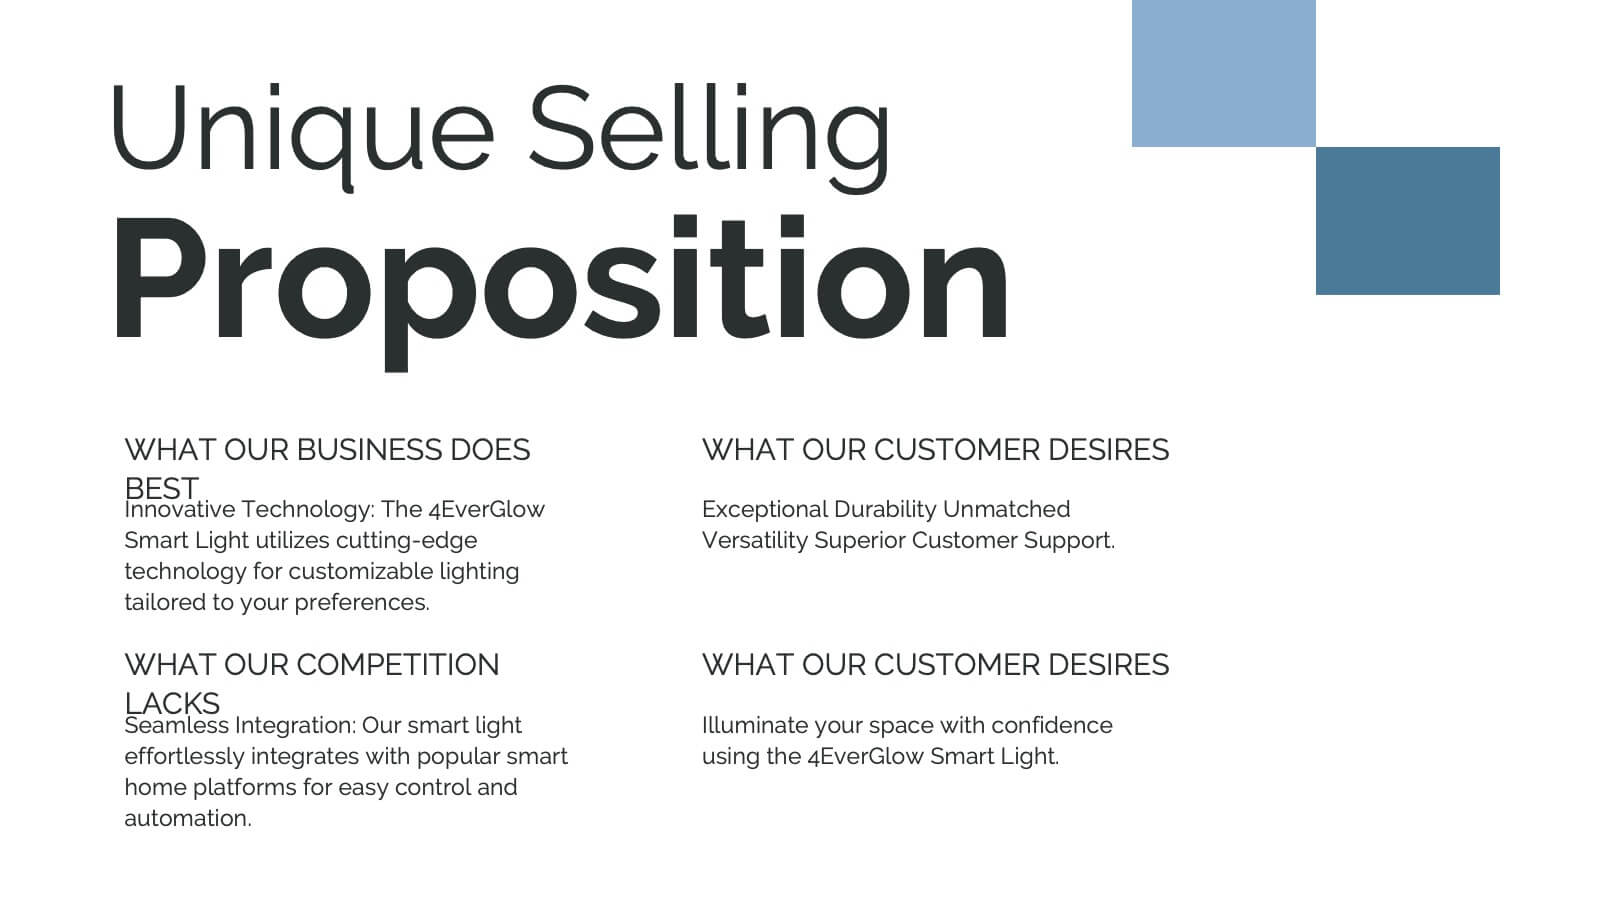
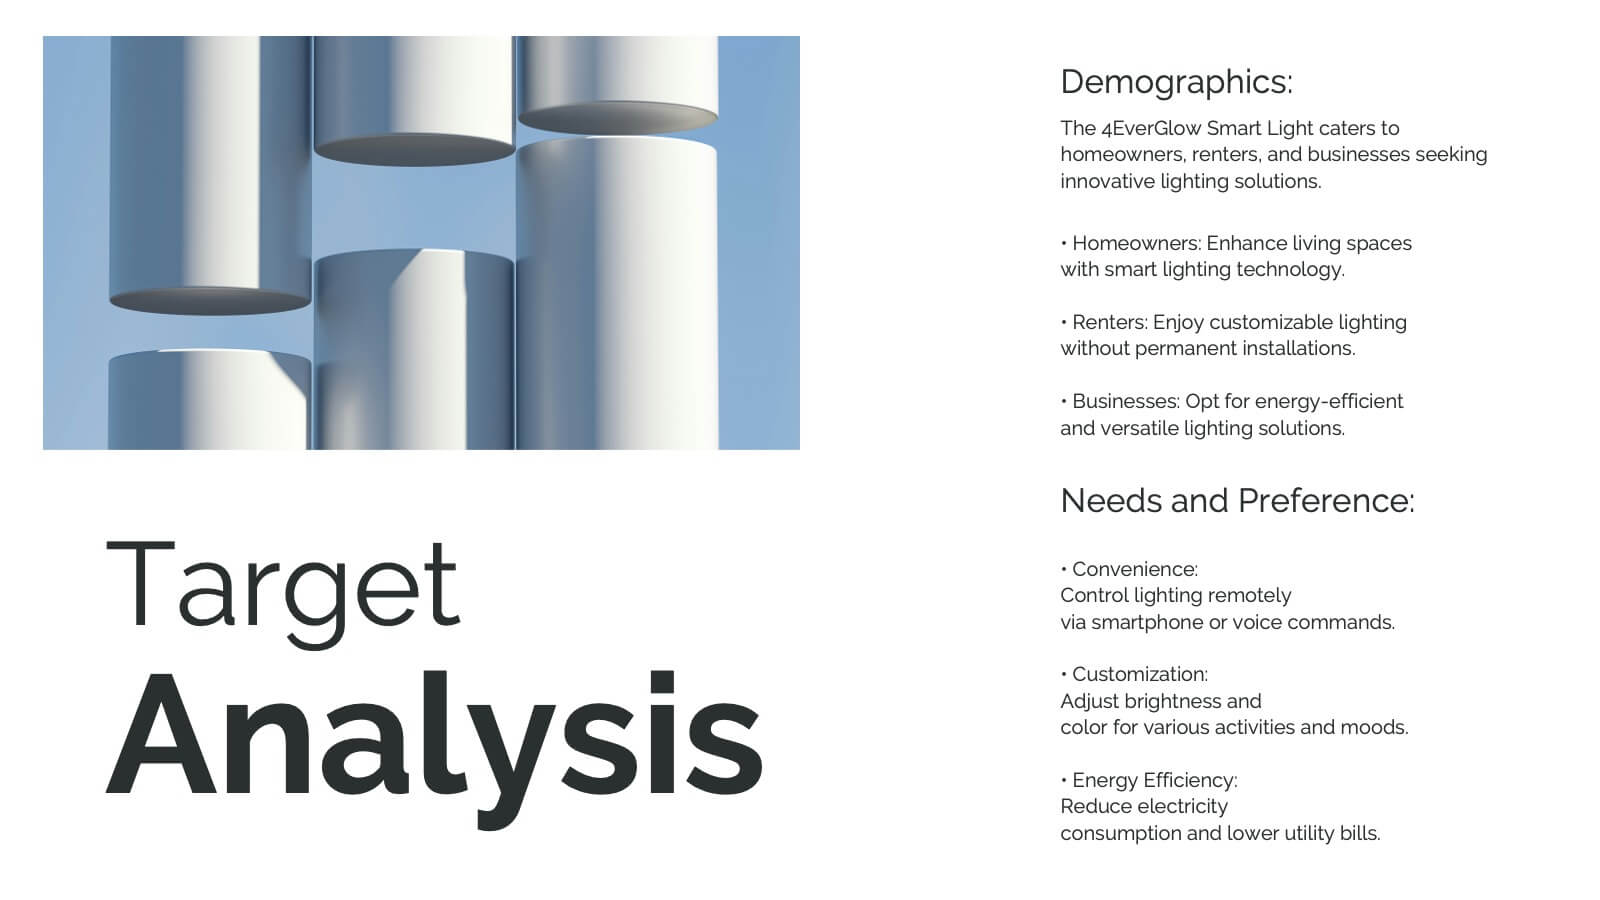
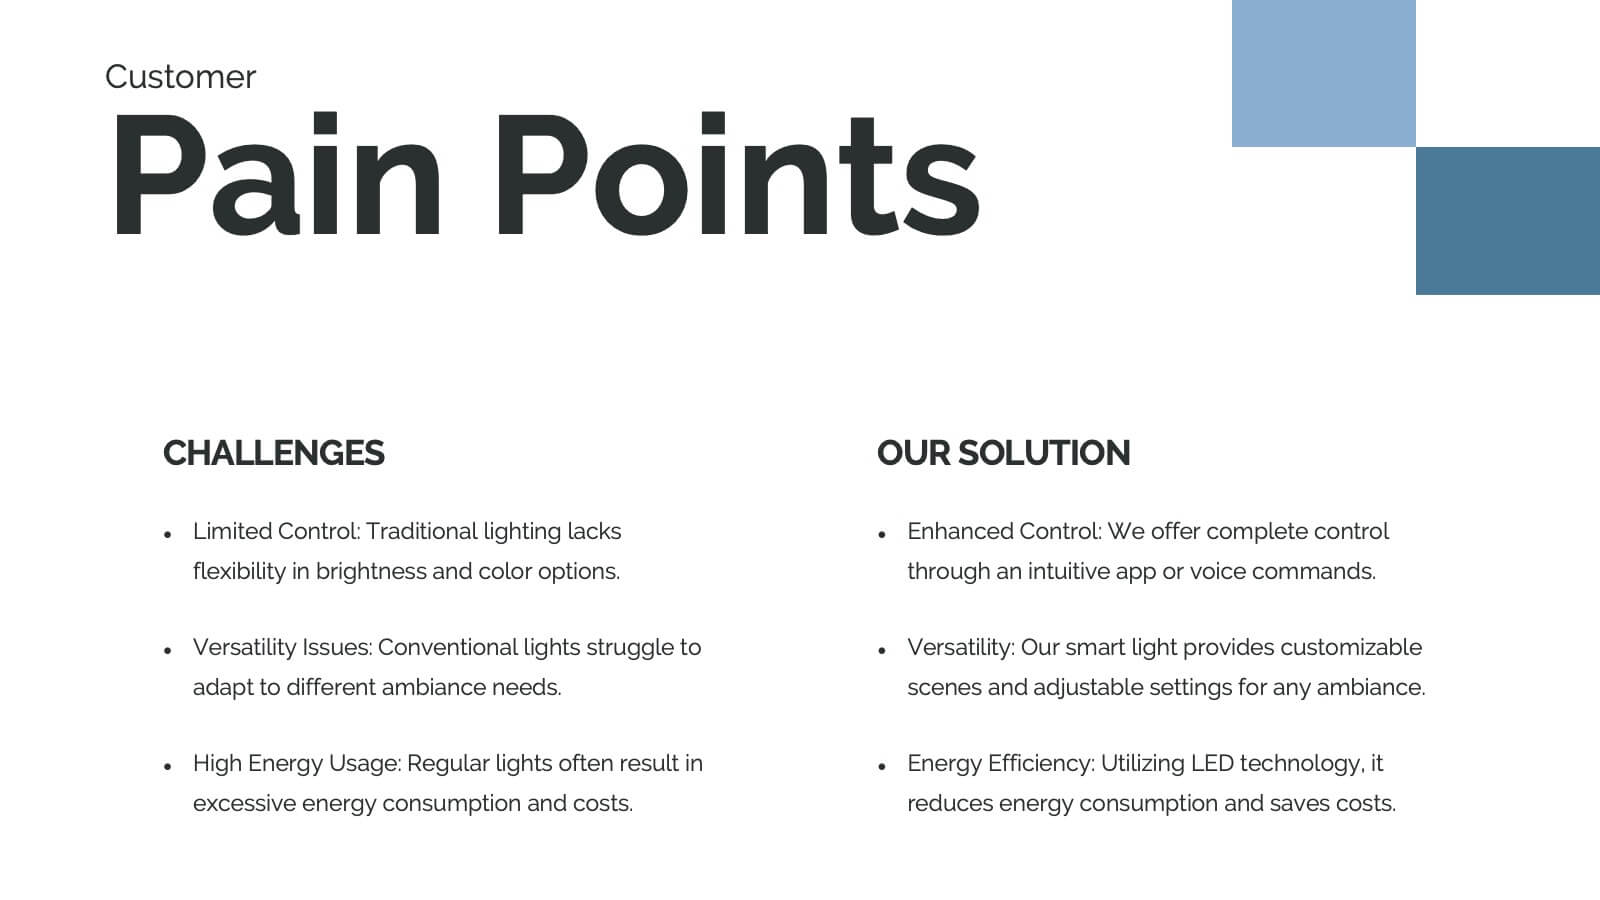
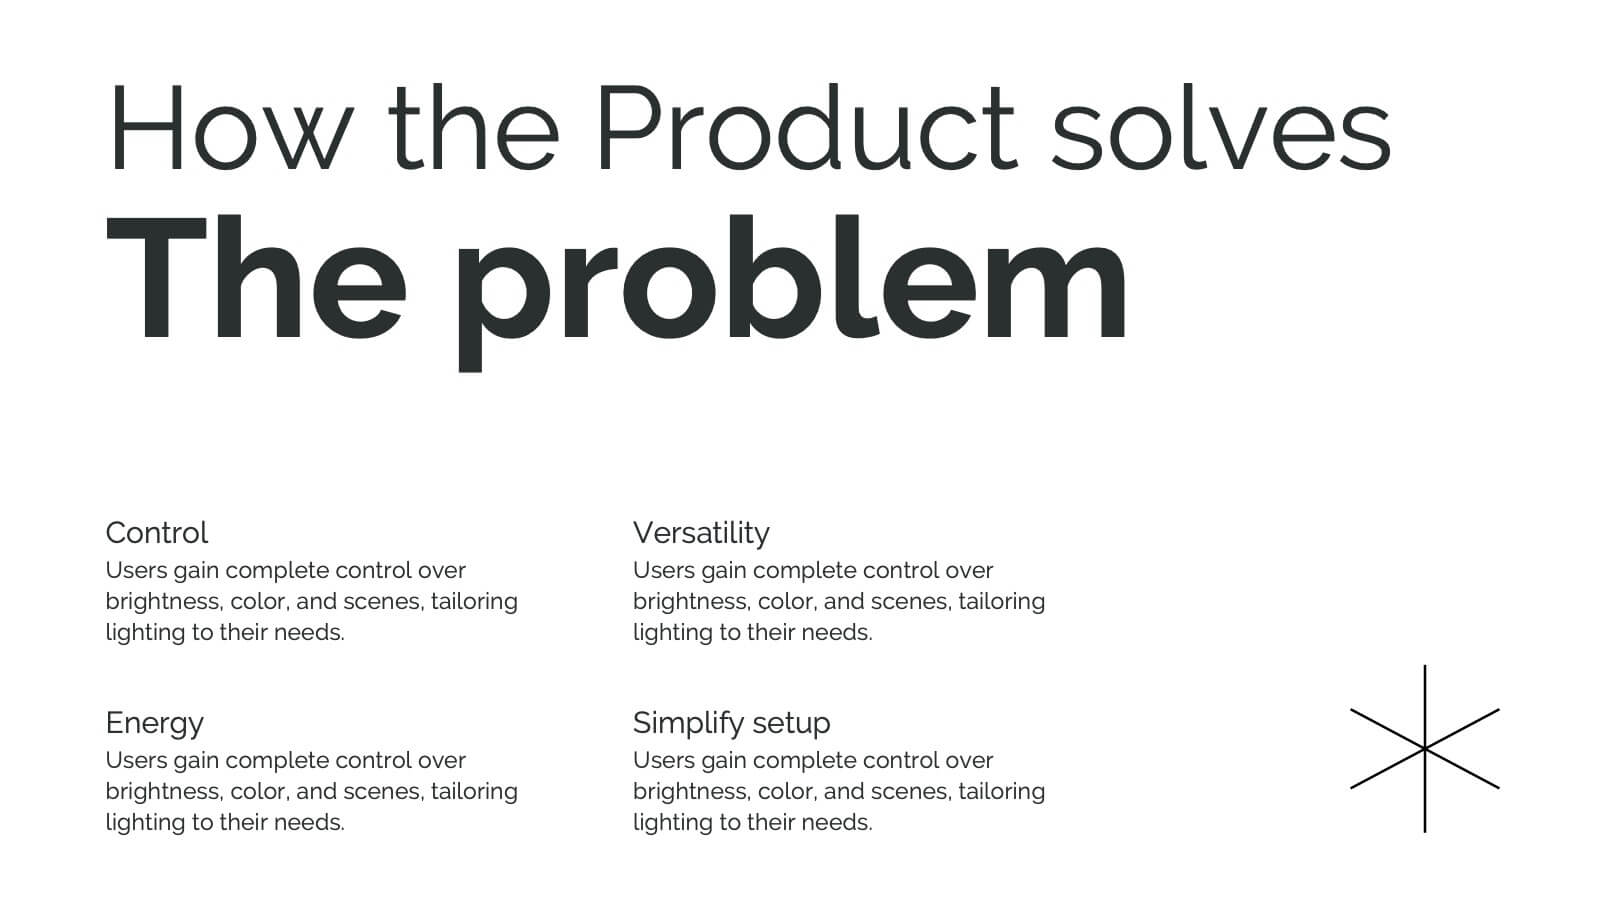
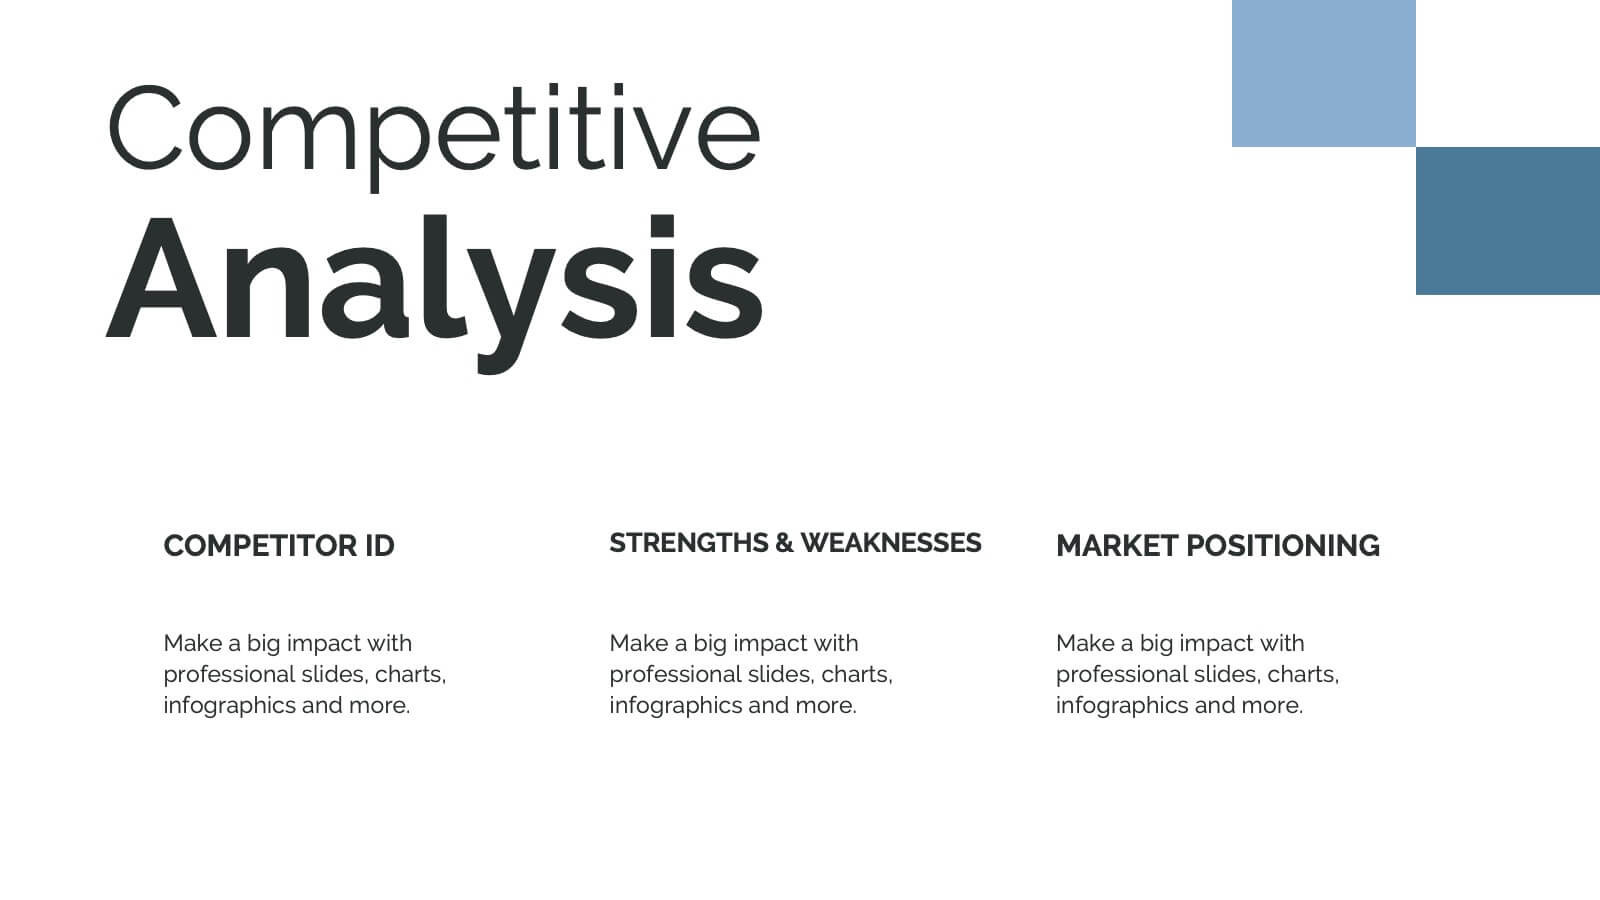
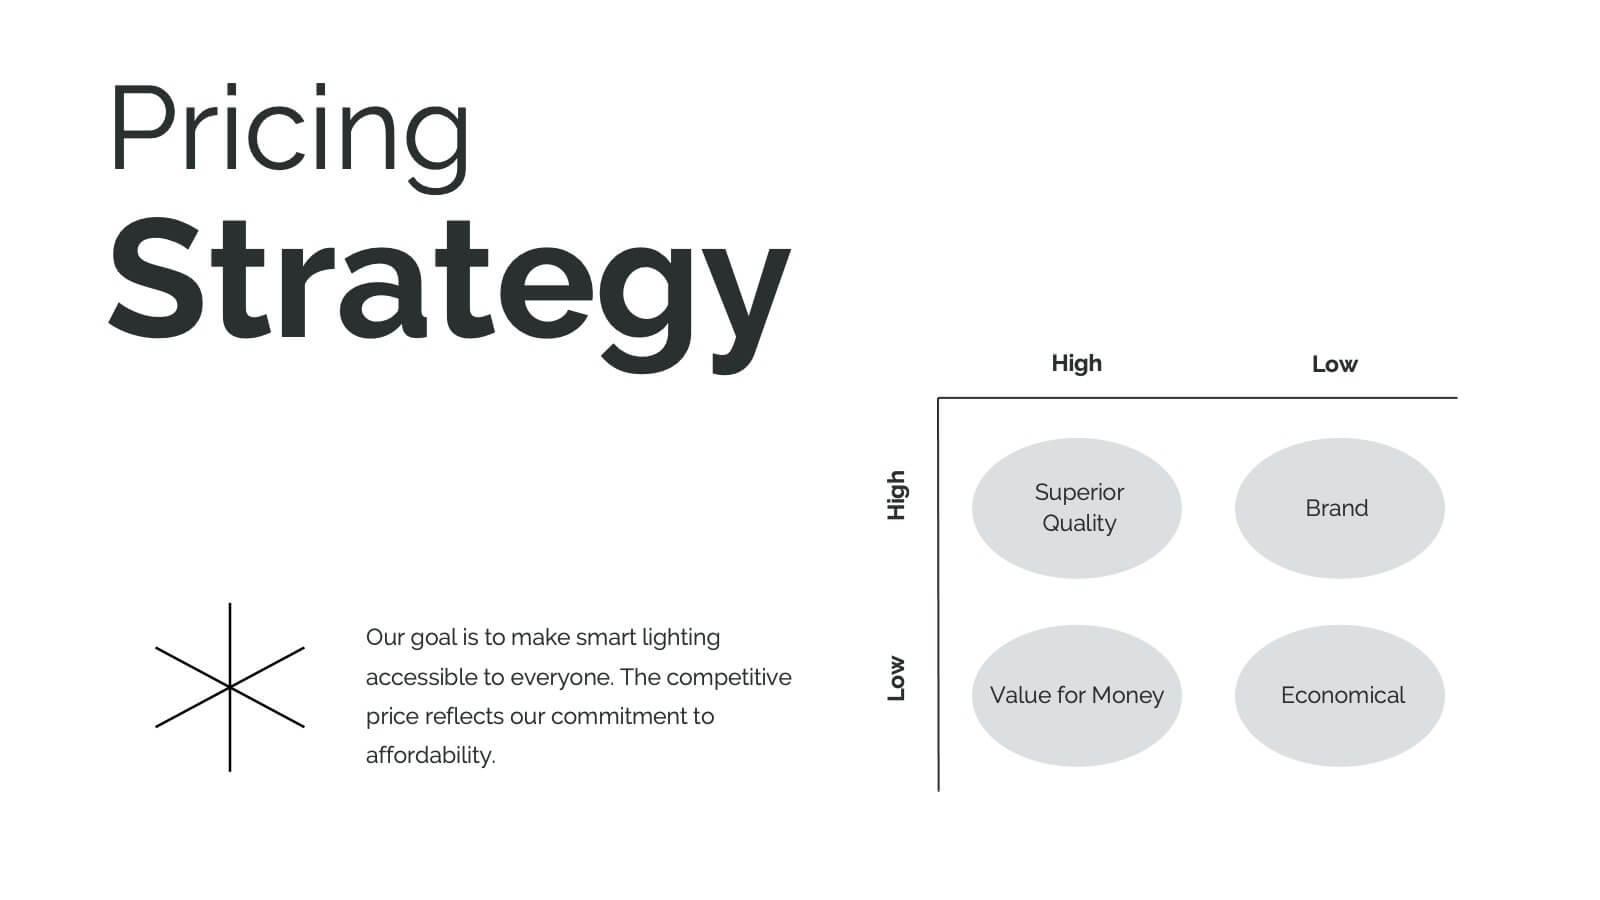
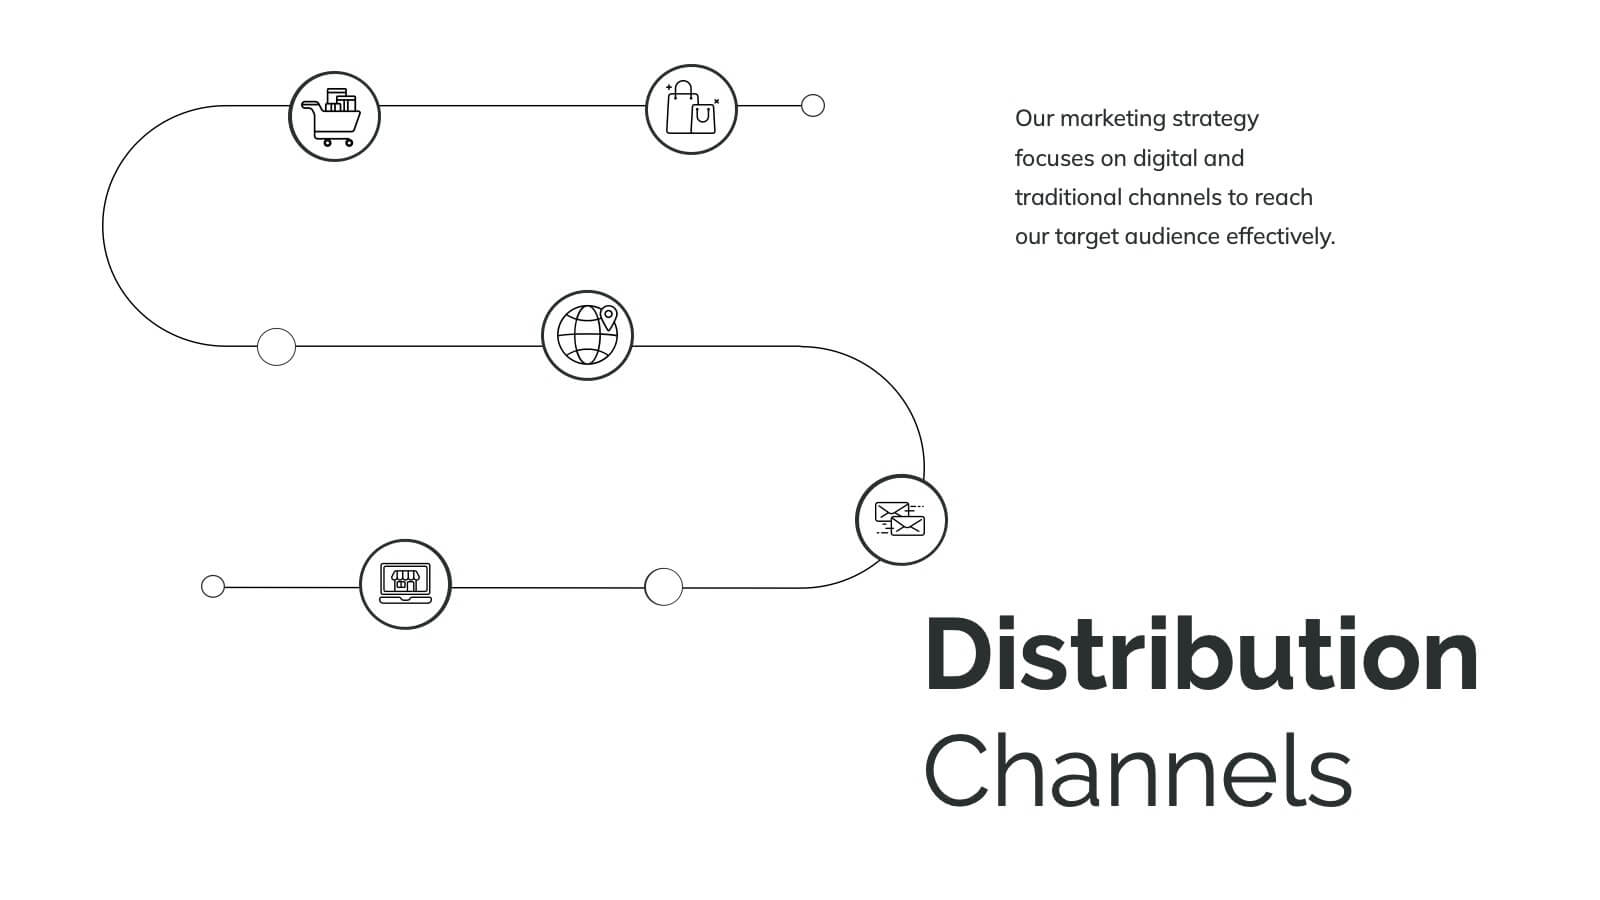
Hydra Product Launch Presentation
Unveiling your latest product has never been easier or more captivating! This comprehensive presentation template covers every aspect of your product's journey—from launch to competitive analysis. Engage your audience with detailed slides on features, target analysis, and pricing strategy. Seamlessly compatible with PowerPoint, Keynote, and Google Slides for maximum flexibility and impact.


5 diapositivas
Strategic Planning with OKRs Presentation
Optimize goal-setting with the Strategic Planning with OKRs presentation. This visually engaging template uses a trophy-inspired design to highlight key objectives and results, making it perfect for business strategy sessions, team alignment, and performance tracking. Fully customizable and compatible with PowerPoint, Keynote, and Google Slides for seamless use.


3 diapositivas
Digital Course Planning and LMS Strategy Presentation
Design your online courses like a pro with this clean, easy-to-follow visual. Ideal for mapping course flow, LMS strategy, and learner journeys, this presentation template breaks down complex processes into digestible steps. Fully customizable and compatible with PowerPoint, Keynote, and Google Slides for flexible e-learning presentation creation.
8 diapositivas
Performance Tracking Using OKRs Presentation
Track success effectively with the Performance Tracking Using OKRs presentation. This sleek infinity loop design showcases key metrics across People, Products, and Processes, making it ideal for business performance reviews, goal alignment, and strategic planning. Fully editable and compatible with PowerPoint, Keynote, and Google Slides for seamless customization.


4 diapositivas
Professional Business Meeting Agenda Presentation
Efficiently structure your next corporate gathering with the "Professional Business Meeting Agenda" presentation template. Its geometrically appealing layout organizes discussion points in a visually captivating manner, encouraging effective communication and engagement. Perfect for strategizing sessions, this template ensures that every item on your agenda is highlighted with clarity. Compatible across PowerPoint, Keynote, and Google Slides, it’s designed to make every meeting more productive.


10 diapositivas
Corporate Law Slide Deck Presentation
Bring balance and clarity to your corporate presentations with this sleek, professional layout designed to simplify complex legal or business concepts. Ideal for illustrating compliance frameworks, policy comparisons, or decision-making strategies, it combines precision with visual appeal. Fully compatible with PowerPoint, Keynote, and Google Slides for effortless editing and customization.


6 diapositivas
5-Step Implementation for Business Growth Presentation
Present your strategic plan with clarity using the 5-Step Implementation for Business Growth Presentation. This horizontal arrow layout guides your audience through five key phases of execution—from planning to final results. Each step is clearly numbered and color-highlighted for visual flow. Fully editable in PowerPoint, Keynote, Google Slides, and Canva.


6 diapositivas
Business Triangle Model Presentation
Visualize the core components of business success with the Business Triangle Model template. This structured framework highlights three interconnected elements, making it ideal for strategic planning, risk assessment, and performance analysis. Customize it effortlessly to suit your needs. Compatible with PowerPoint, Keynote, and Google Slides for seamless integration.


20 diapositivas
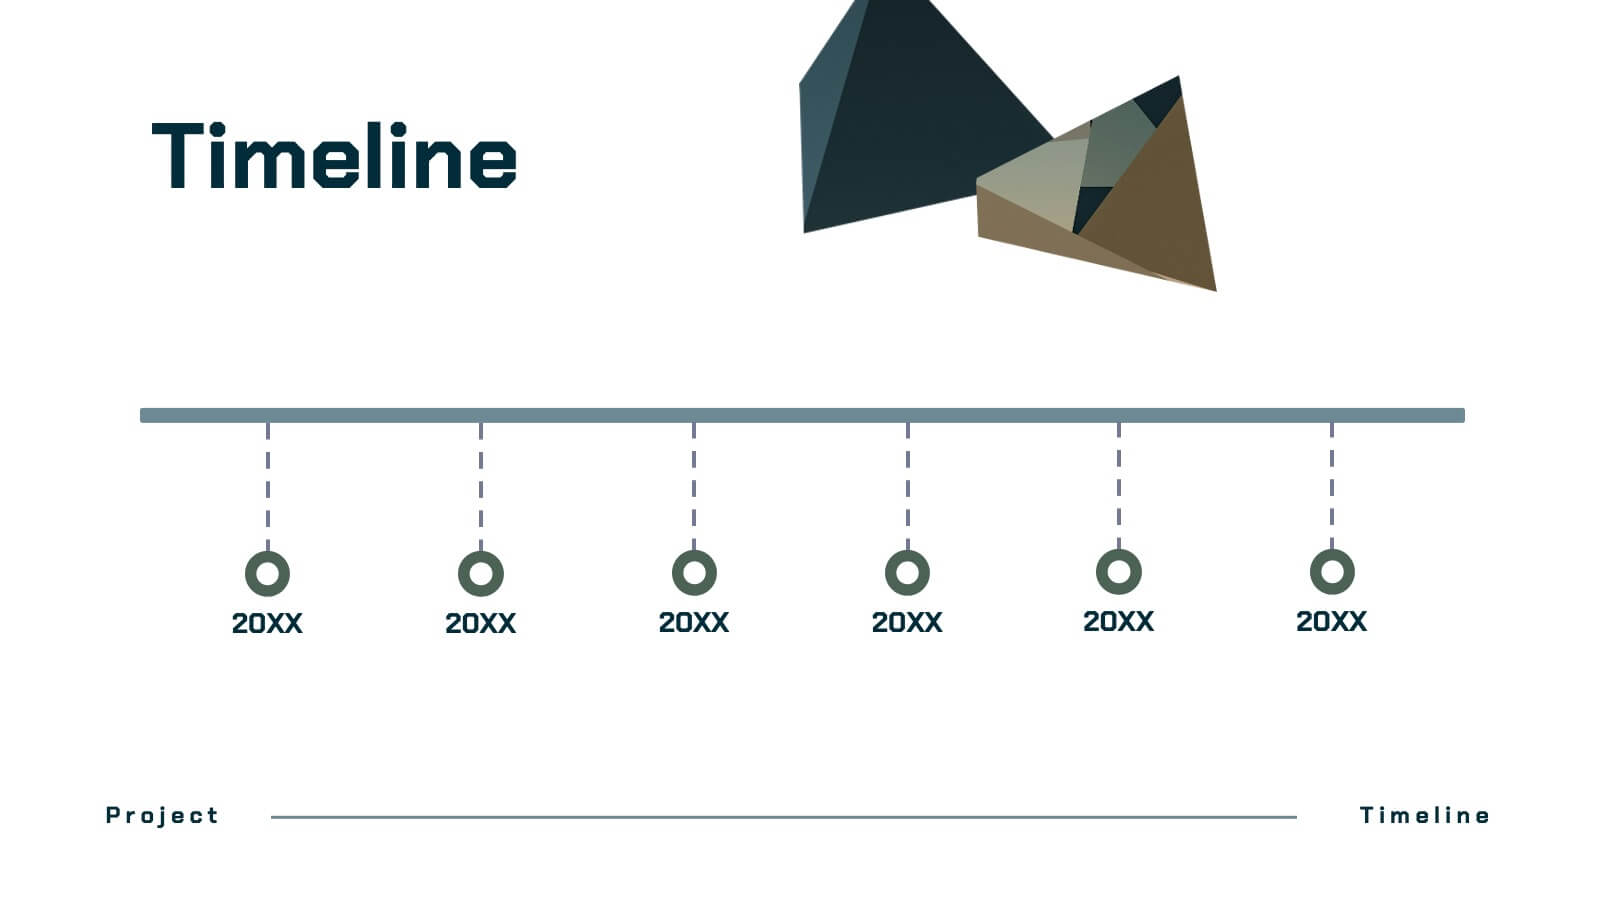
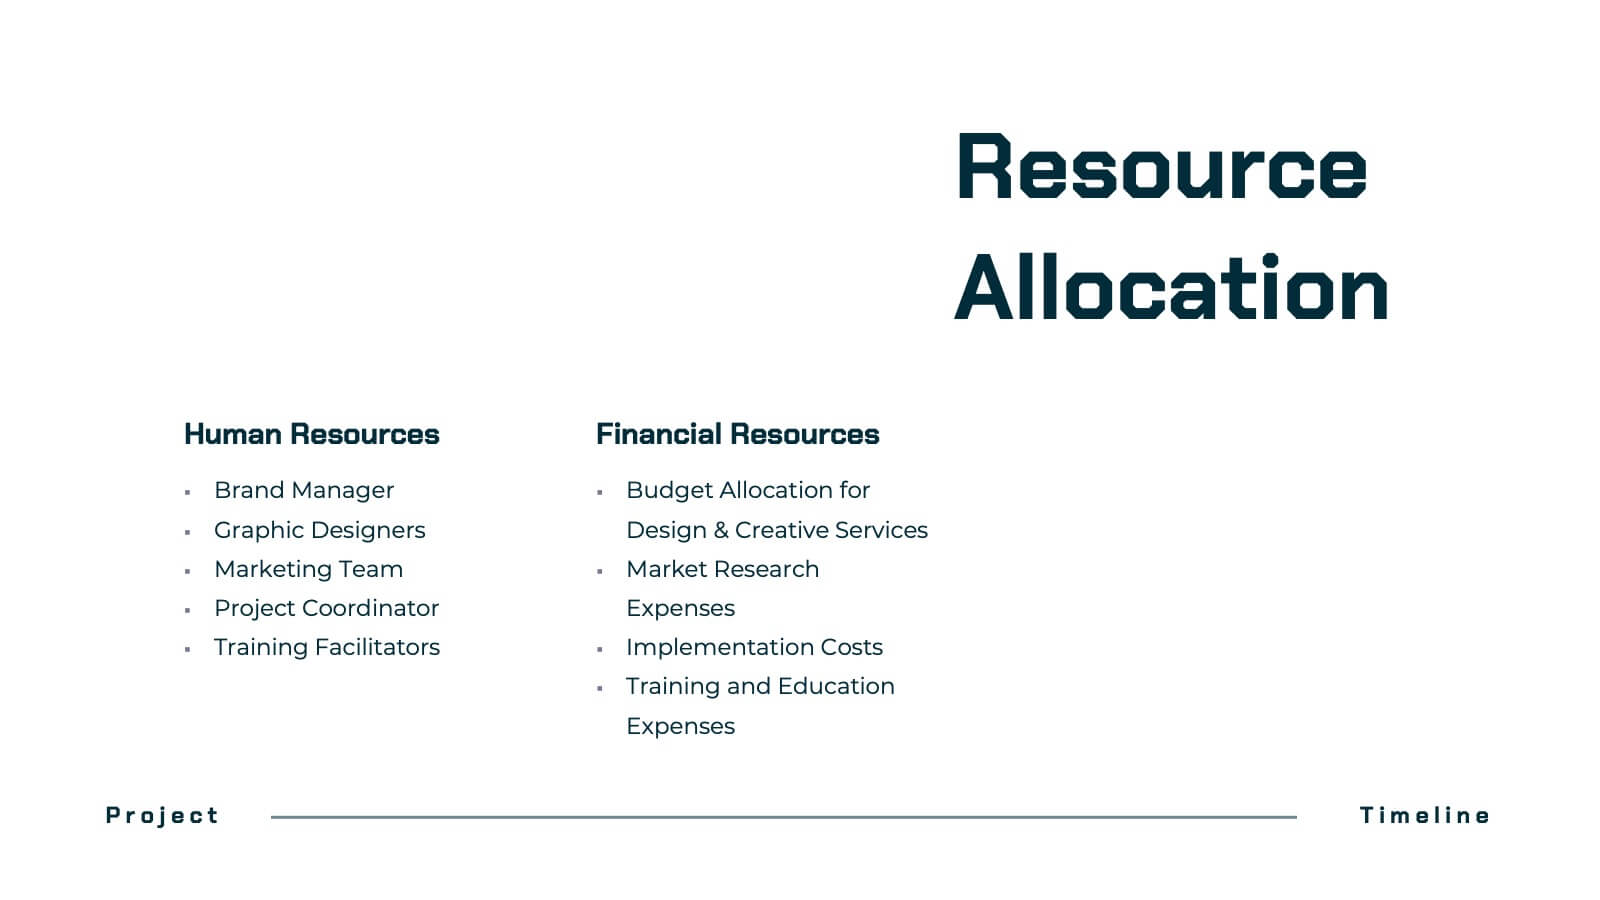
Dynastream Project Timeline Presentation
Stay on track with this detailed and well-organized project plan presentation designed for success! Covering essential areas like scope, objectives, timeline, budget breakdown, and risk management, it ensures every aspect of your project is clear and actionable. Perfect for team meetings or stakeholder updates, this template is fully compatible with PowerPoint, Keynote, and Google Slides.


8 diapositivas
Financial Year in Review Annual Report
Showcase your company’s financial performance with clarity using this Financial Year in Review Annual Report slide. Featuring a dynamic line graph, currency visuals, and segmented insights, this slide is perfect for summarizing revenue trends and year-end highlights. Fully customizable in PowerPoint, Keynote, and Google Slides.


4 diapositivas
Meetings Agenda Slide Presentation
Make every meeting feel purposeful with a clean layout that highlights topics, timing, and key discussion points effortlessly. This presentation helps teams stay aligned, organized, and ready to follow the flow of the session. Perfect for planning or reporting. Fully compatible with PowerPoint, Keynote, and Google Slides.