


Características


¿Tienes alguna pregunta?
Recomendar


4 diapositivas
Project Planning in Four Steps Presentation
Streamline your workflow with the Project Planning in Four Steps presentation. This structured slide layout simplifies task organization, milestone tracking, and goal-setting into a clear, four-step process. Perfect for business strategies, project management, and team collaboration. Fully customizable and compatible with PowerPoint, Keynote, and Google Slides for effortless integration.


20 diapositivas
Storynix New Product Proposal Presentation
This beautifully designed presentation template is your perfect tool to showcase a new product with style and professionalism. It covers everything from company overview and product features to pricing strategies and distribution plans, ensuring a comprehensive and persuasive pitch. Compatible with PowerPoint, Keynote, and Google Slides for seamless customization.


4 diapositivas
Artistic Watercolor Background Presentation
Add a creative flair to your slides with this Artistic Watercolor Background template. Featuring soft gradients and fluid brushstroke visuals, it's perfect for showcasing concepts in a stylish, modern way. Fully editable in PowerPoint, Keynote, and Google Slides—ideal for design-driven pitches, personal projects, or creative business storytelling.


5 diapositivas
TAM SAM SOM Markets Analysis Presentation
Turn complex market insights into clear, visual storytelling with this dynamic layered presentation. Ideal for demonstrating market potential, target segments, and opportunity scope, it helps you communicate data with structure and impact. Fully compatible with PowerPoint, Keynote, and Google Slides for effortless editing and professional, presentation-ready results.


5 diapositivas
Editable Concentric Circle Layout Presentation
Give your message a bold, modern spin with a sleek layered design that draws the eye straight to your core idea. This presentation is perfect for breaking down processes, stages, or insights using clean, concentric structure that feels intuitive and polished. Fully compatible with PowerPoint, Keynote, and Google Slides.


7 diapositivas
Bubble Map Diagram Presentation
A Bubble Map Infographic is a visual representation that uses bubbles to convey information. It is used to display geographic data, such as population density, sales figures, or distribution of resources. In this template the size of the bubbles represents the value of the data being presented, with larger bubbles indicating a higher value. The color of the bubbles may also be used to indicate different categories or levels of the data. This infographic can be customized with different colors, fonts, graphics, text boxes, charts, and other visual aids to suit all your needs.


10 diapositivas
Risk Management in Insurance
Visualize your insurance risk strategies with this engaging umbrella-themed presentation. Designed to illustrate layered risk coverage or multi-step assessments, this slide set is ideal for analysts, agents, or consultants. Each section is clearly numbered and color-coded for easy understanding. Fully editable in PowerPoint, Keynote, and Google Slides.


21 diapositivas
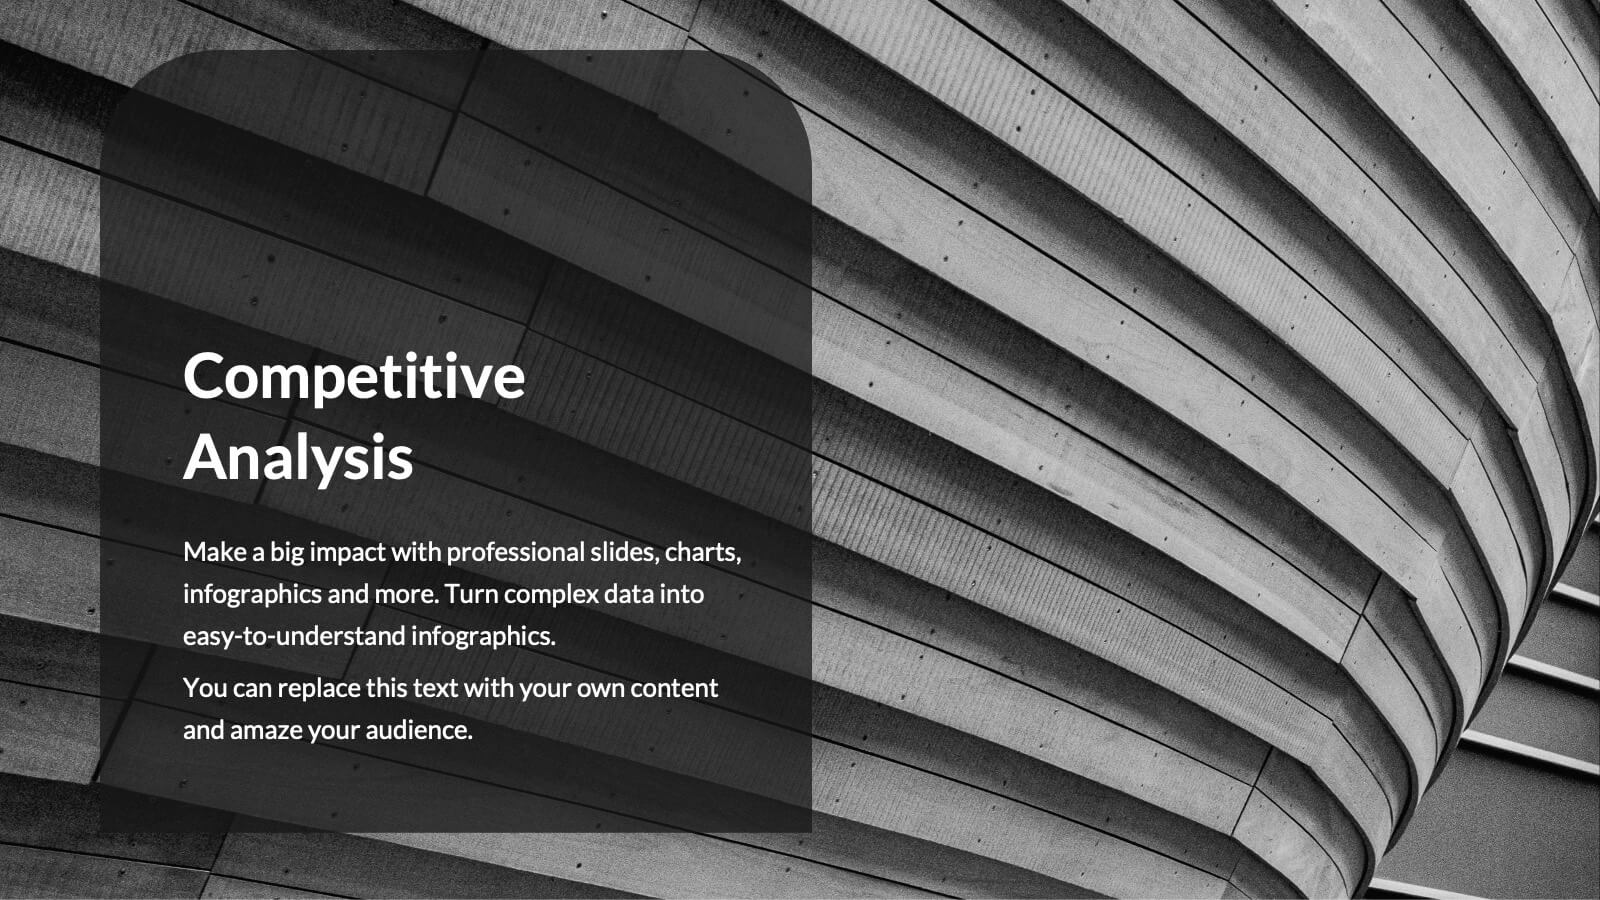
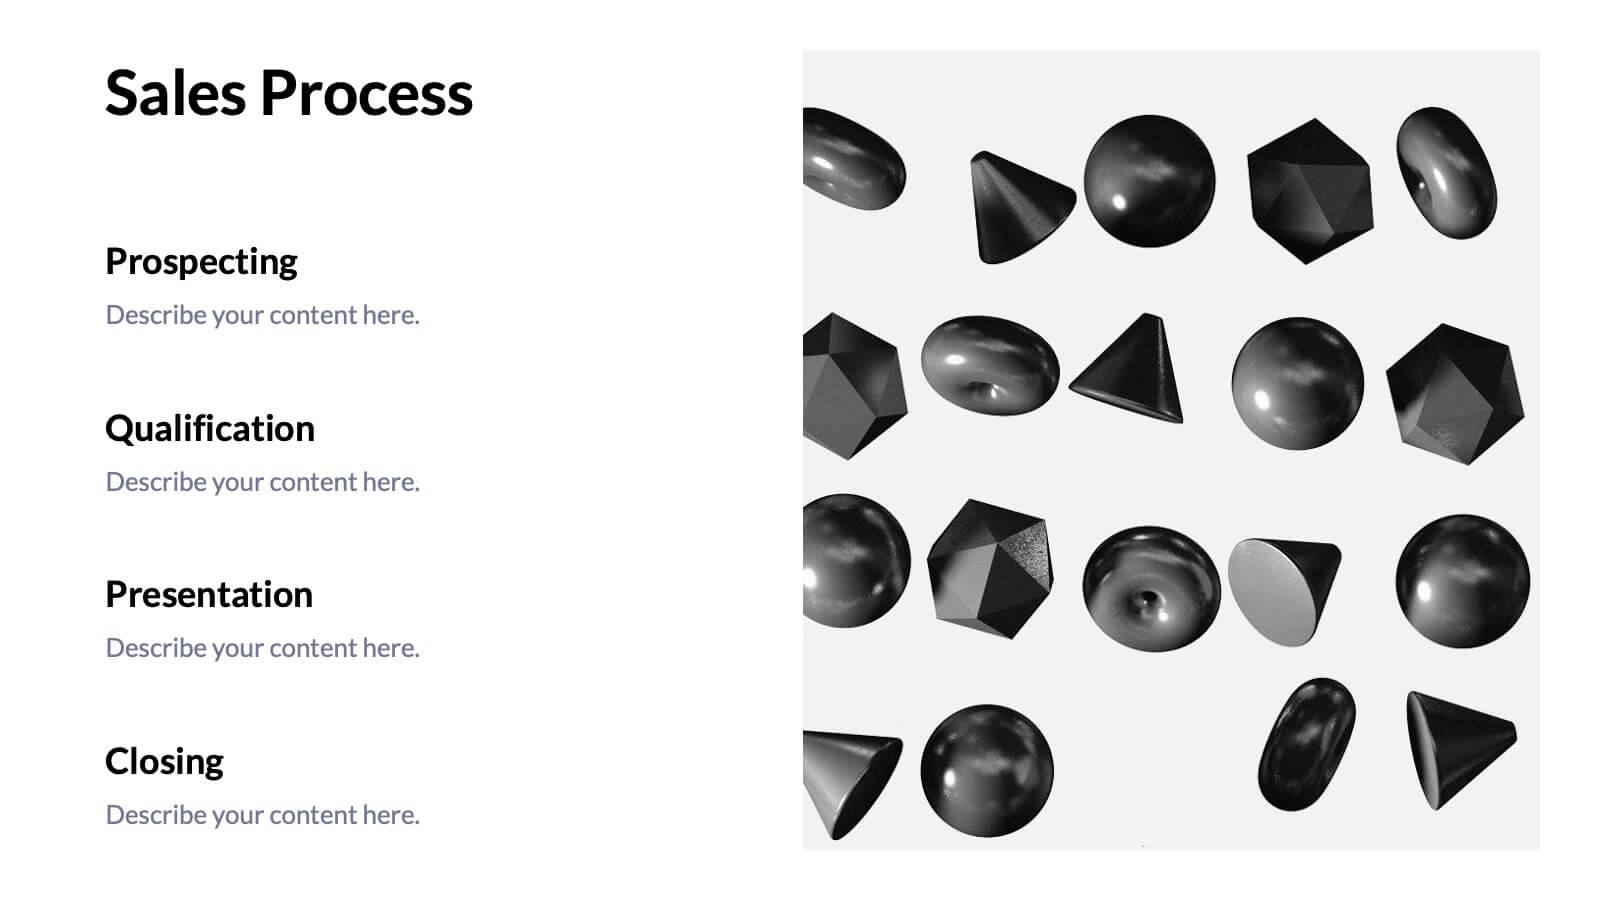
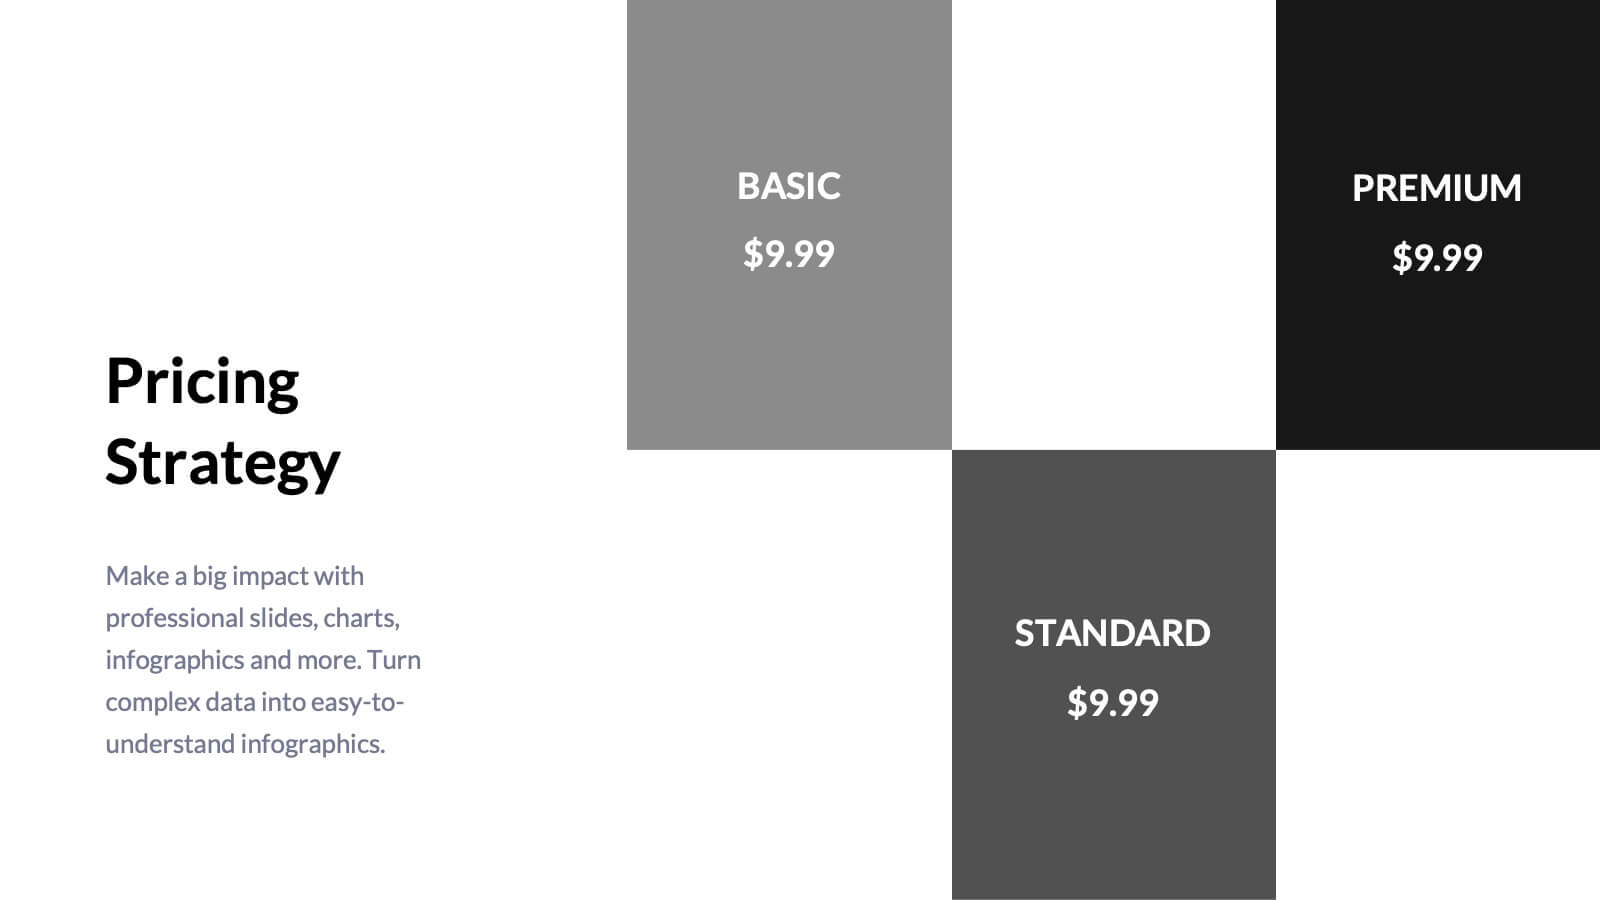
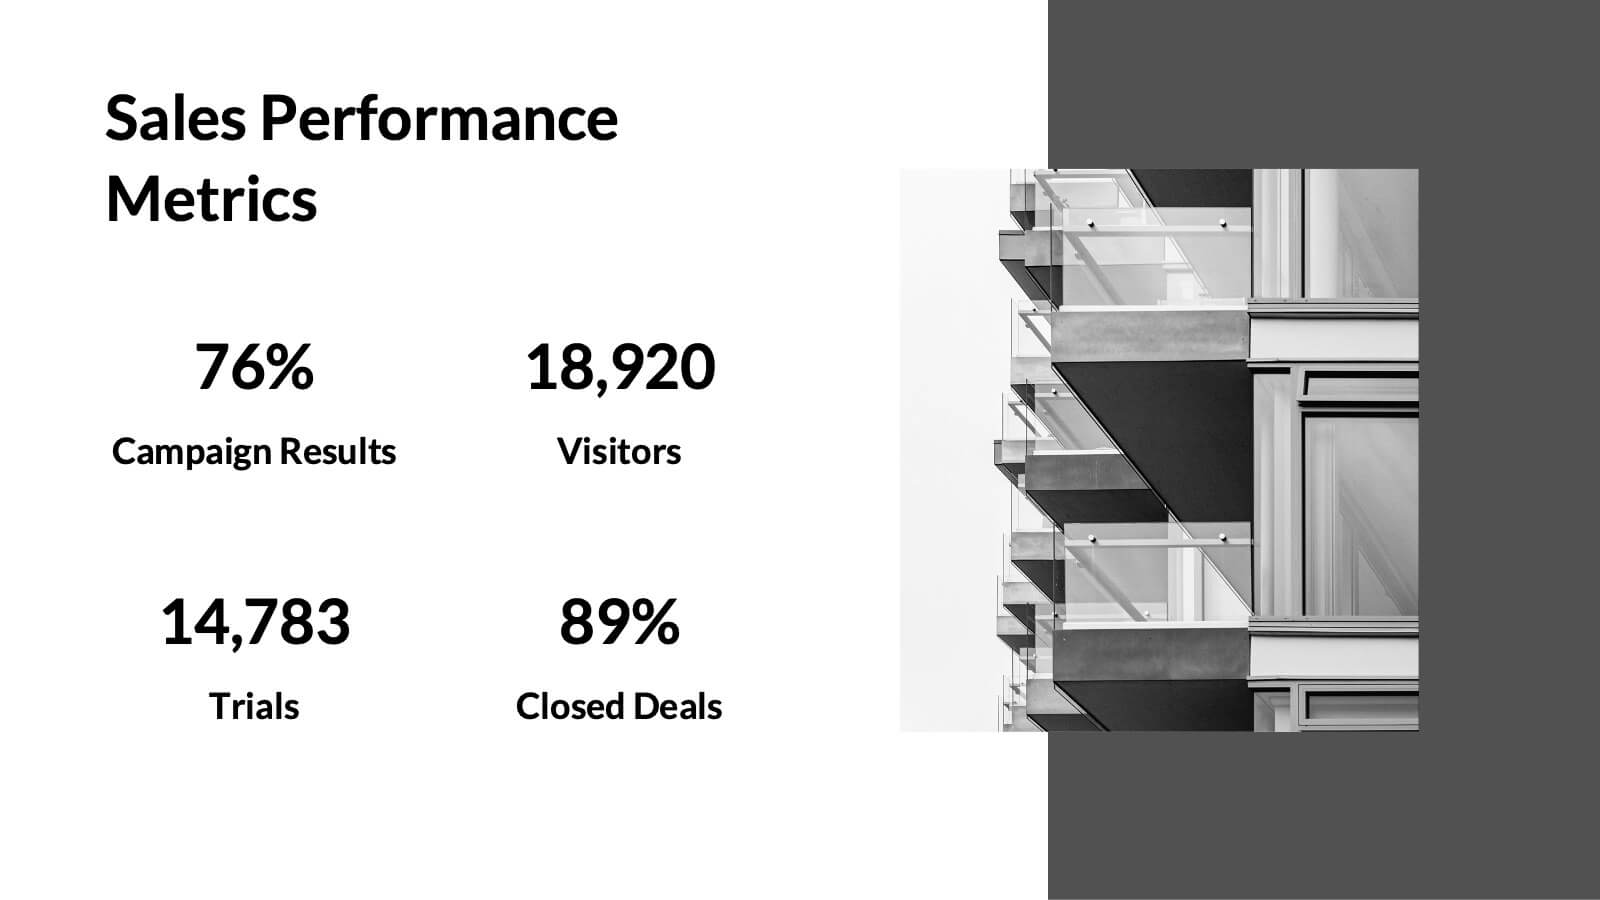
Tempest Sales Performance Report Presentation
Supercharge your sales presentations with this sleek, professional template. Perfect for outlining sales objectives, processes, and performance metrics, it features a clean, minimalist design that enhances clarity and impact. Highlight key elements like competitive analysis, pricing strategy, and future opportunities to captivate your audience. Compatible with PowerPoint, Keynote, and Google Slides, it ensures seamless presentations on any platform.


5 diapositivas
Strategic Matrix Grid Analysis Presentation
Clarify your strategic insights with the Strategic Matrix Grid Analysis Presentation. This layout uses a 2x2 quadrant design to showcase four key categories or scenarios—ideal for SWOT, risk vs. reward, product positioning, or capability mapping. Clean labels, icons, and text areas help break down each quadrant’s significance. Fully editable in PowerPoint, Google Slides, Keynote, and Canva.


6 diapositivas
Business Model Hexagon Infographic Presentation
Break down complex strategies with the Business Model Hexagon Infographic Presentation. This sleek, six-part hexagonal layout is perfect for illustrating interconnected components like operations, value propositions, and customer segments. Fully editable and easy to customize in PowerPoint, Keynote, or Google Slides—ideal for startups, consultants, and corporate teams.


3 diapositivas
Market Size and Scaling Insights Presentation
Understand your market potential with the Market Size and Scaling Insights Diagram. This visually engaging template helps you analyze market segments, growth trends, and scaling opportunities with clarity. Ideal for business strategists, analysts, and investors, this slide ensures a concise and professional presentation of key market data. Fully customizable and compatible with PowerPoint, Keynote, and Google Slides.


4 diapositivas
Illustrated Office Environment Templates Presentation
Bring your data to life with a fun, illustrated spin! This presentation template uses vibrant office-themed visuals to explain workplace stats, tasks, or organizational breakdowns with clarity. Perfect for showcasing team roles, resource allocation, or workflow insights. Fully compatible with PowerPoint, Keynote, and Google Slides for seamless customization.


6 diapositivas
Market Share Analysis Pie Chart
Clearly communicate competitive positioning with this market share pie chart layout. Ideal for showcasing data segments such as revenue splits, customer base percentages, or geographic market distribution. Each pie chart highlights a distinct insight, with editable text and values. Compatible with PowerPoint, Keynote, and Google Slides.


10 diapositivas
Depth-Based Visual Charts in 3D Presentation
Elevate your data storytelling with the Depth-Based Visual Charts in 3D Presentation. This slide set transforms layered information into eye-catching 3D stack visuals—perfect for showcasing rankings, workflows, or strategic hierarchies. Fully editable in PowerPoint, Keynote, and Google Slides for seamless customization.


20 diapositivas
Nightshade Design Portfolio Presentation
The Design Portfolio Presentation Template offers 20 slides to showcase your creative work, including design briefs, elements, processes, and feedback. Perfect for professionals to highlight projects with a modern, vibrant layout. Fully editable and compatible with PowerPoint, Keynote, and Google Slides.


8 diapositivas
Strategic Planning Gap Assessment Presentation
Bridge the gap in your strategic planning with this visually compelling Strategic Planning Gap Assessment presentation template. Designed to highlight key challenges and solutions, this template helps you outline critical gaps, assess risks, and develop actionable strategies. Ideal for business leaders, consultants, and project managers, this fully customizable template is compatible with PowerPoint, Keynote, and Google Slides.


10 diapositivas
Business Data Charts Presentation
Visualize insights with precision using this Business Data Charts Presentation Template. Featuring clean, colorful doughnut charts and clearly labeled segments, it’s ideal for showcasing survey results, KPI breakdowns, or performance metrics. Designed for professionals who want sleek data visuals, and fully customizable in PowerPoint, Keynote, and Google Slides.