


Características


¿Tienes alguna pregunta?
Recomendar


6 diapositivas
Corporate Training Program Presentation
Build excitement from day one with a sleek and modern visual! This presentation template is ideal for outlining your professional development plans, onboarding paths, or internal training milestones in a structured, step-by-step format. Fully editable and designed to impress, it works seamlessly with PowerPoint, Keynote, and Google Slides.
5 diapositivas
Team Achievements and Output Tracking Presentation
Celebrate success and monitor progress with the Team Achievements and Output Tracking presentation template. Designed with visual medal icons and color-coded team figures, this layout is perfect for highlighting milestones, recognizing contributors, and tracking output performance. Fully editable and compatible with PowerPoint, Keynote, and Google Slides.


4 diapositivas
Objectives and Key Results Overview Presentation
Set your goals, define success, and visualize progress with a sleek, easy-to-follow layout that connects objectives to measurable outcomes. Ideal for business strategy, team performance, or quarterly reviews, this presentation keeps your message clear and professional. Fully compatible with PowerPoint, Keynote, and Google Slides for effortless editing.


7 diapositivas
Balance Sheet and Profit Overview Presentation
Give your financial summary a clean, modern look with the Balance Sheet and Profit Overview Presentation. This slide offers a dual-column layout with icons and space for six key financial metrics or business insights—ideal for summarizing assets, liabilities, profits, and more. Easily editable in Canva, PowerPoint, and Google Slides.


4 diapositivas
Surface vs Depth Model Iceberg Presentation
Uncover the unseen with this Surface vs Depth Model Iceberg presentation. Designed to highlight the contrast between visible factors (15%) and underlying elements (85%), this layout is ideal for business analysis, user behavior, or strategic planning. Fully editable in Canva, PowerPoint, and Google Slides for seamless customization.


6 diapositivas
Real Estate Classes Infographic
Real estate classes are educational programs or courses that provide individuals with the knowledge and skills needed to succeed in the real estate industry. This infographic template provides an overview of different types of real estate classes and what real estate is. This is designed to help individuals interested in the real estate industry understand the various educational opportunities available to them. Help your audience make informed decisions about their educational journey in the real estate field. Fully customizable and compatible with Powerpoint, Keynote, and Google Slides.


21 diapositivas
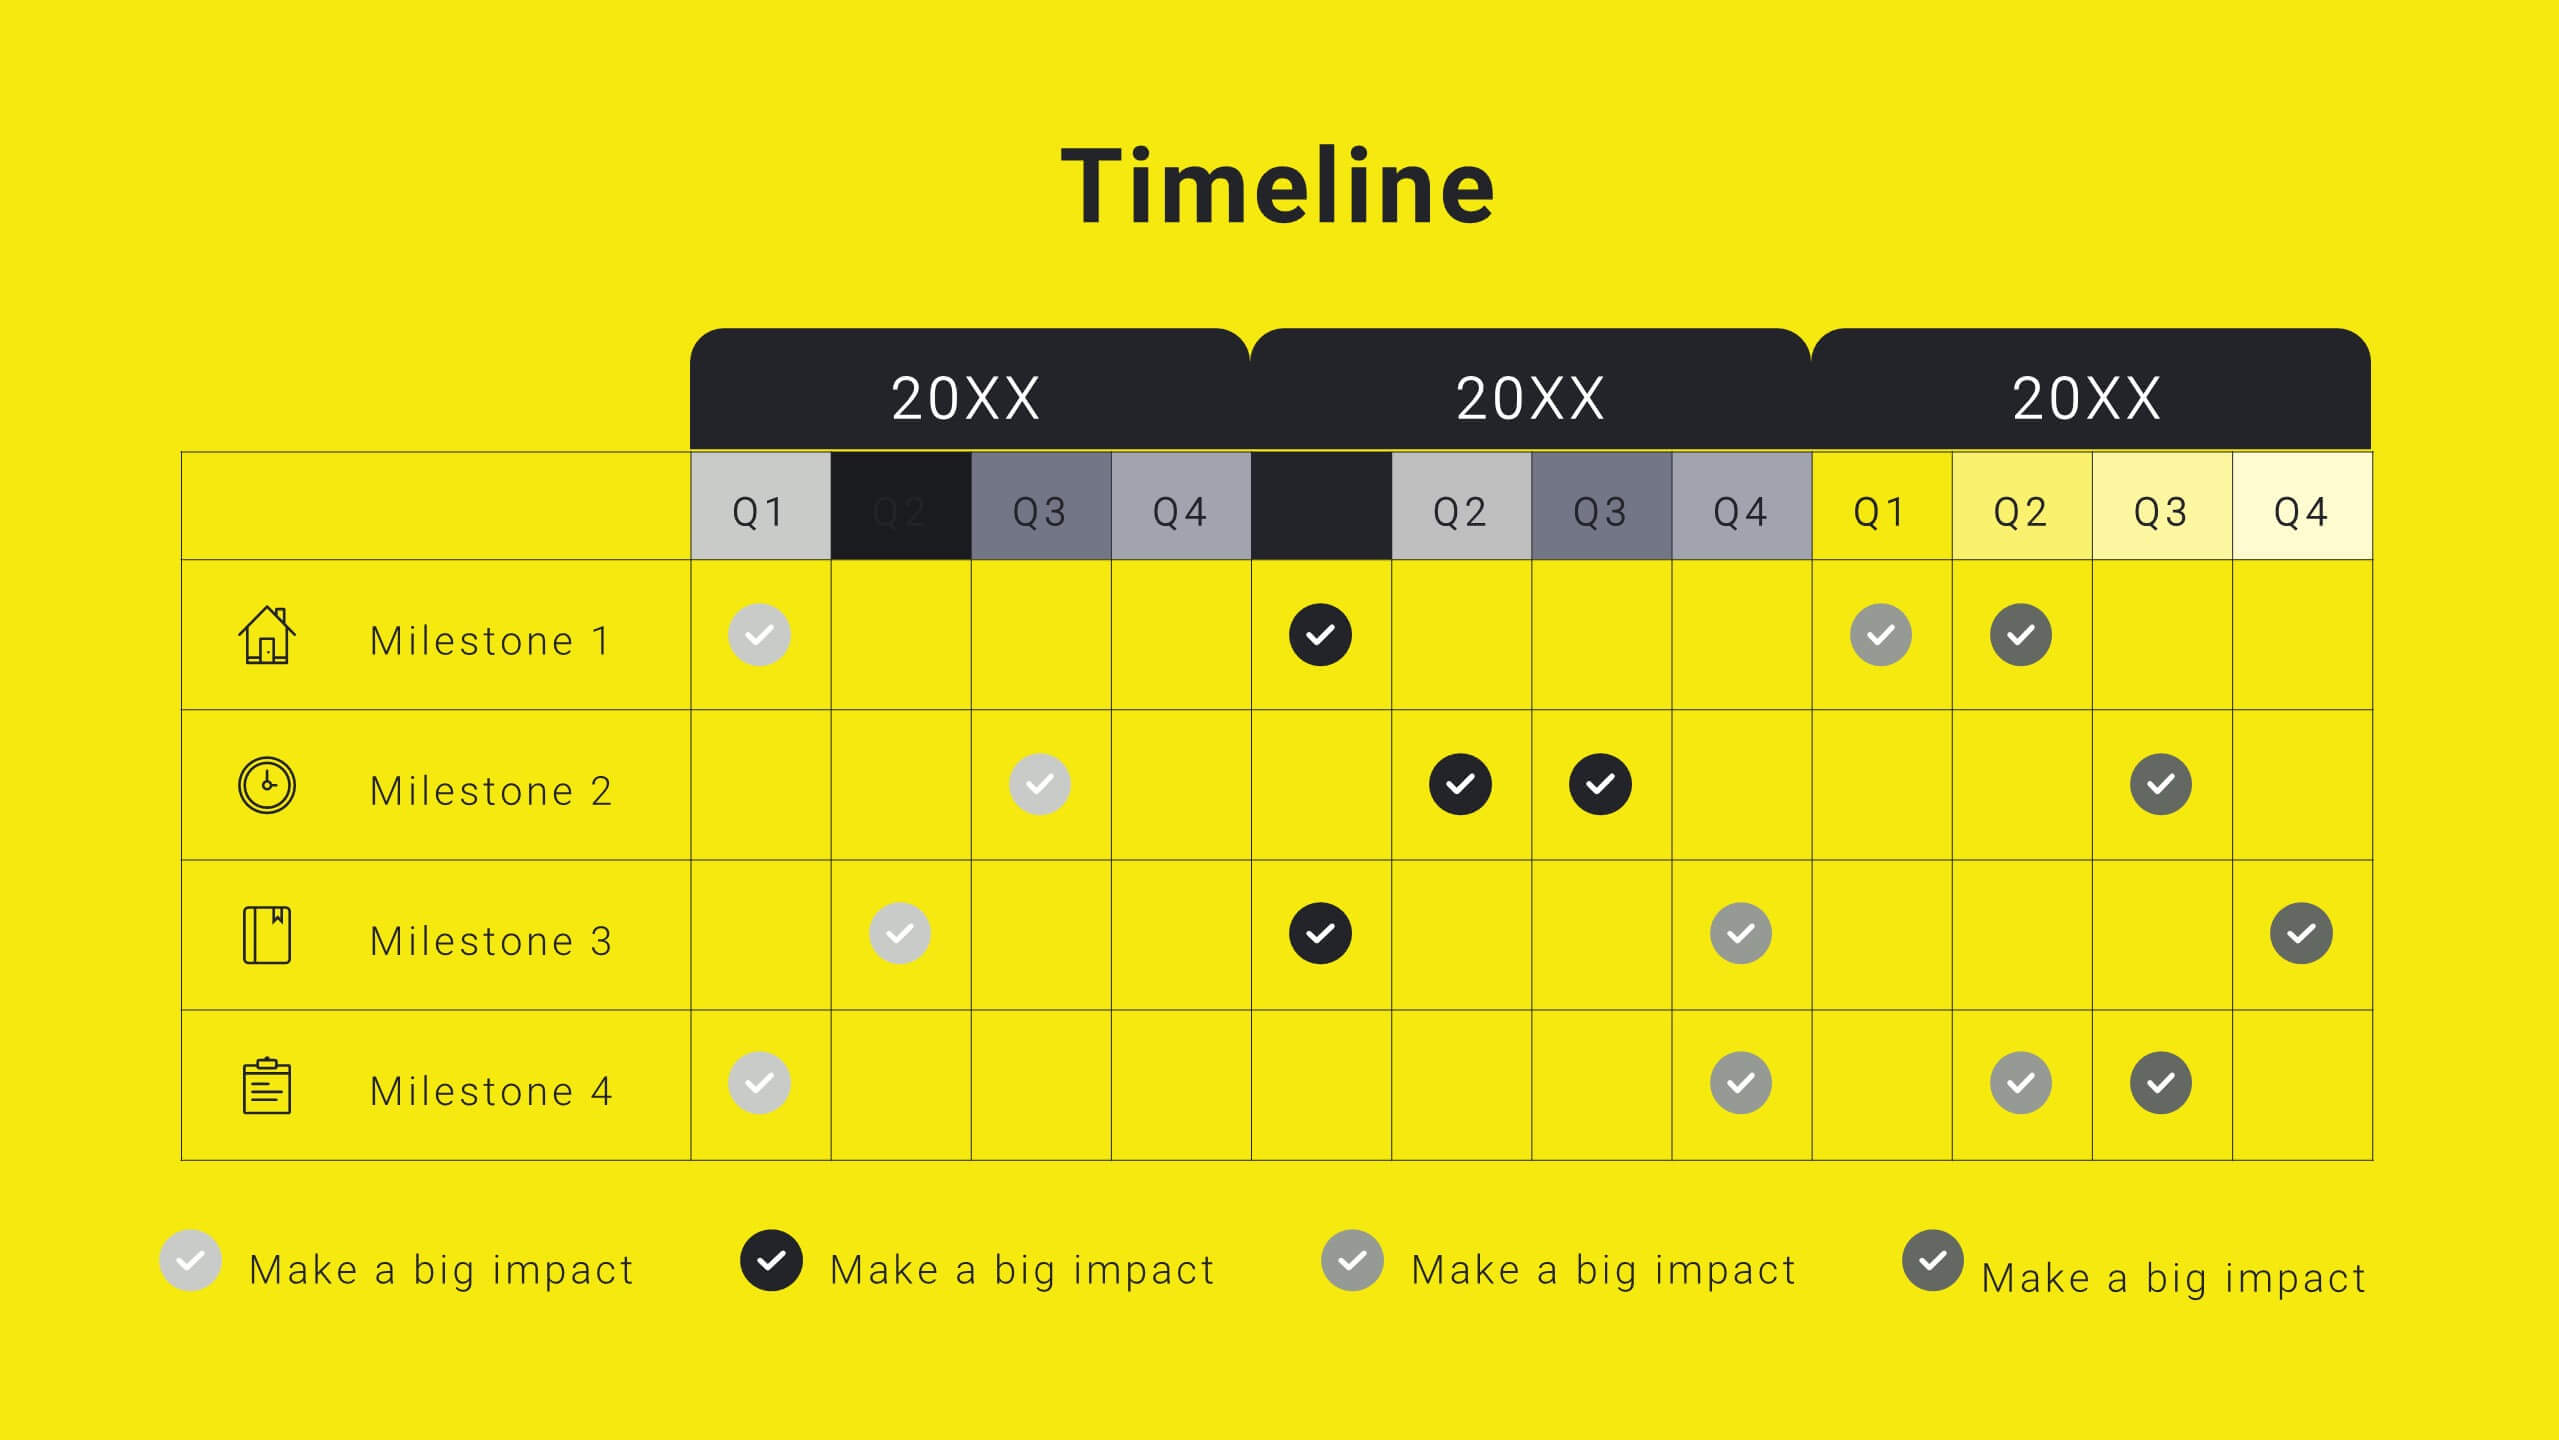
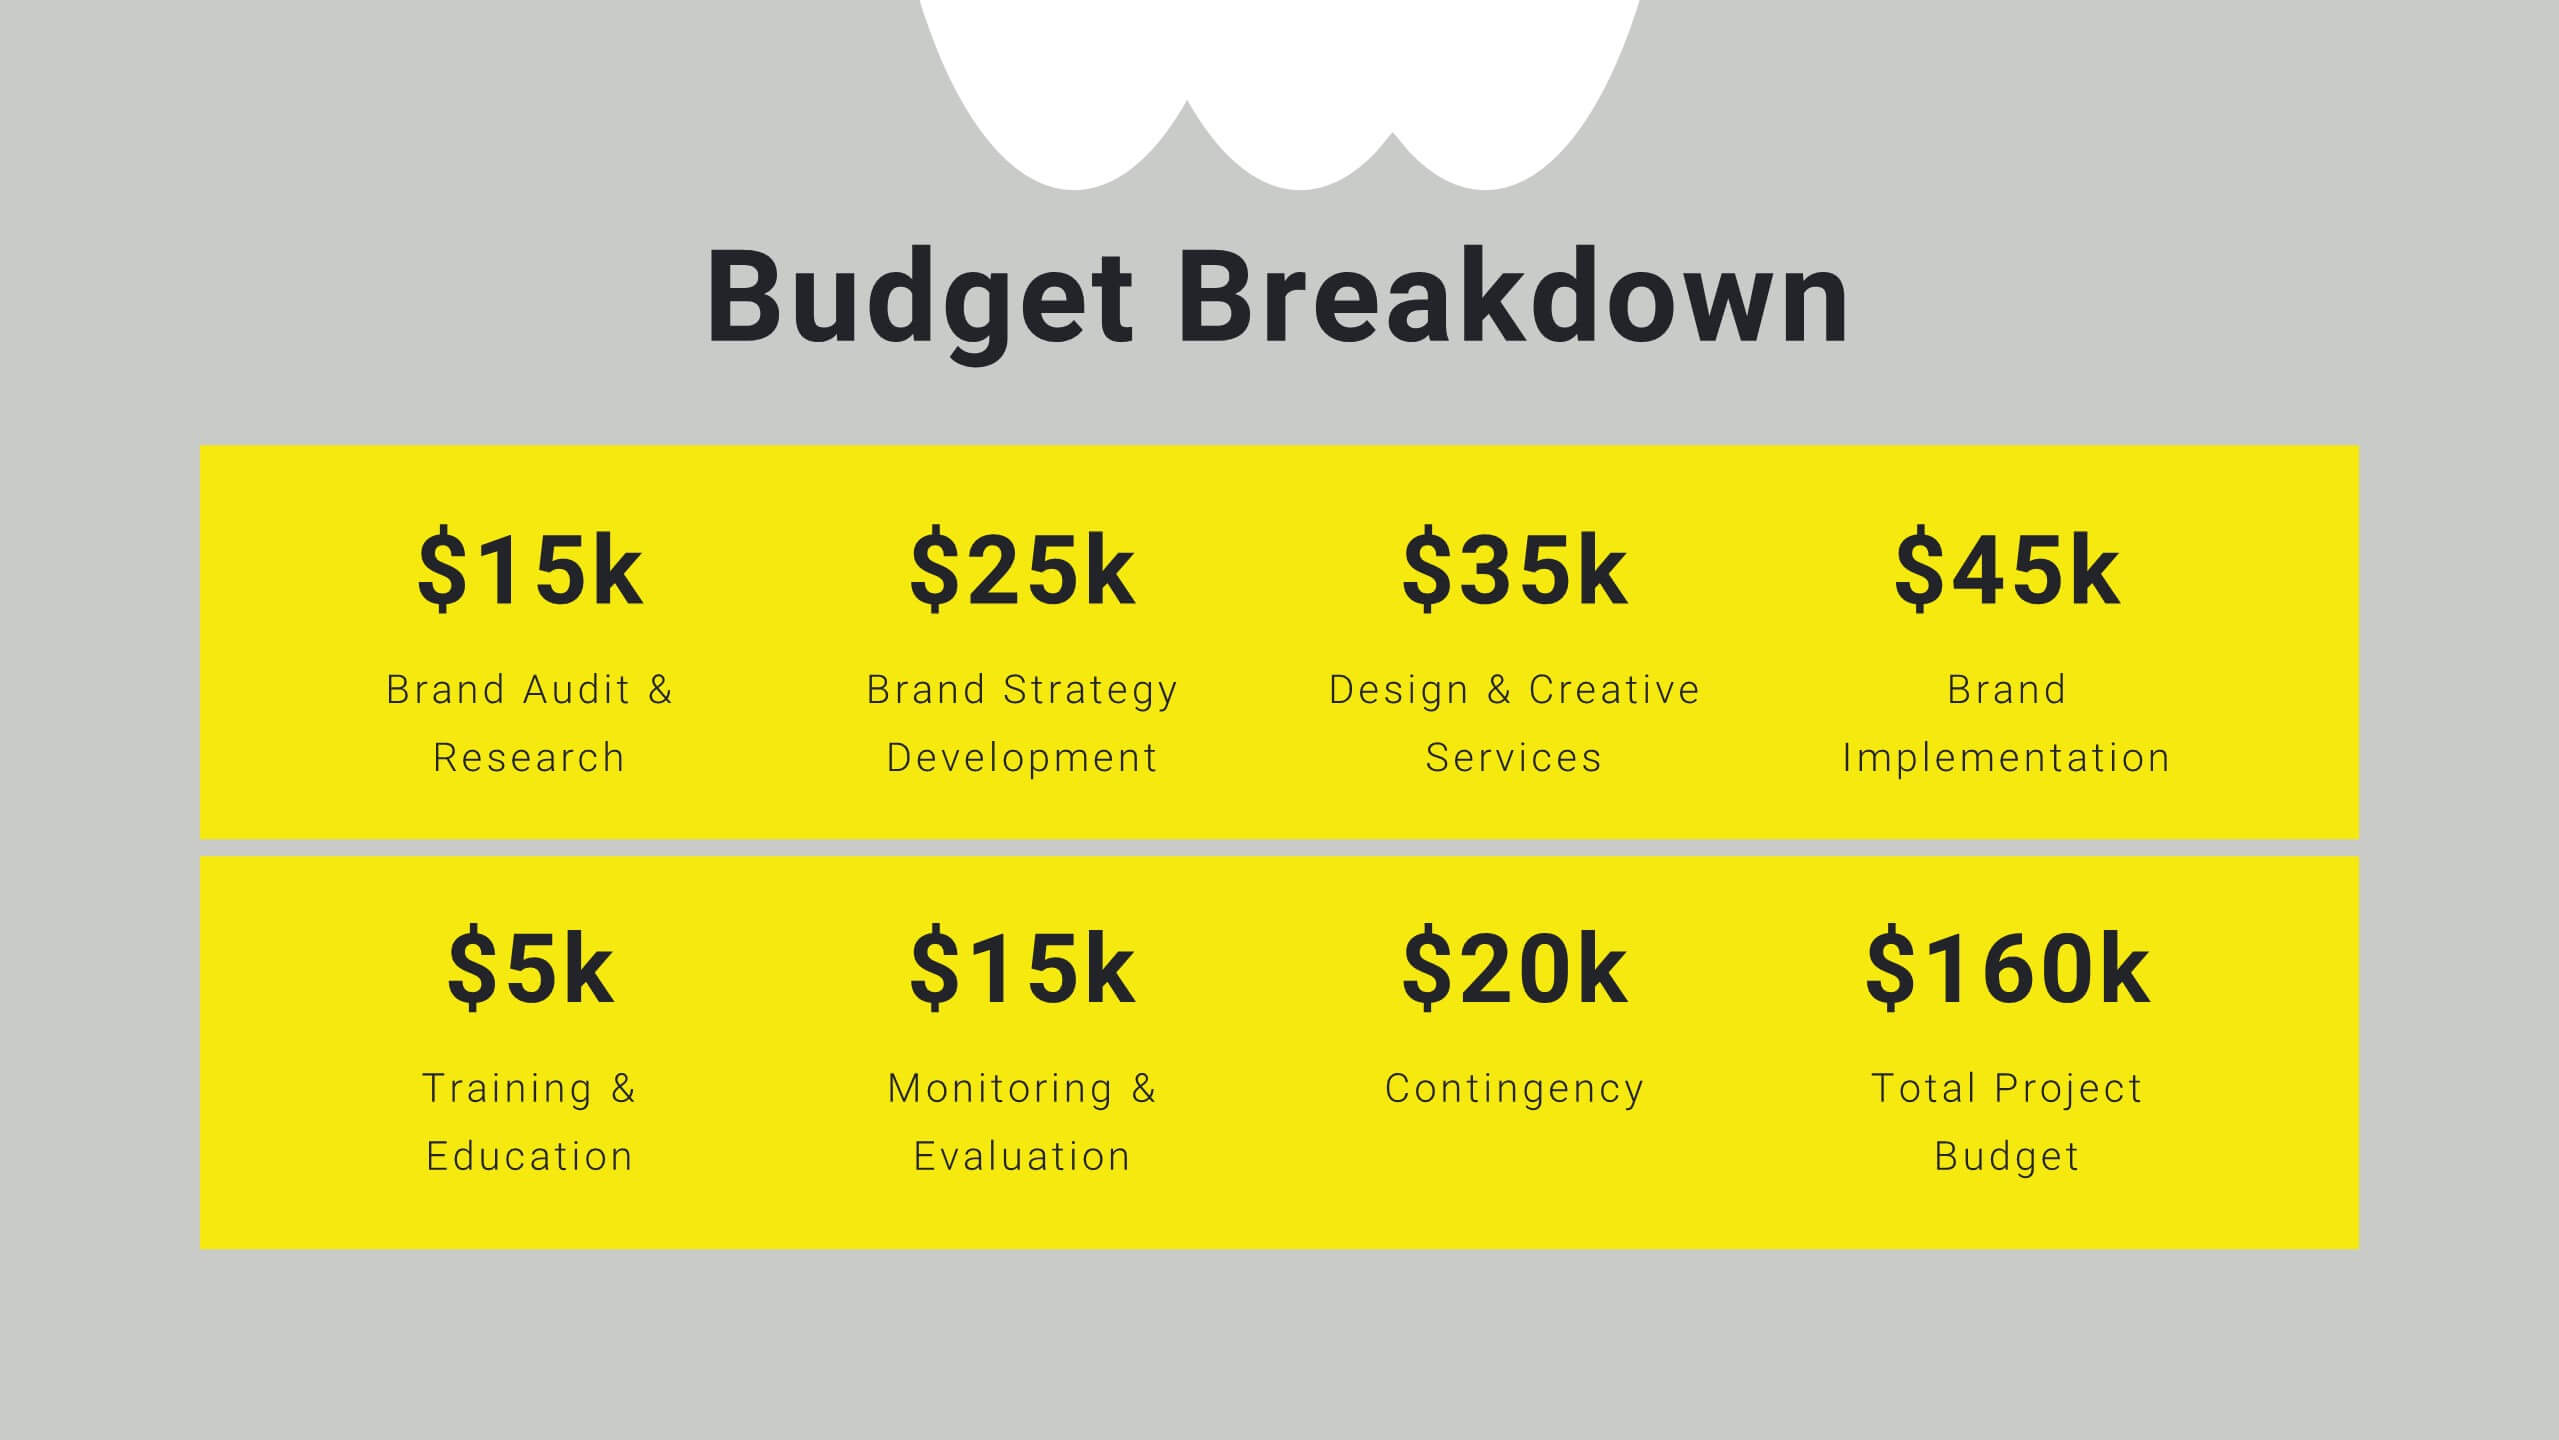
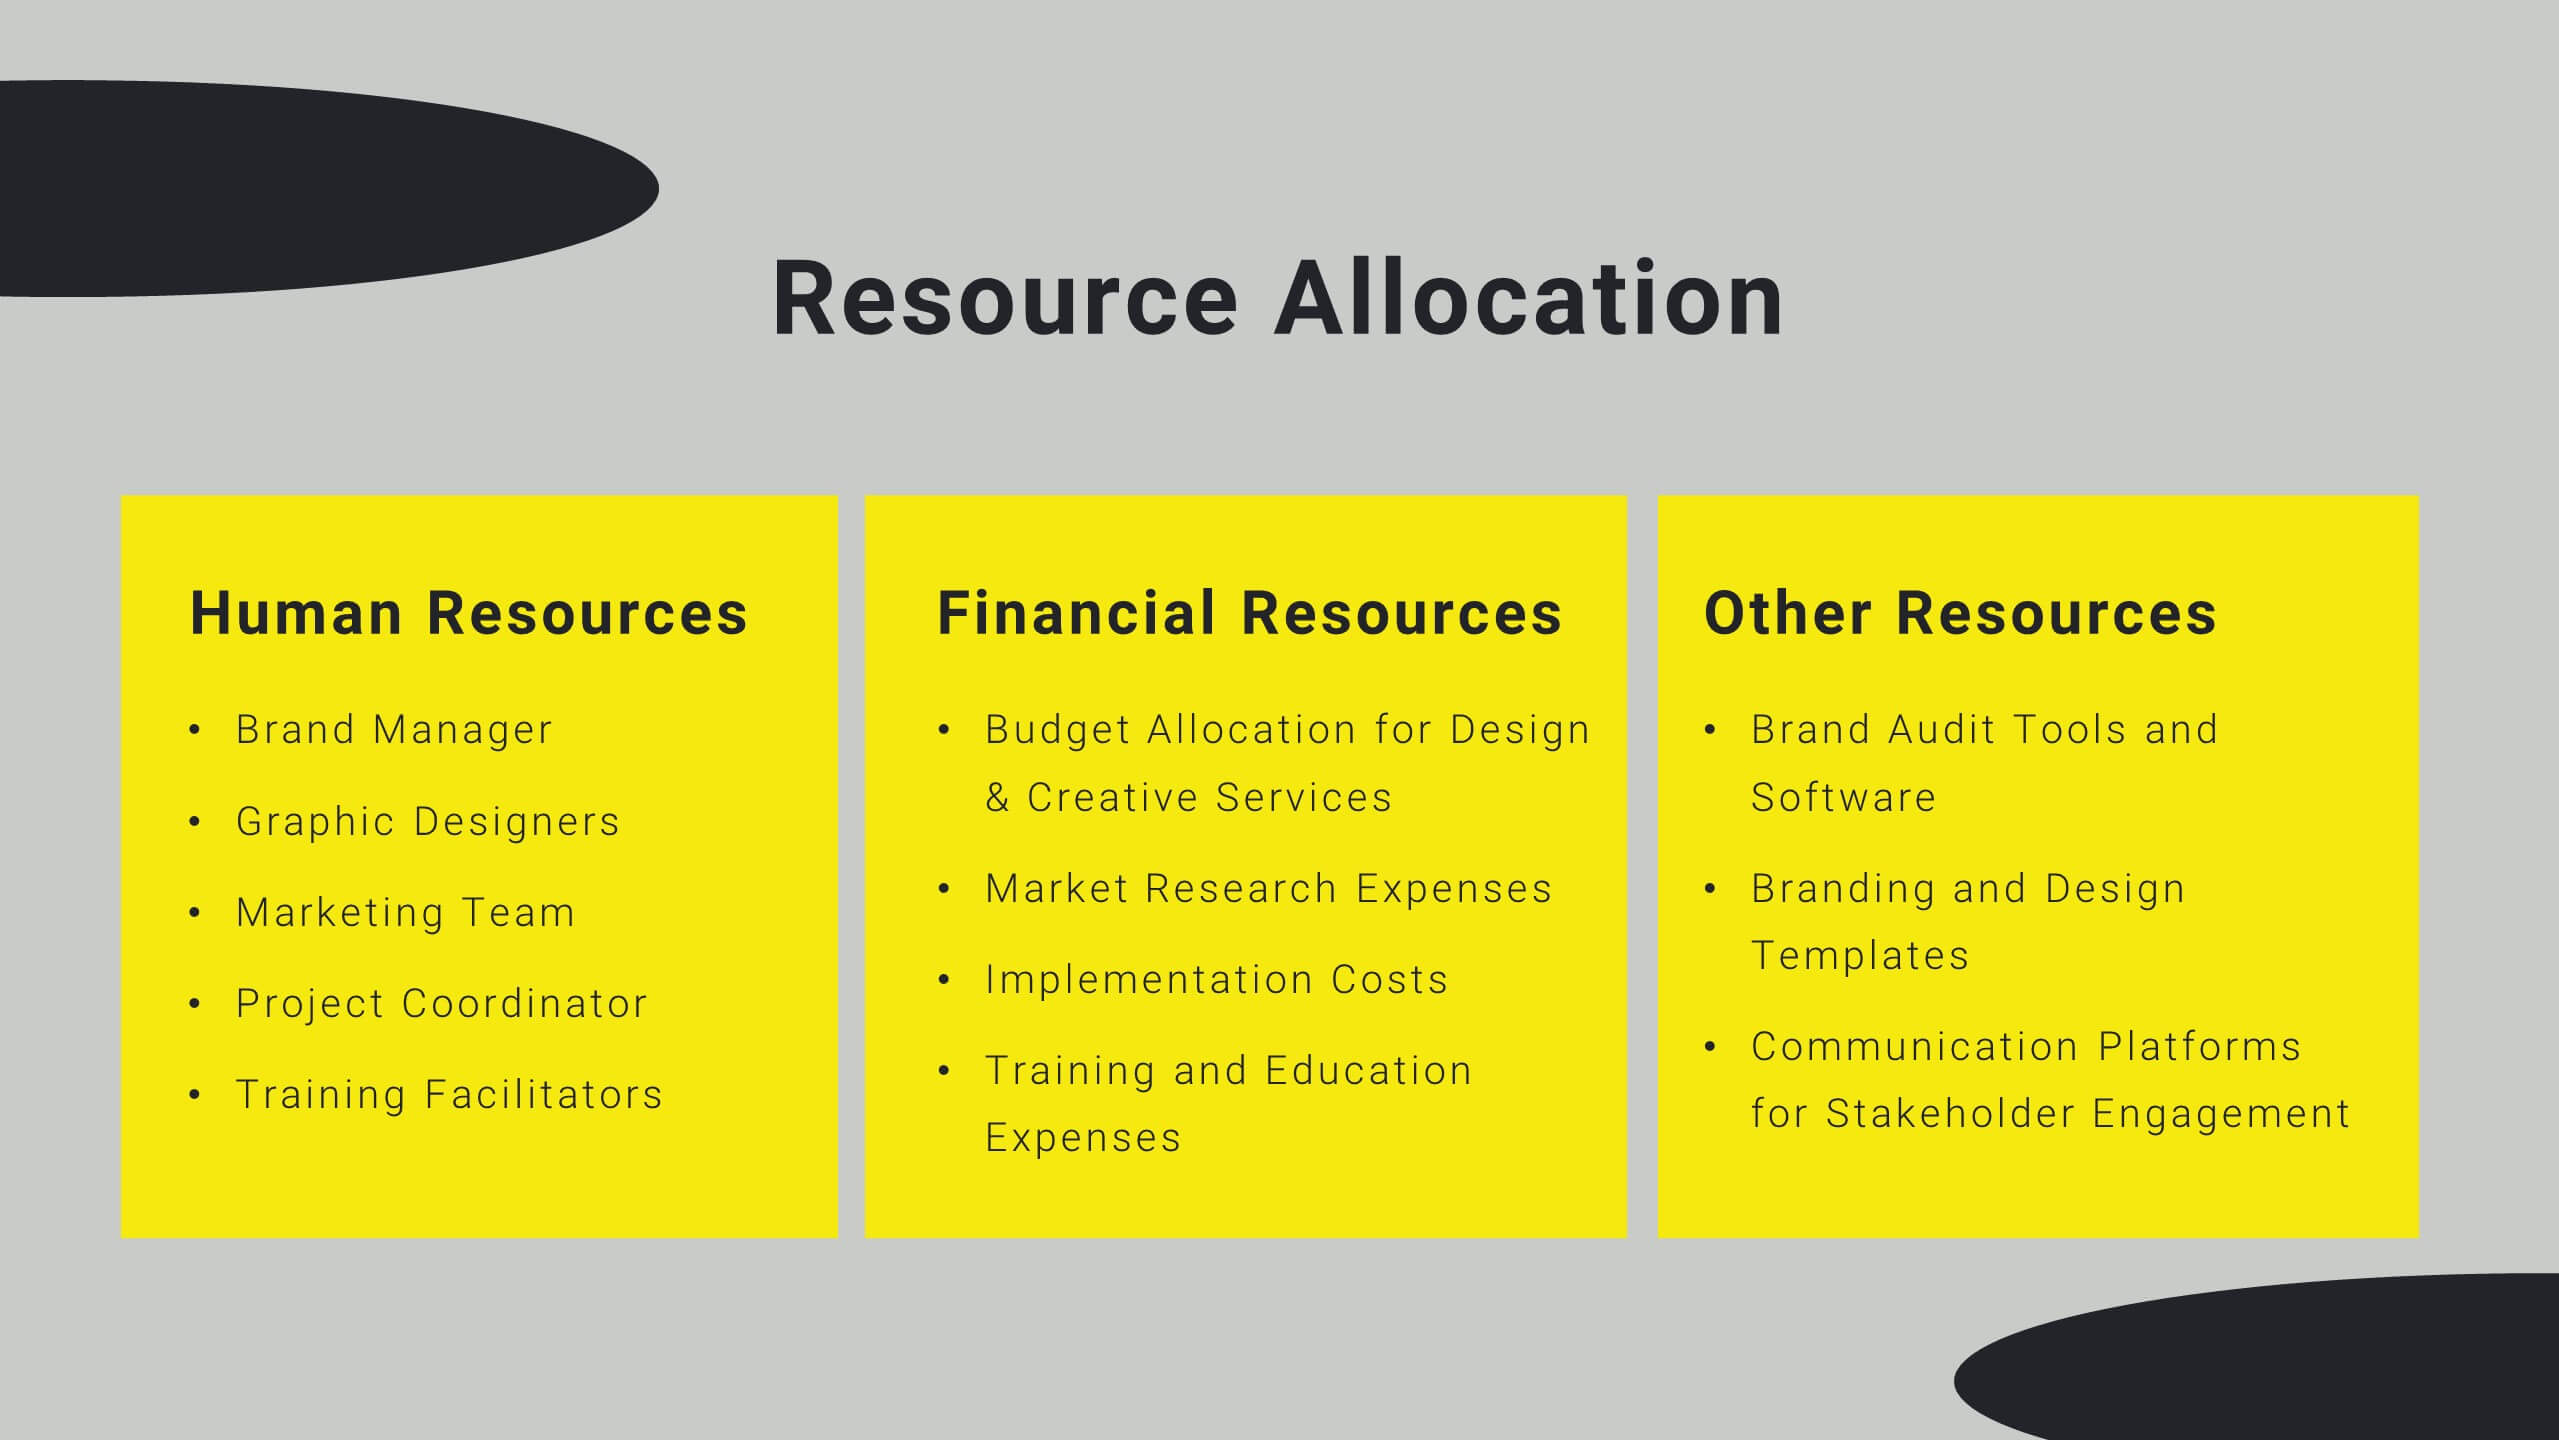
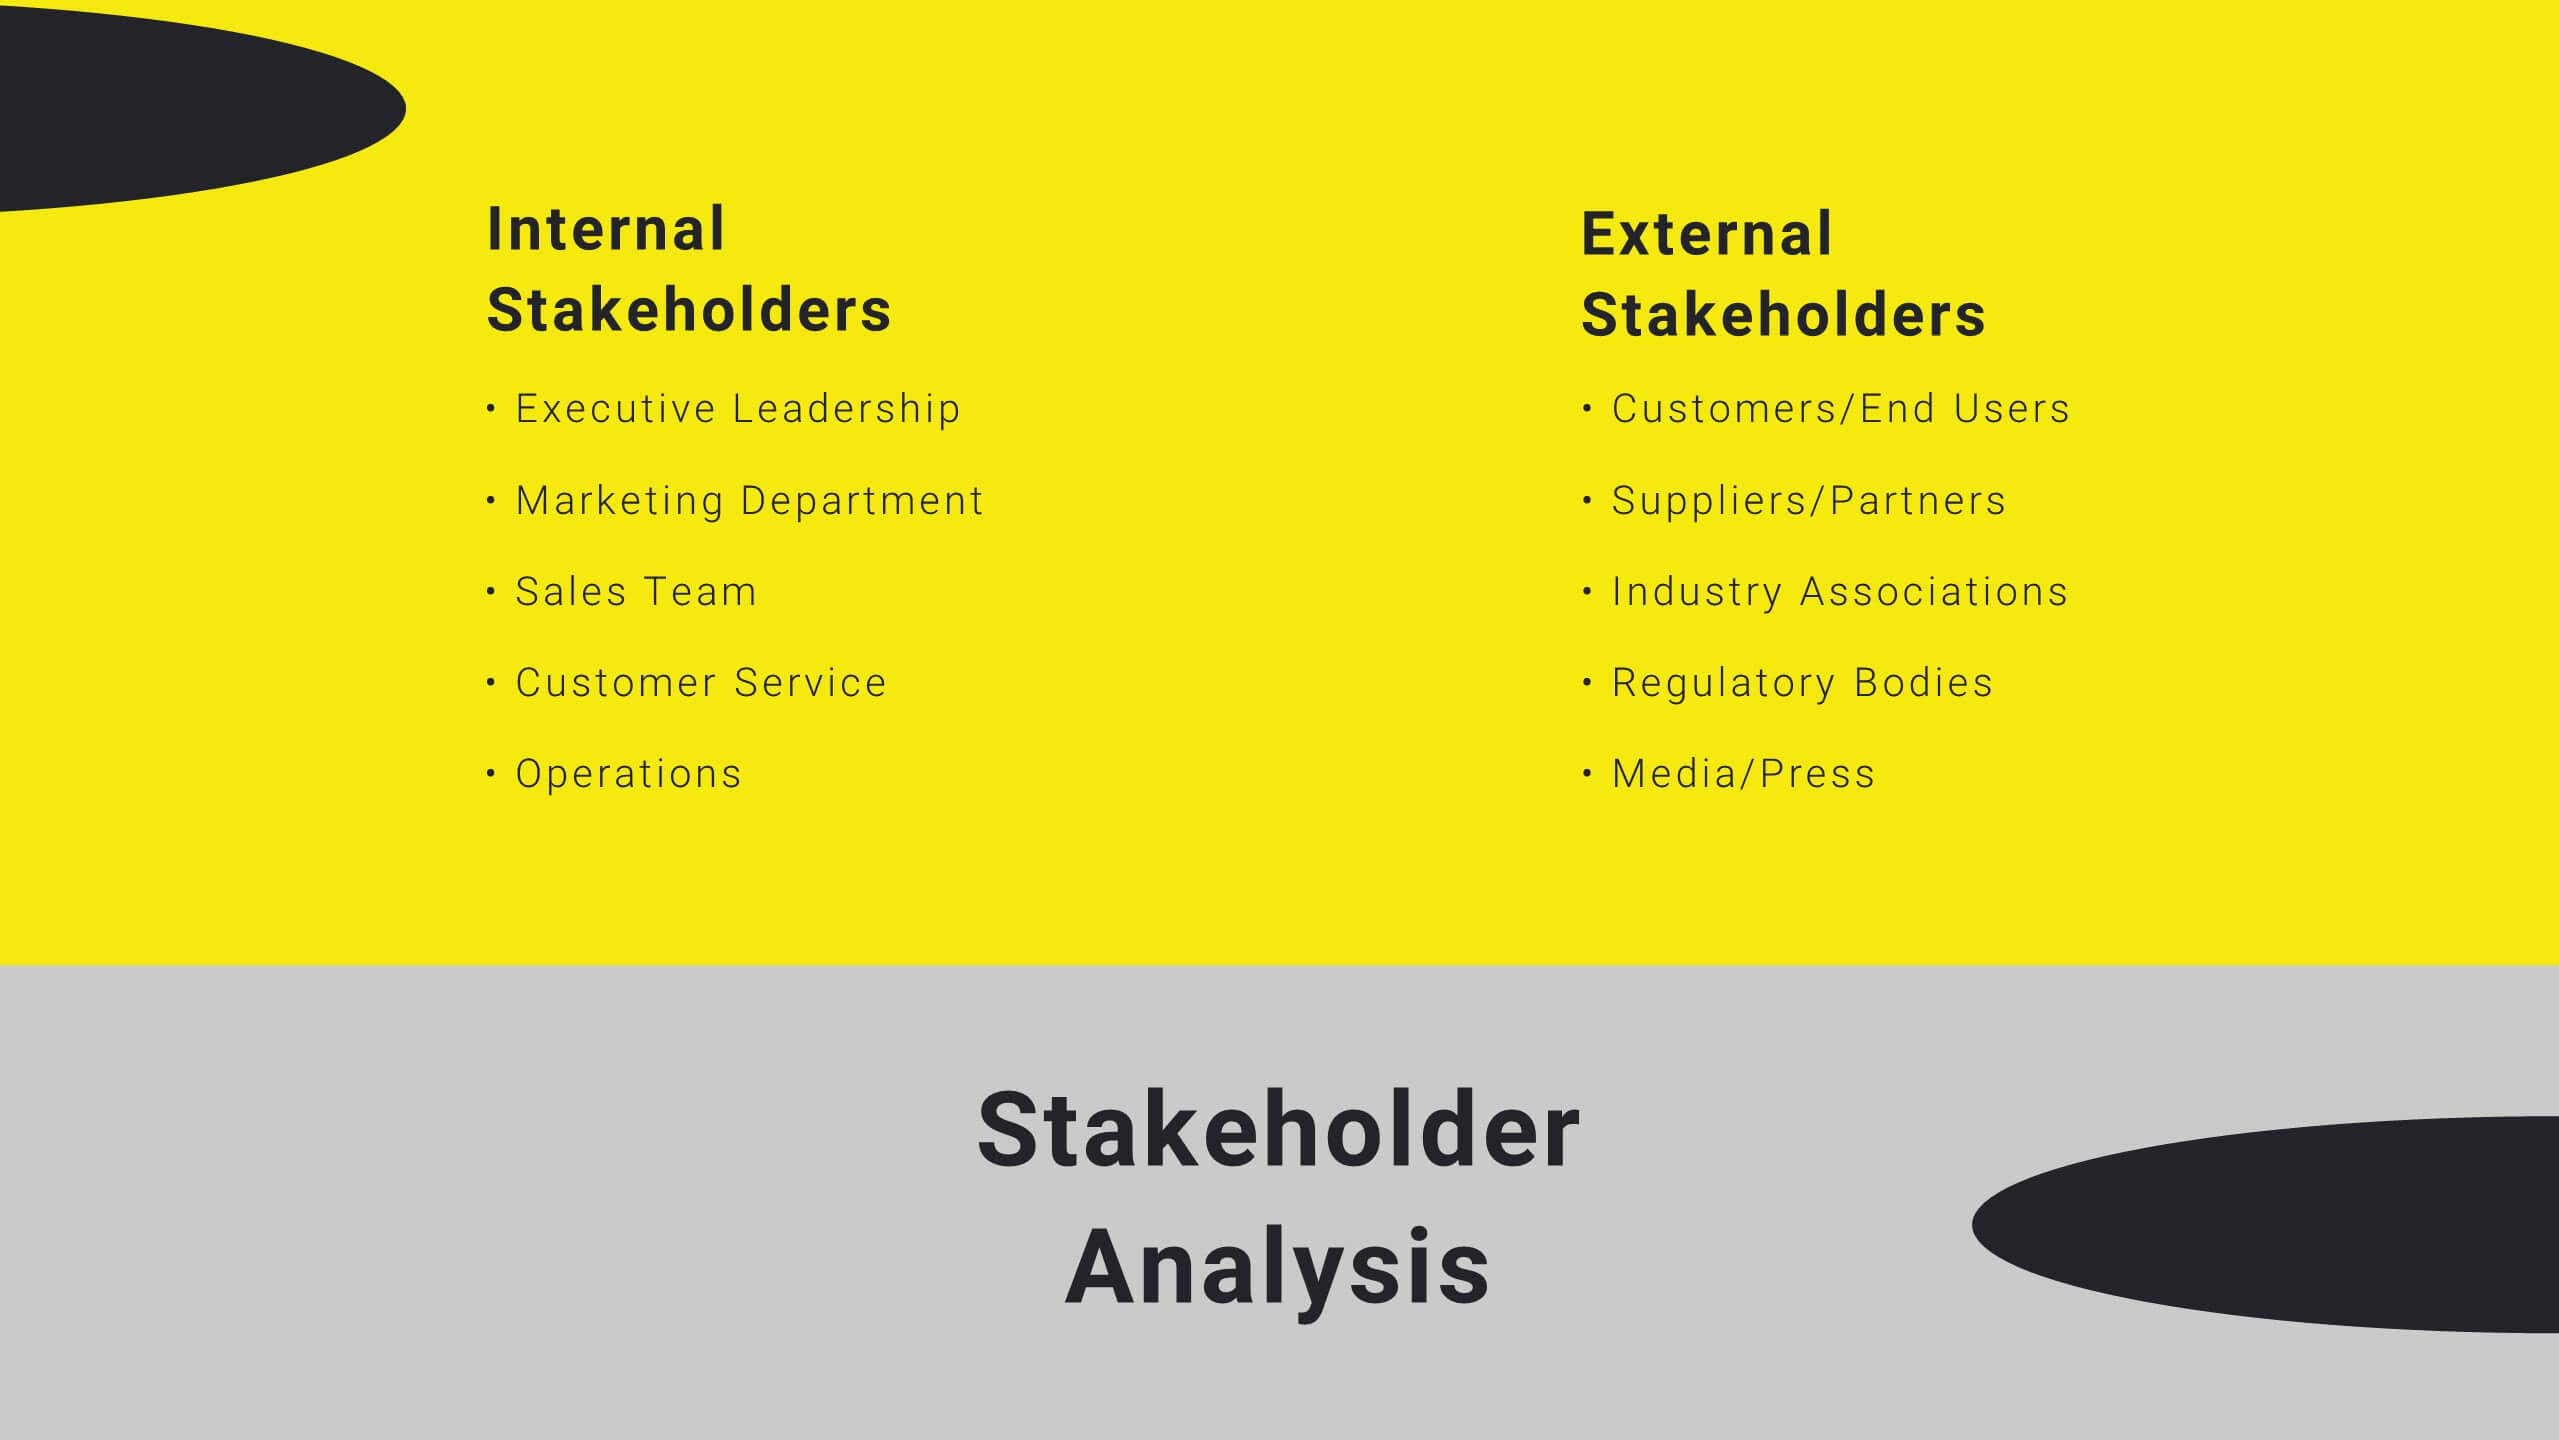
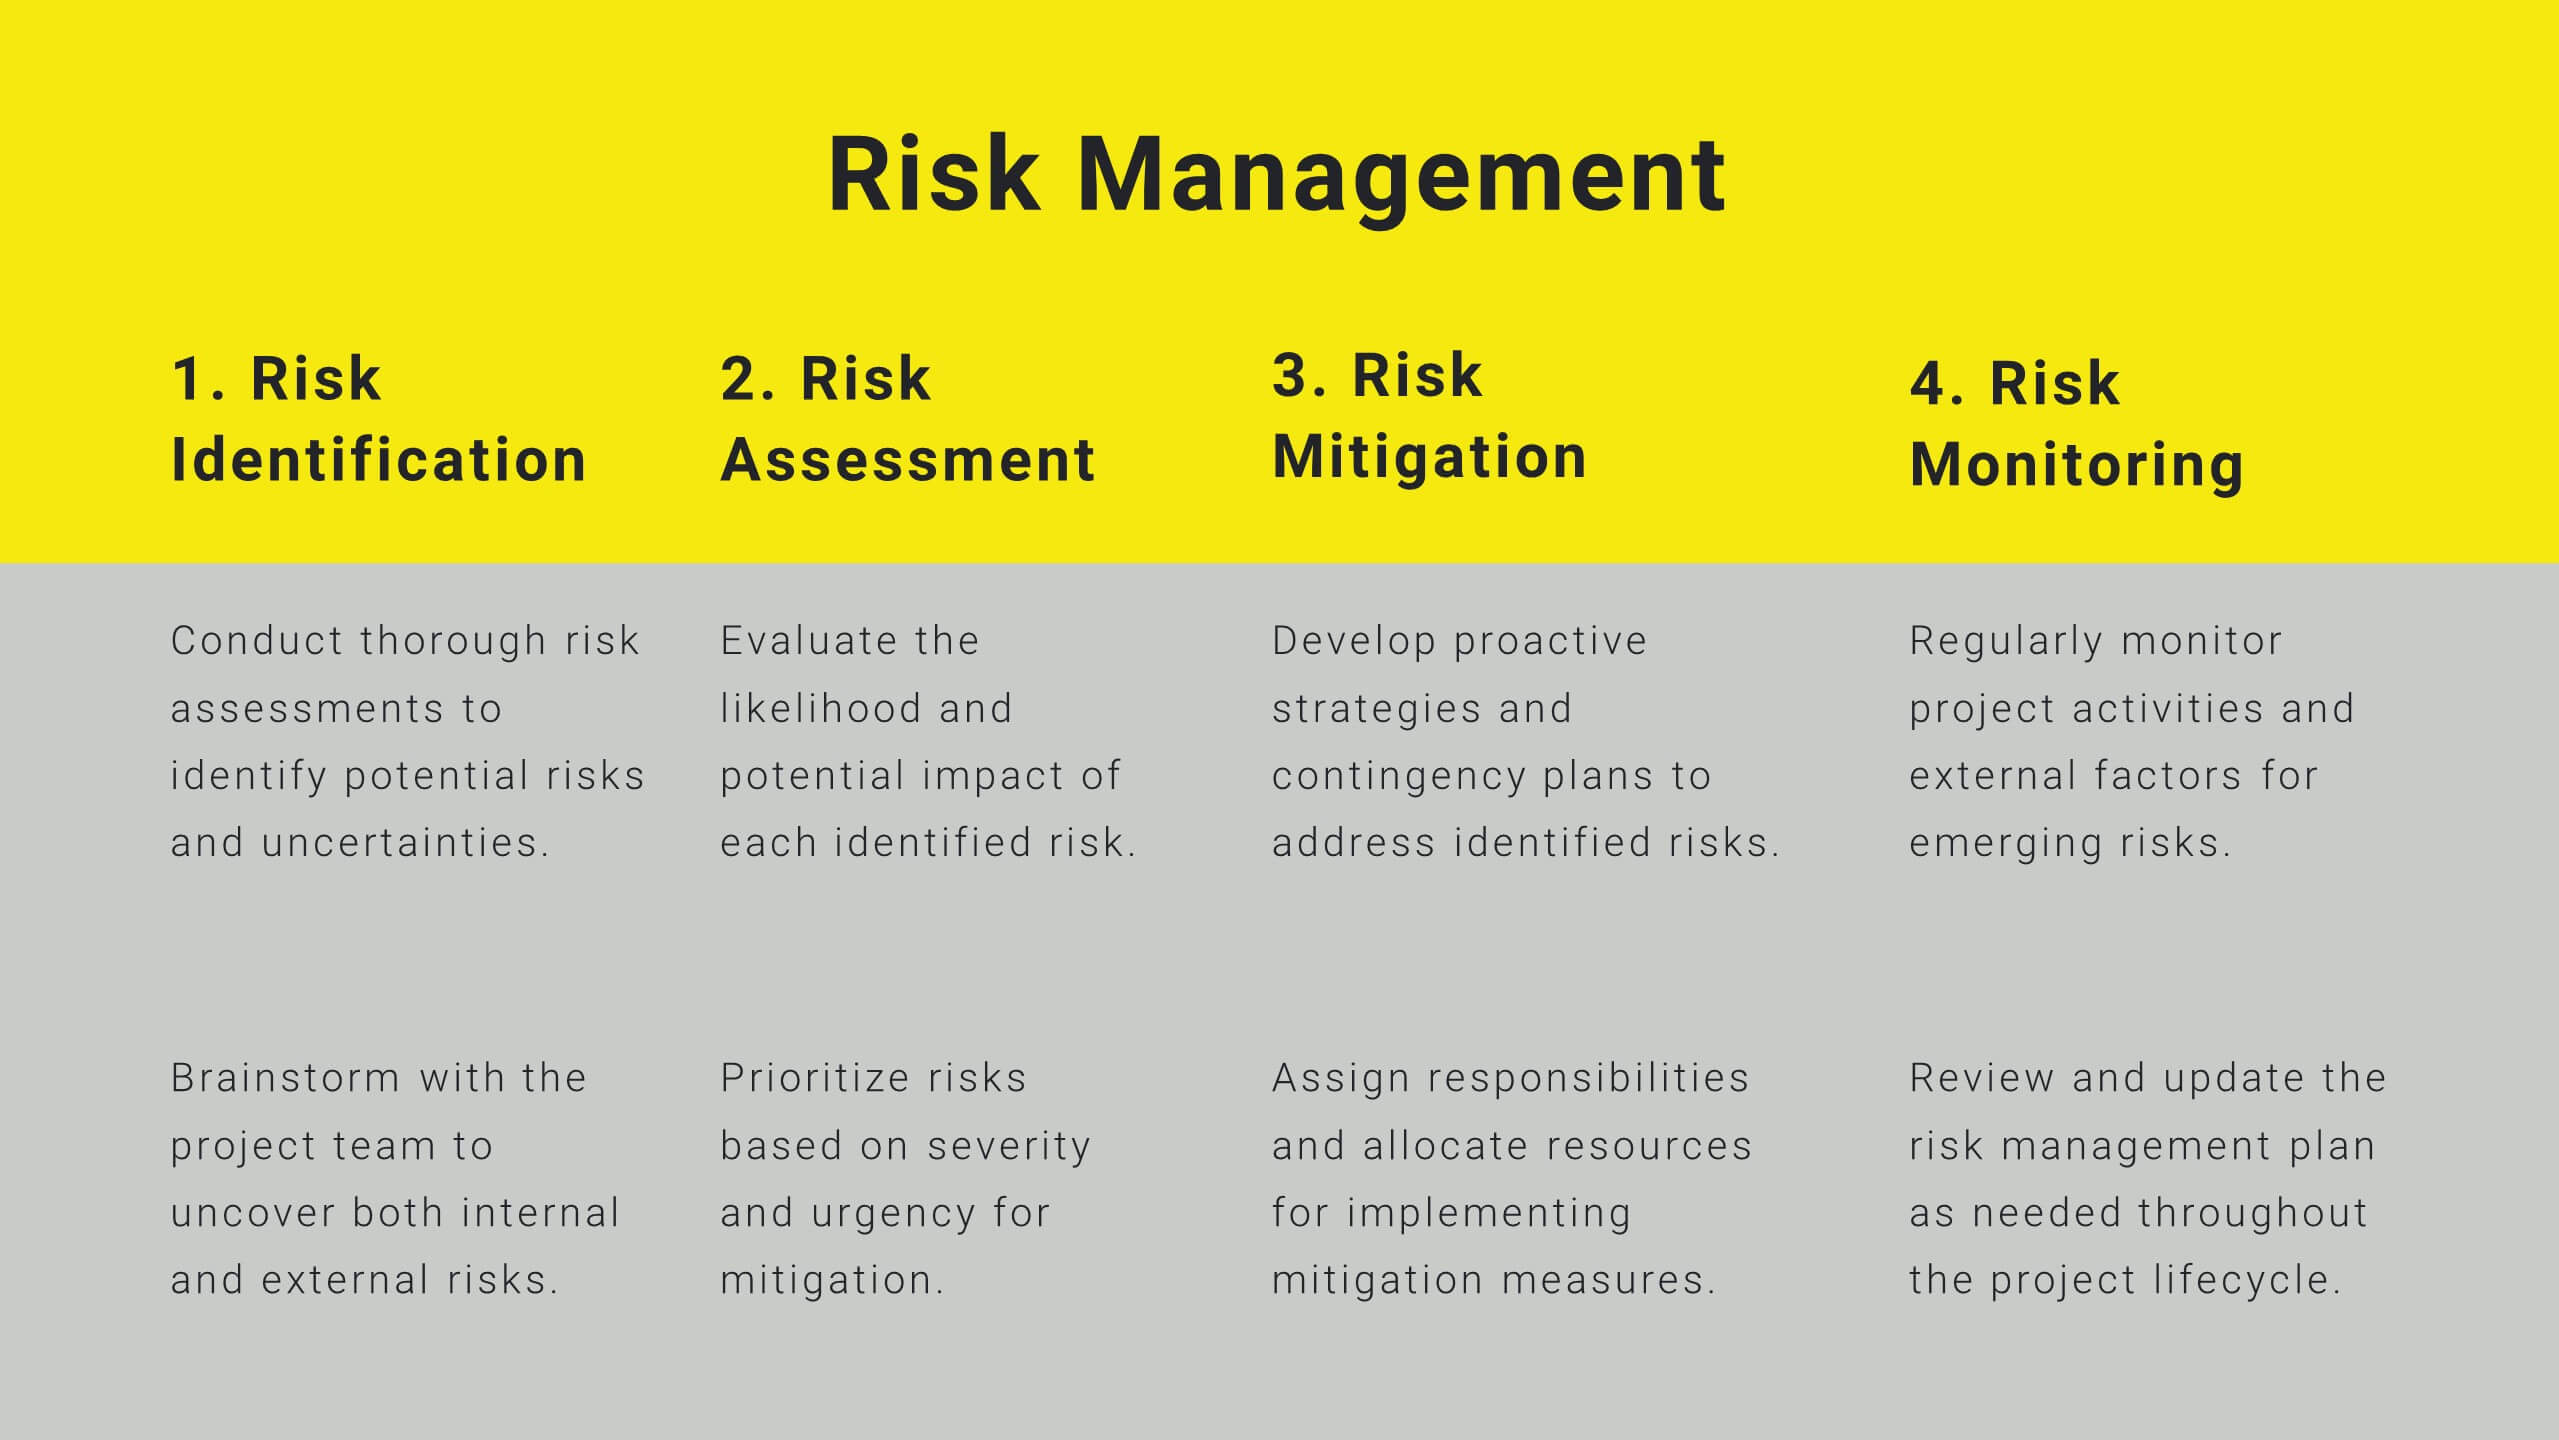
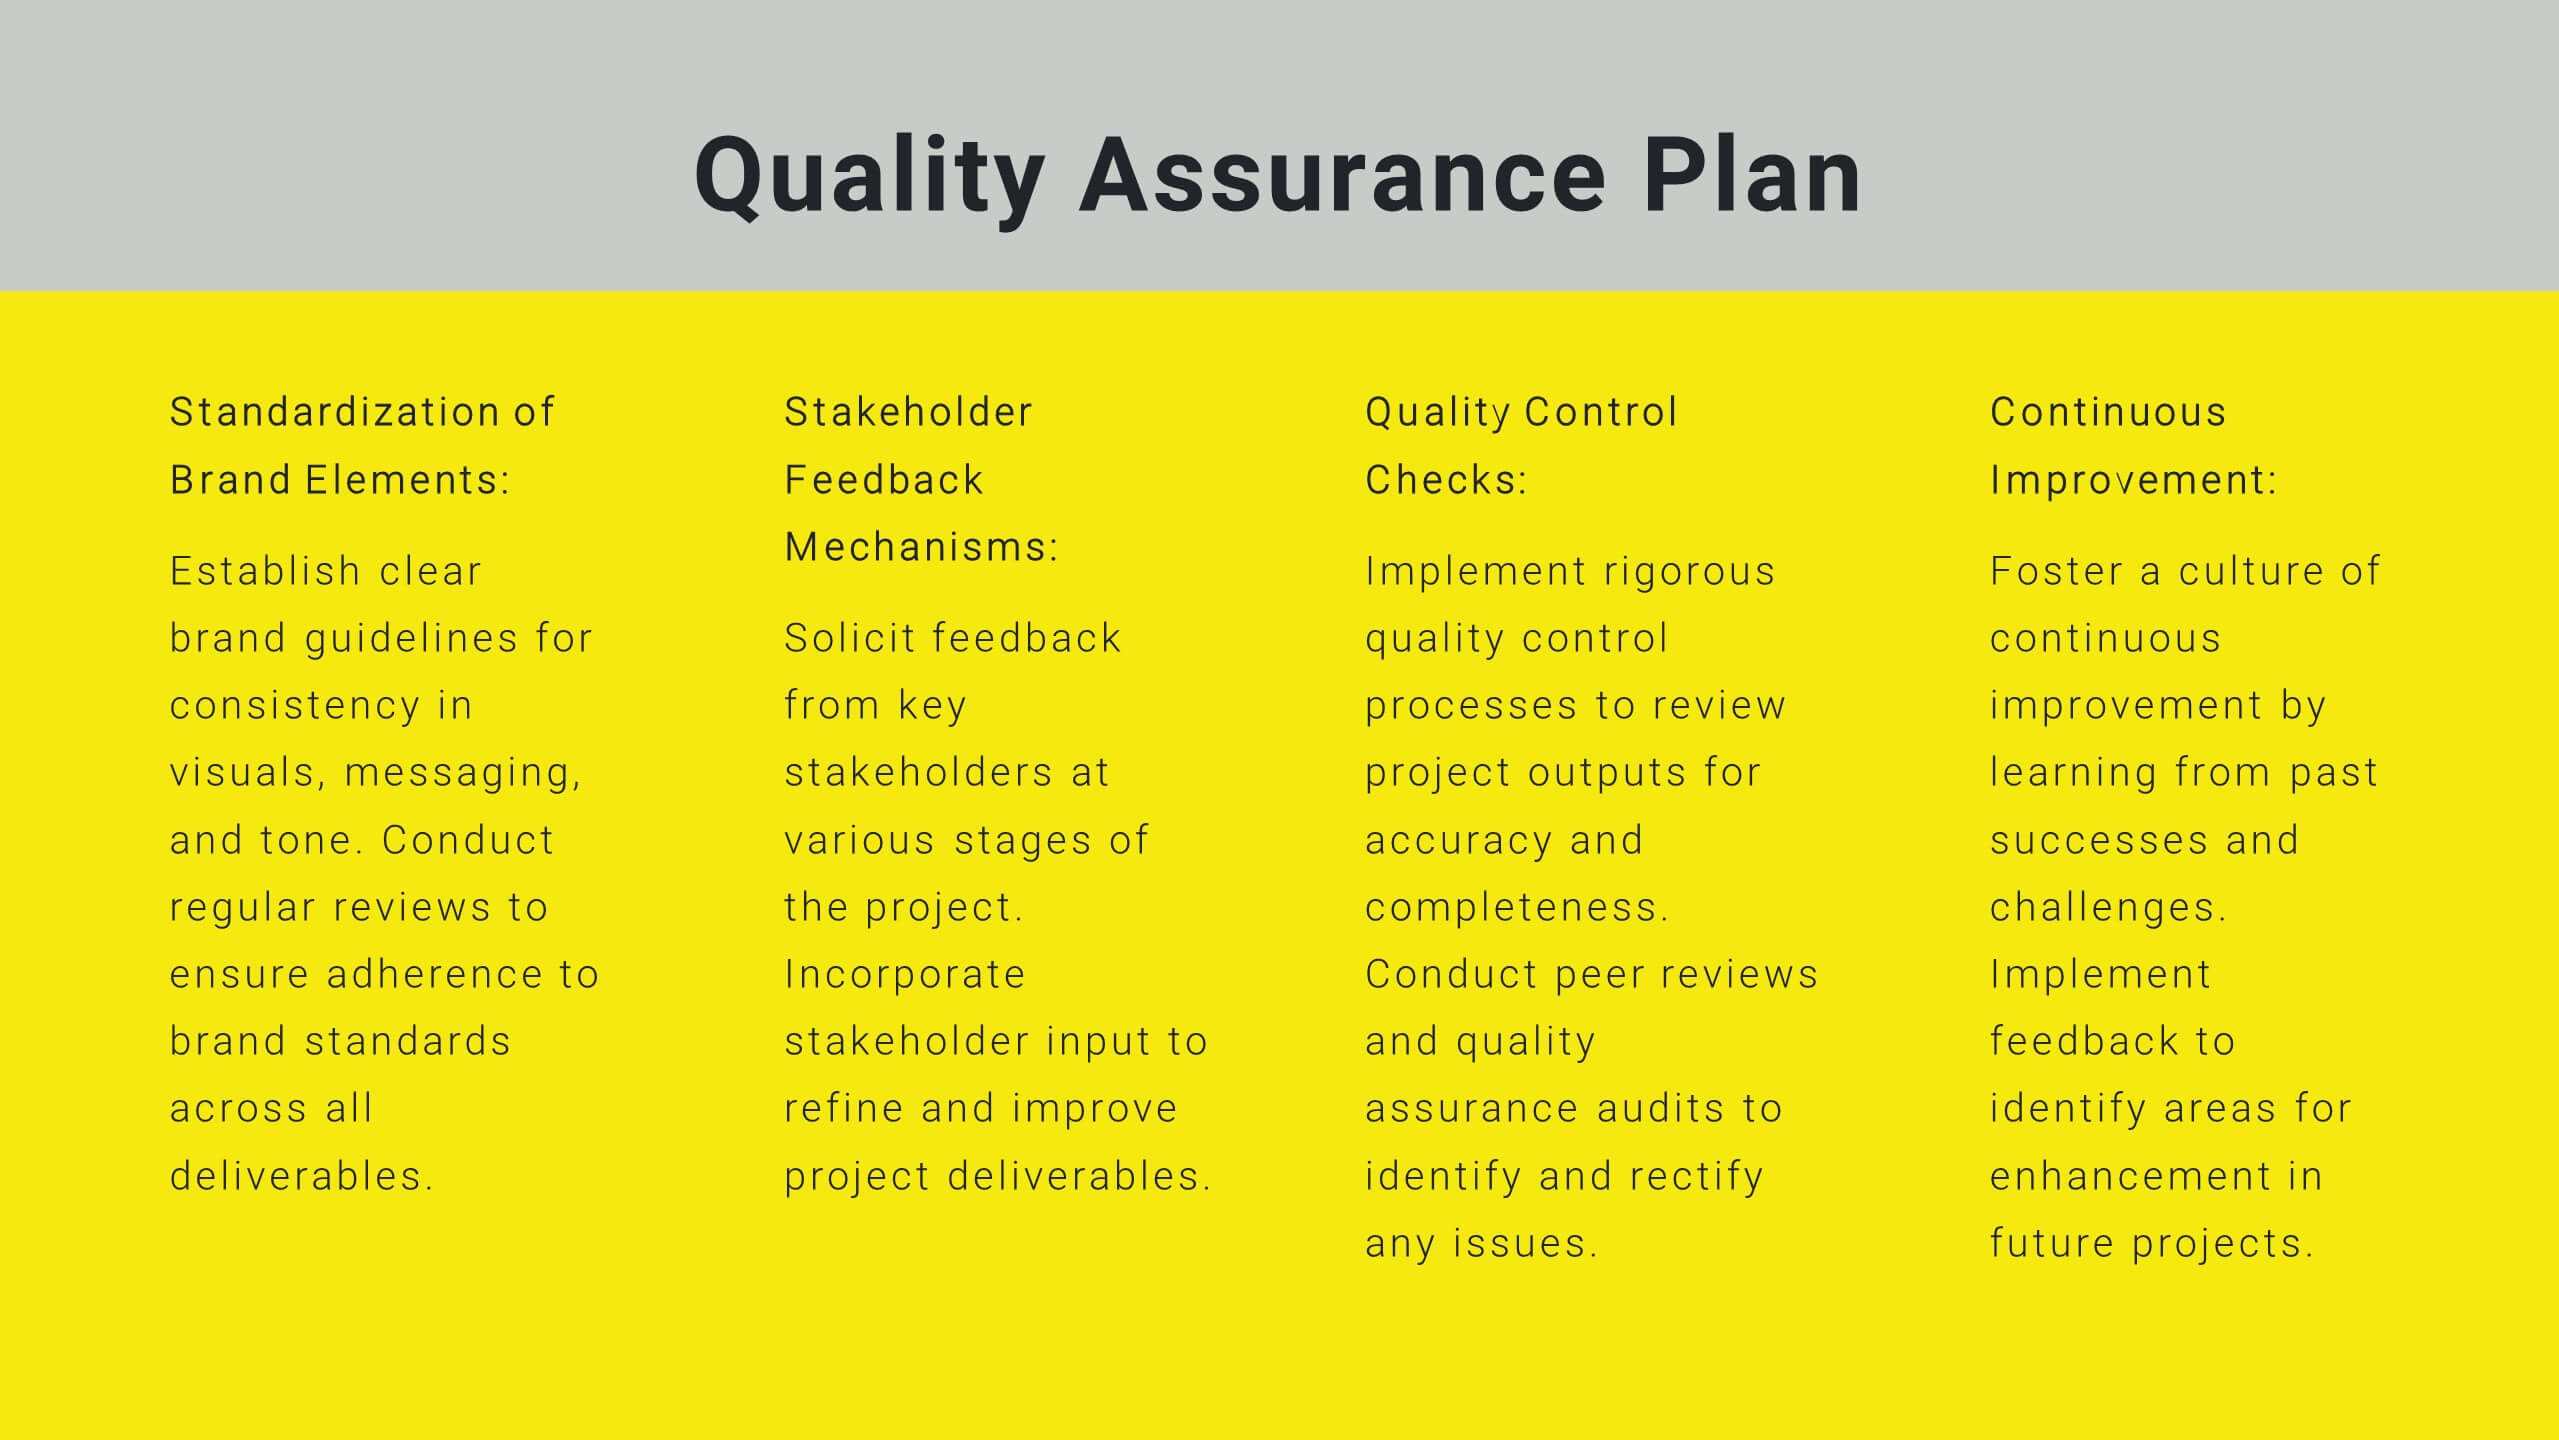
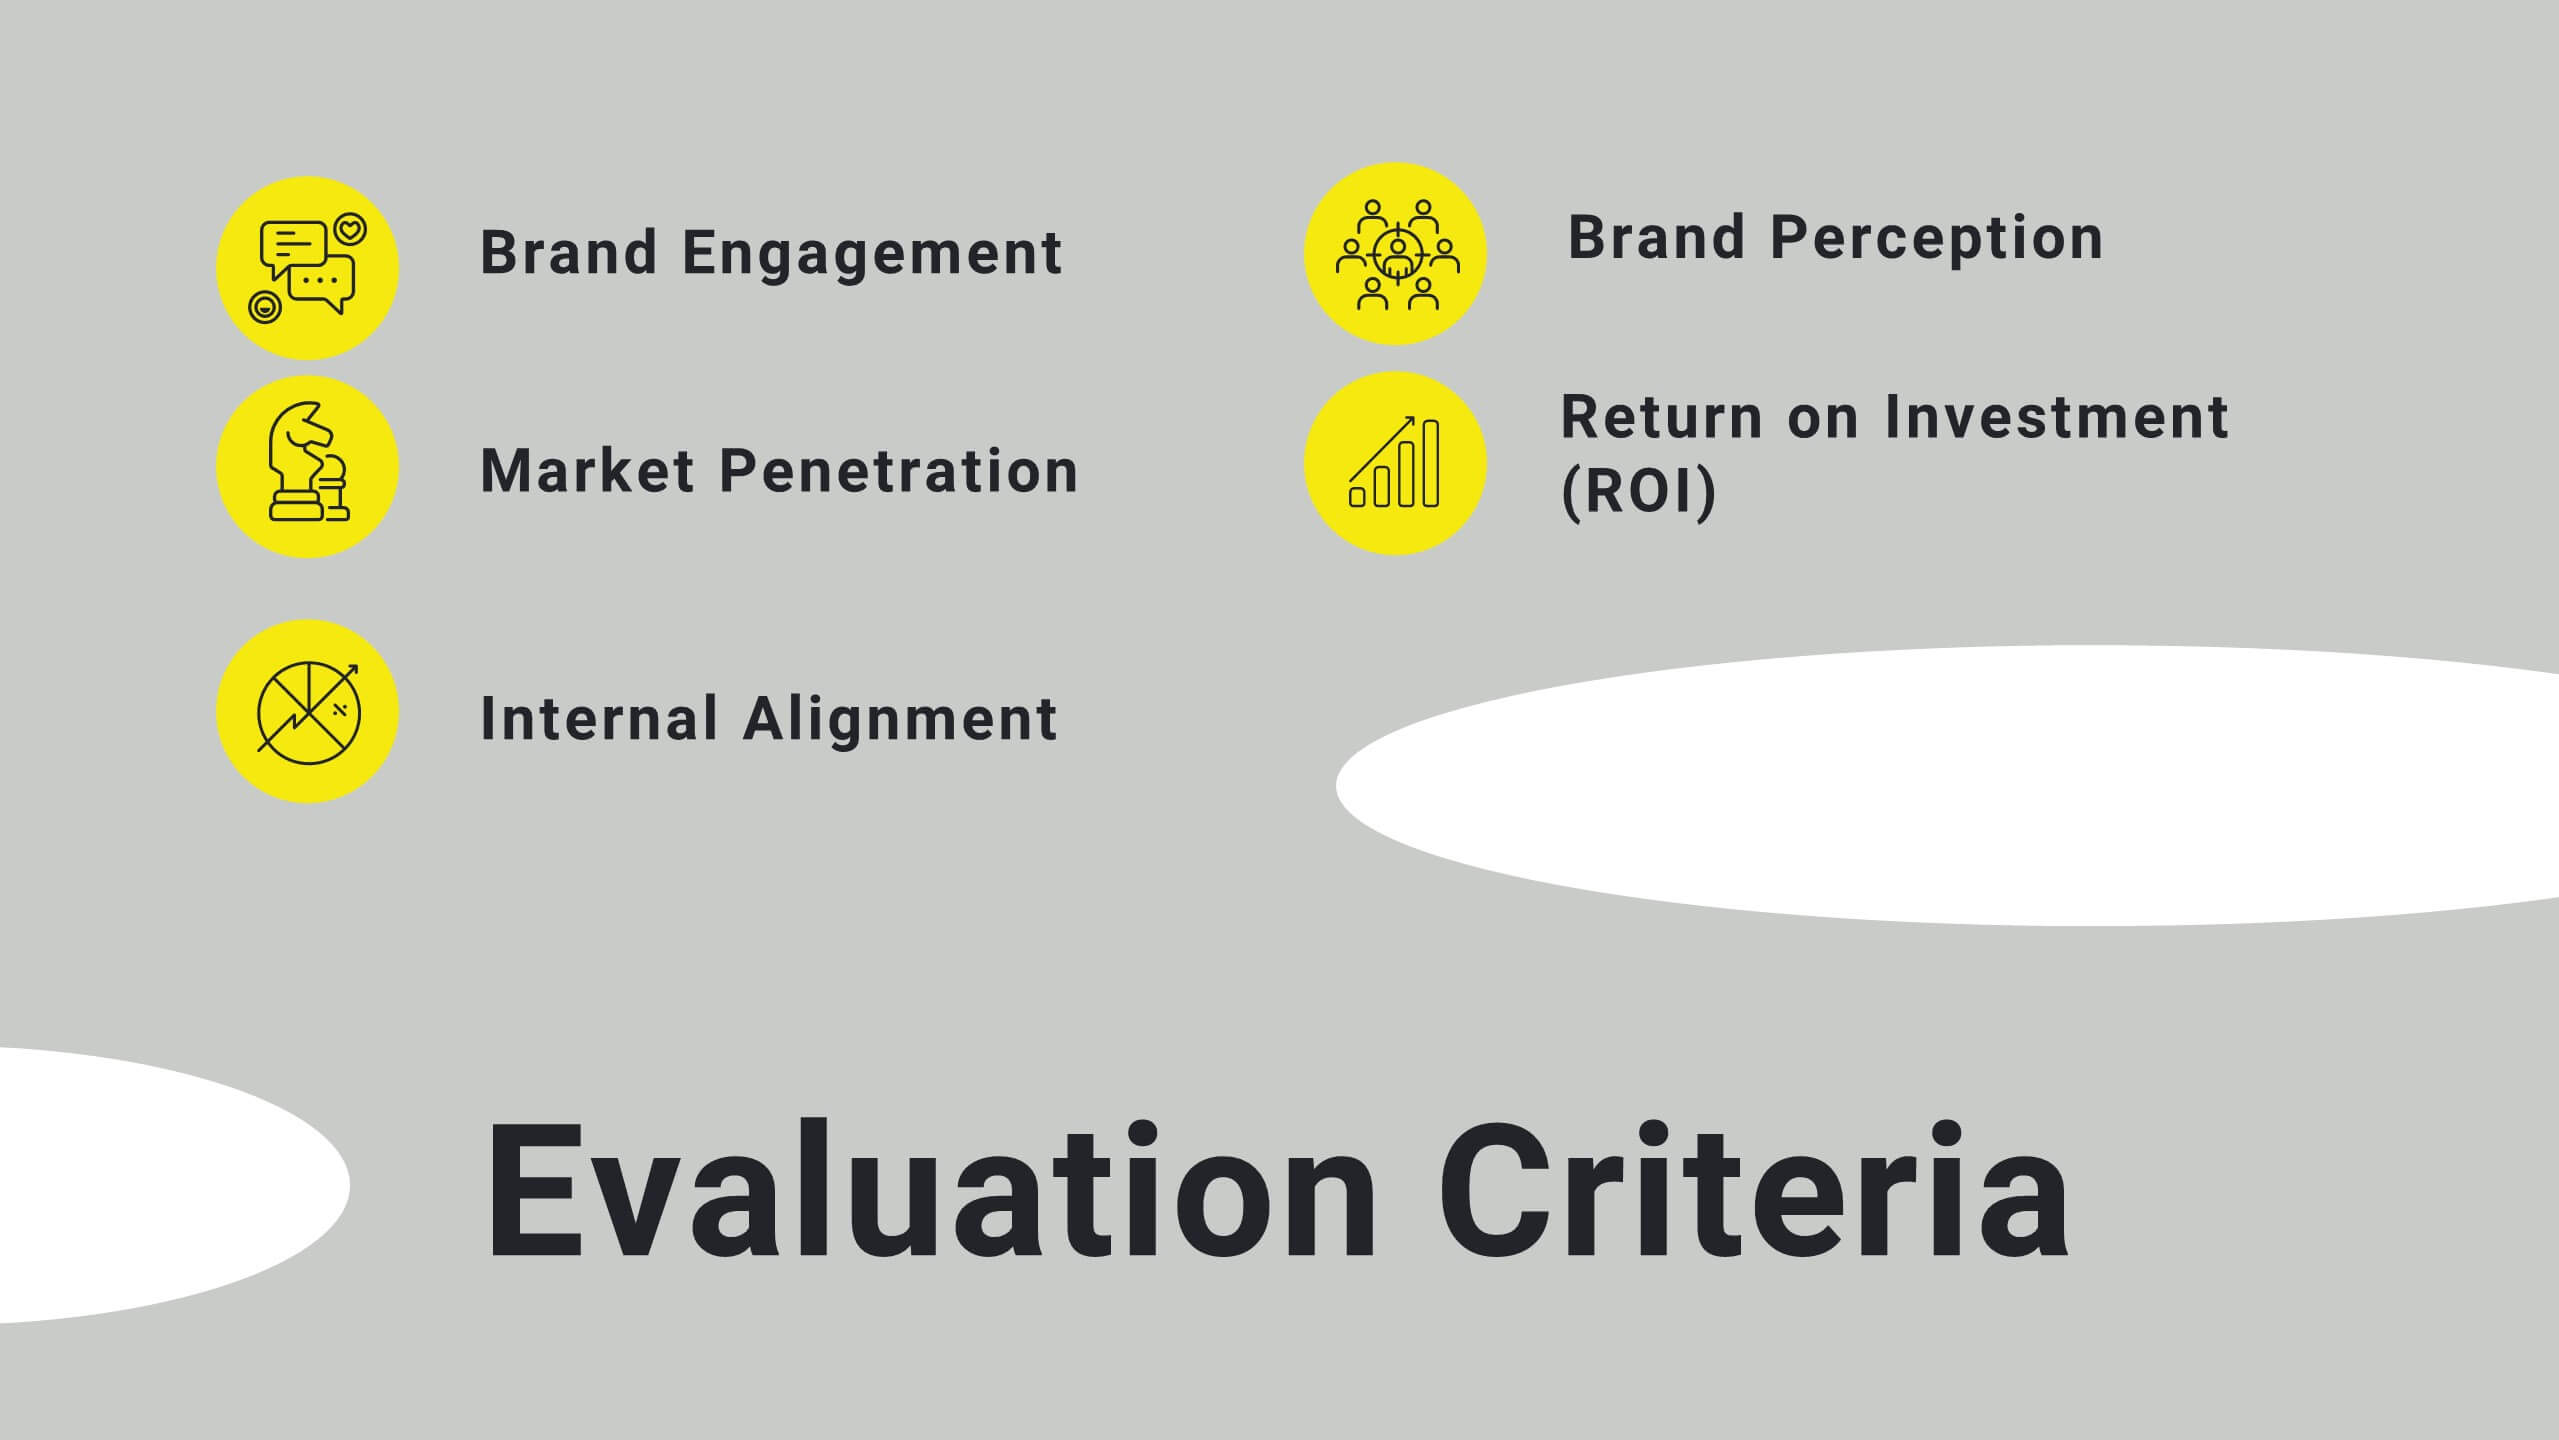
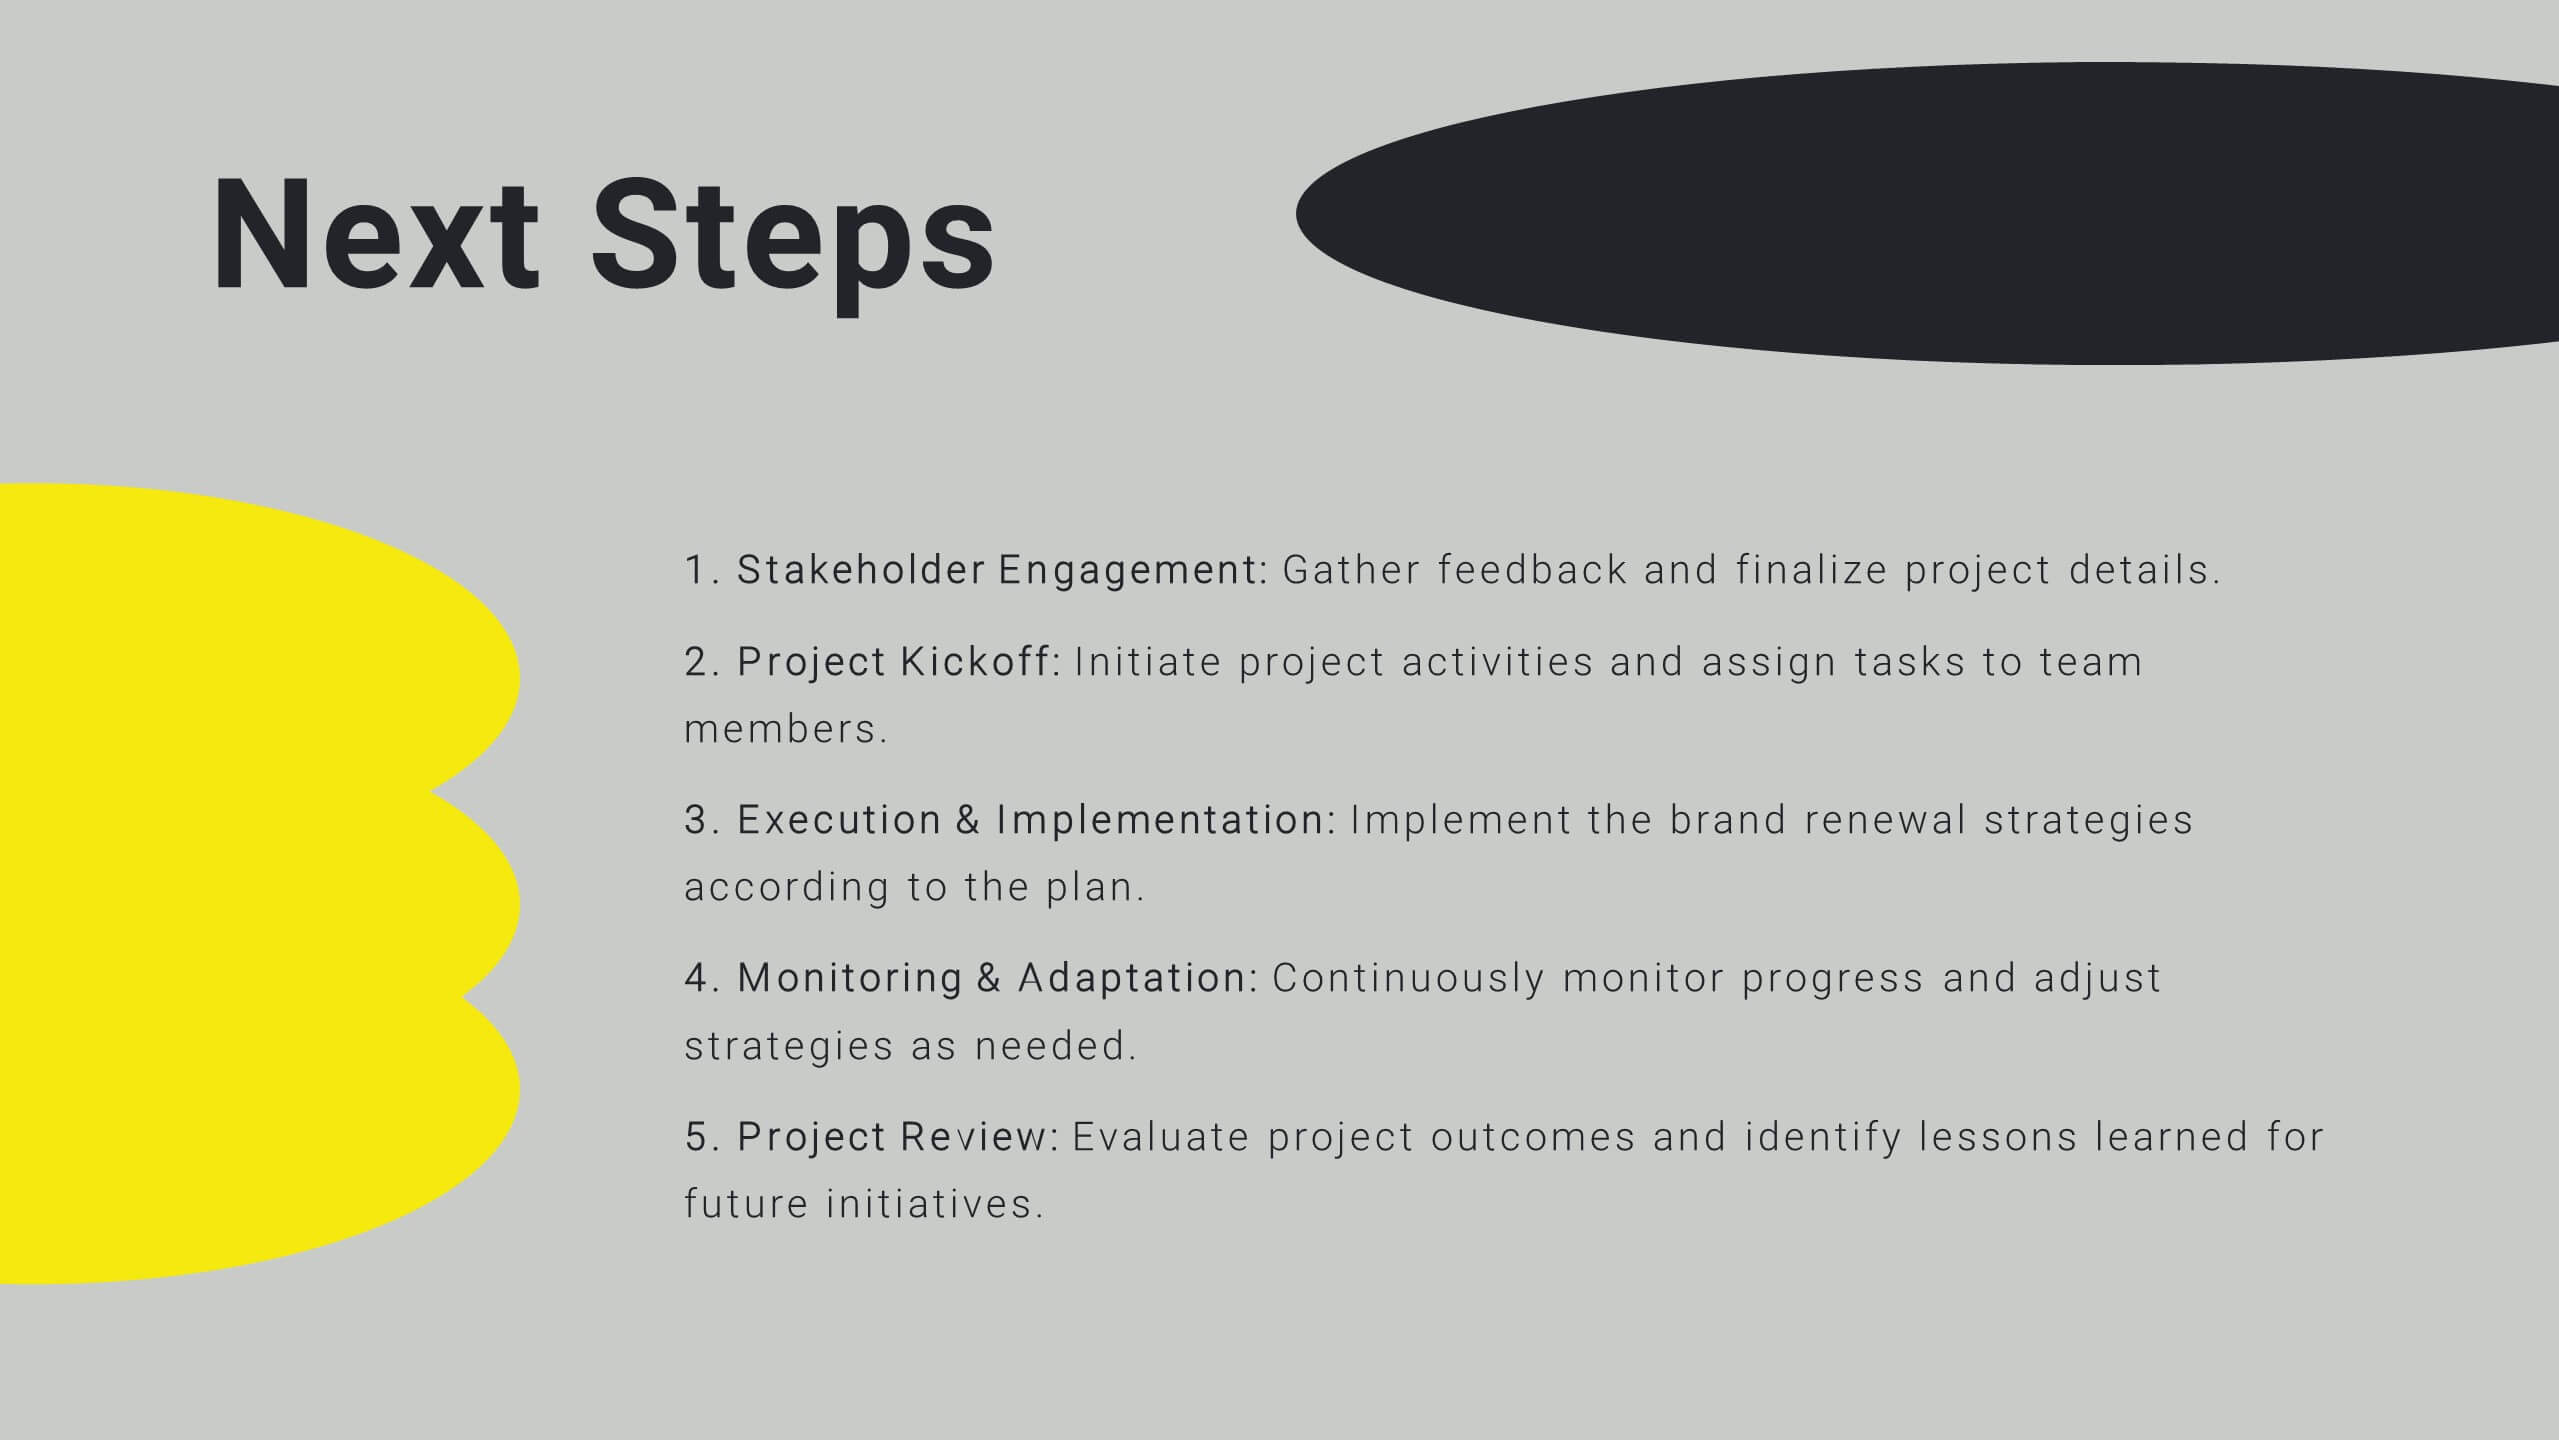
Sable Detailed Project Execution Plan Presentation
Master your project planning with this comprehensive execution plan template! Perfect for detailing project overviews, objectives, and timelines, it includes slides for budget breakdowns, resource allocation, and risk management. Ensure every detail is covered with structured content and clear visuals. Compatible with PowerPoint, Keynote, and Google Slides for seamless presentations on any platform.


5 diapositivas
Behavioral Psychology in the Workplace Presentation
Boost employee engagement and team dynamics with the Behavioral Psychology in the Workplace Presentation. This slide deck is designed to help HR leaders, managers, and consultants visualize psychological insights that shape workplace behavior. Use it to present motivation theories, behavioral models, or communication styles. Fully editable in Canva, PowerPoint, Google Slides, and Keynote.


23 diapositivas
Cosmira Digital Strategy Presentation
This Digital Strategy Presentation provides a comprehensive framework for outlining business objectives, competitive analysis, and growth opportunities. It includes key sections such as SWOT analysis, performance metrics, and implementation plans. Ideal for businesses and marketers, the slides are fully editable and compatible with PowerPoint, Keynote, and Google Slides.


6 diapositivas
Data Analysis Methods Infographics
This Data Analysis Methods Infographic is an excellent tool for professionals and students alike to present statistical findings and patterns. Designed for seamless integration with PowerPoint, Google Slides, and Keynote. The infographics are ideal for illustrating trends, and summarizing large amounts of data in an easily digestible format. With a variety of chart styles, including bar graphs, line charts, and icon arrays, the template allows for versatile data representation. Make your data speak volumes with this crisp and informative infographic, ensuring your audience grasps the insights at a glance. Perfect for market research, academic research, and business performance presentations.


20 diapositivas
Egeria Artist Portfolio Presentation
Showcase your artistry with this vibrant portfolio template, featuring sections for project displays, creative process, awards, and testimonials. Perfect for artists seeking a polished presentation of their work. Customizable and suitable for PowerPoint, Keynote, and Google Slides, this template highlights your unique style and professional journey.


20 diapositivas
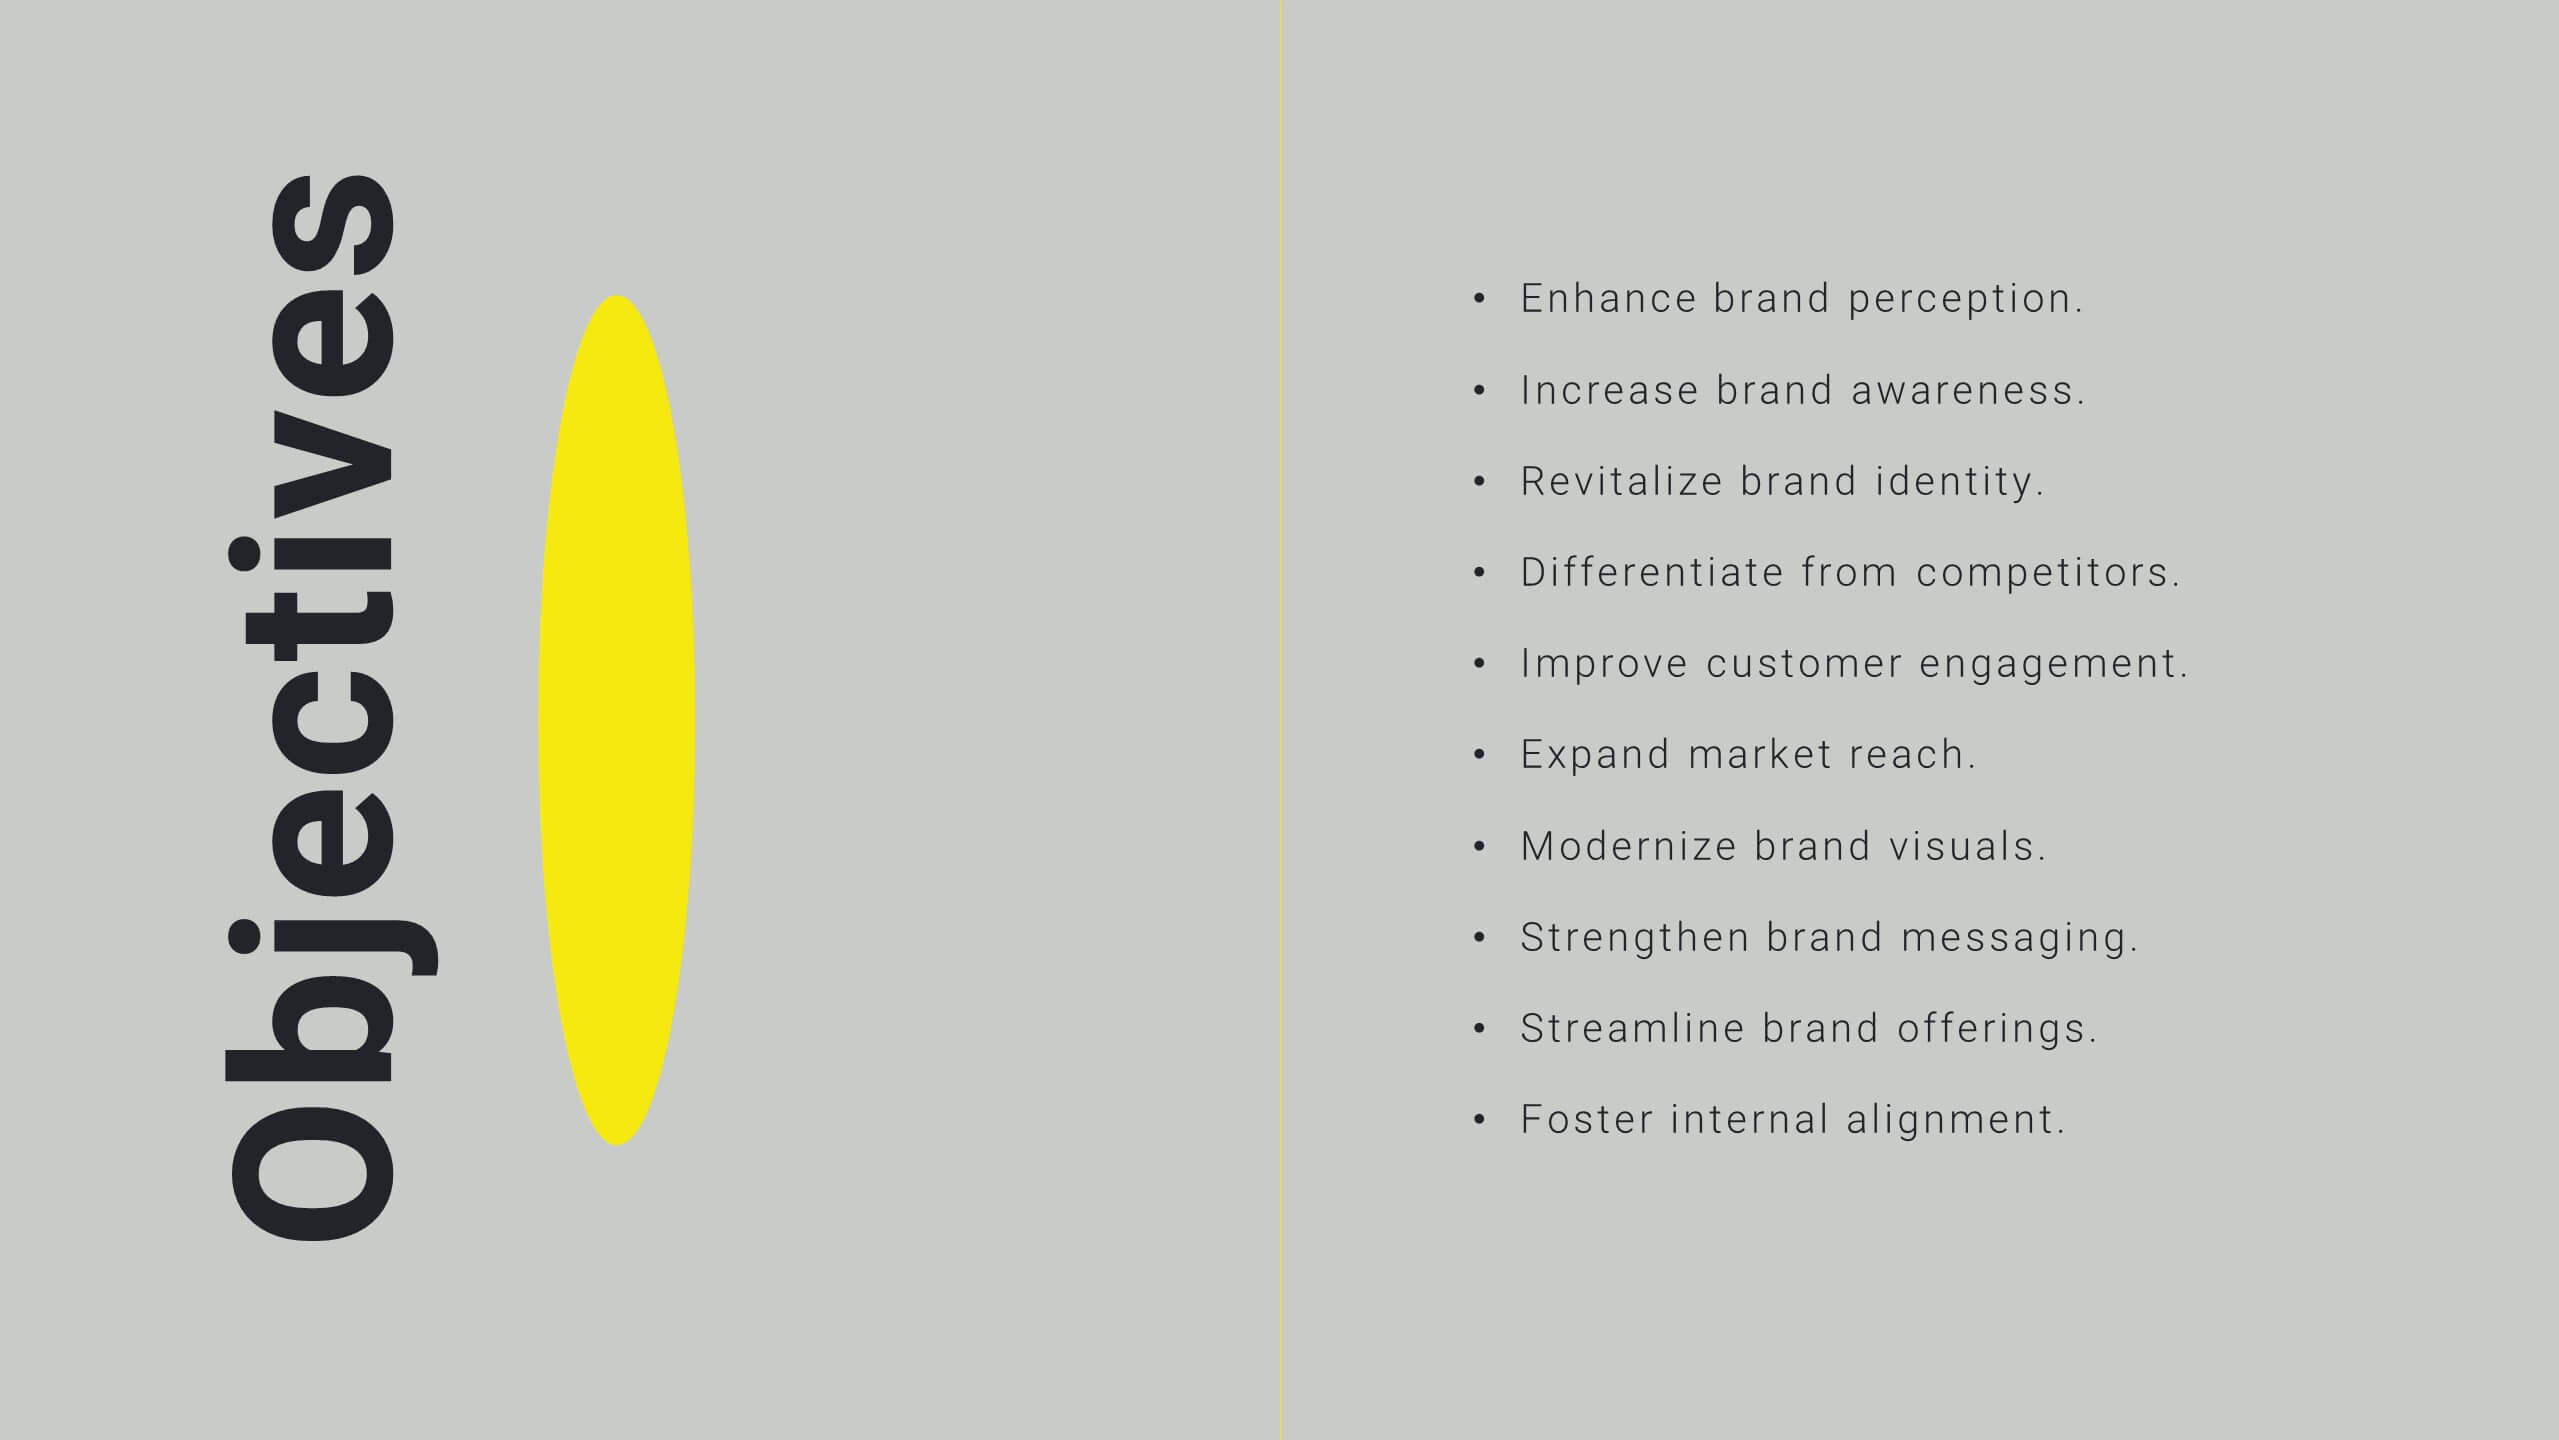
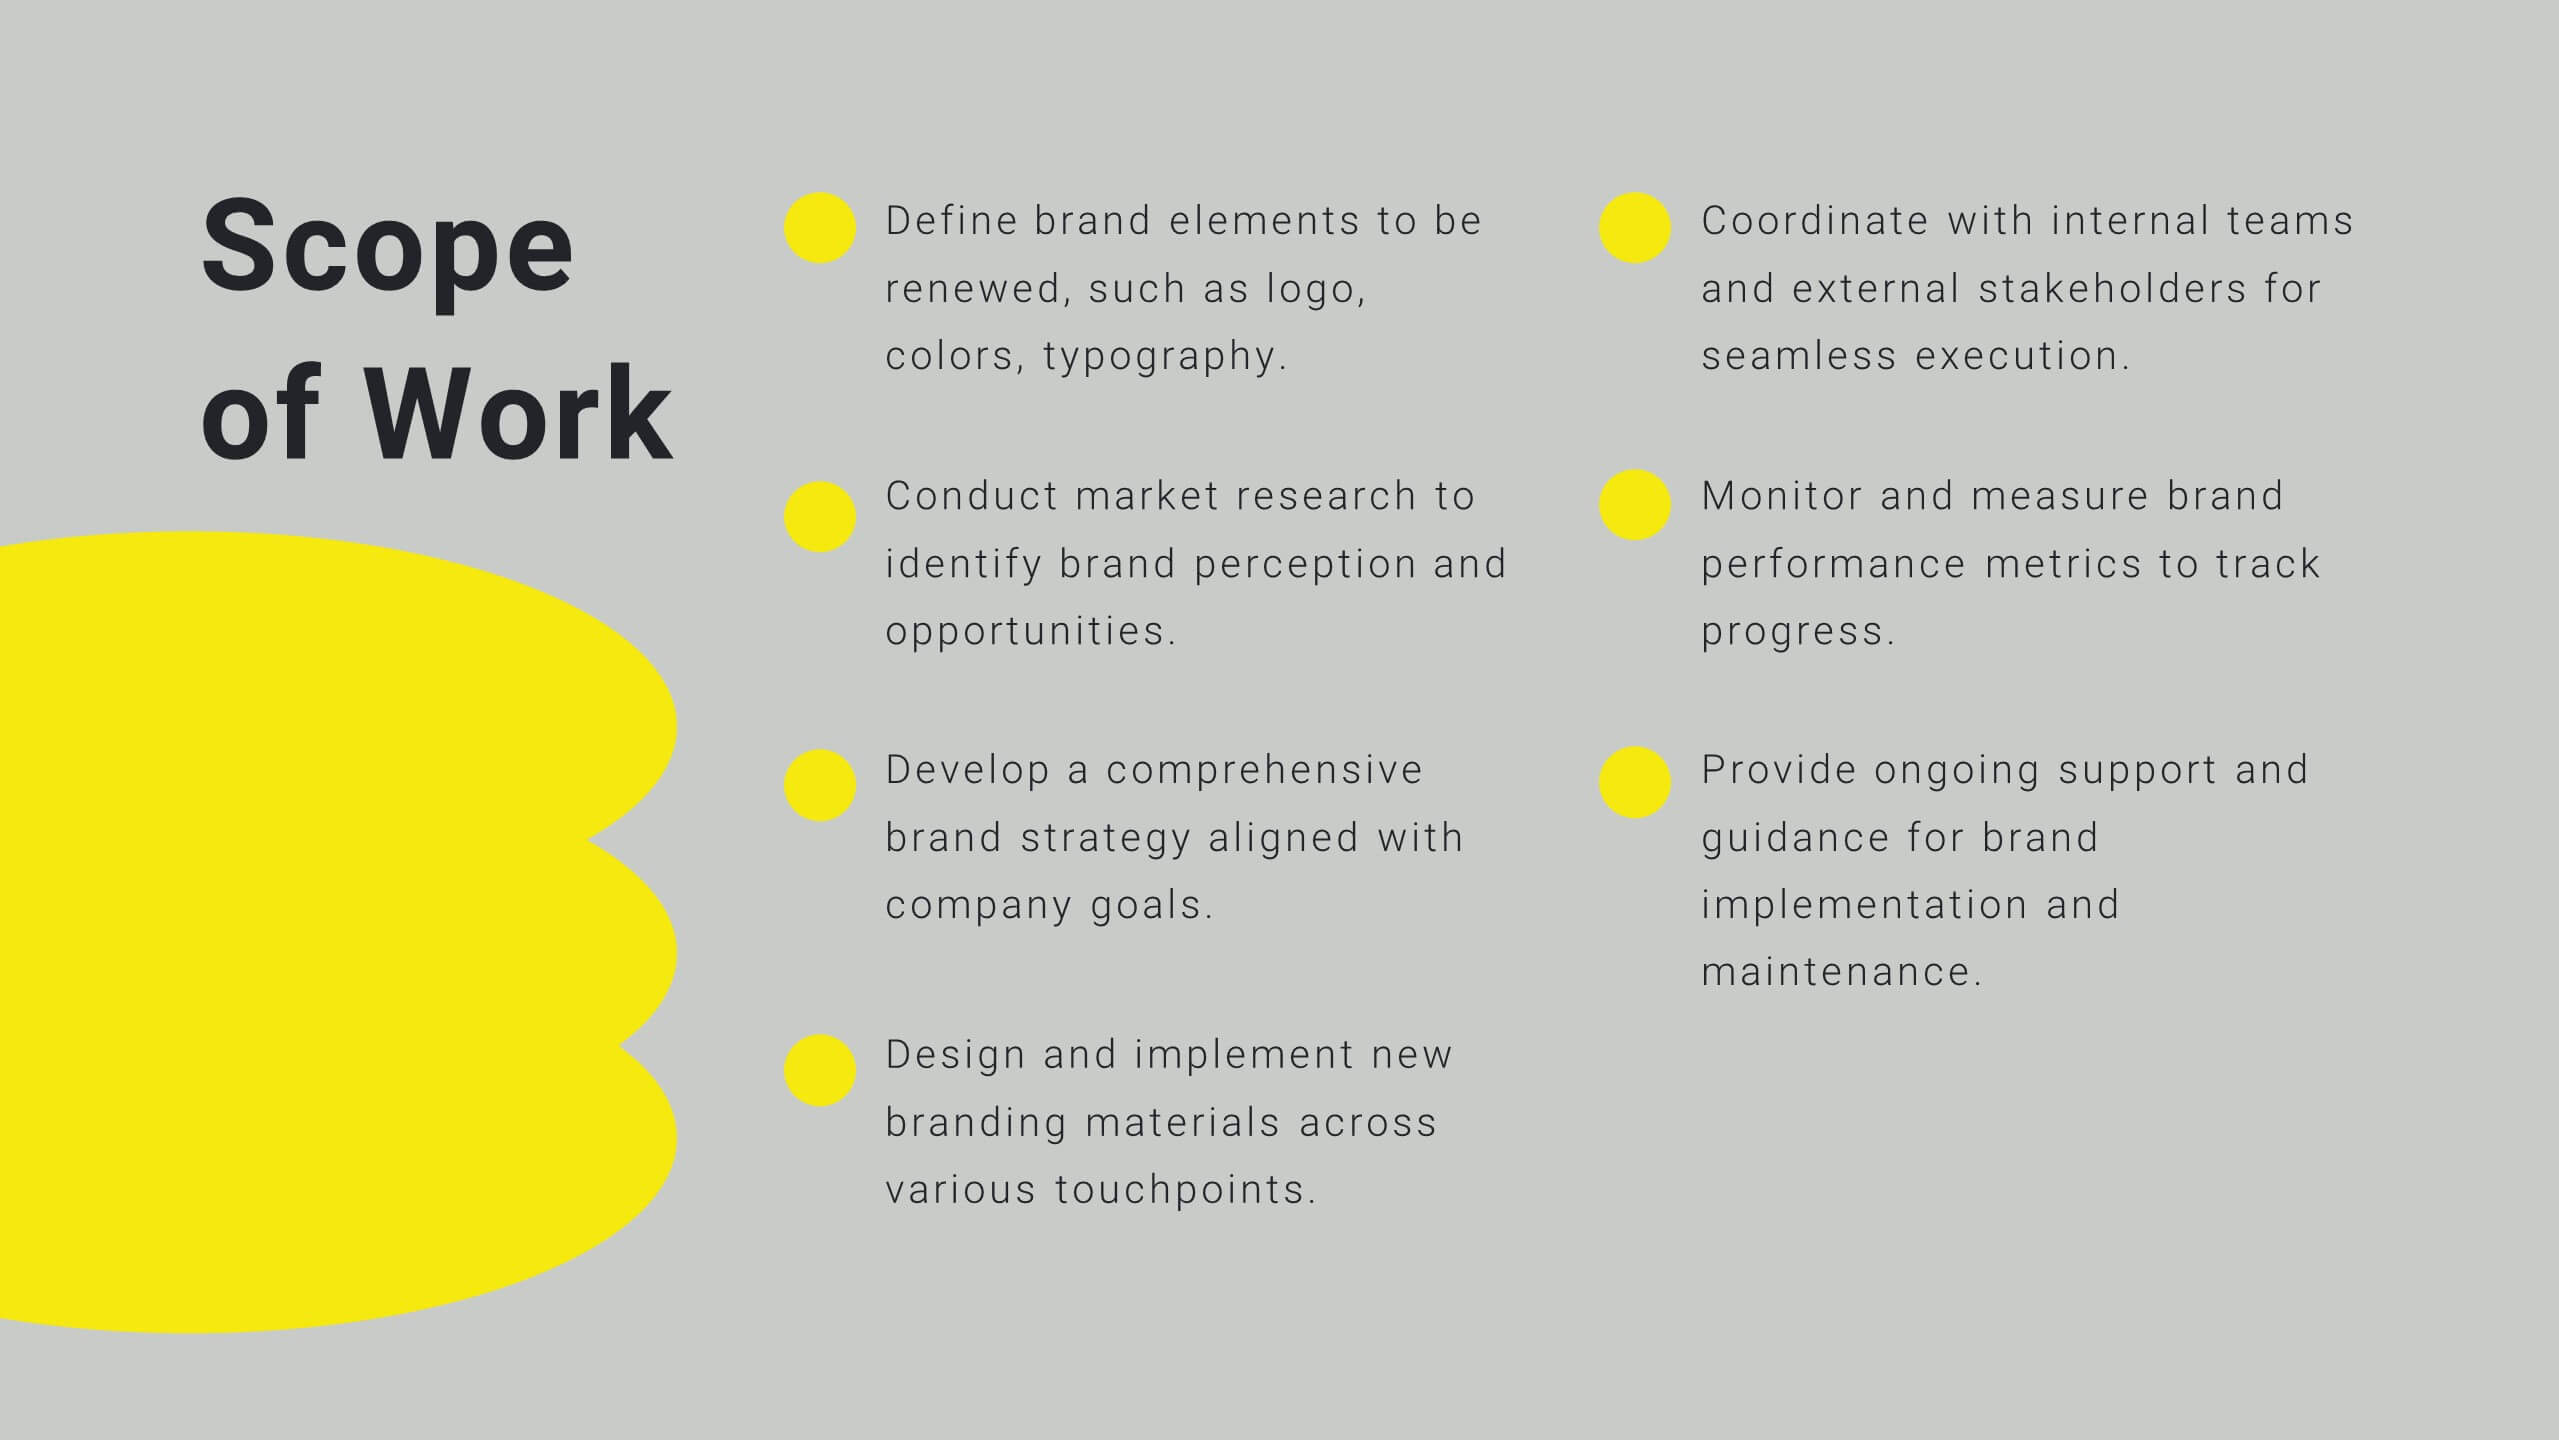
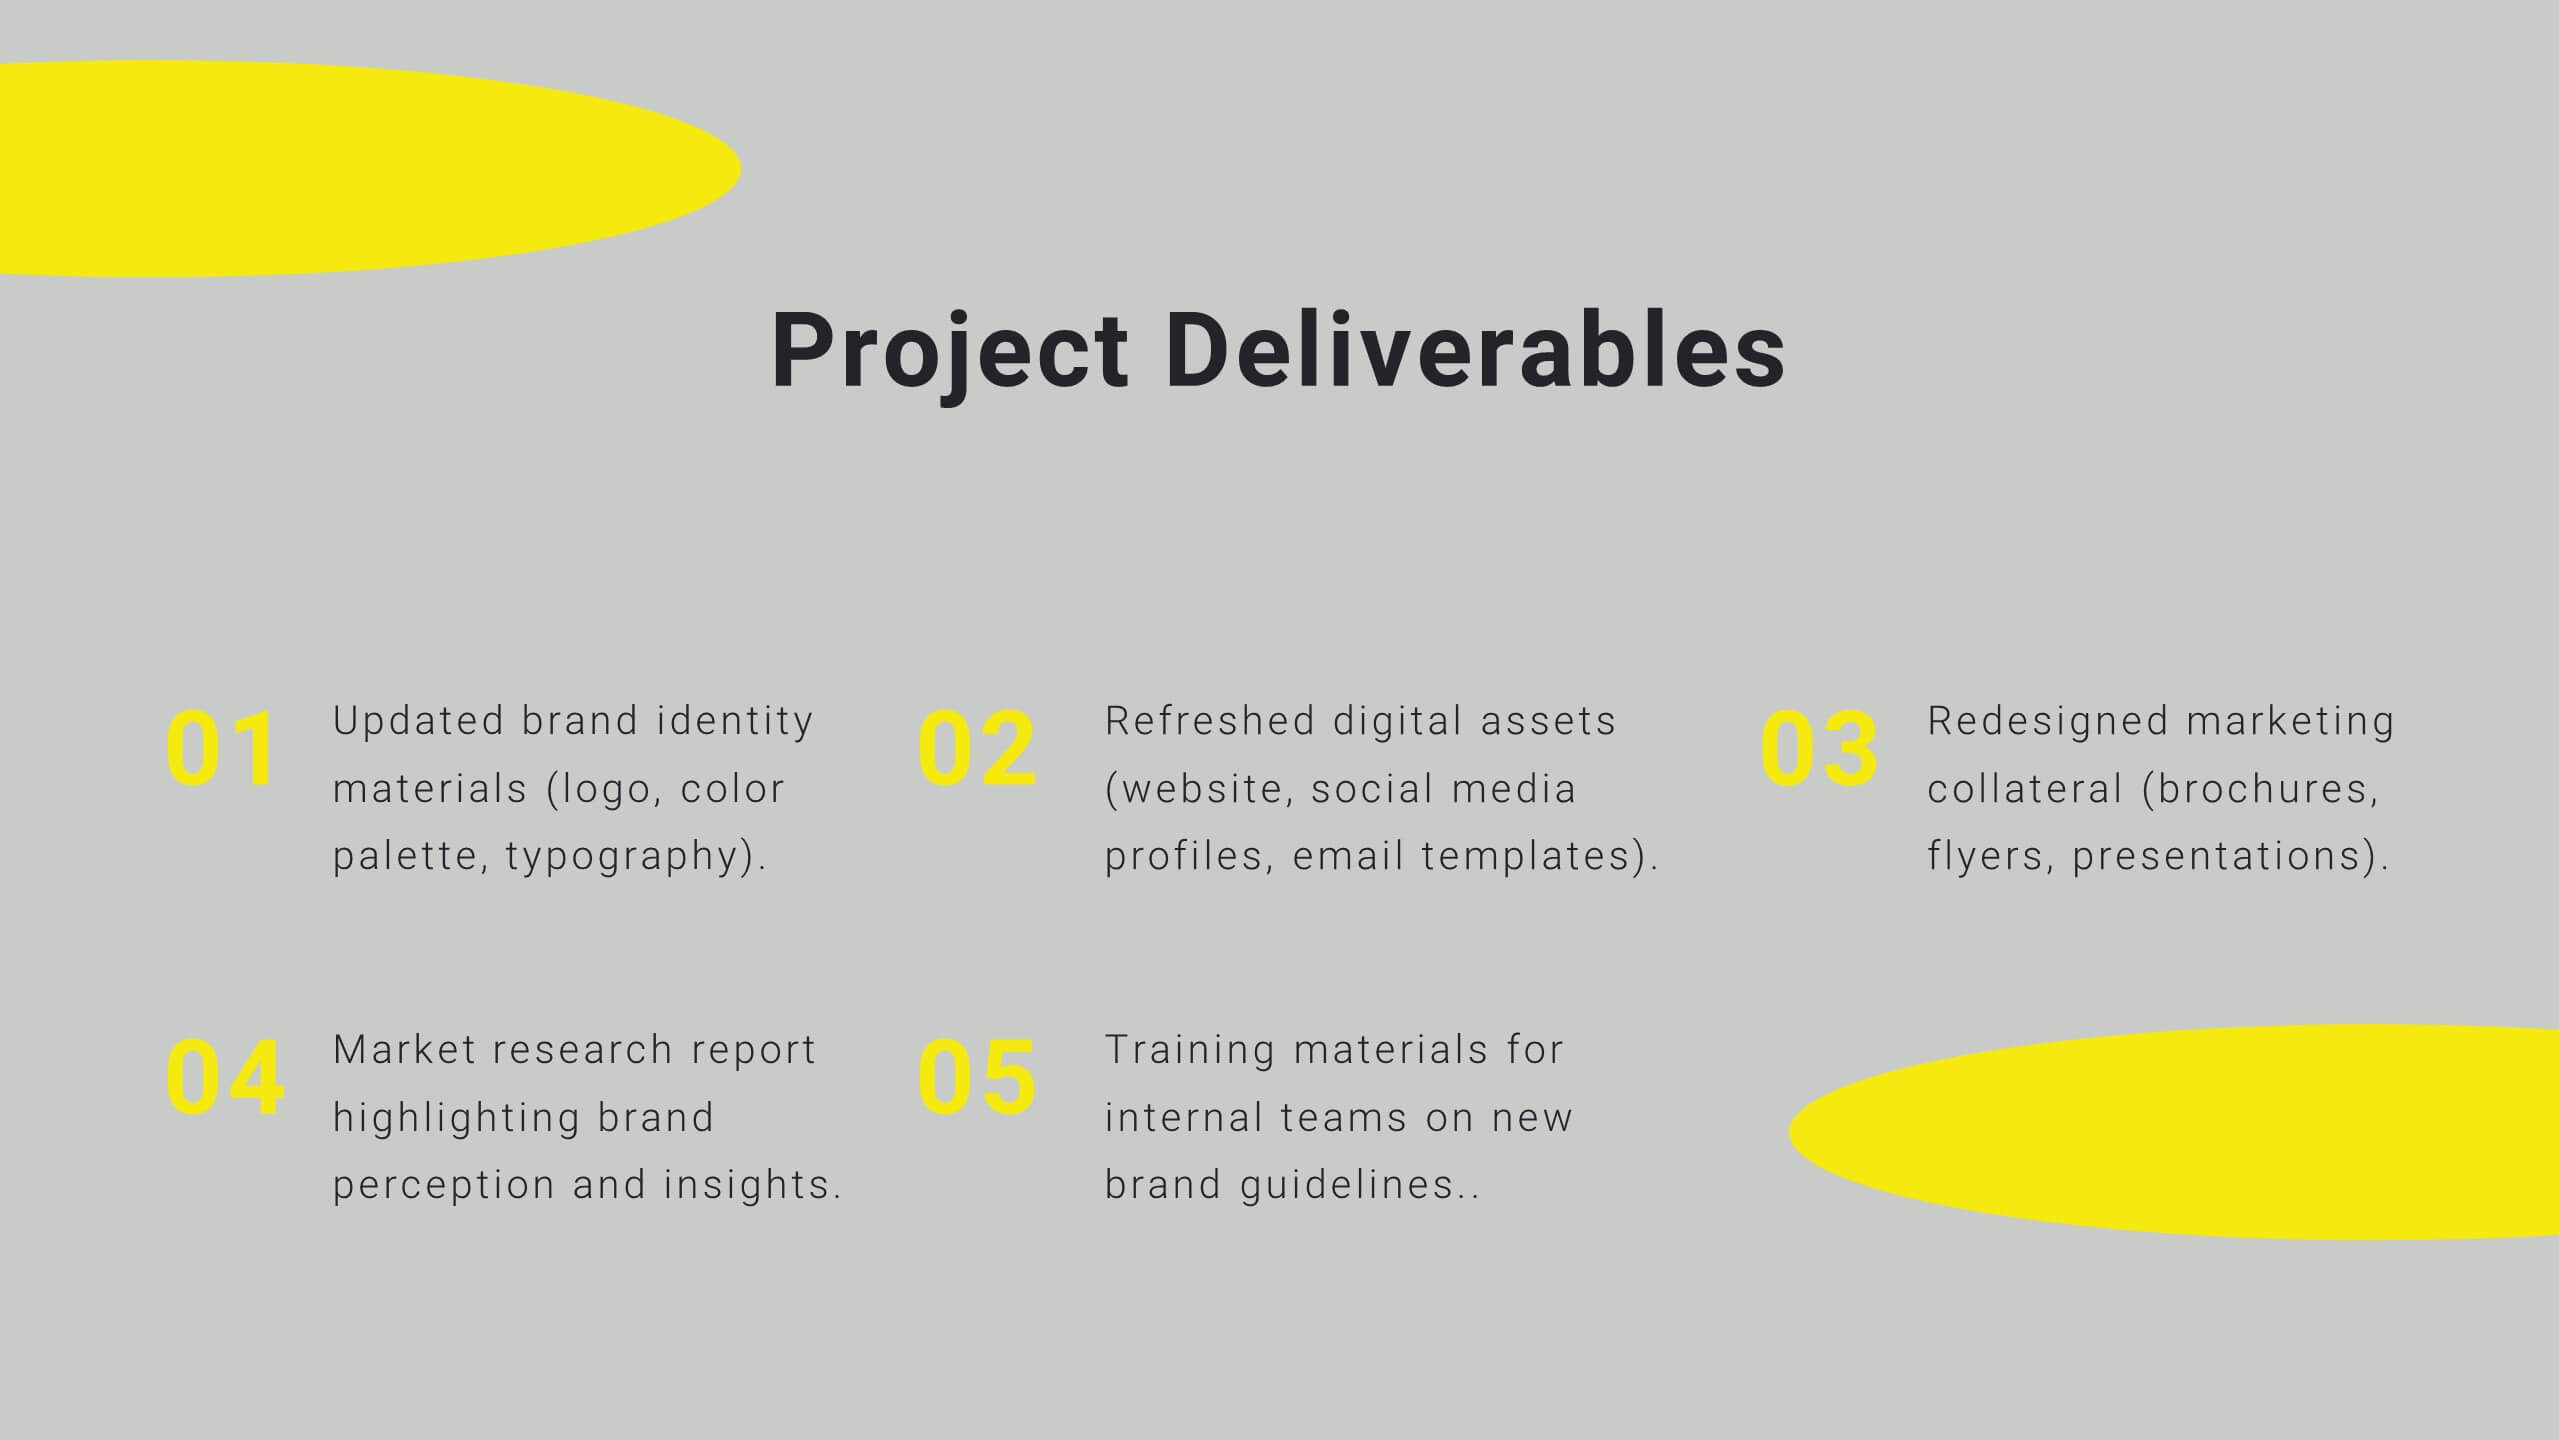
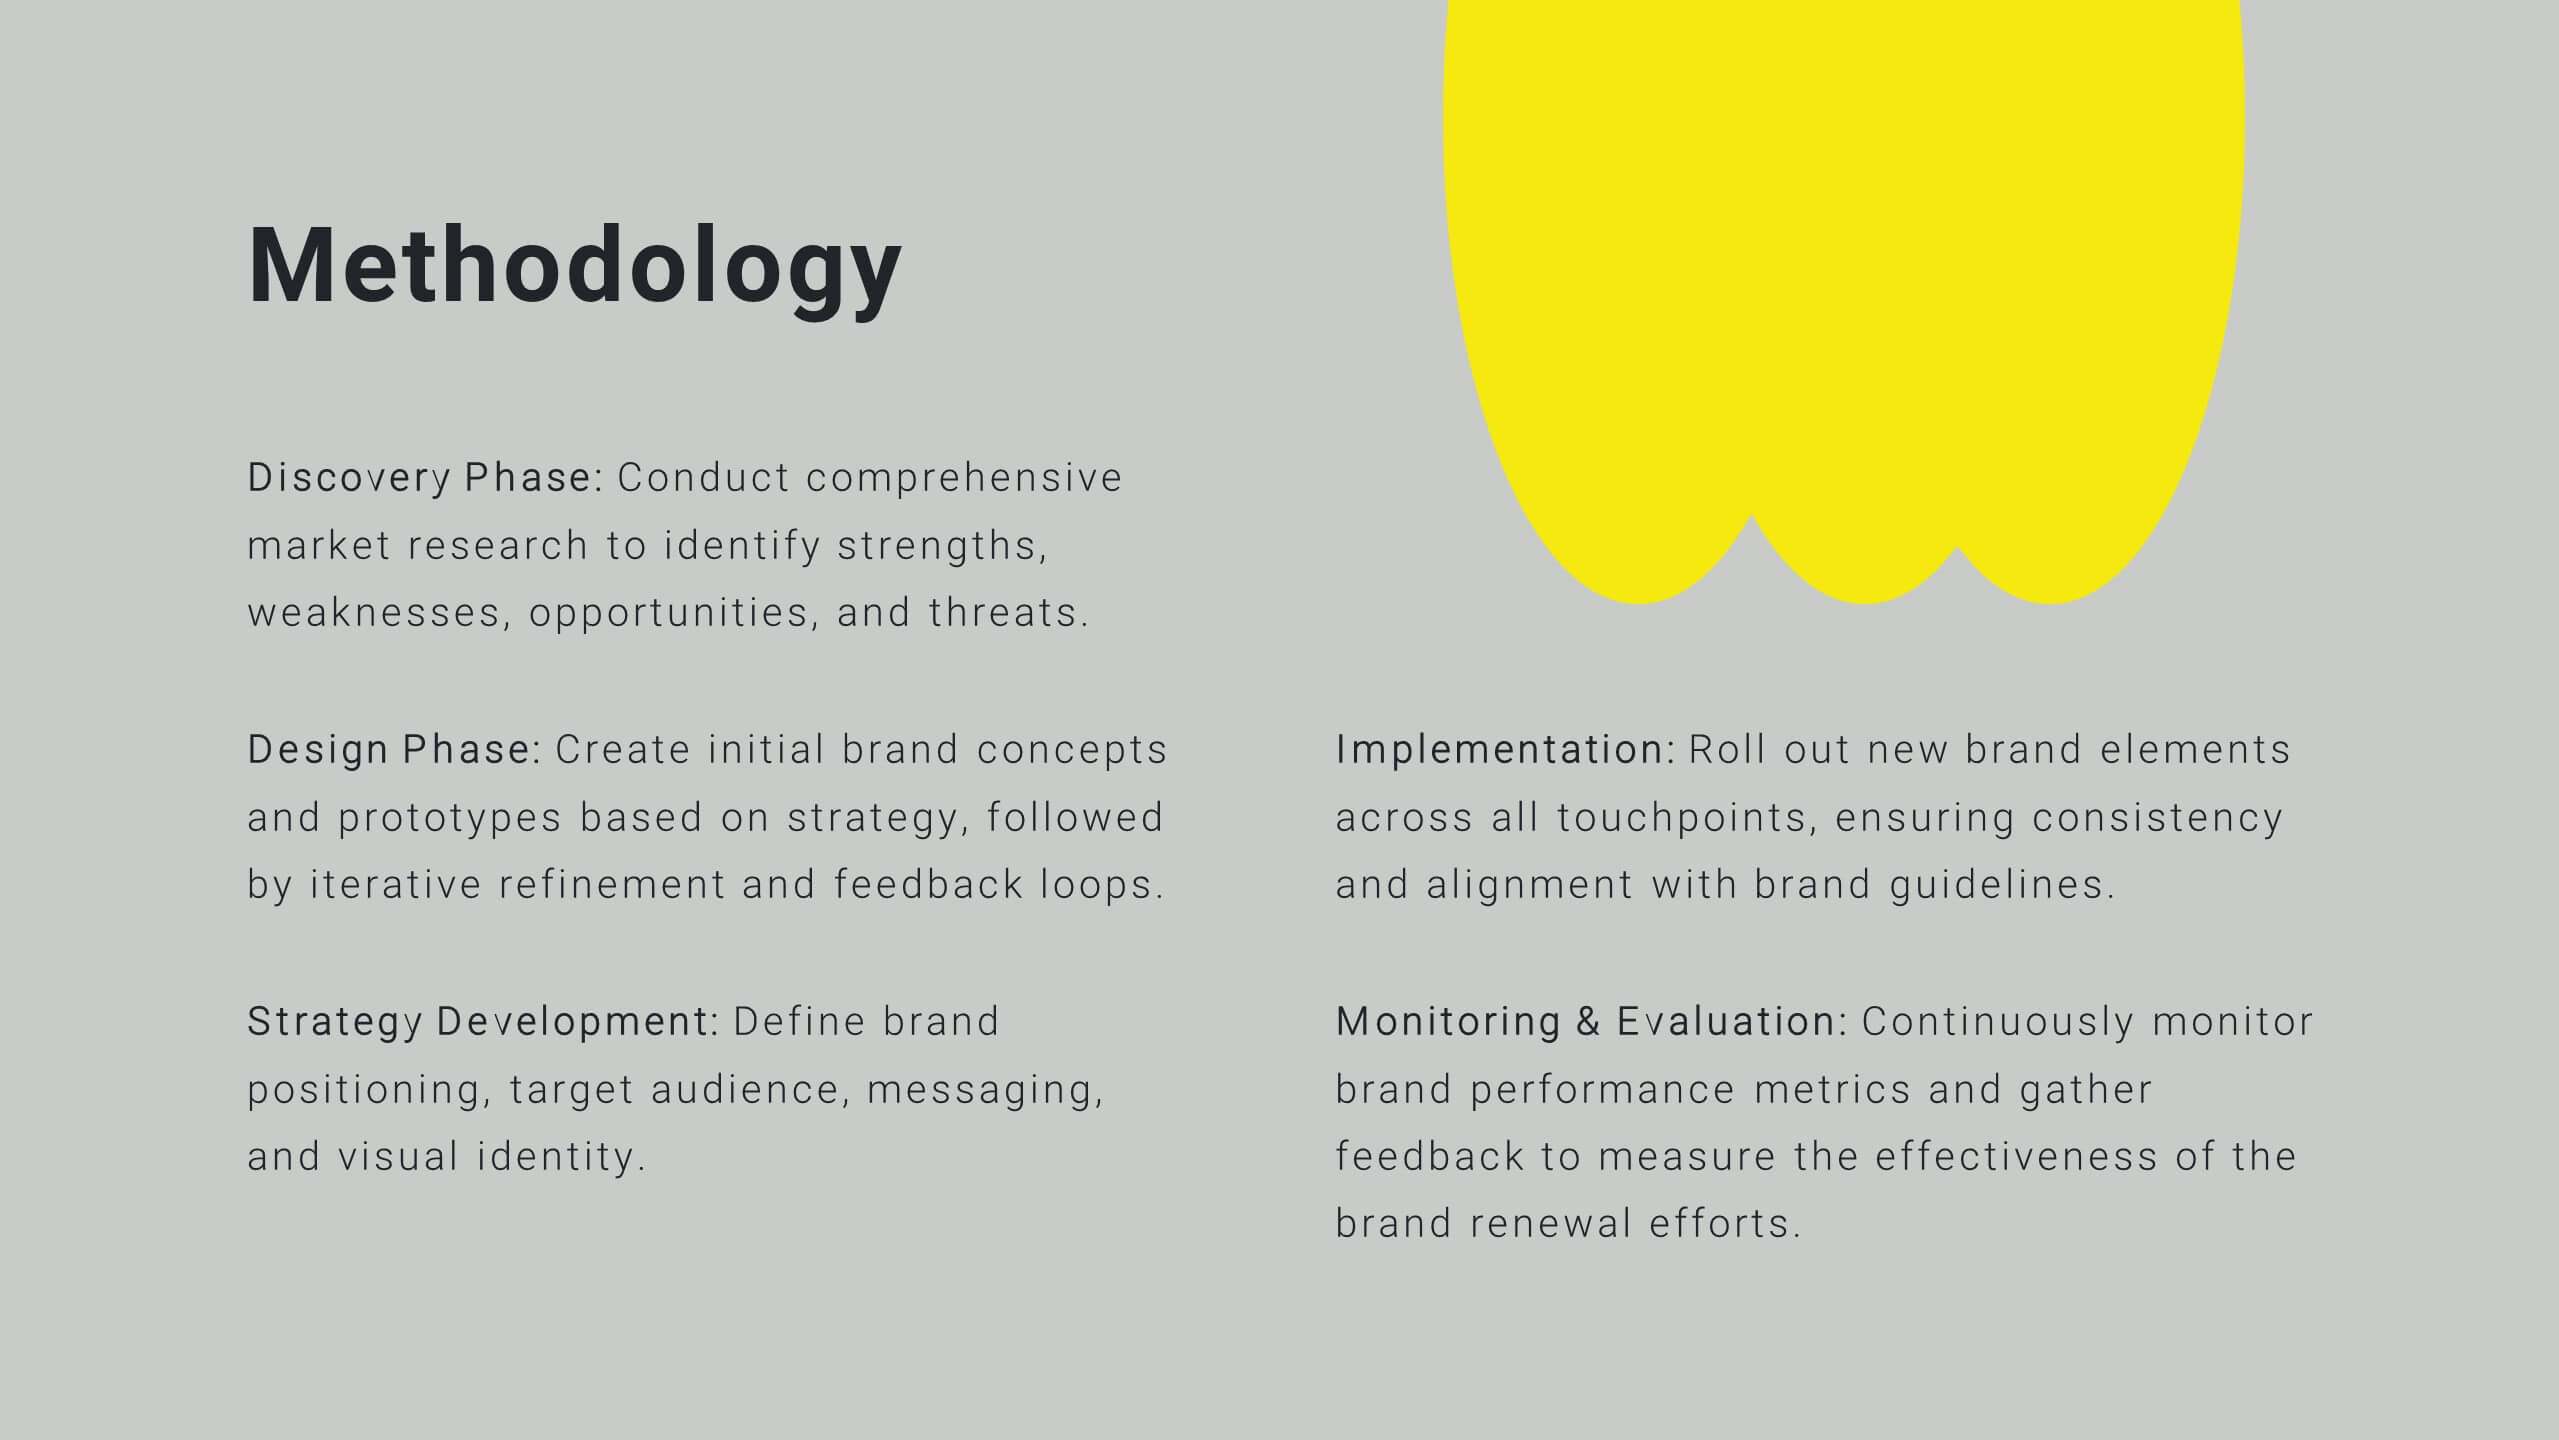
Faelight Project Proposal Presentation
A professional project proposal template for showcasing company overview, objectives, scope of work, timelines, and budget breakdowns. Includes sections for client testimonials, pricing structures, and risk mitigation strategies. Fully customizable for various industries and ideal for pitching new projects. Compatible with PowerPoint, Keynote, and Google Slides for seamless presentations.


21 diapositivas
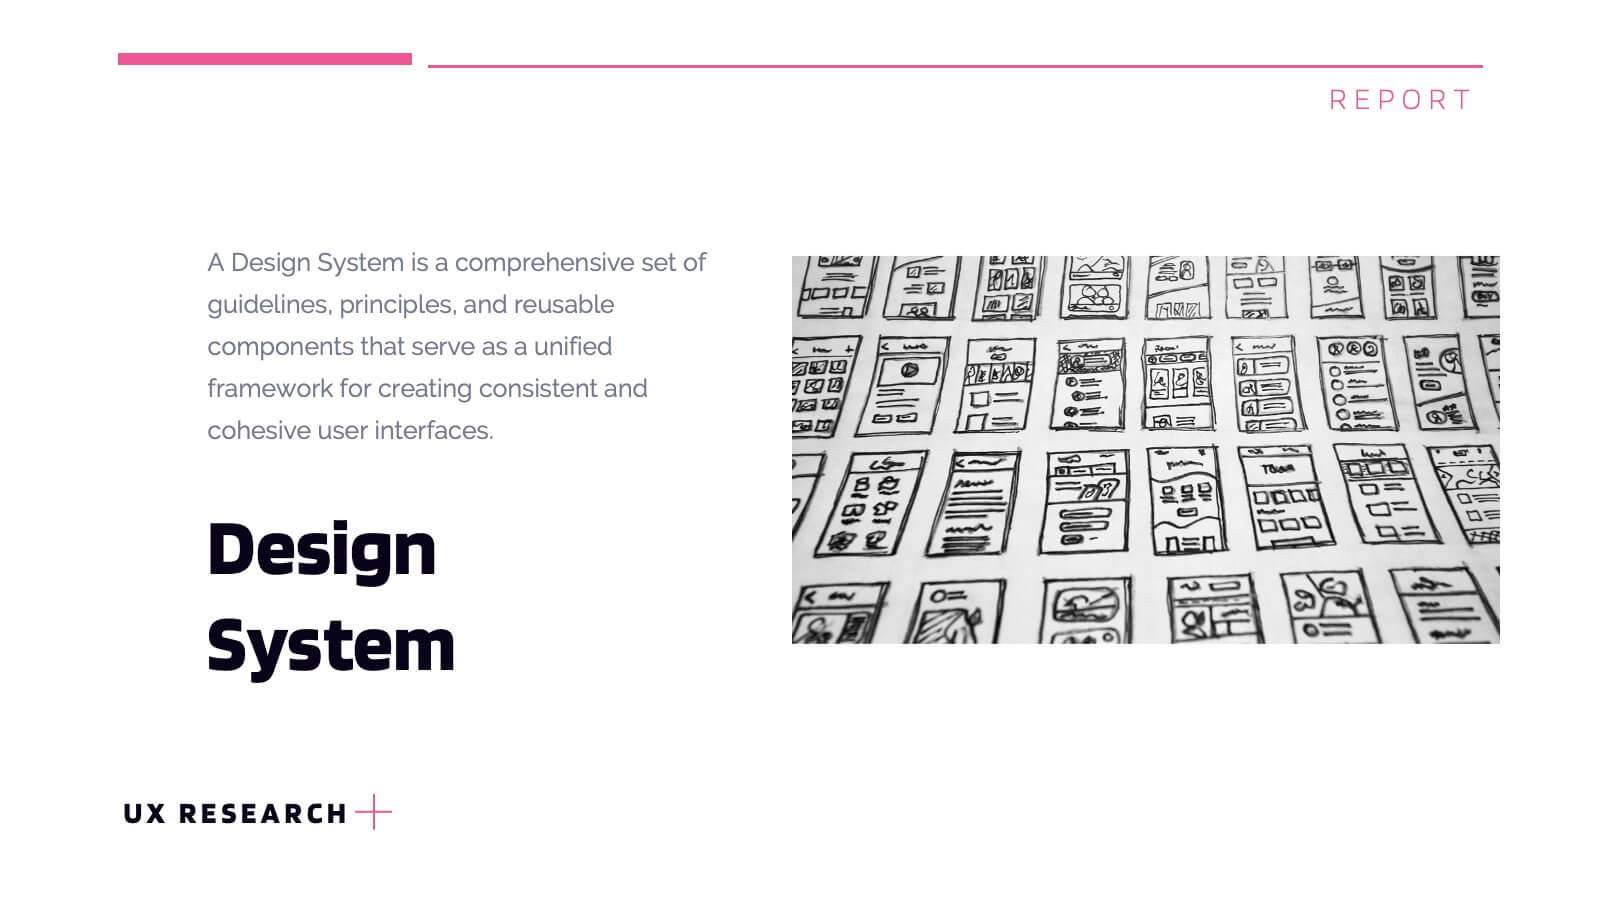
Lumascend UX Research Report Presentation
Present your UX research findings with clarity using this engaging and organized template! Covering key areas like user personas, wireframes, testing, and interaction design, it ensures all aspects of your design process are communicated effectively. Perfect for UX teams, stakeholders, or client presentations, this template works seamlessly with PowerPoint, Keynote, and Google Slides.


6 diapositivas
Solution Architect Infographics
Our Solution Architect infographic is an exceptional visual aid designed for Powerpoint, Keynote, and Google Slides. This infographic is perfectly suited for solution architects, systems engineers, and IT professionals who need to convey complex architectural solutions in a clear and concise manner. The infographic is structured to outline the components of a solution architecture framework, including the software, hardware, and network infrastructure. It helps in visualizing the relationships between different system components, making it easier to understand how they work together to create a comprehensive solution. Using this infographic in your presentations will not only add a professional touch but also enhance the audience's comprehension of the solution architecture. Whether you're explaining the architecture of a new software system, the integration of various technologies, or the planning of an IT project, this infographic provides a streamlined way to share that information, ensuring your concepts are communicated effectively.


4 diapositivas
Business Information Security Compliance Presentation
Ensure your systems meet security standards with the Business Information Security Compliance presentation slide. Designed with a central cloud and laptop graphic surrounded by icons representing data, user access, encryption, and compliance checks, this layout is perfect for illustrating IT governance, risk management, and data protection protocols. Fully customizable in PowerPoint, Keynote, and Google Slides.


7 diapositivas
Product Life Cycle Infographic Presentation Template
The product life cycle is a theoretical model that describes the stages a product goes through during its lifetime, from its introduction to the market until its eventual decline and removal from the market. Use this presentation template as a visual aid to help explain the characteristics and impact of each stage, including introduction, growth, maturity and decline. Our product life cycle template can be use to teach students the concepts of product design, sales and marketing as well. This is a simple and informative way to explain the four basic stages of product development in a simple way.


5 diapositivas
Strategic Business Case Presentation
Make every proposal stand out with a clear, goal-focused design that simplifies your strategic narrative. Ideal for presenting initiatives, project justifications, or decision-making insights, this layout balances visual clarity with professionalism. Fully compatible with PowerPoint, Keynote, and Google Slides for effortless editing and polished presentations.