


Características


¿Tienes alguna pregunta?
Recomendar


4 diapositivas
AI Trends and Use Cases Presentation
Step into the future with a clean, modern layout that makes complex technology easy to grasp and exciting to explore. This presentation helps you break down emerging innovations, real-world applications, and industry opportunities using clear visuals and structured sections. Fully customizable and compatible with PowerPoint, Keynote, and Google Slides.


23 diapositivas
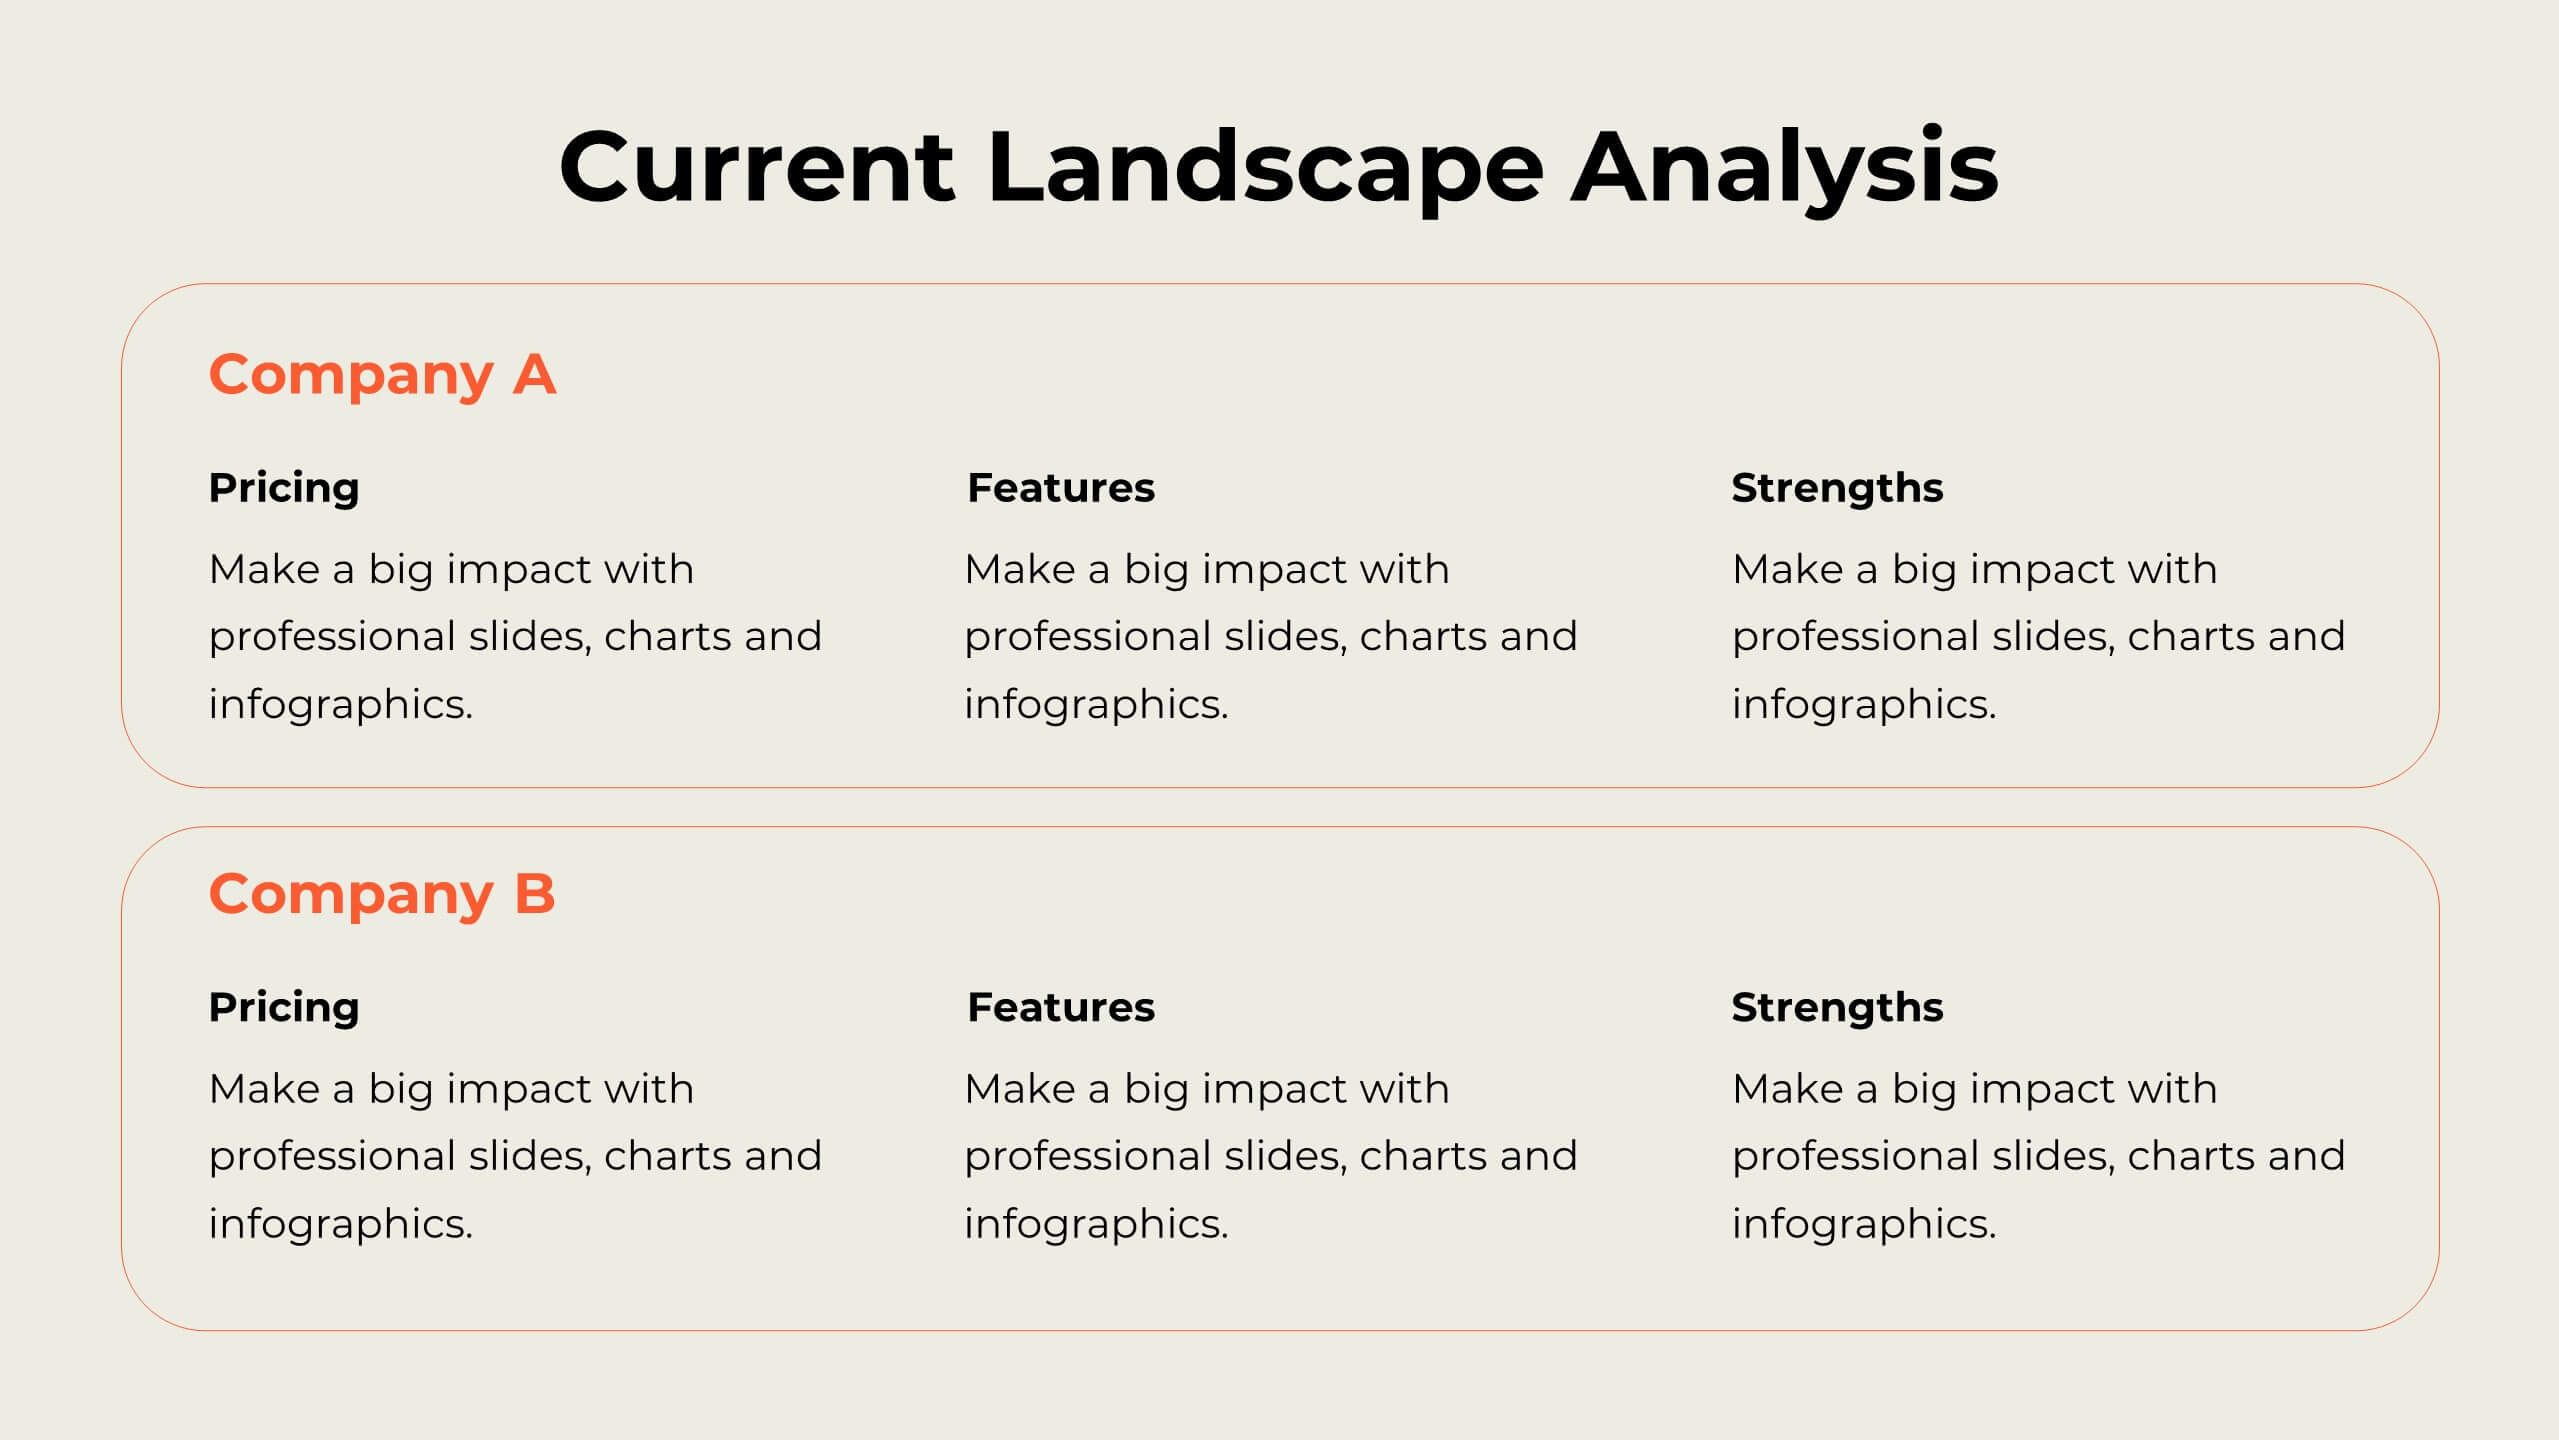
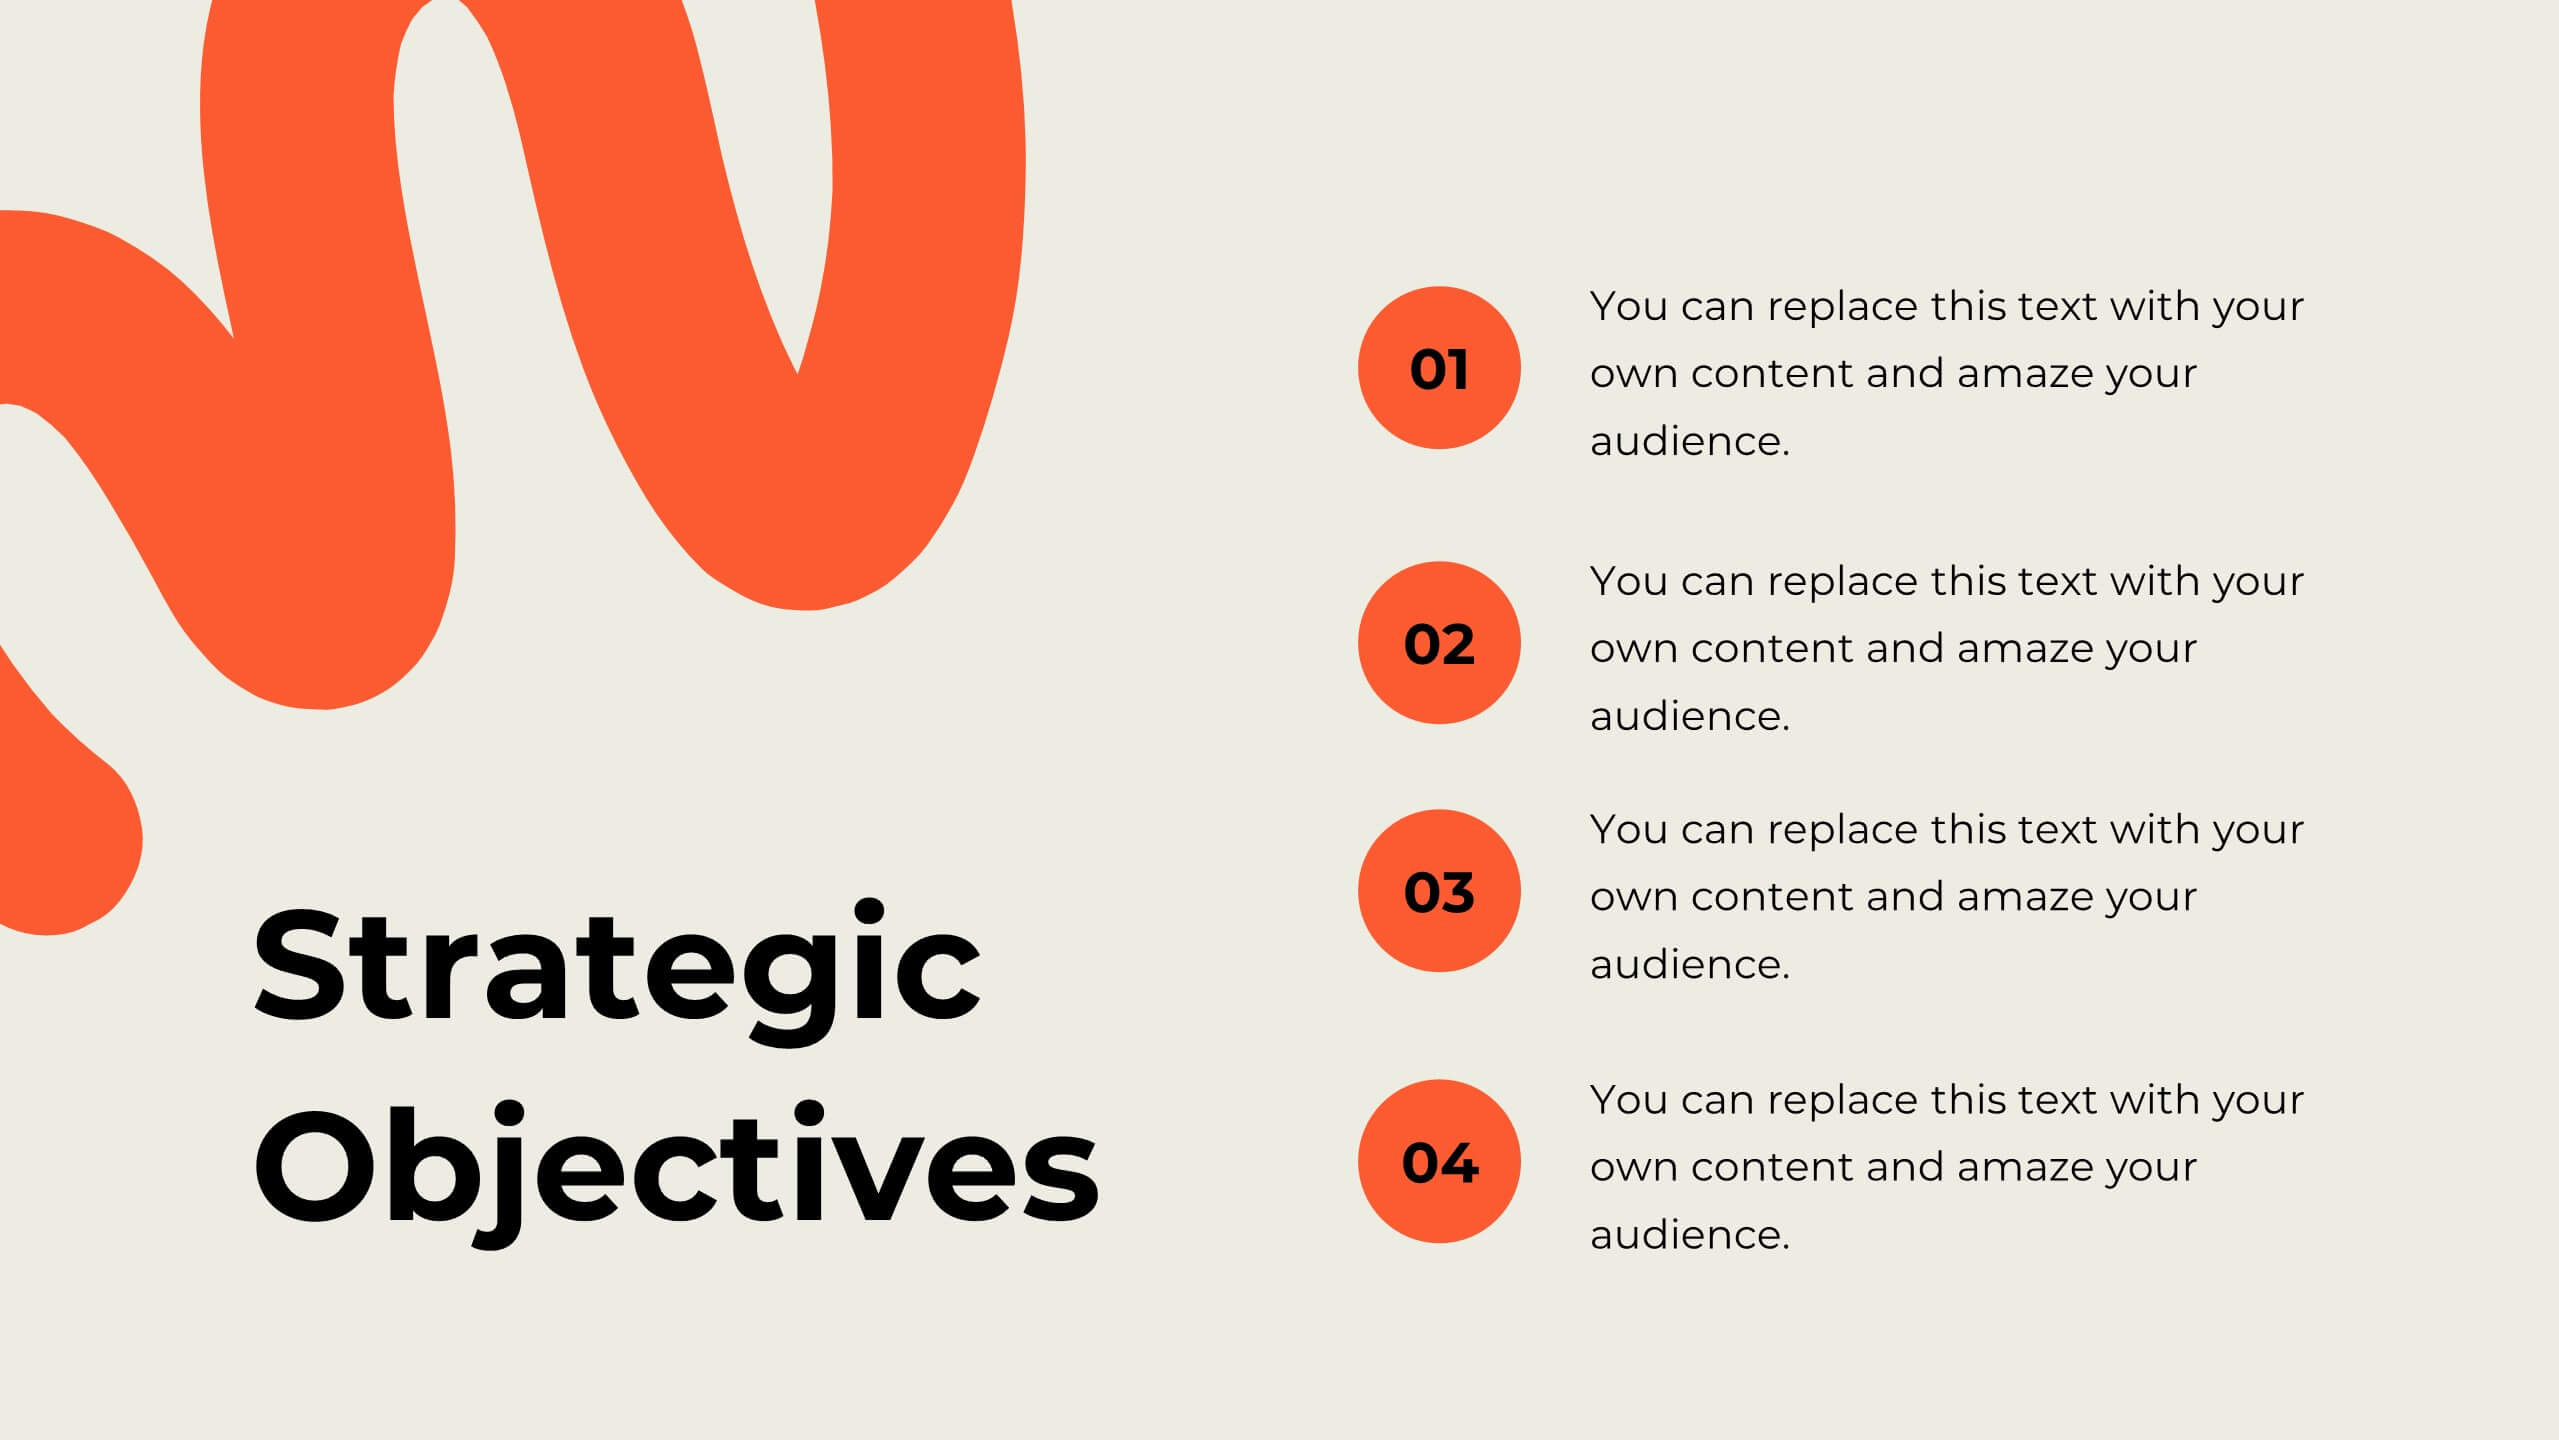
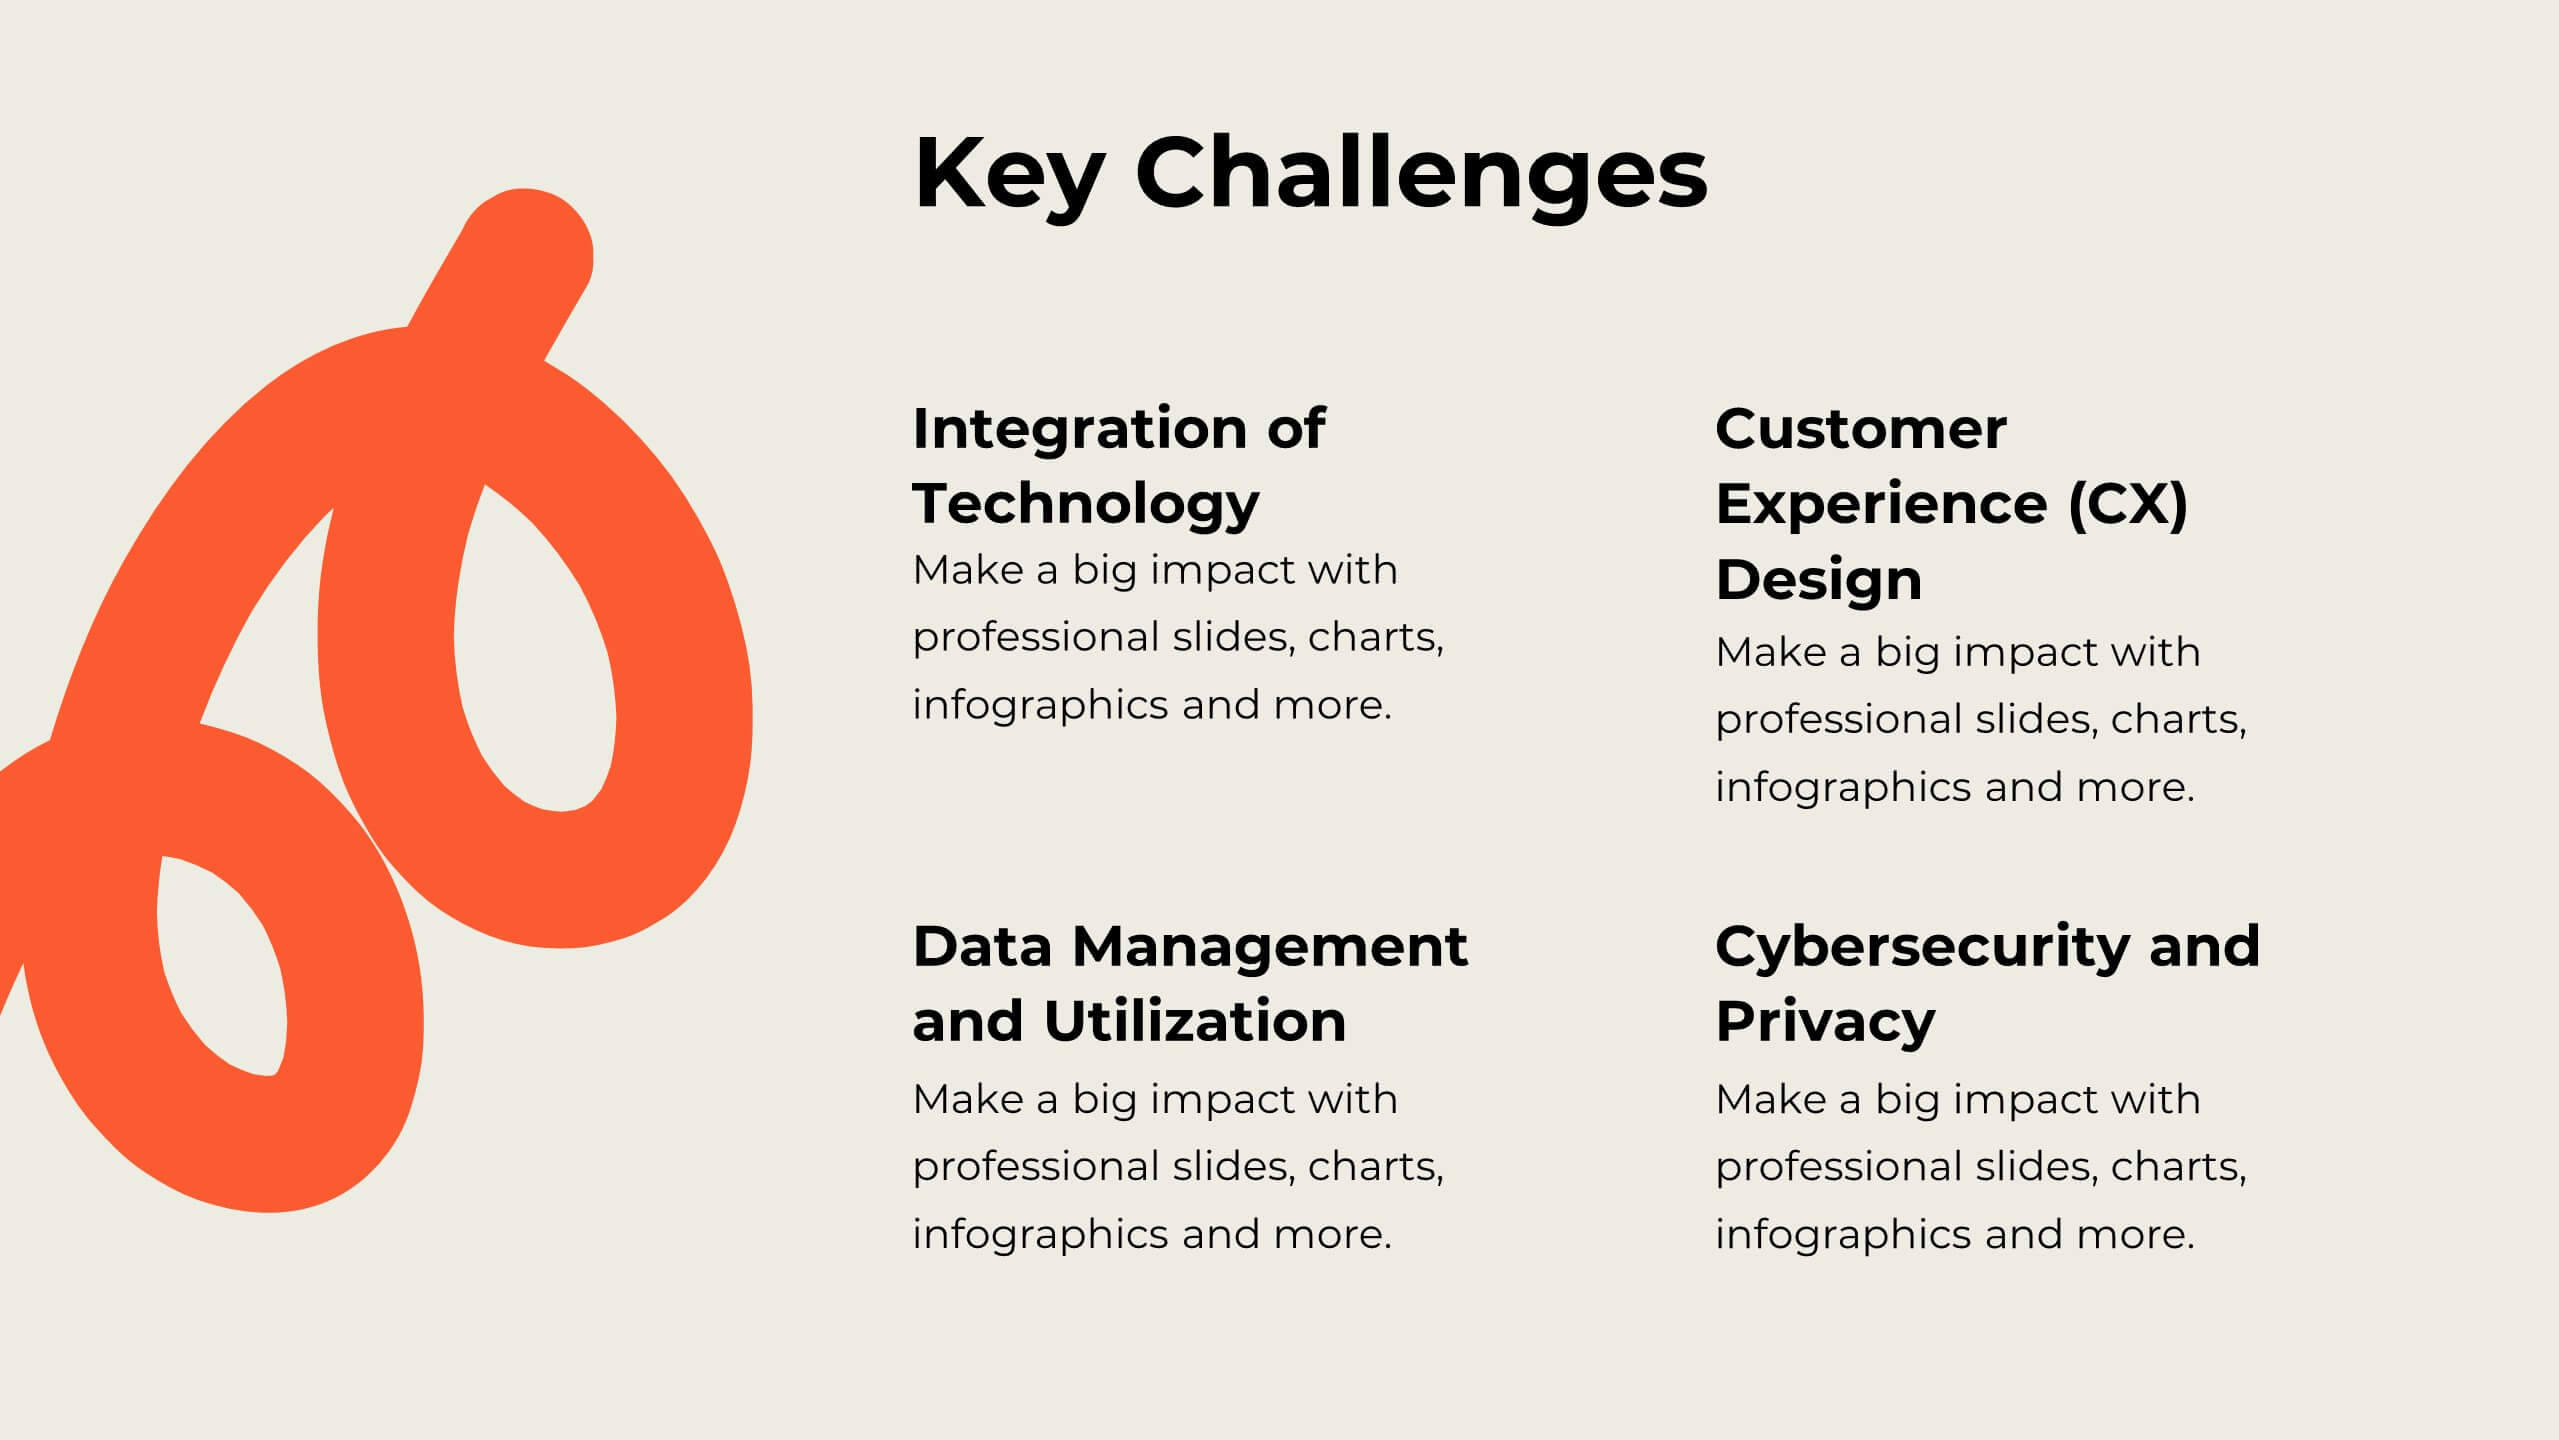
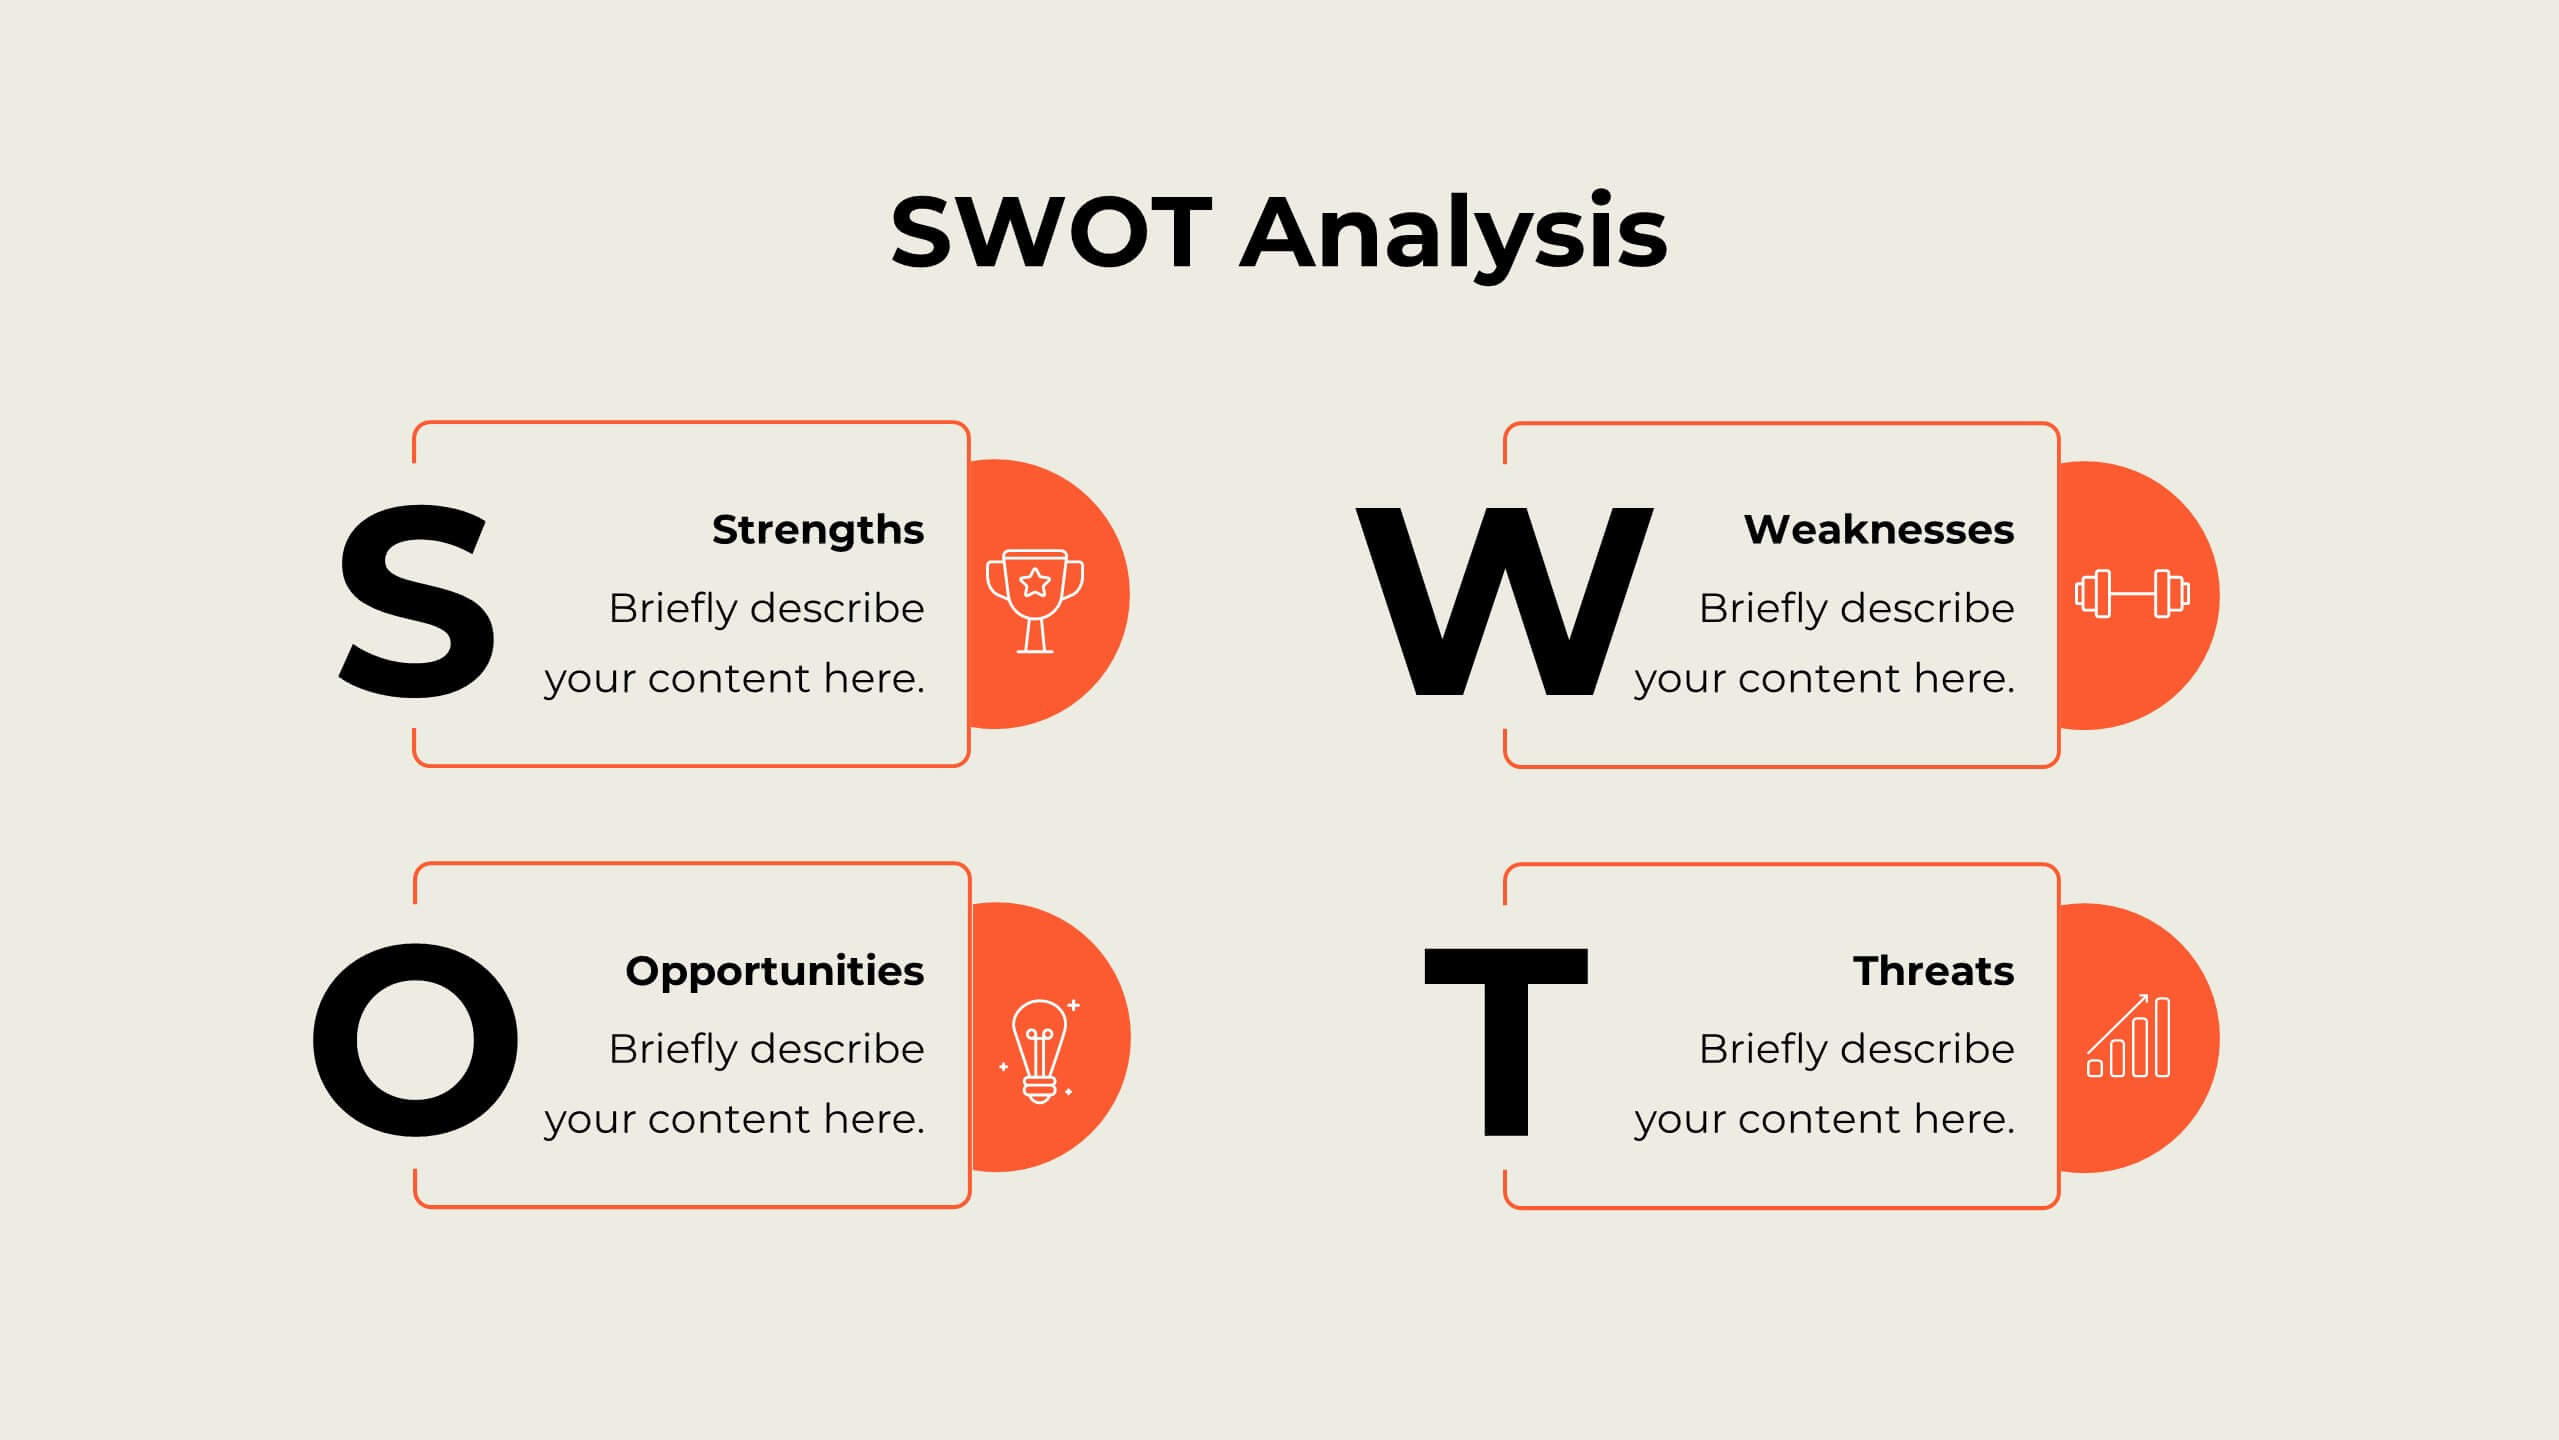
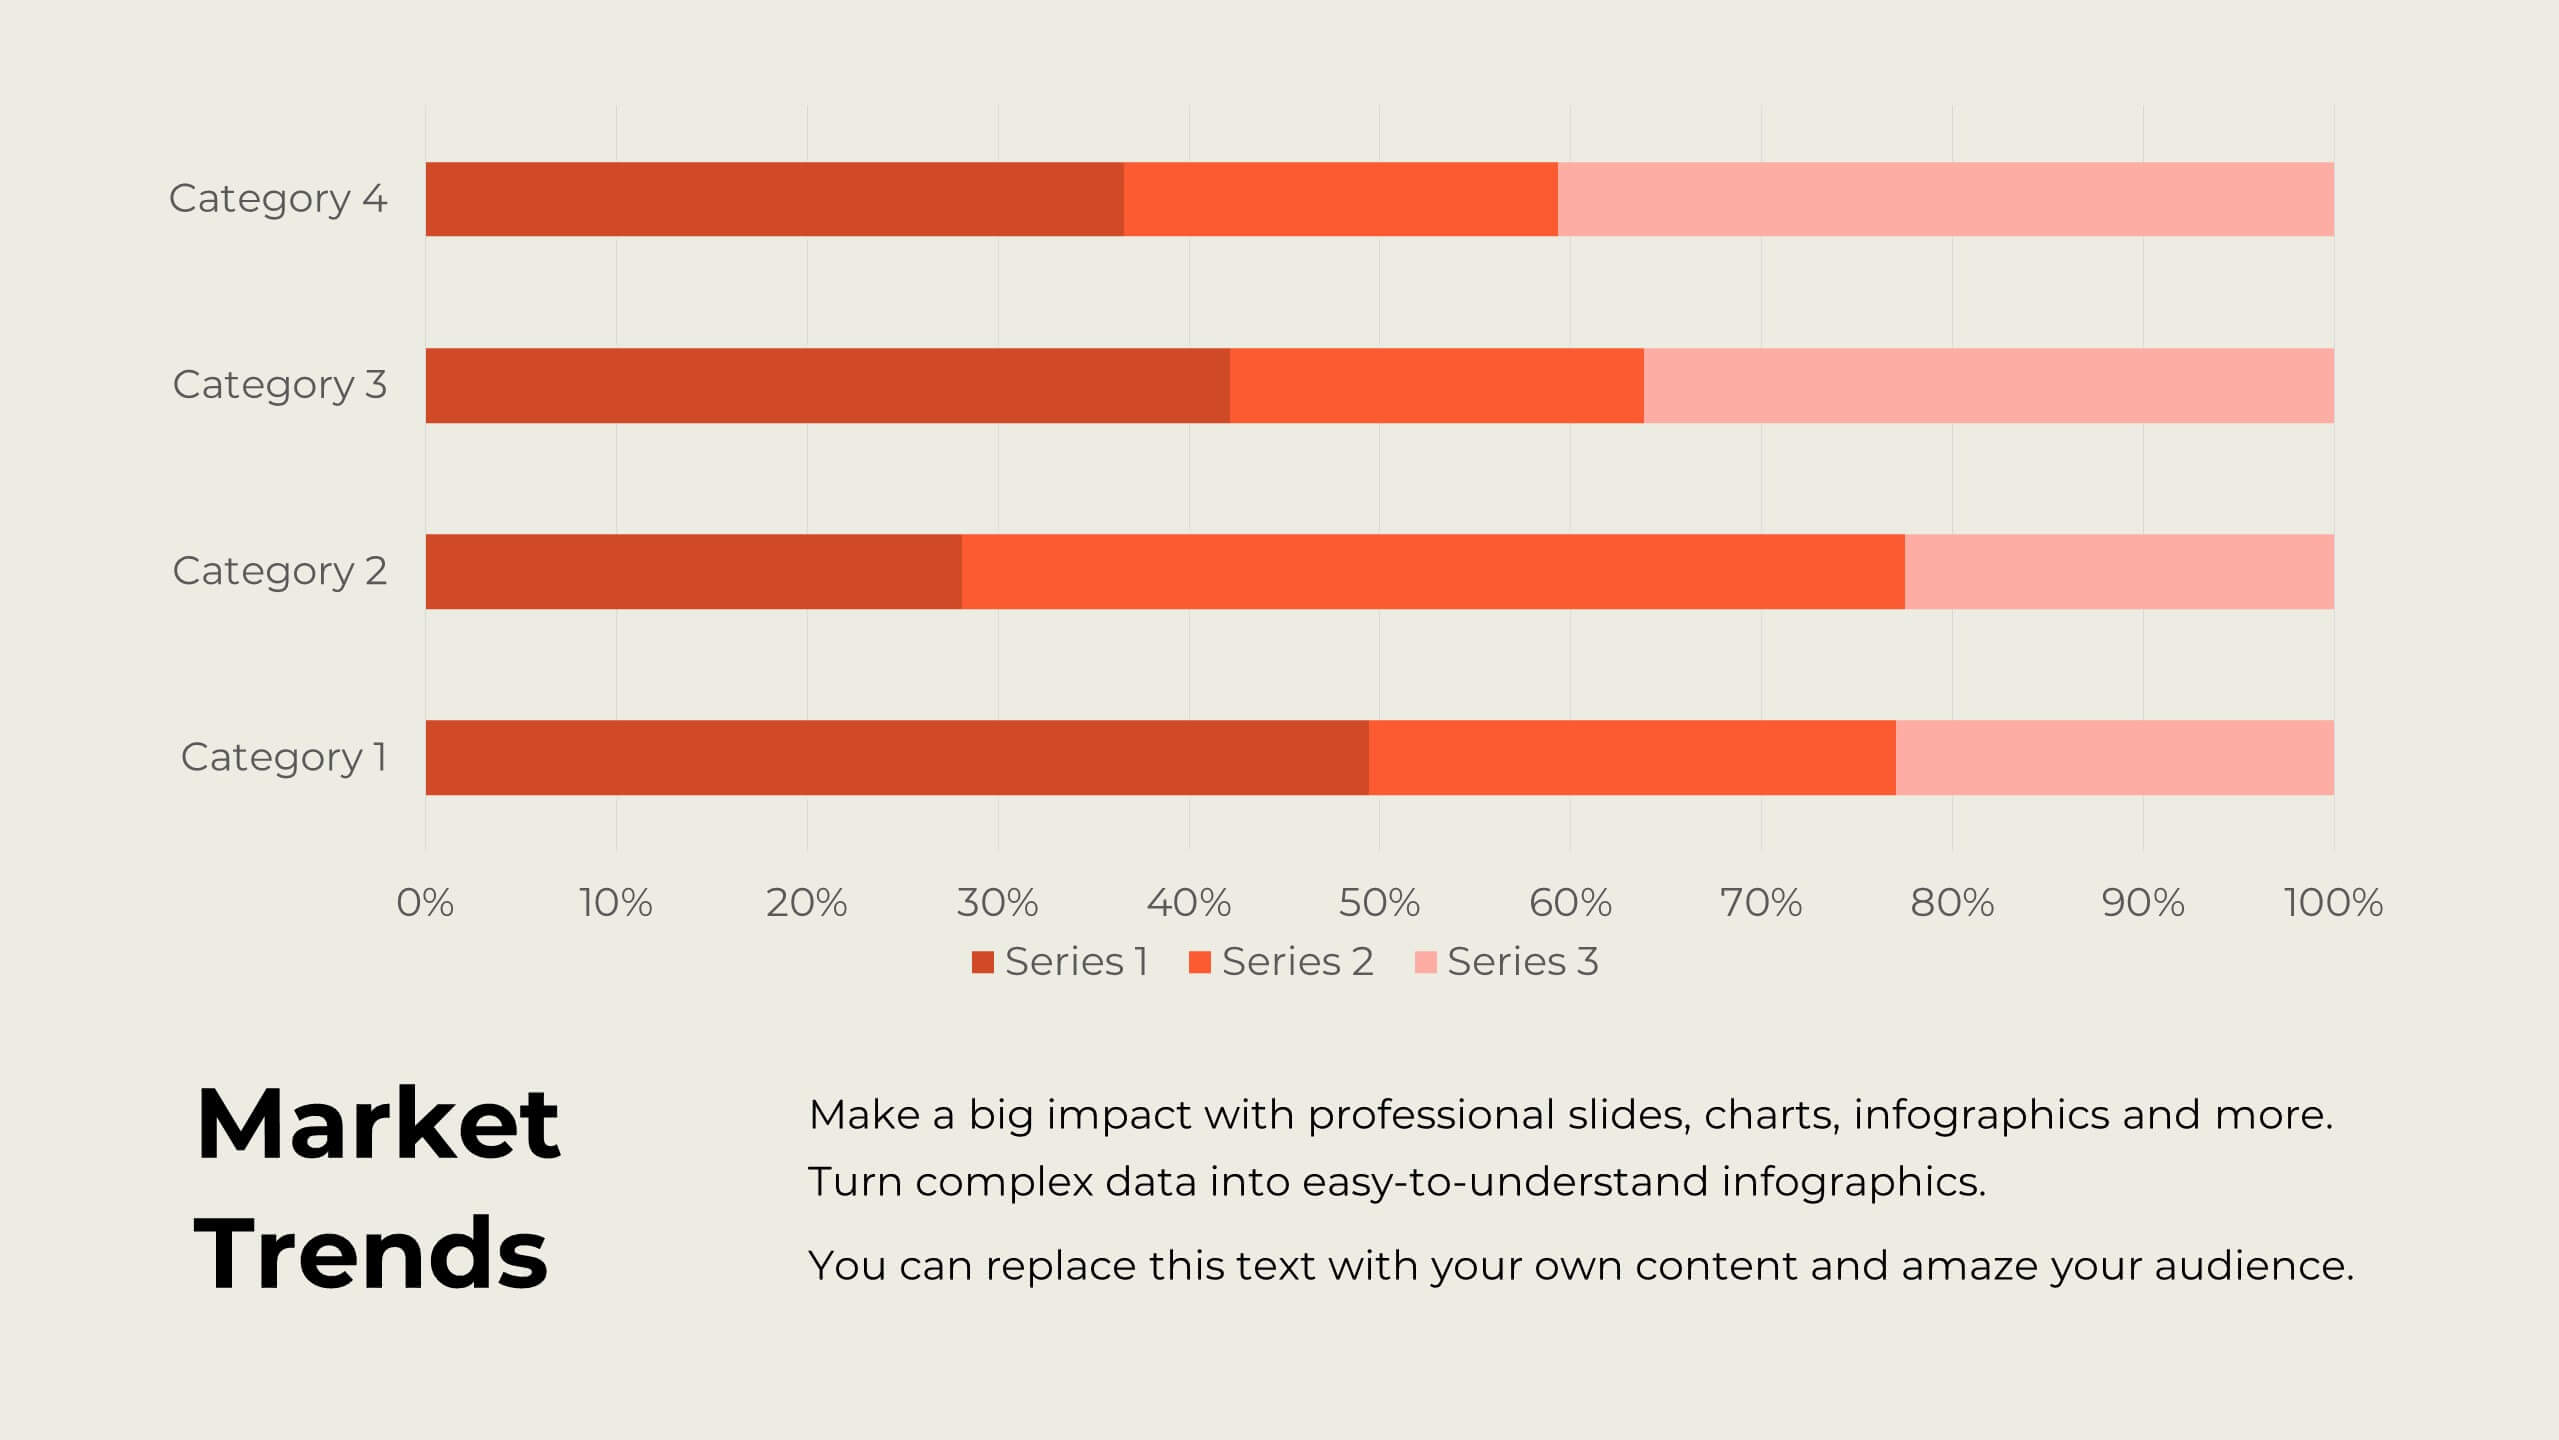
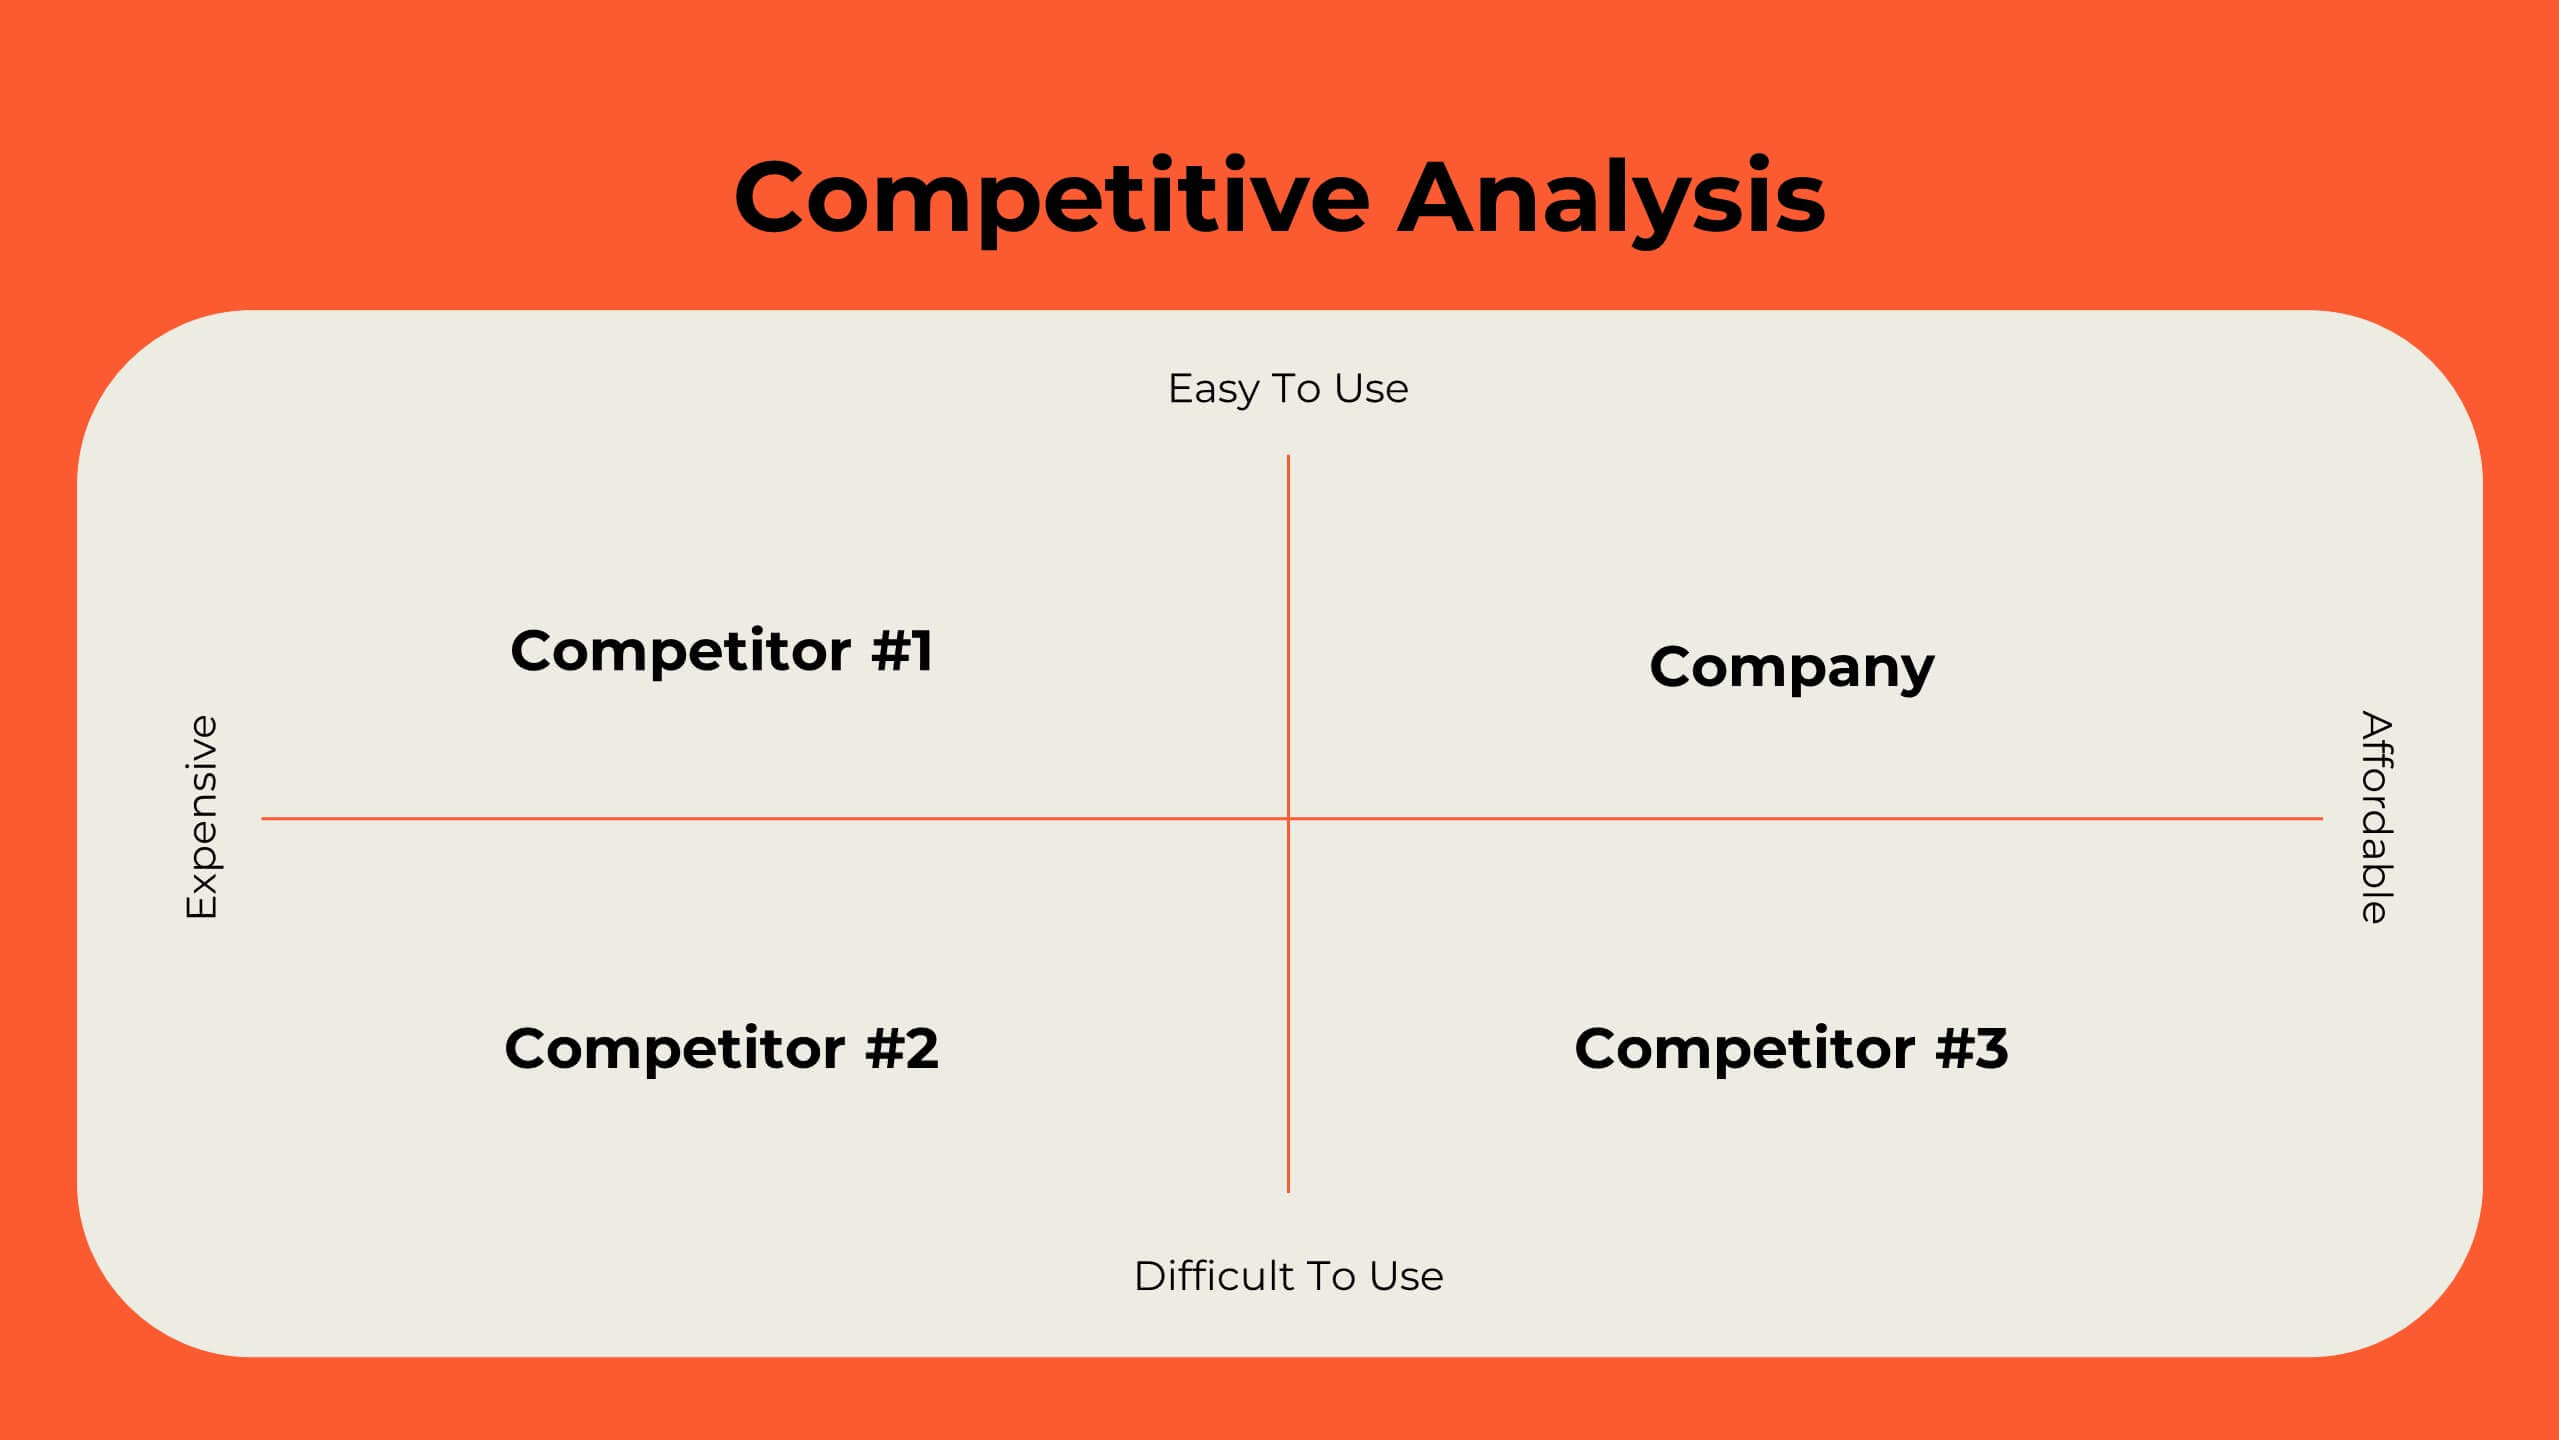
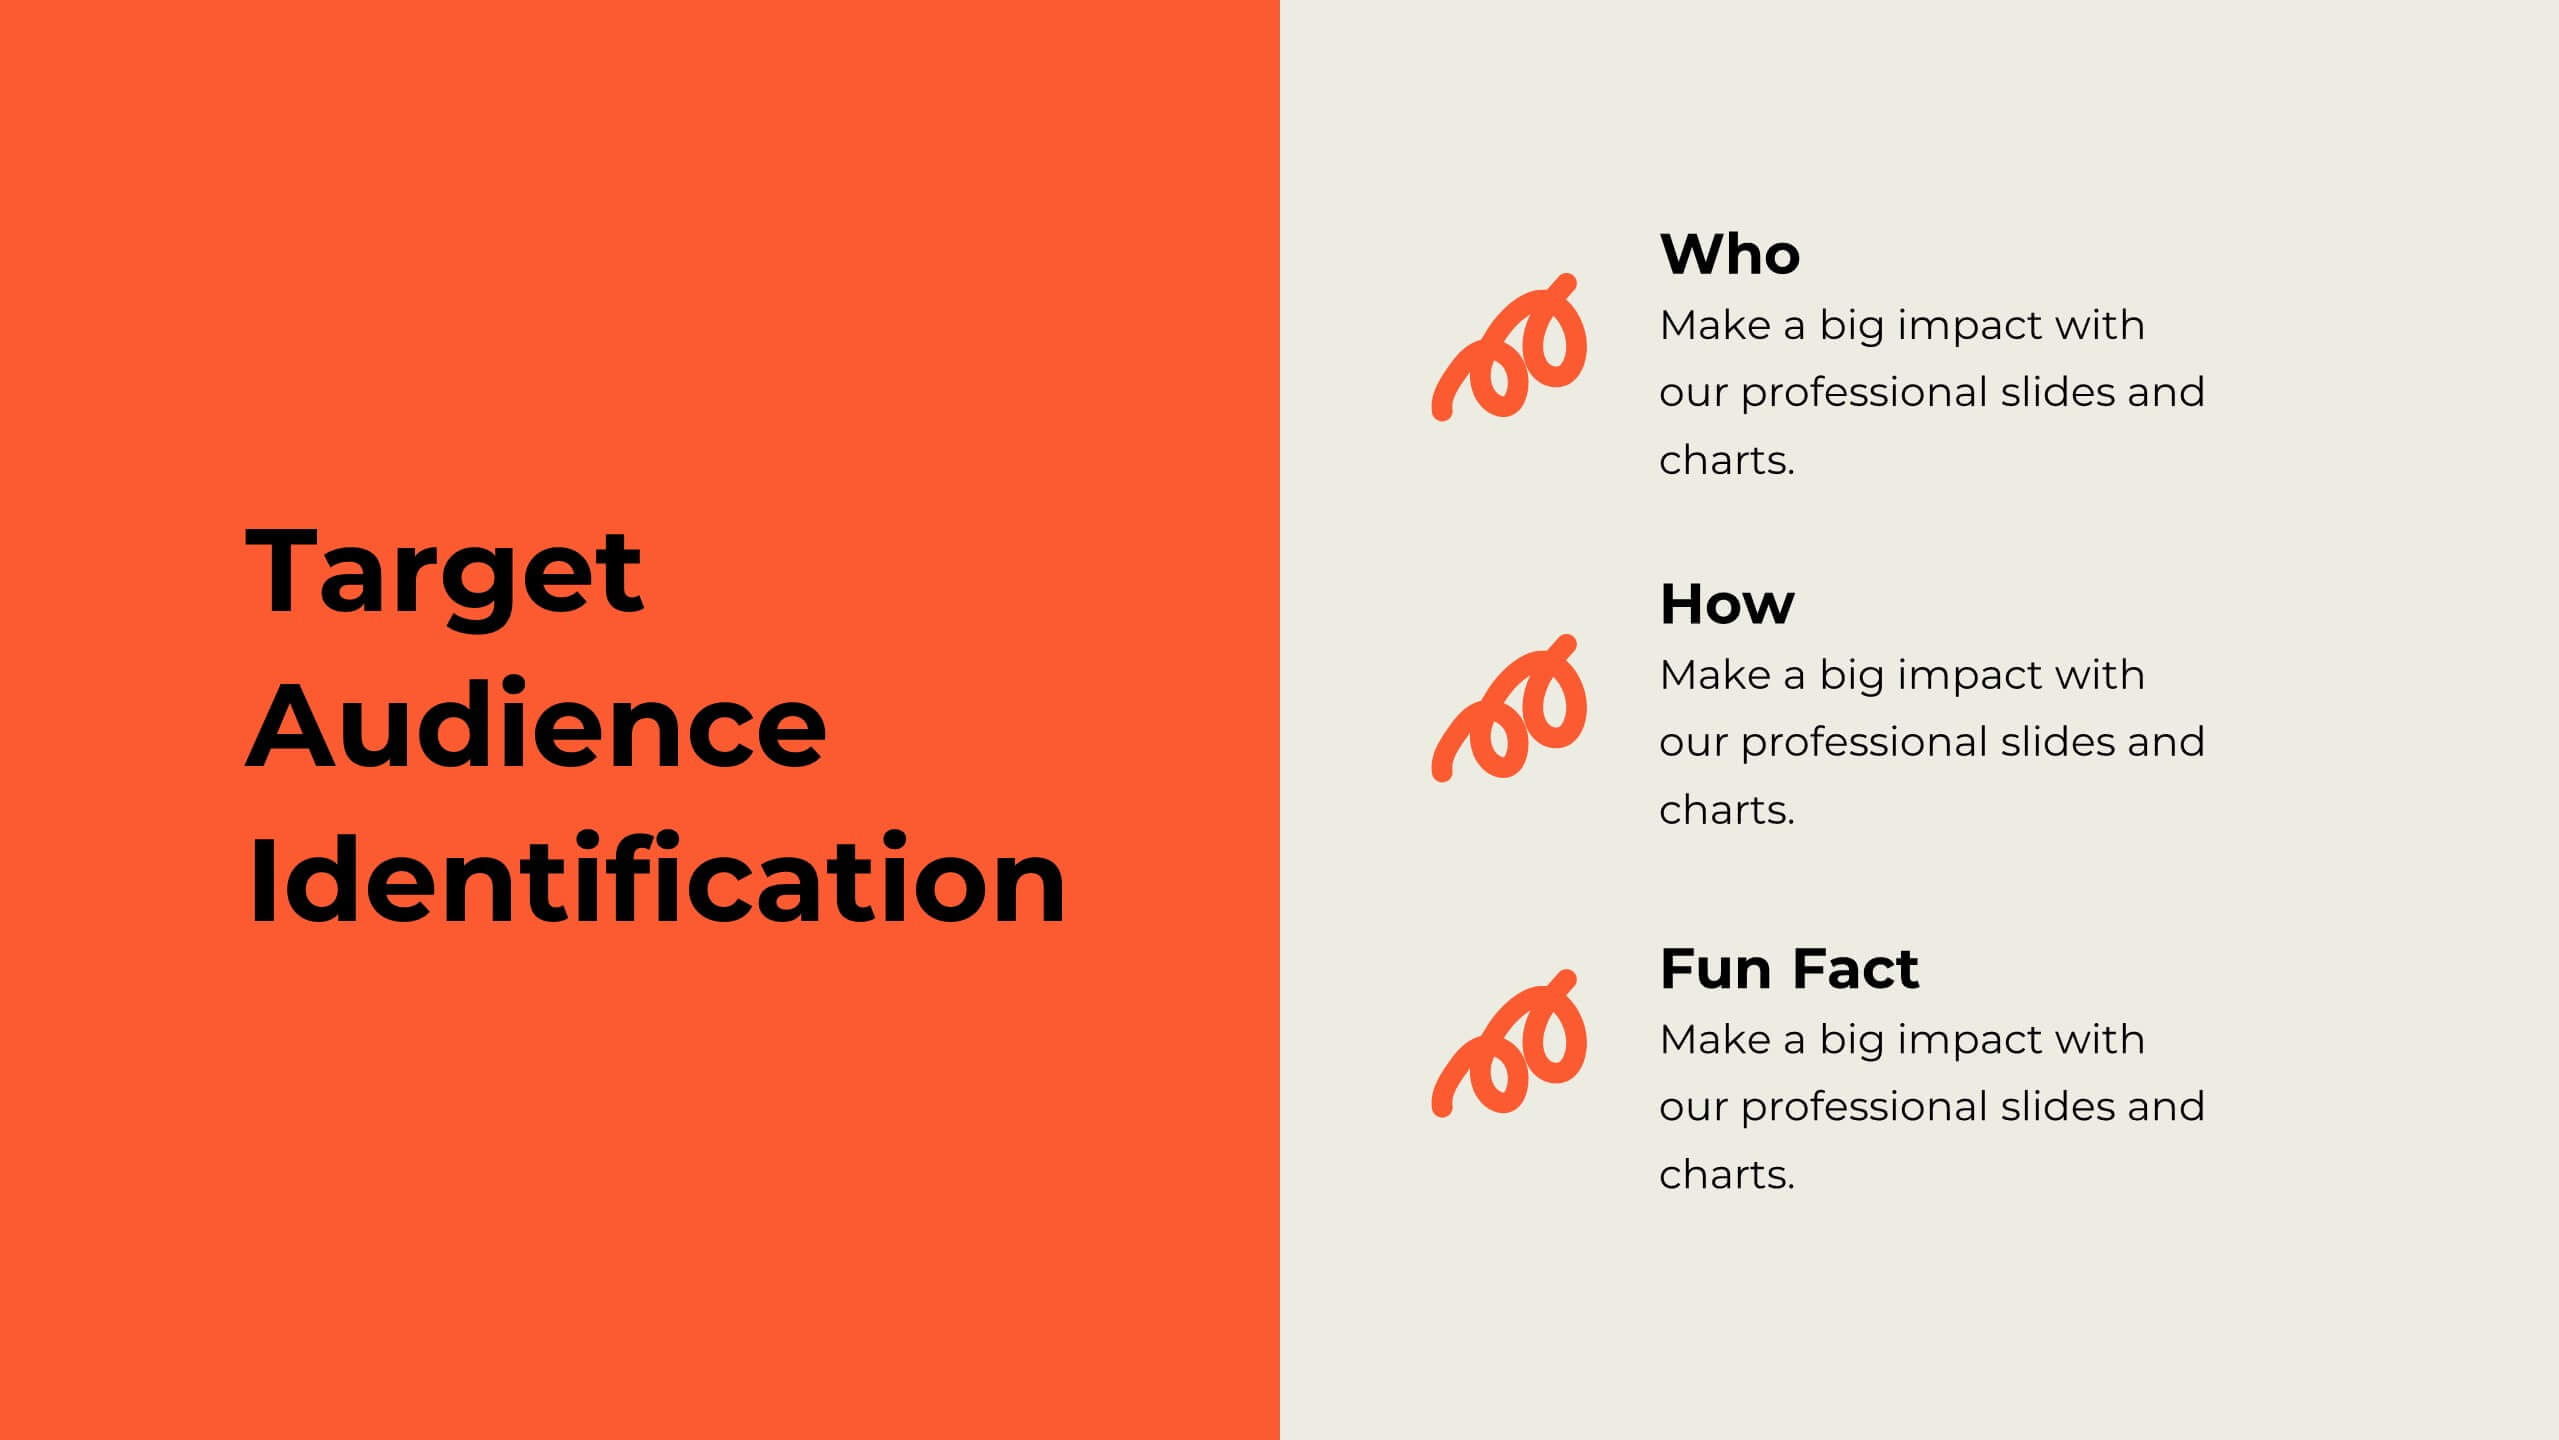
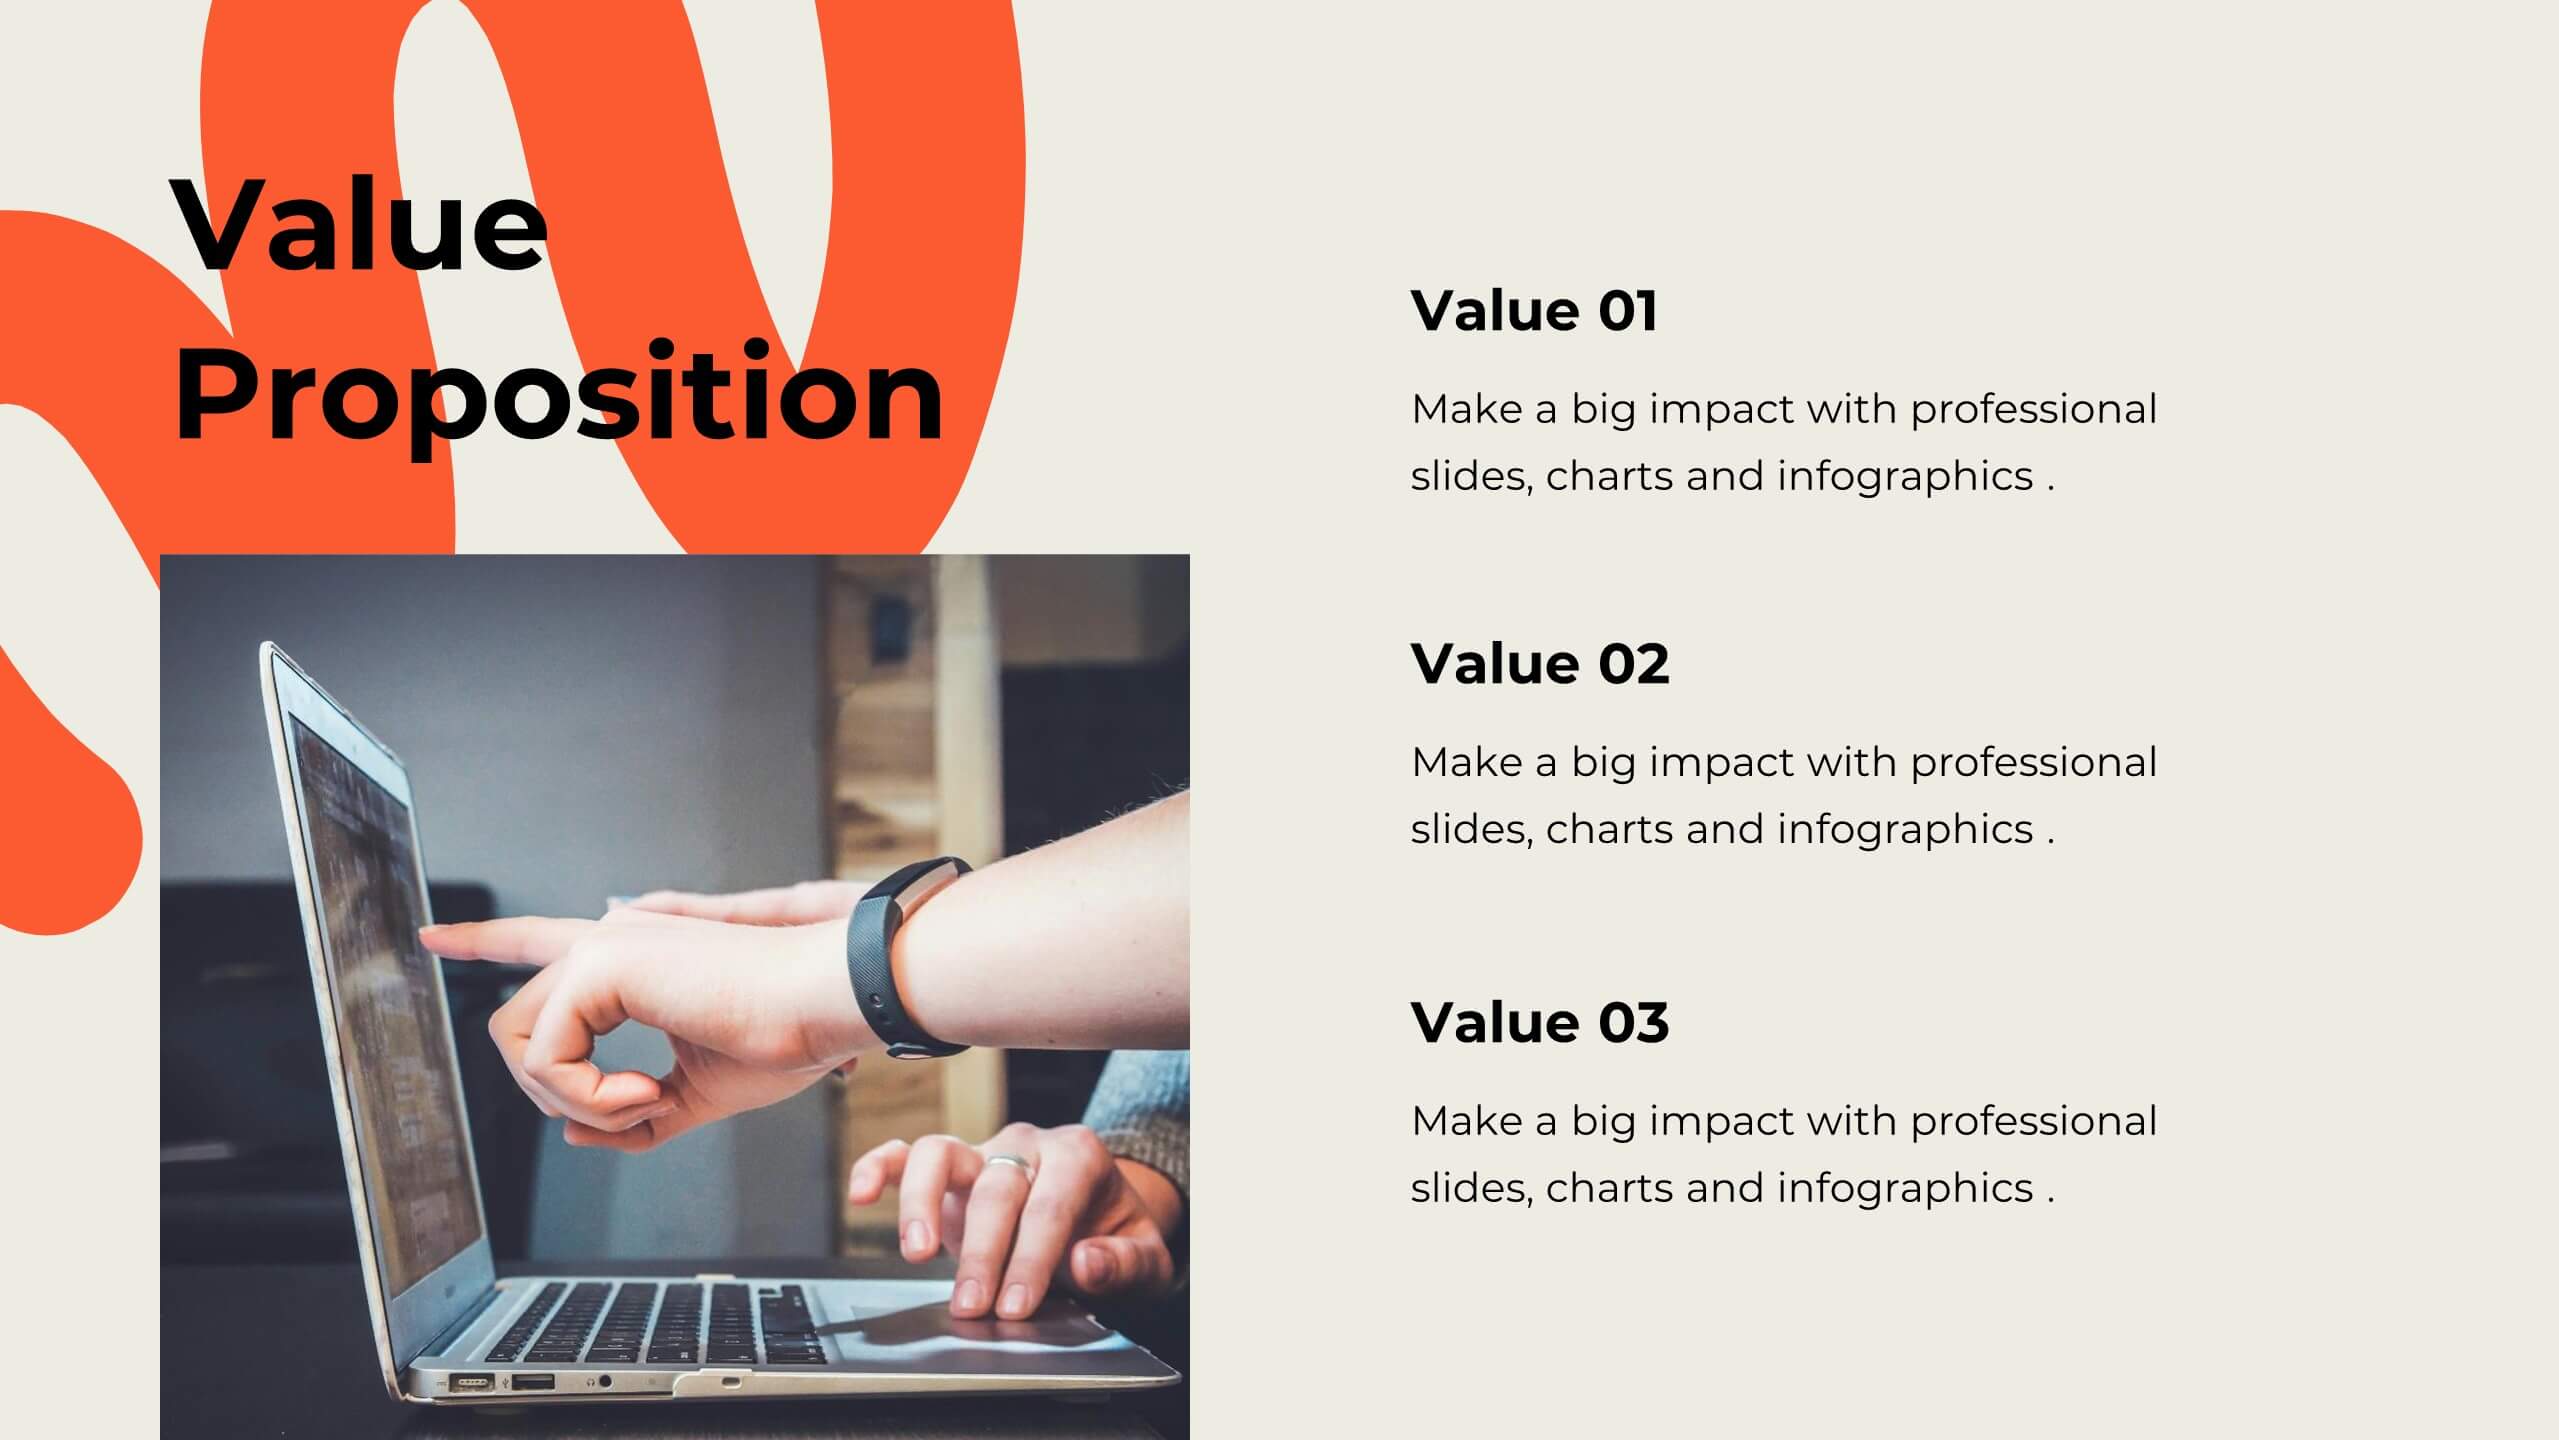
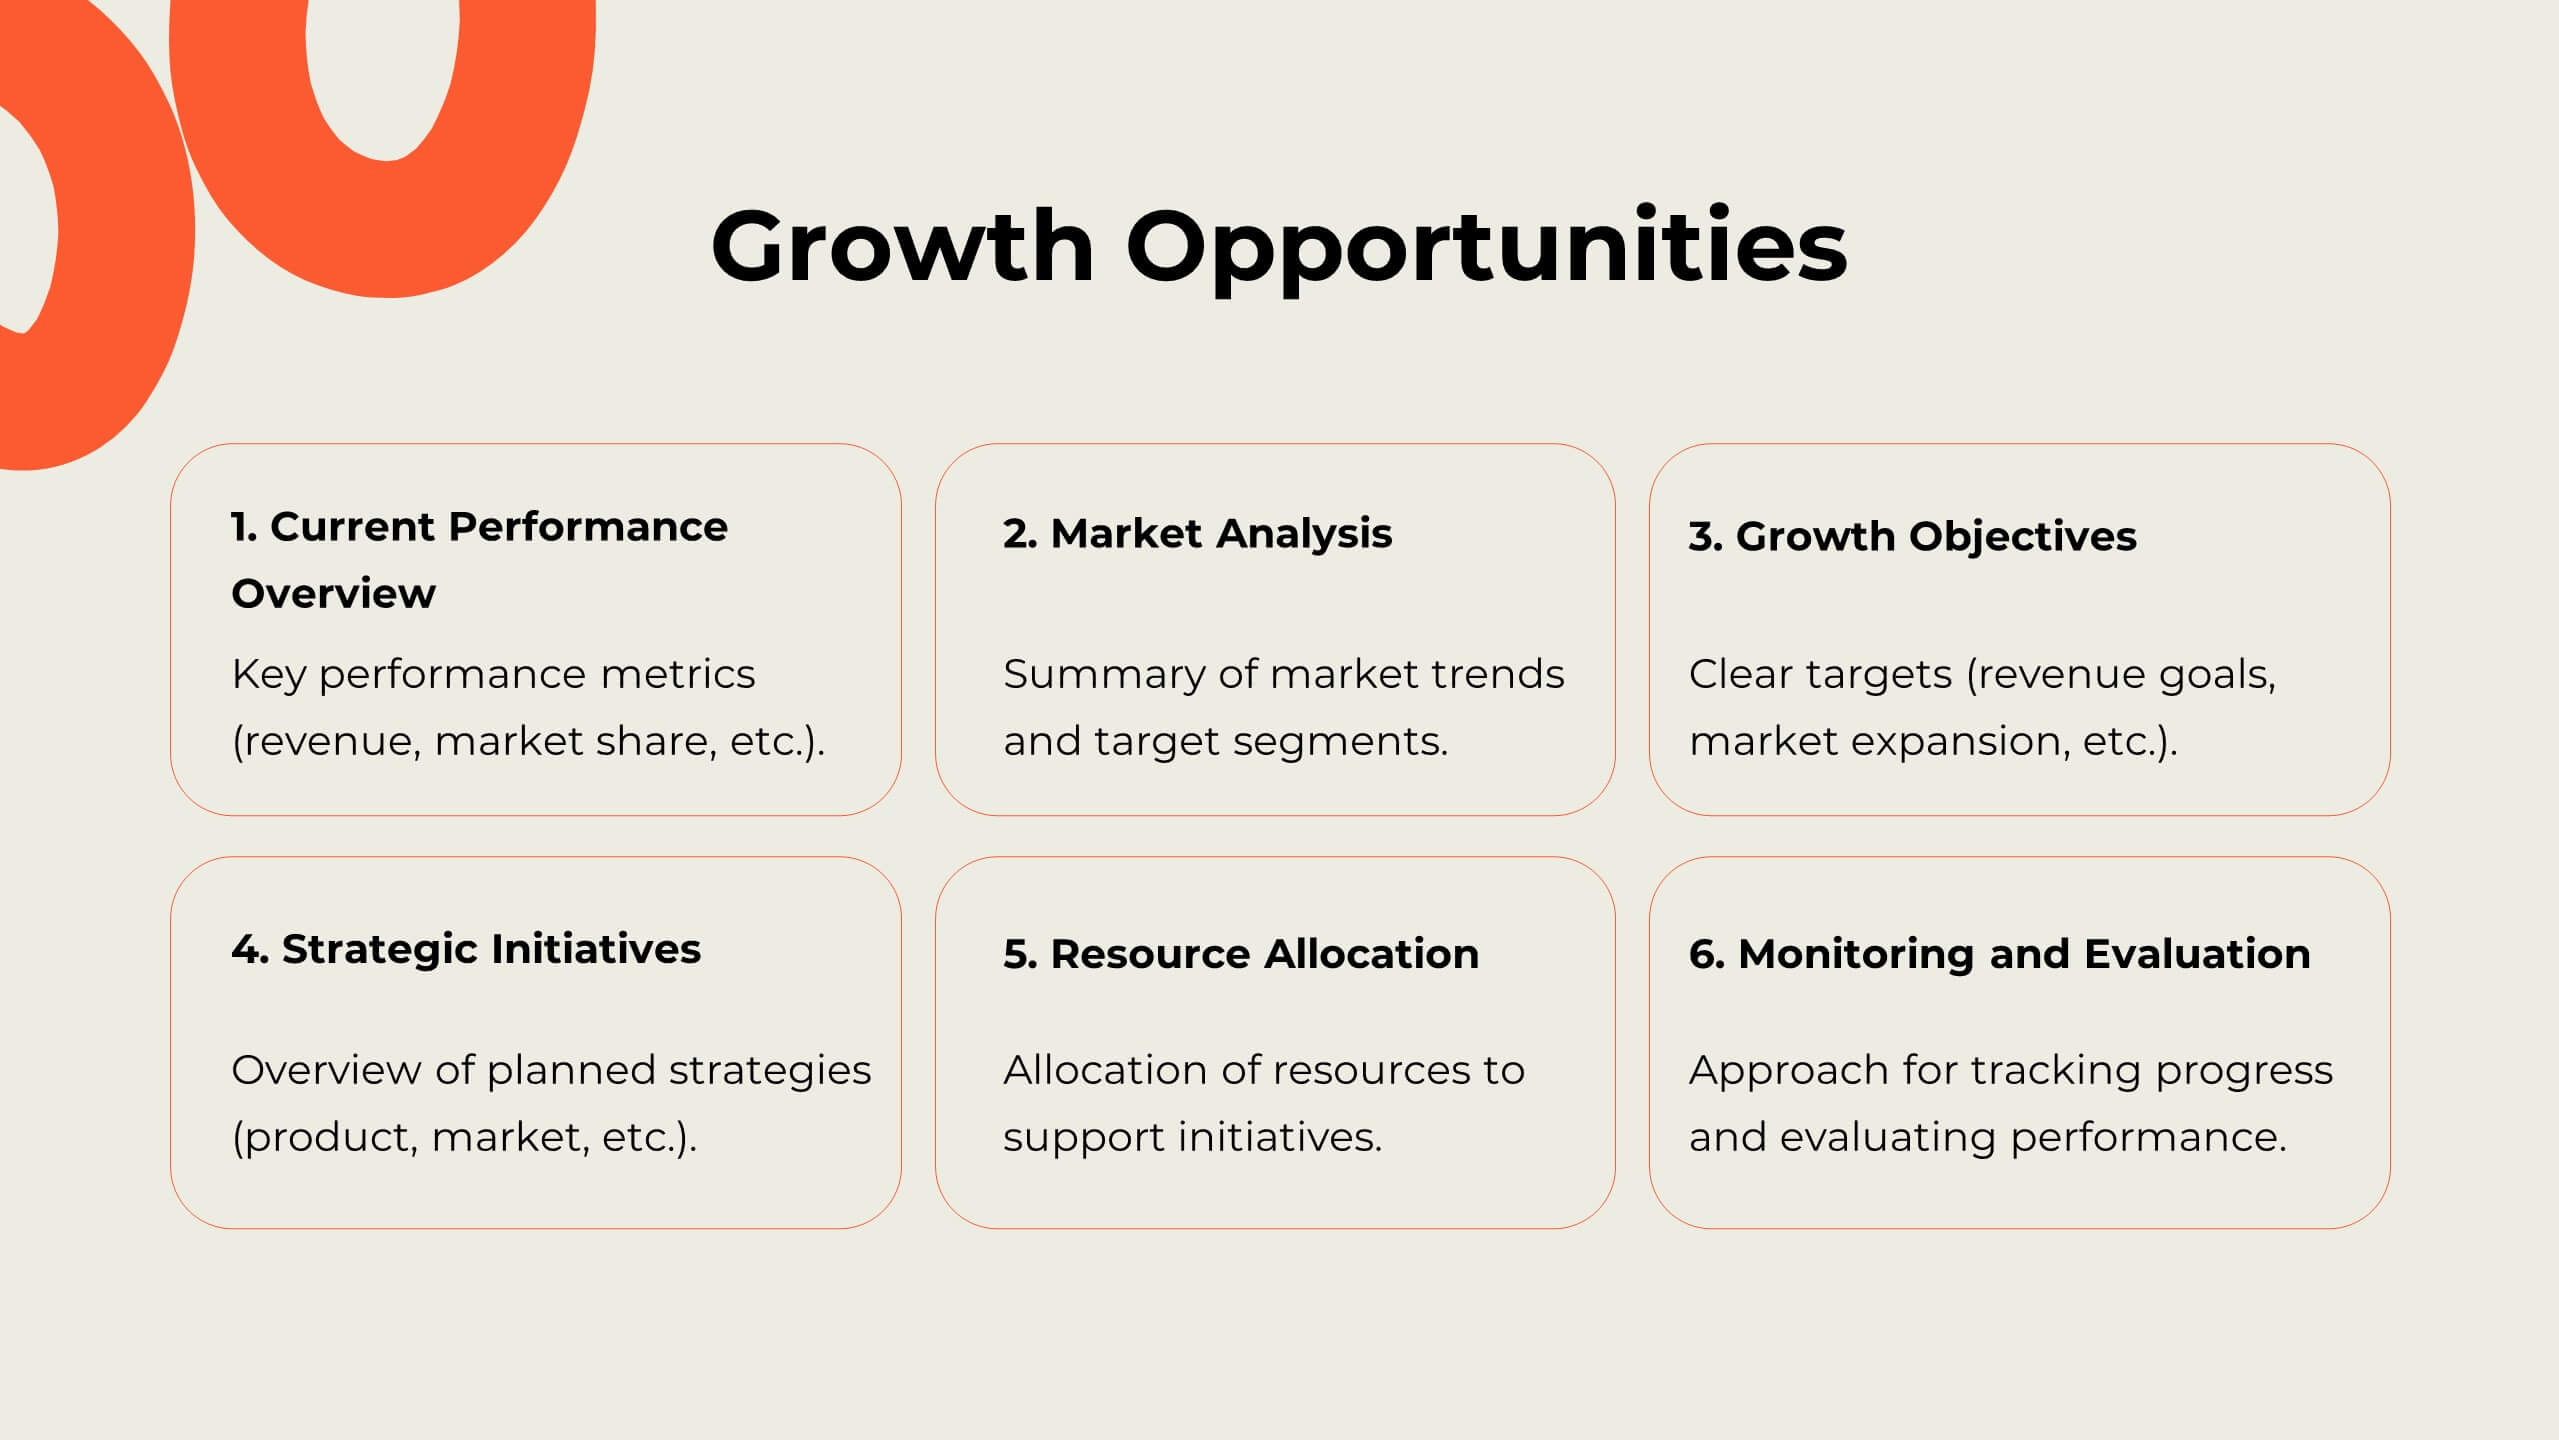
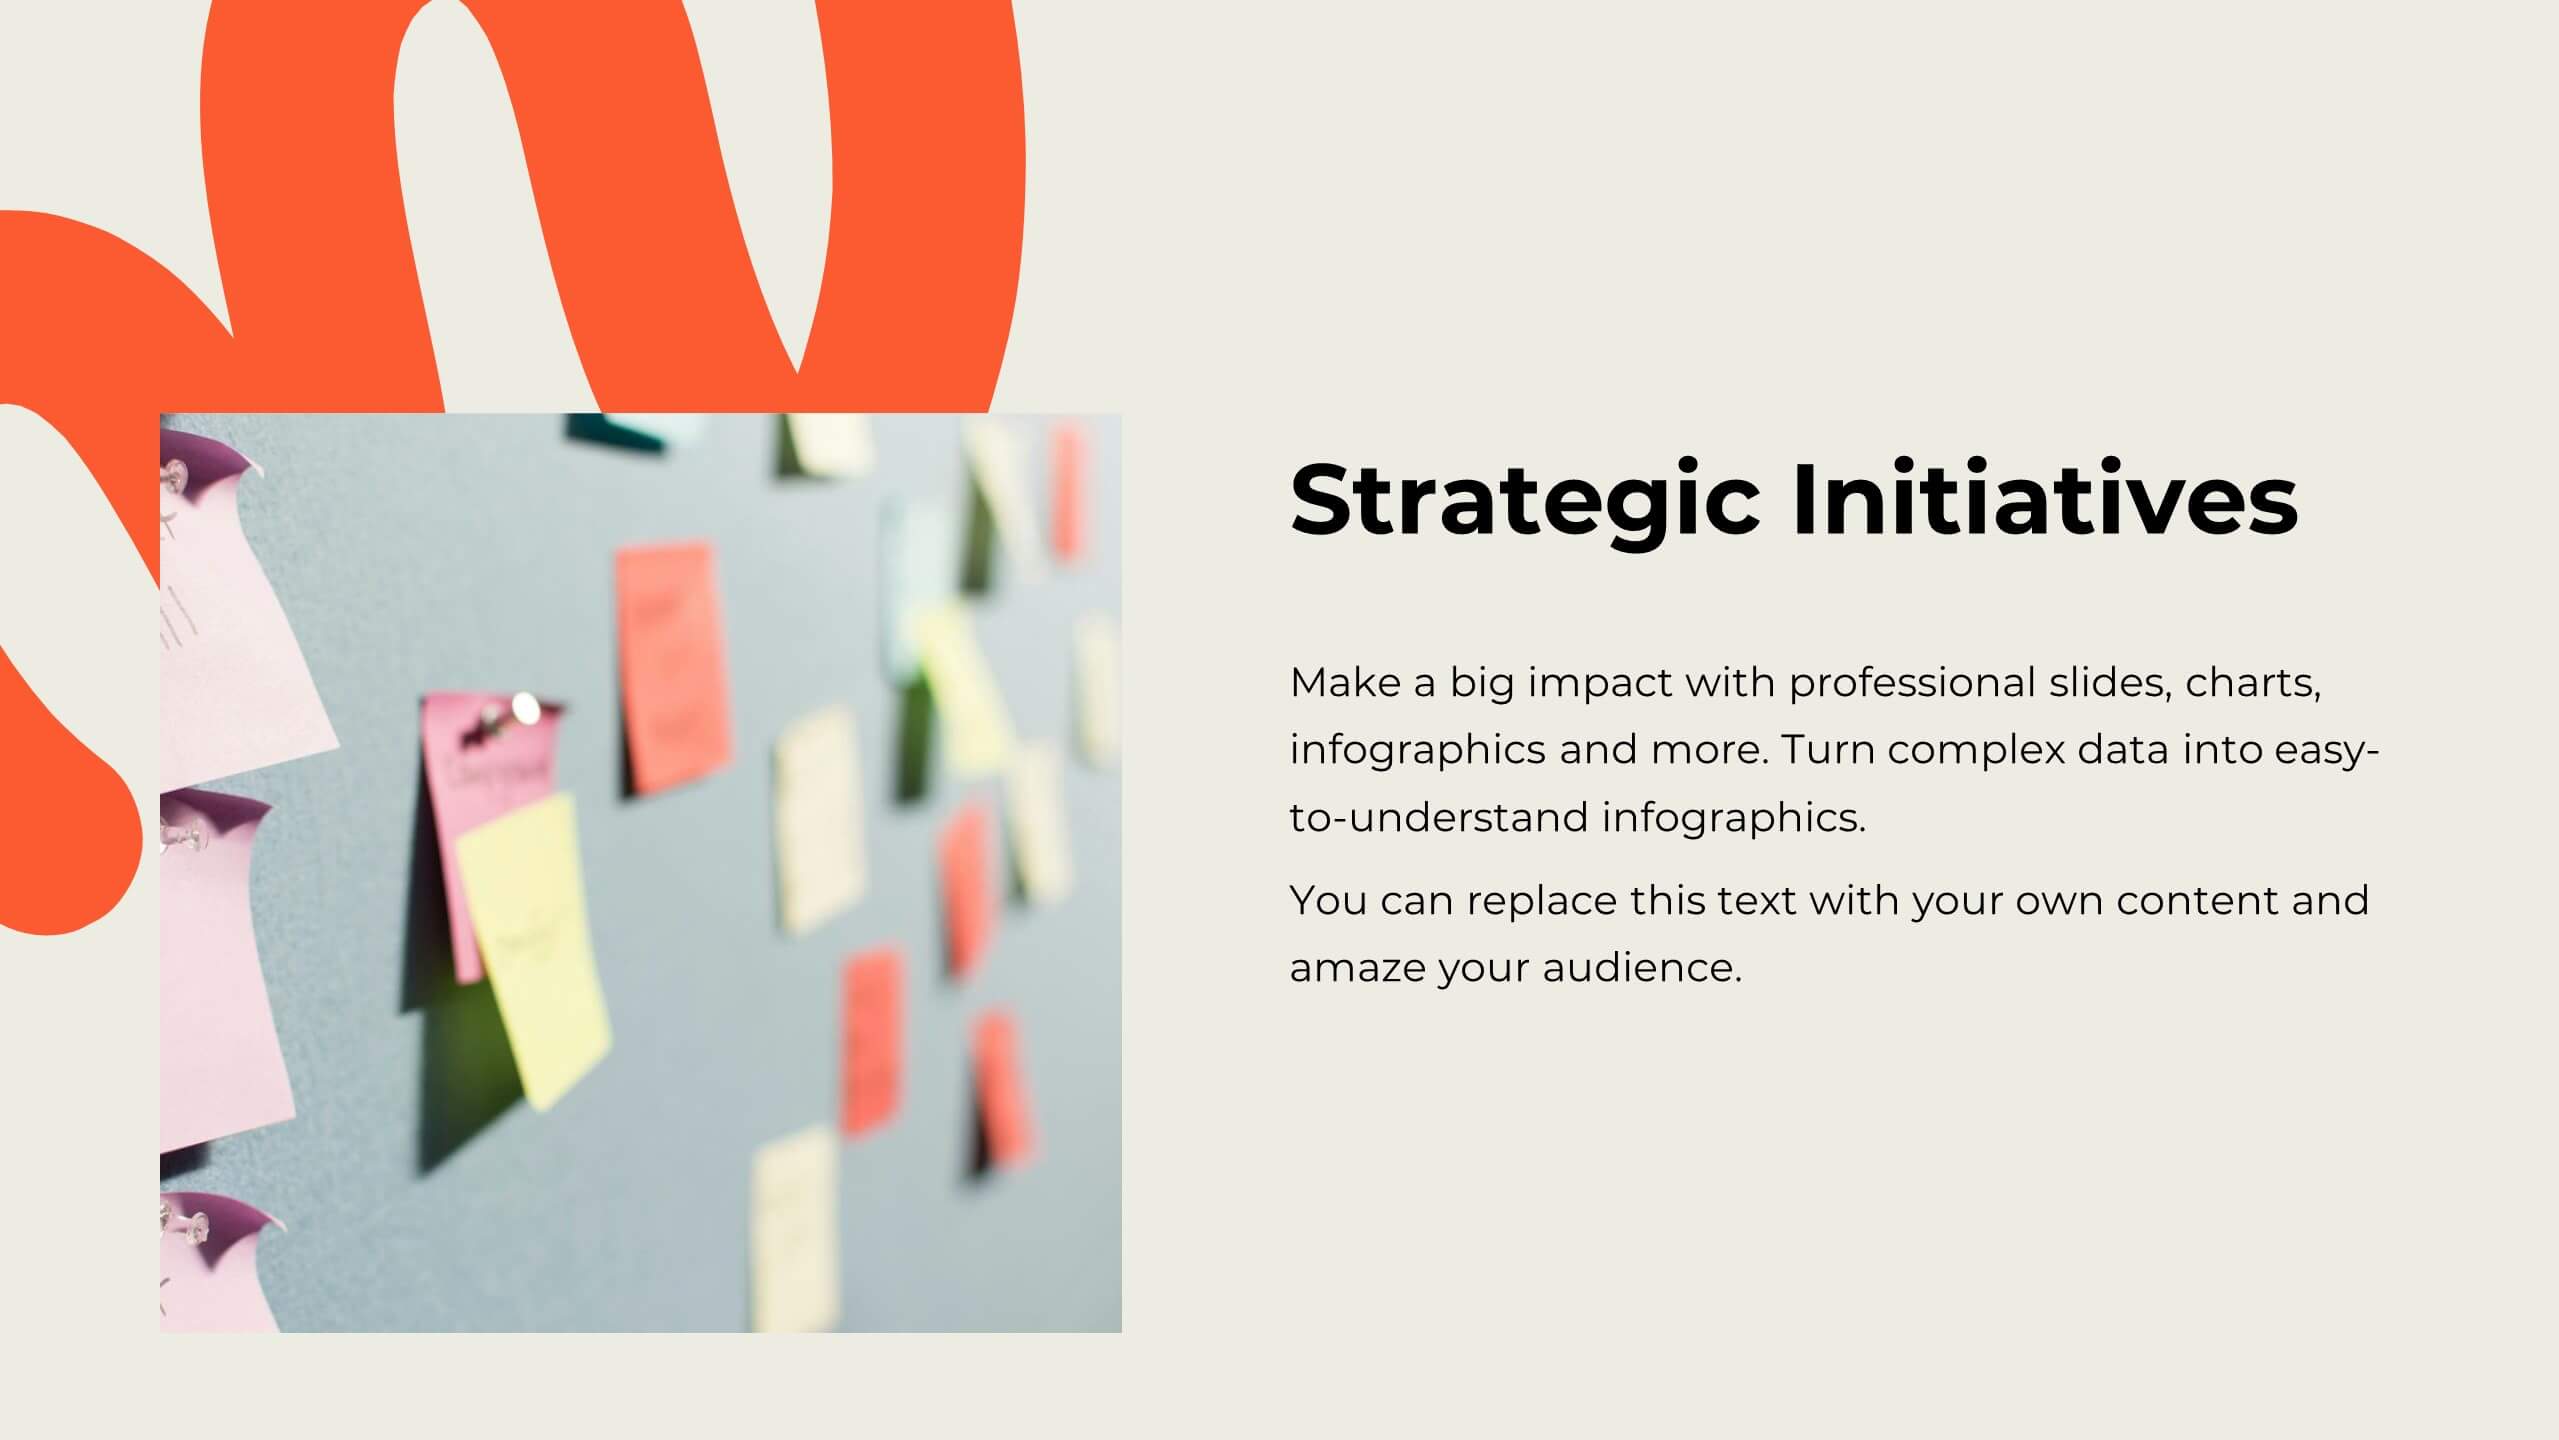
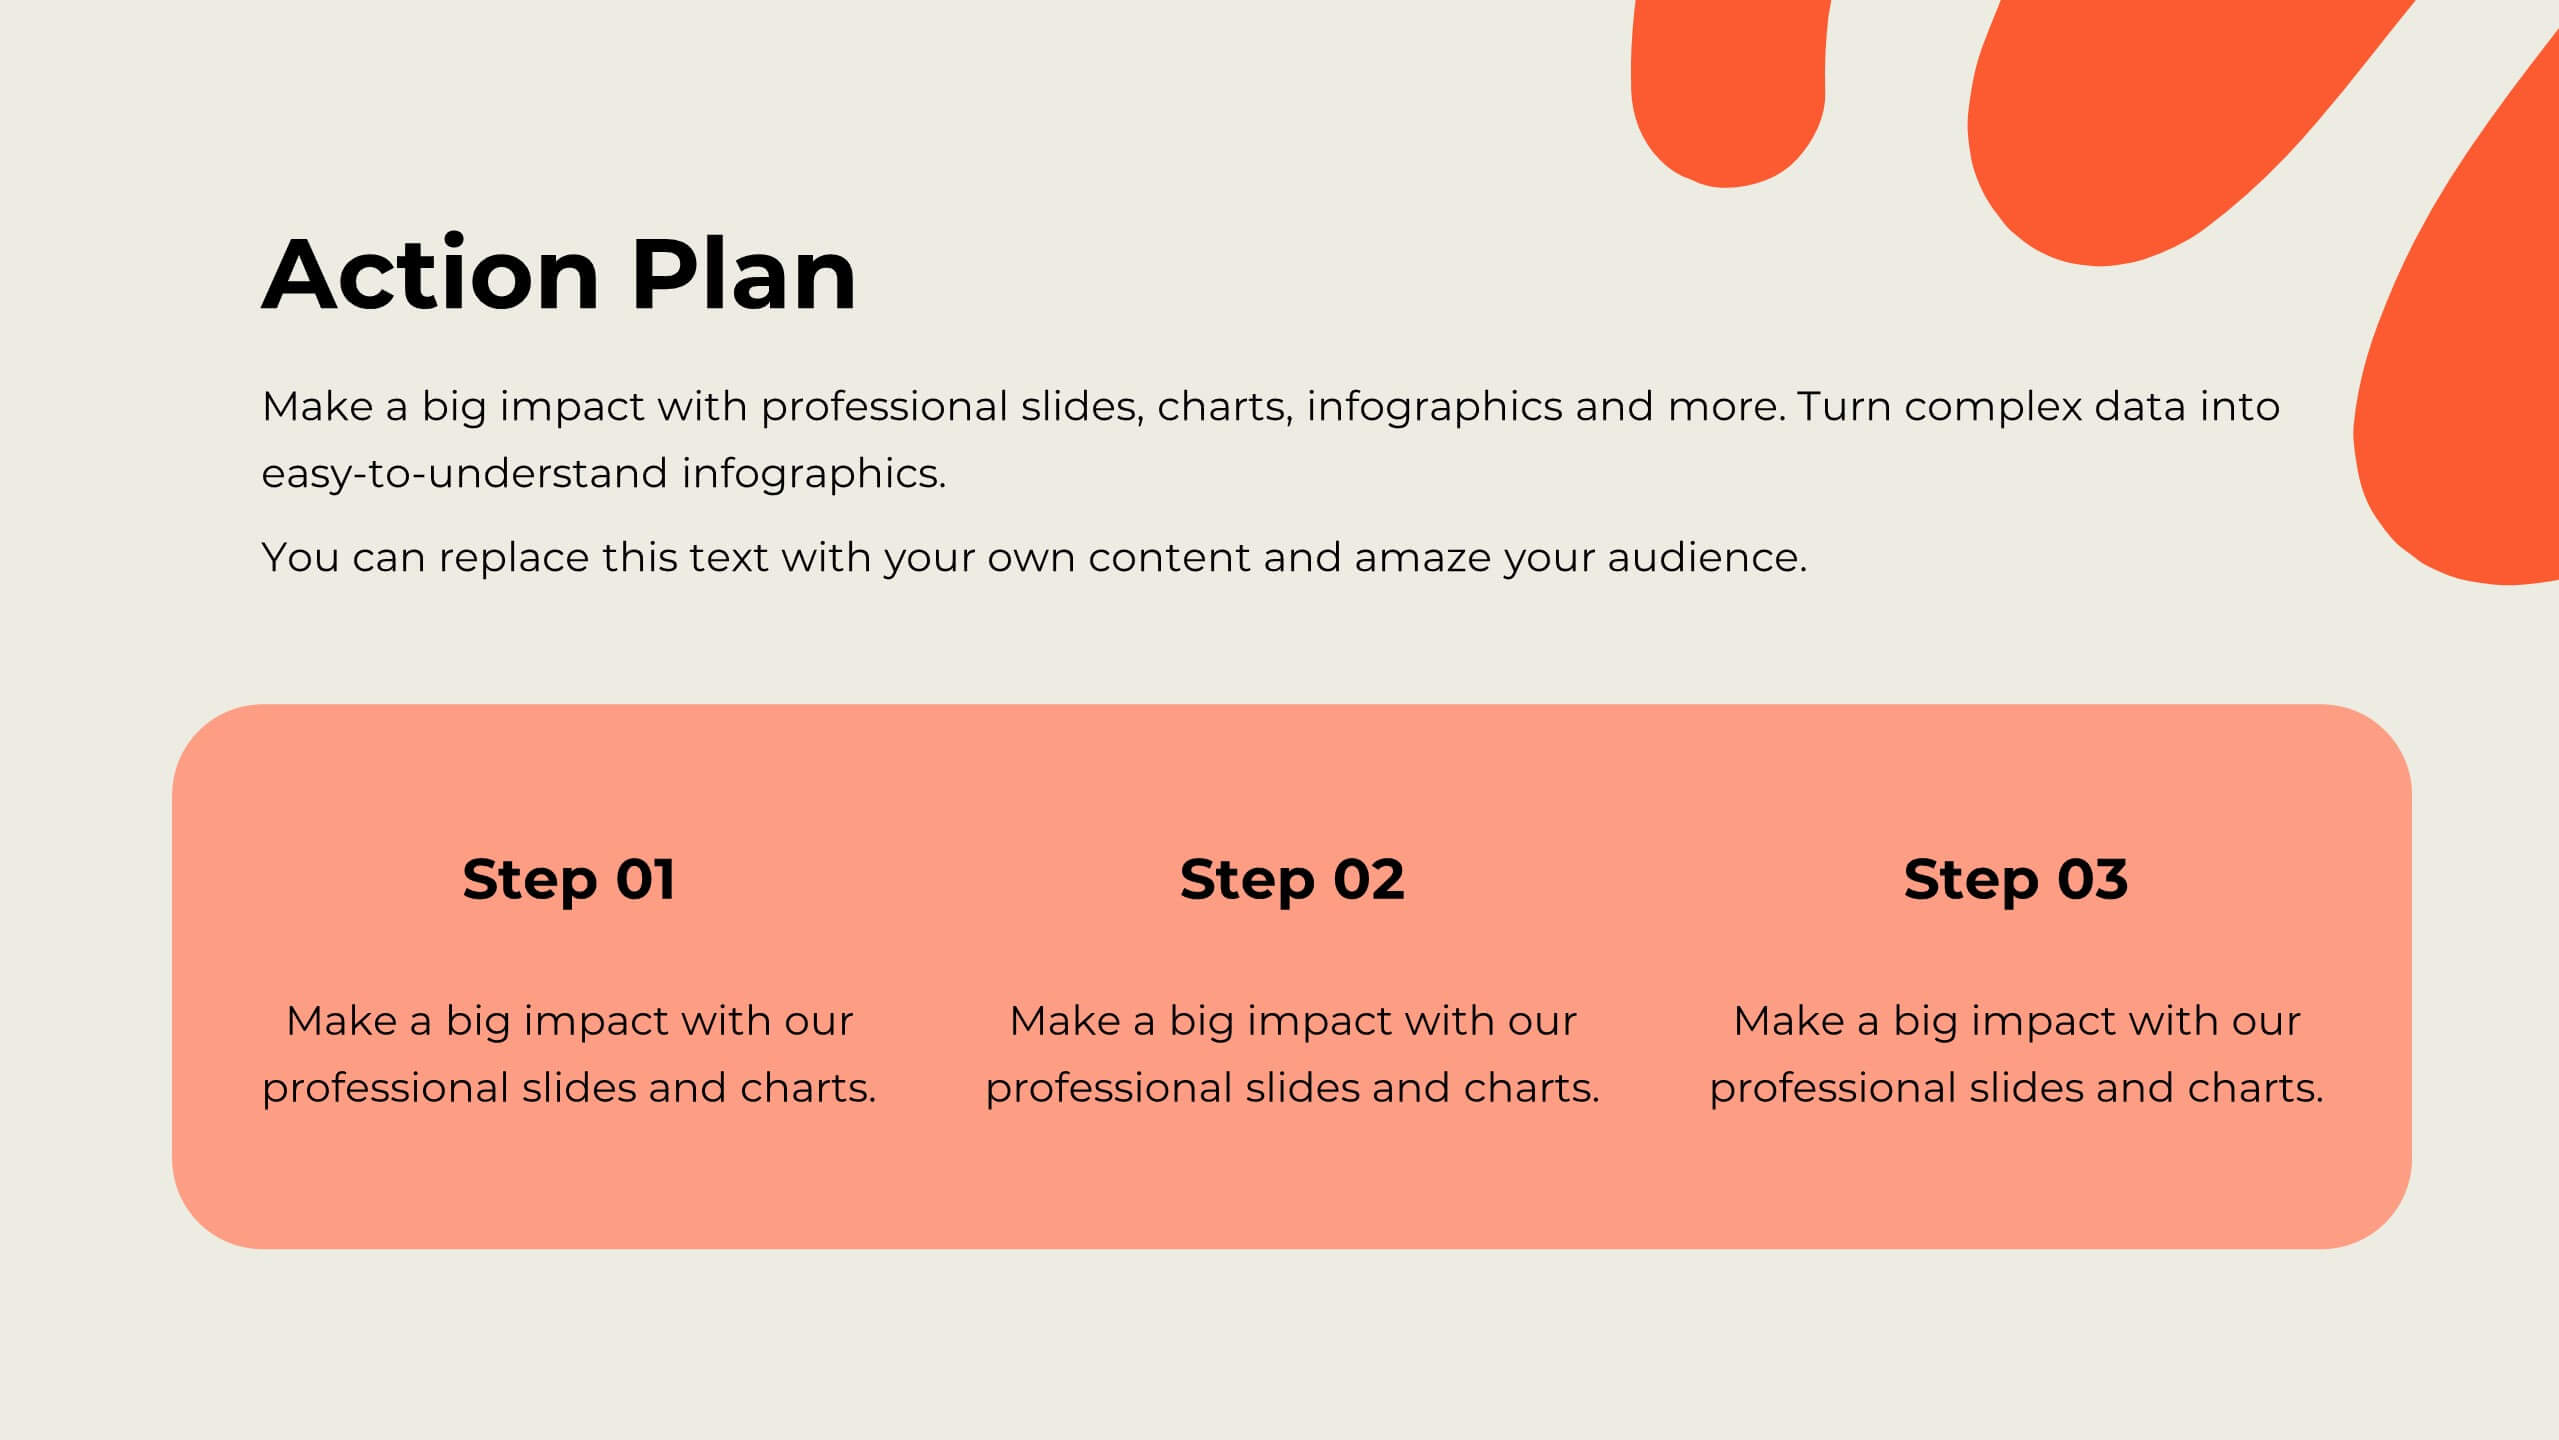
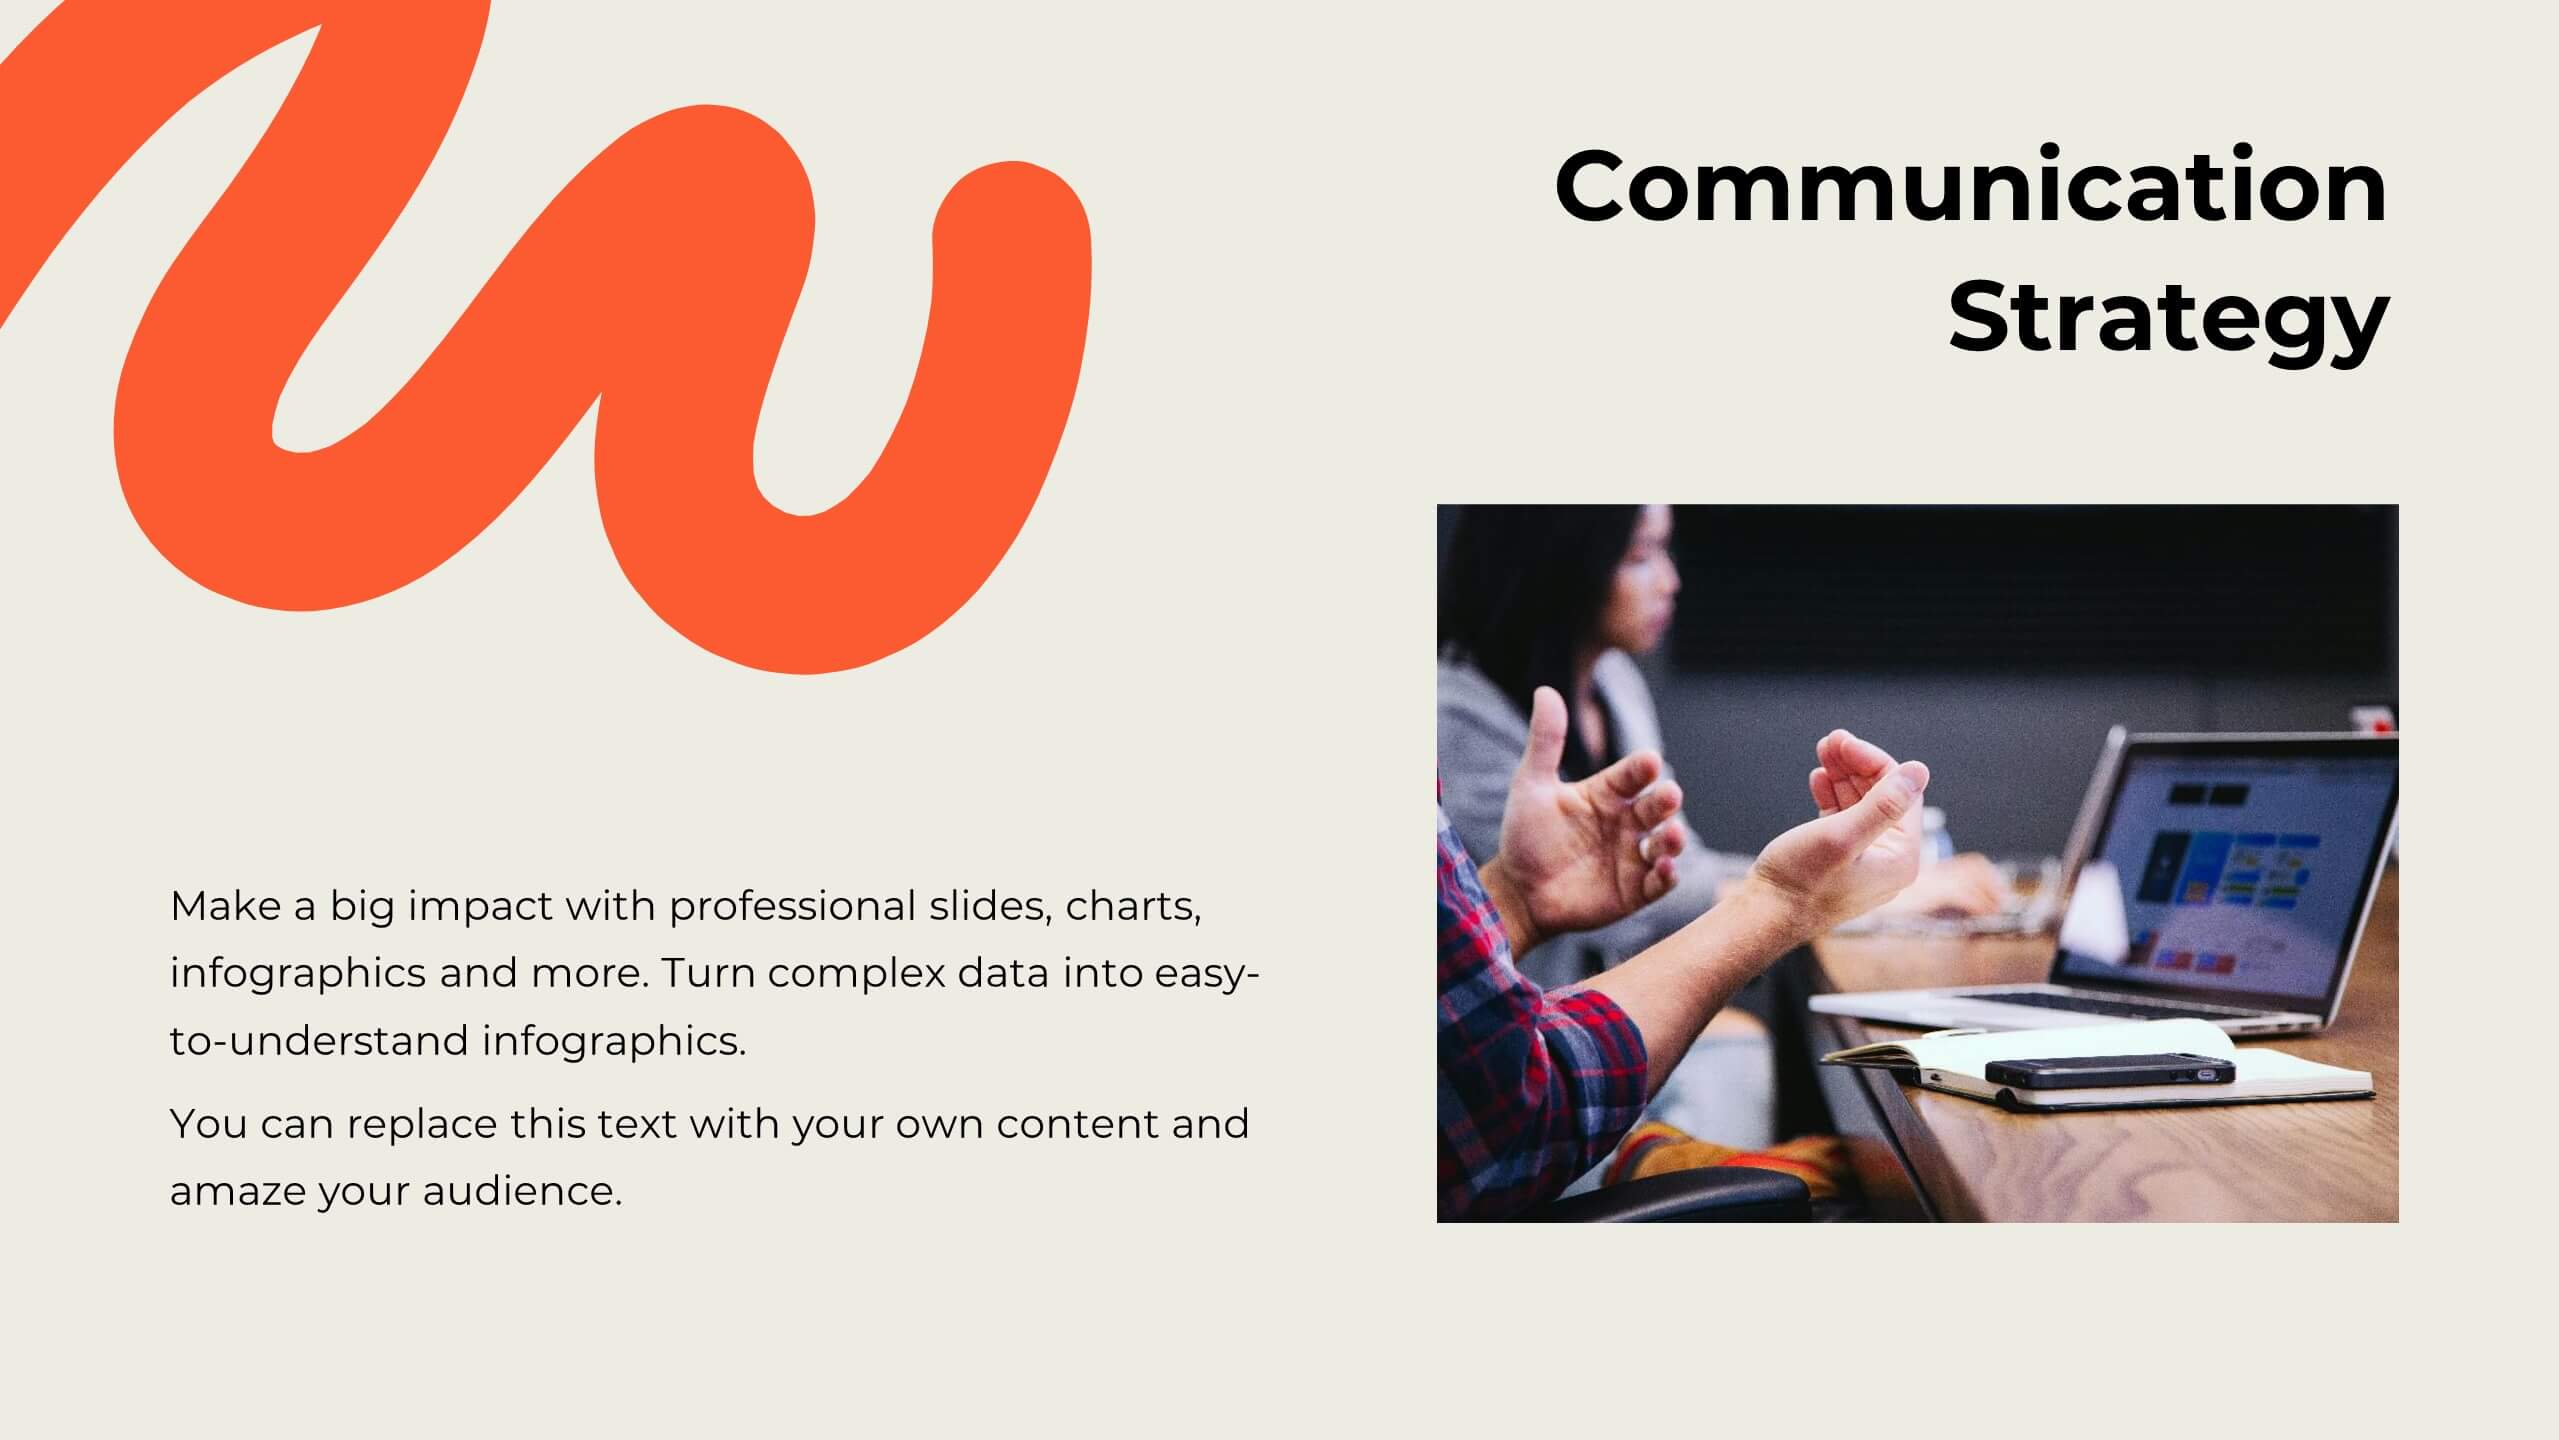
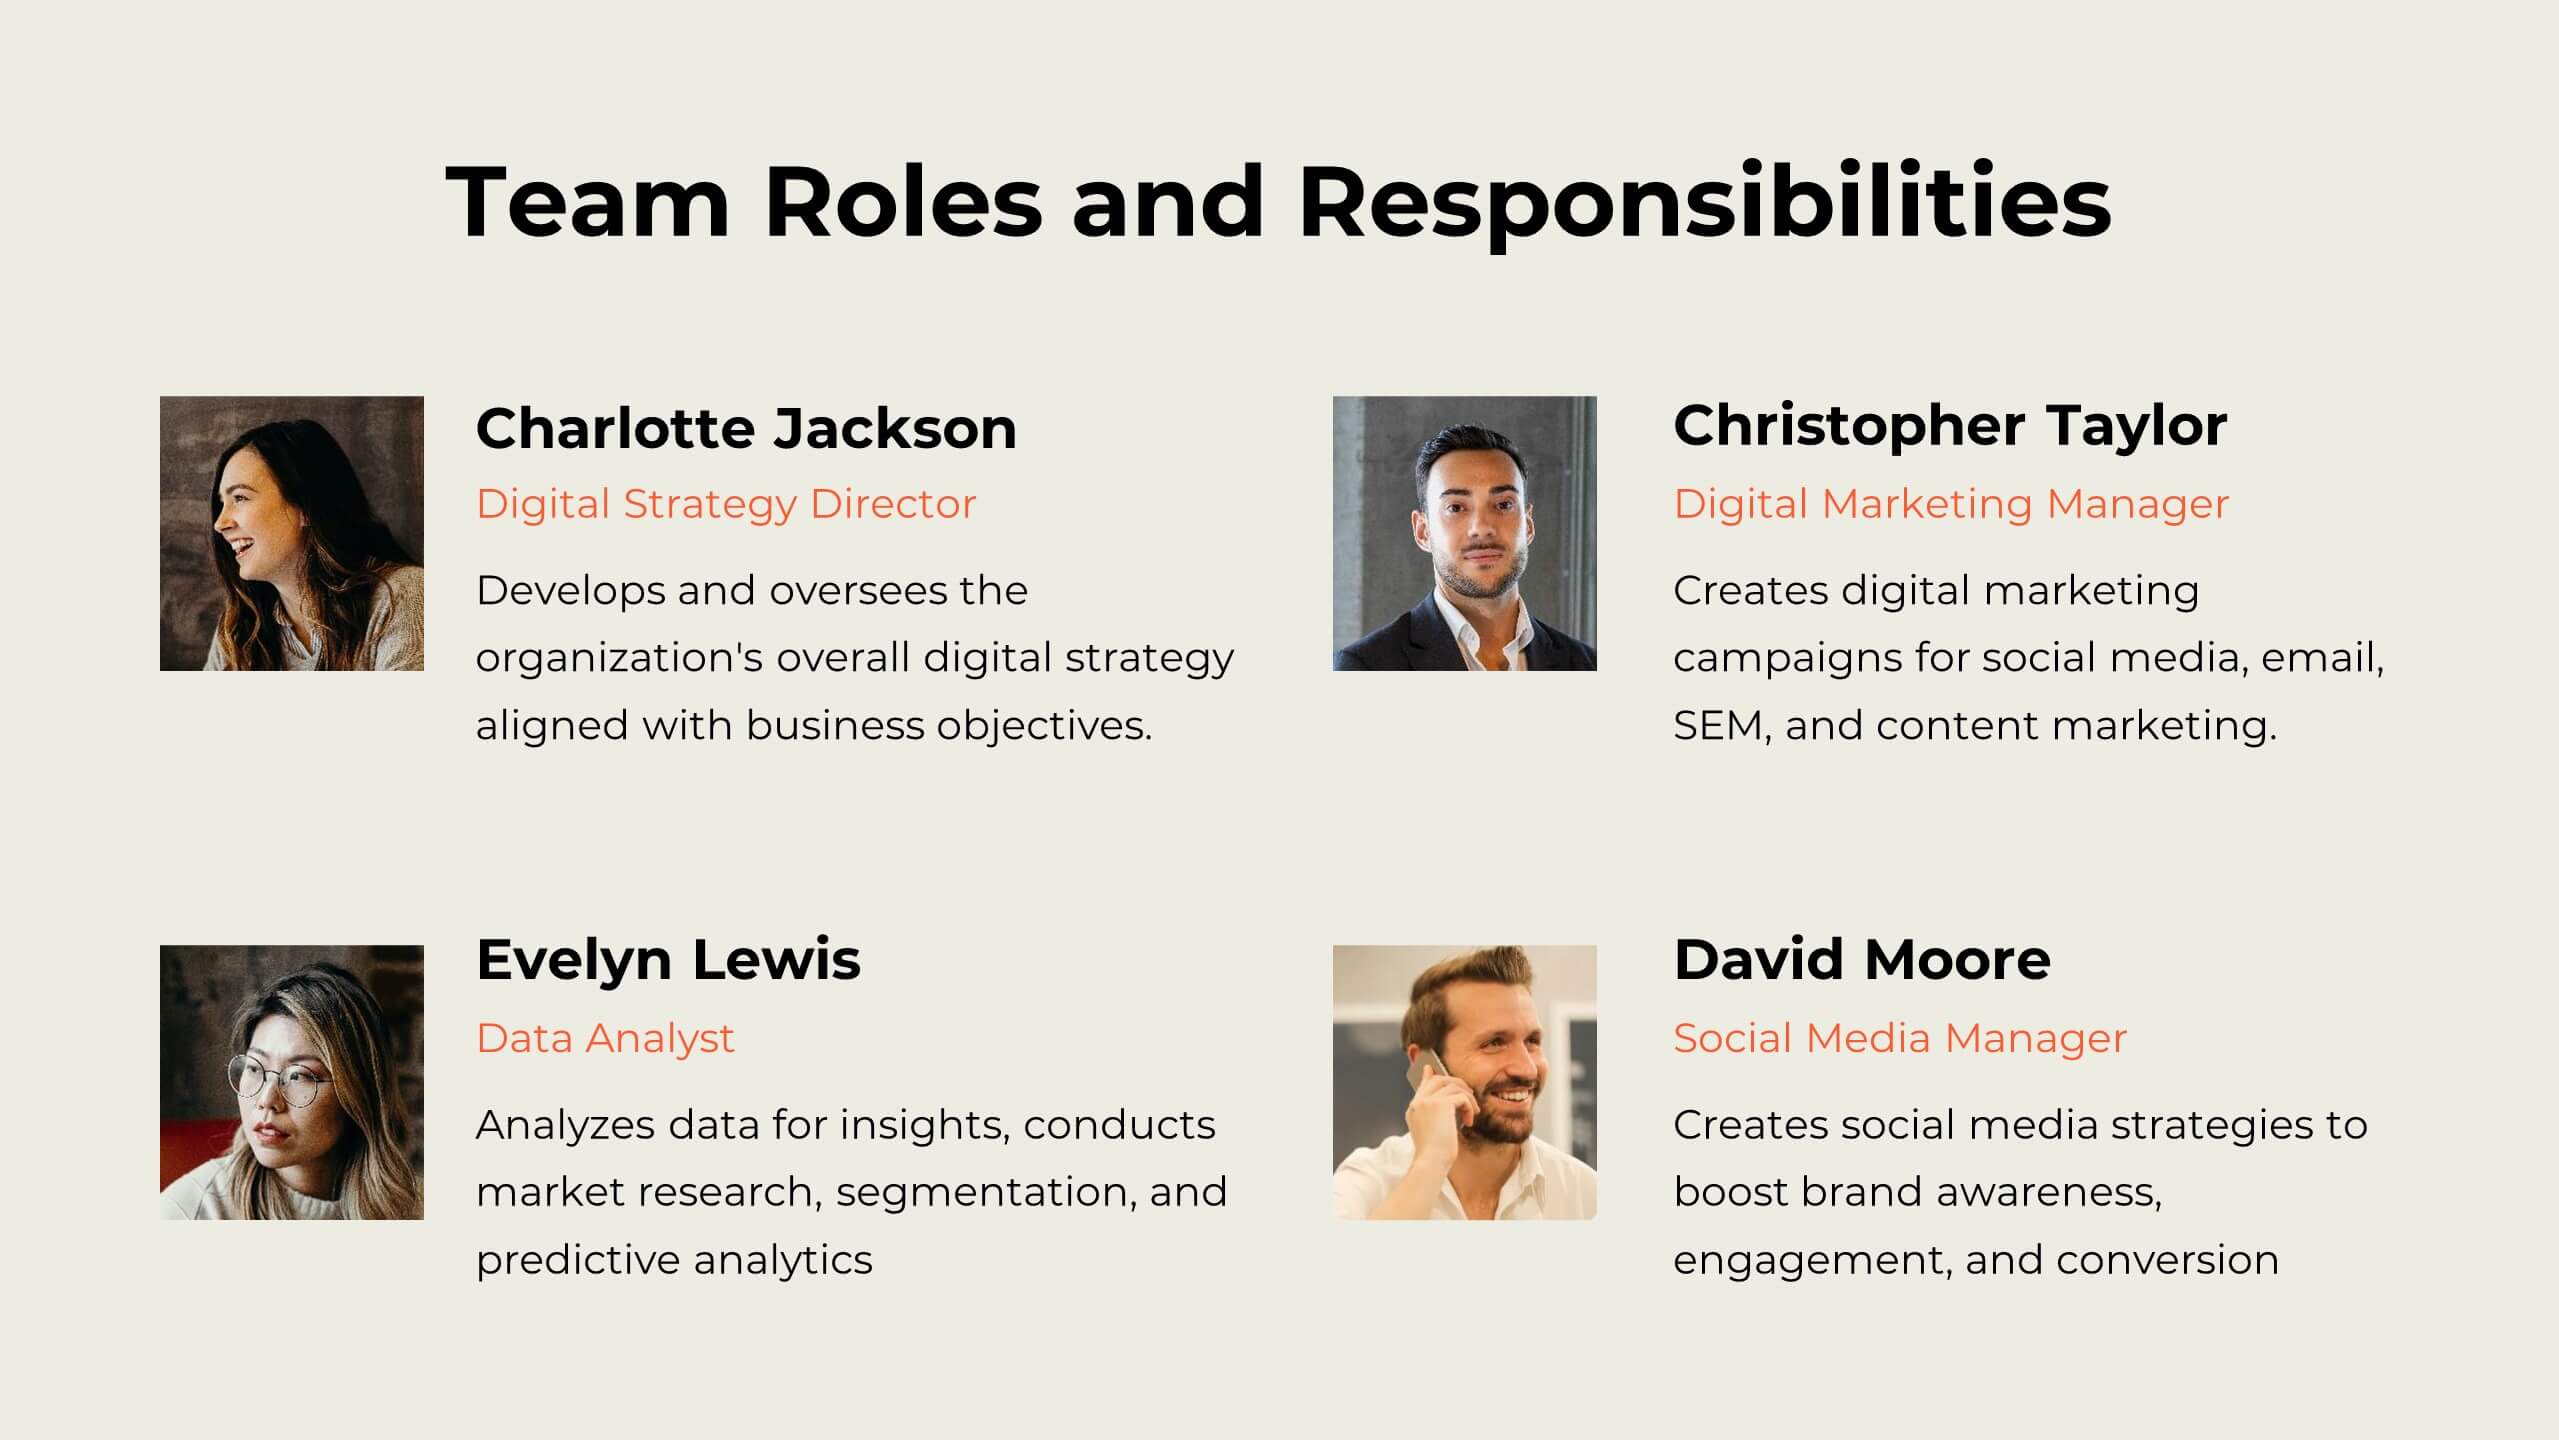
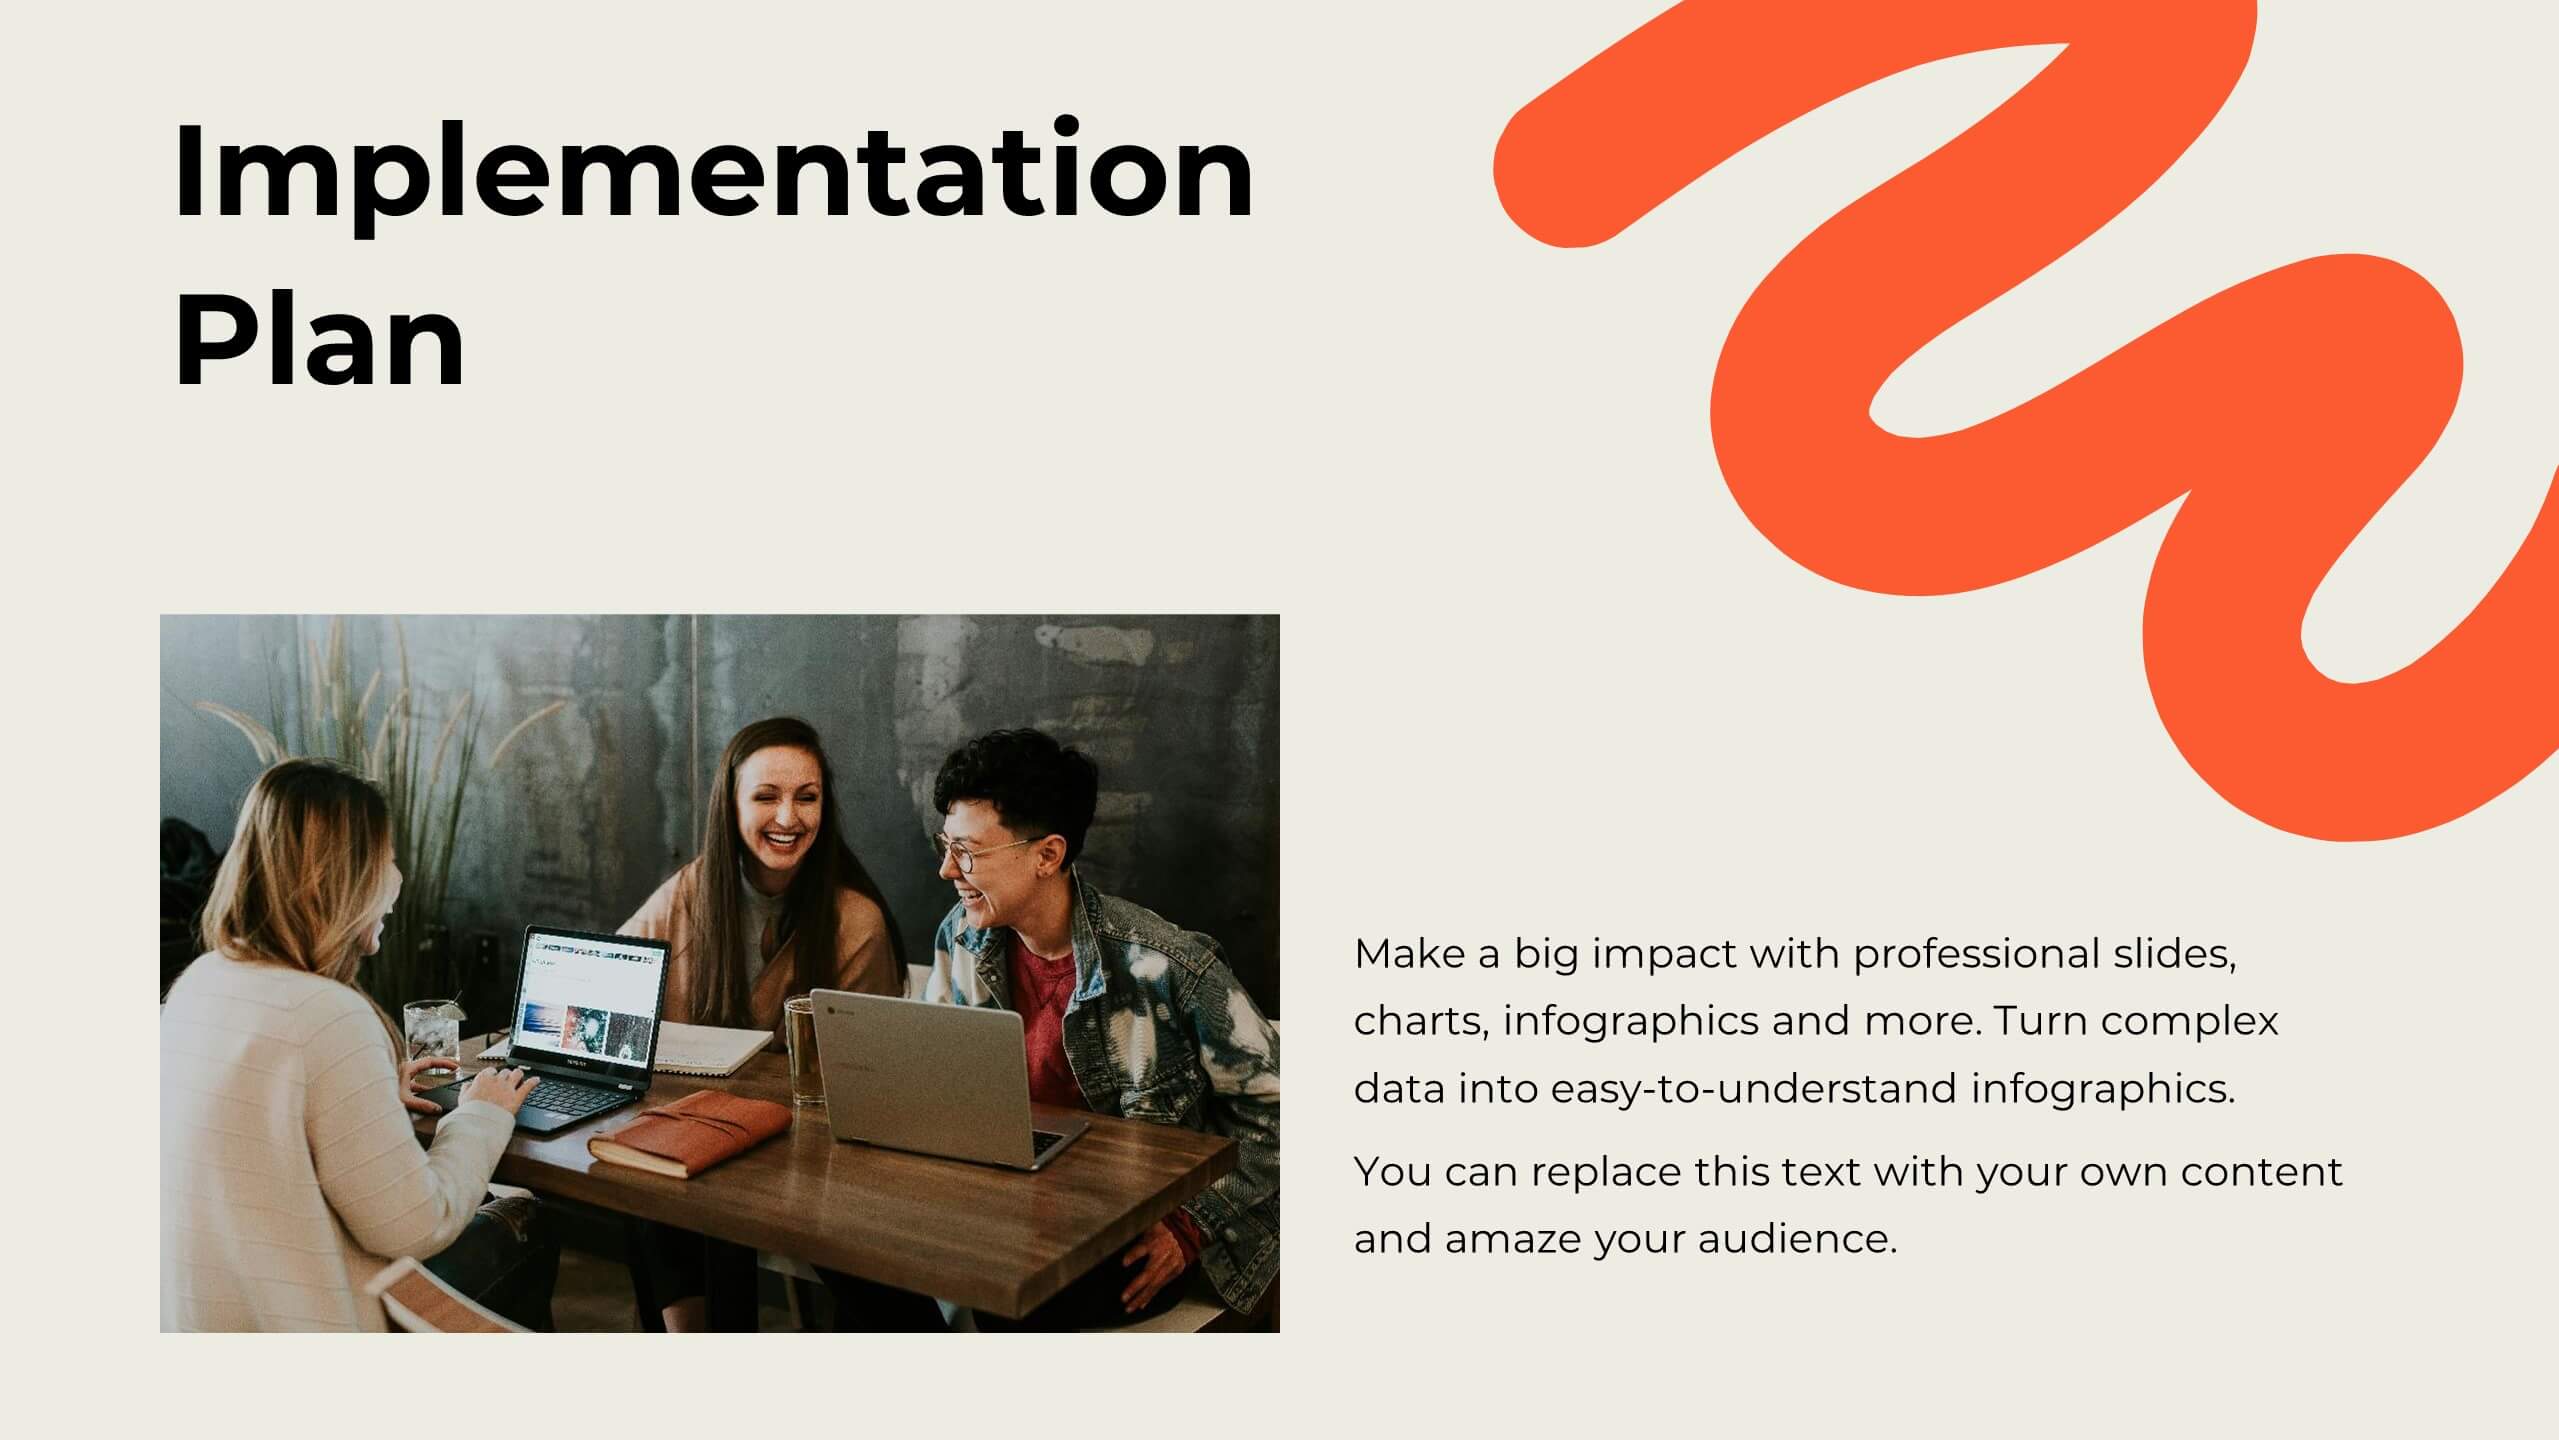
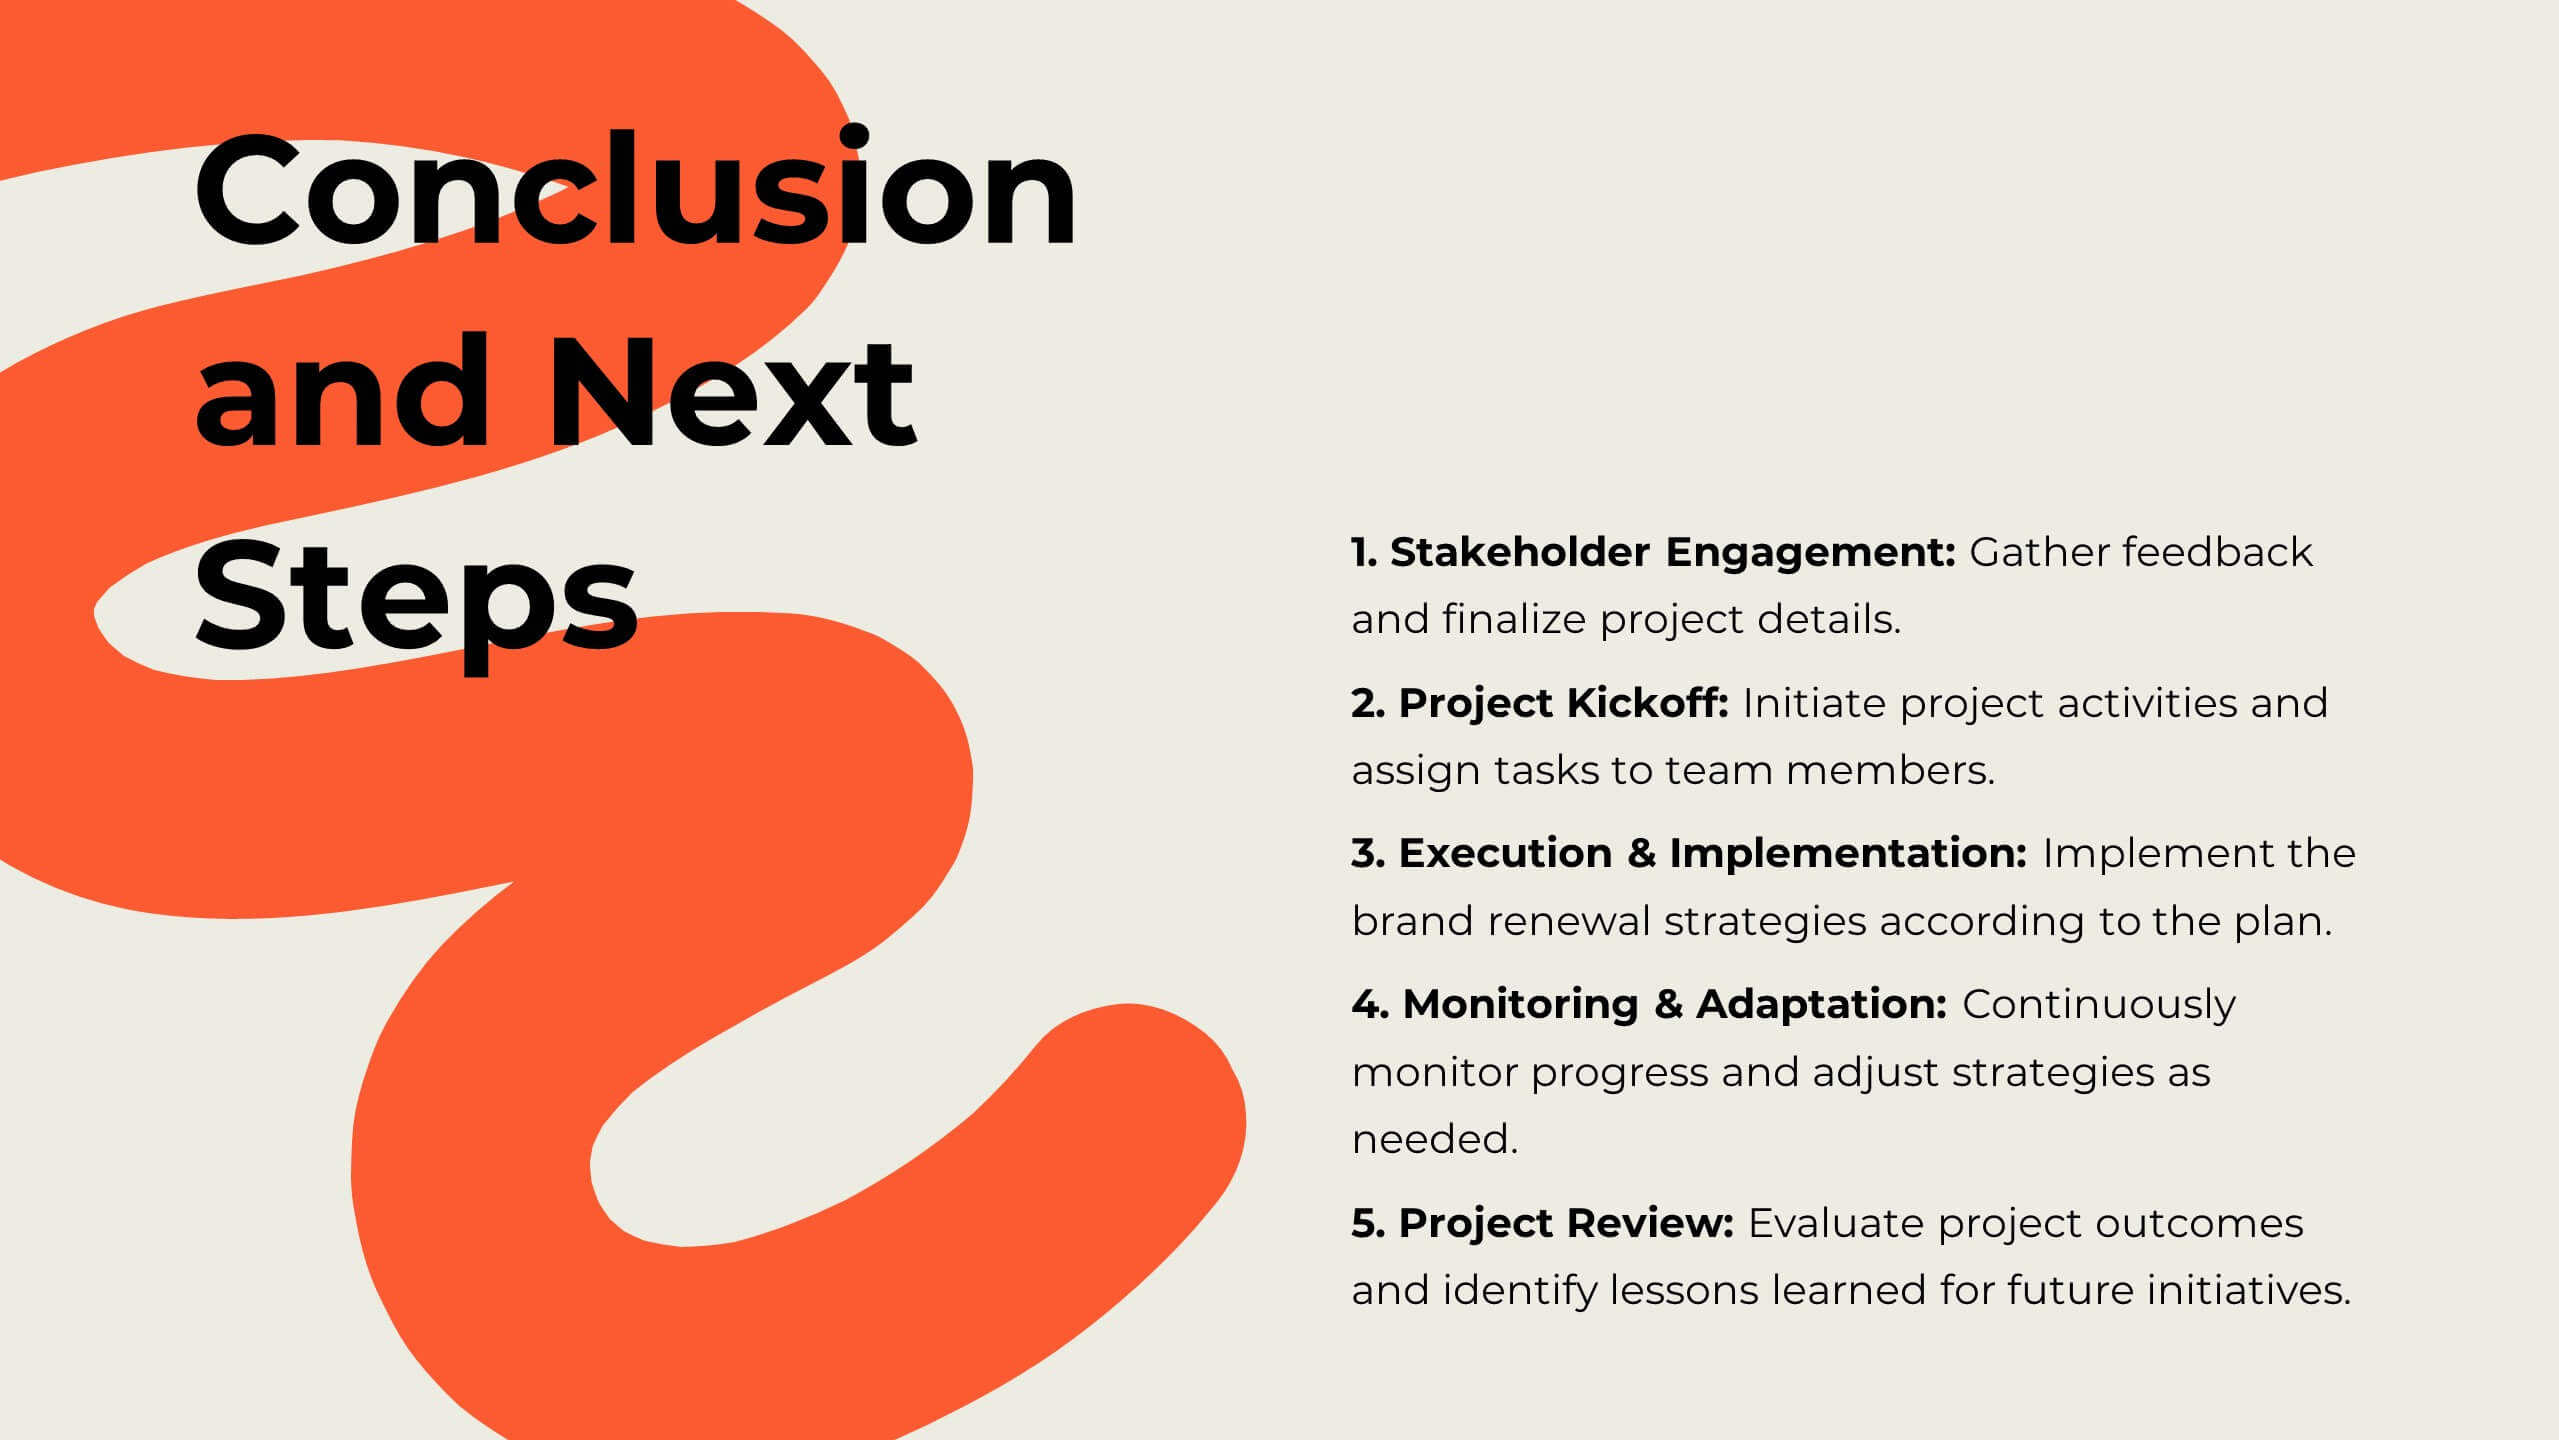
Mirage Digital Strategy Presentation
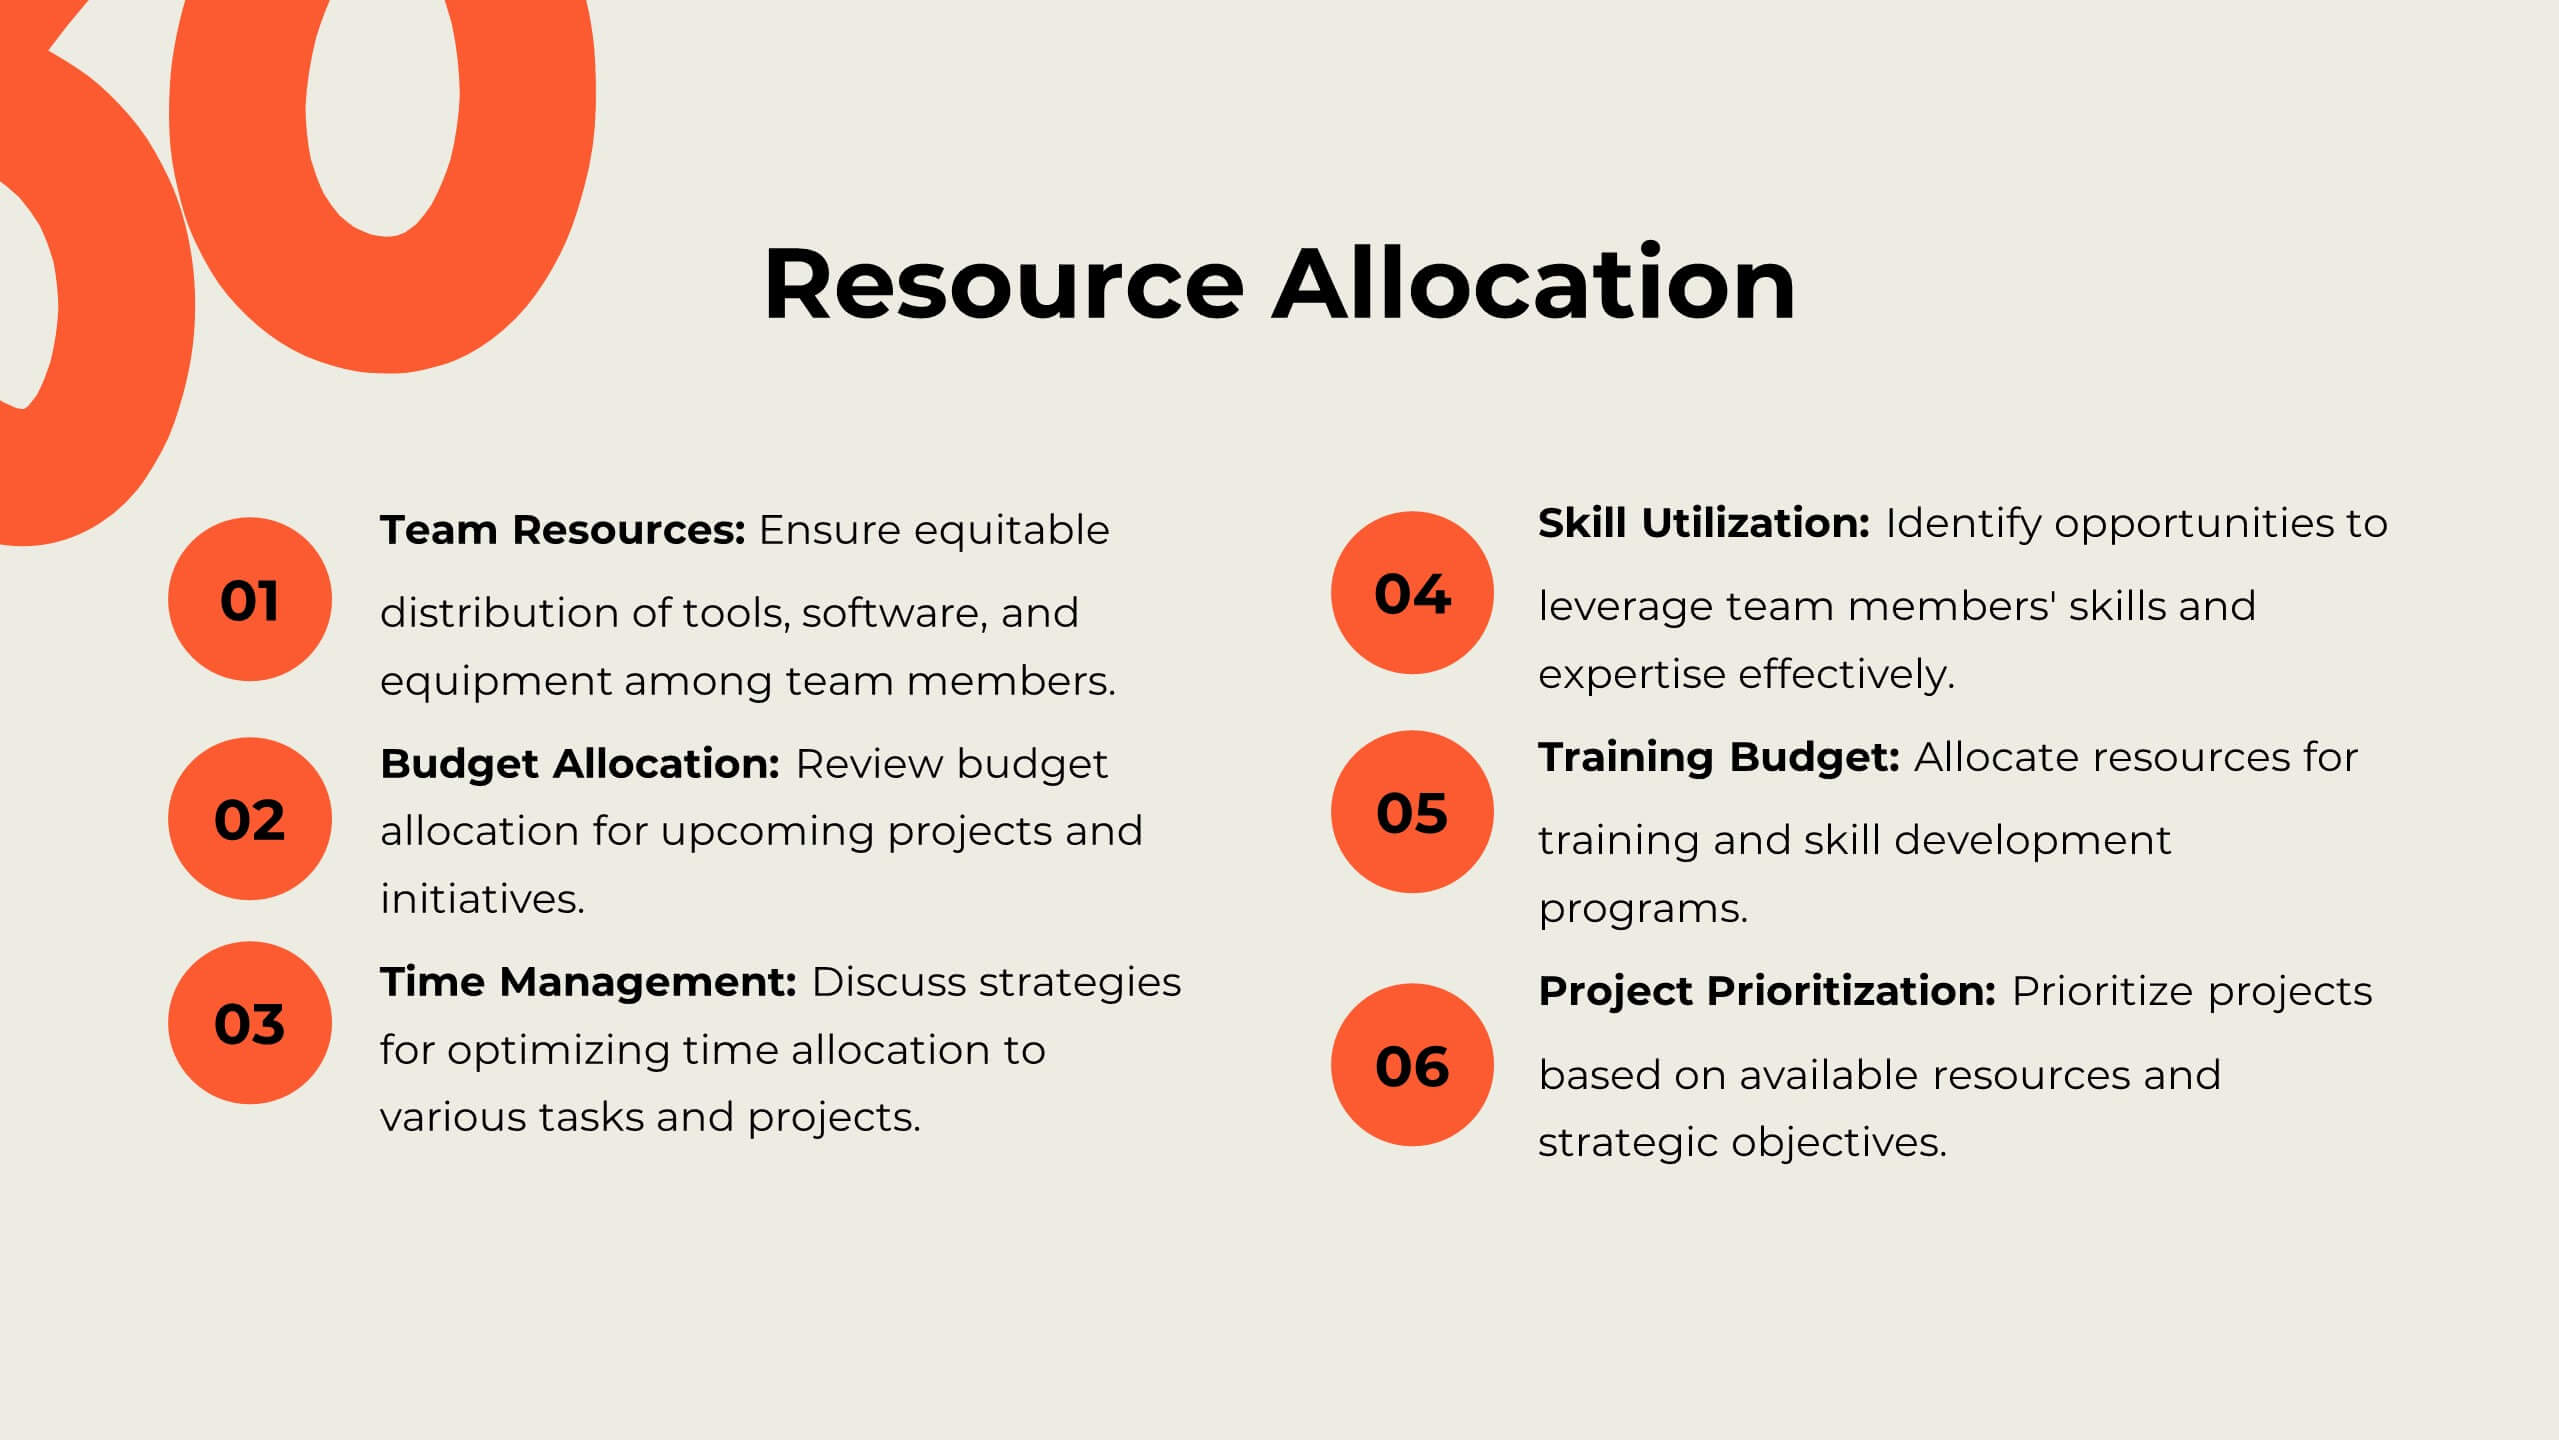
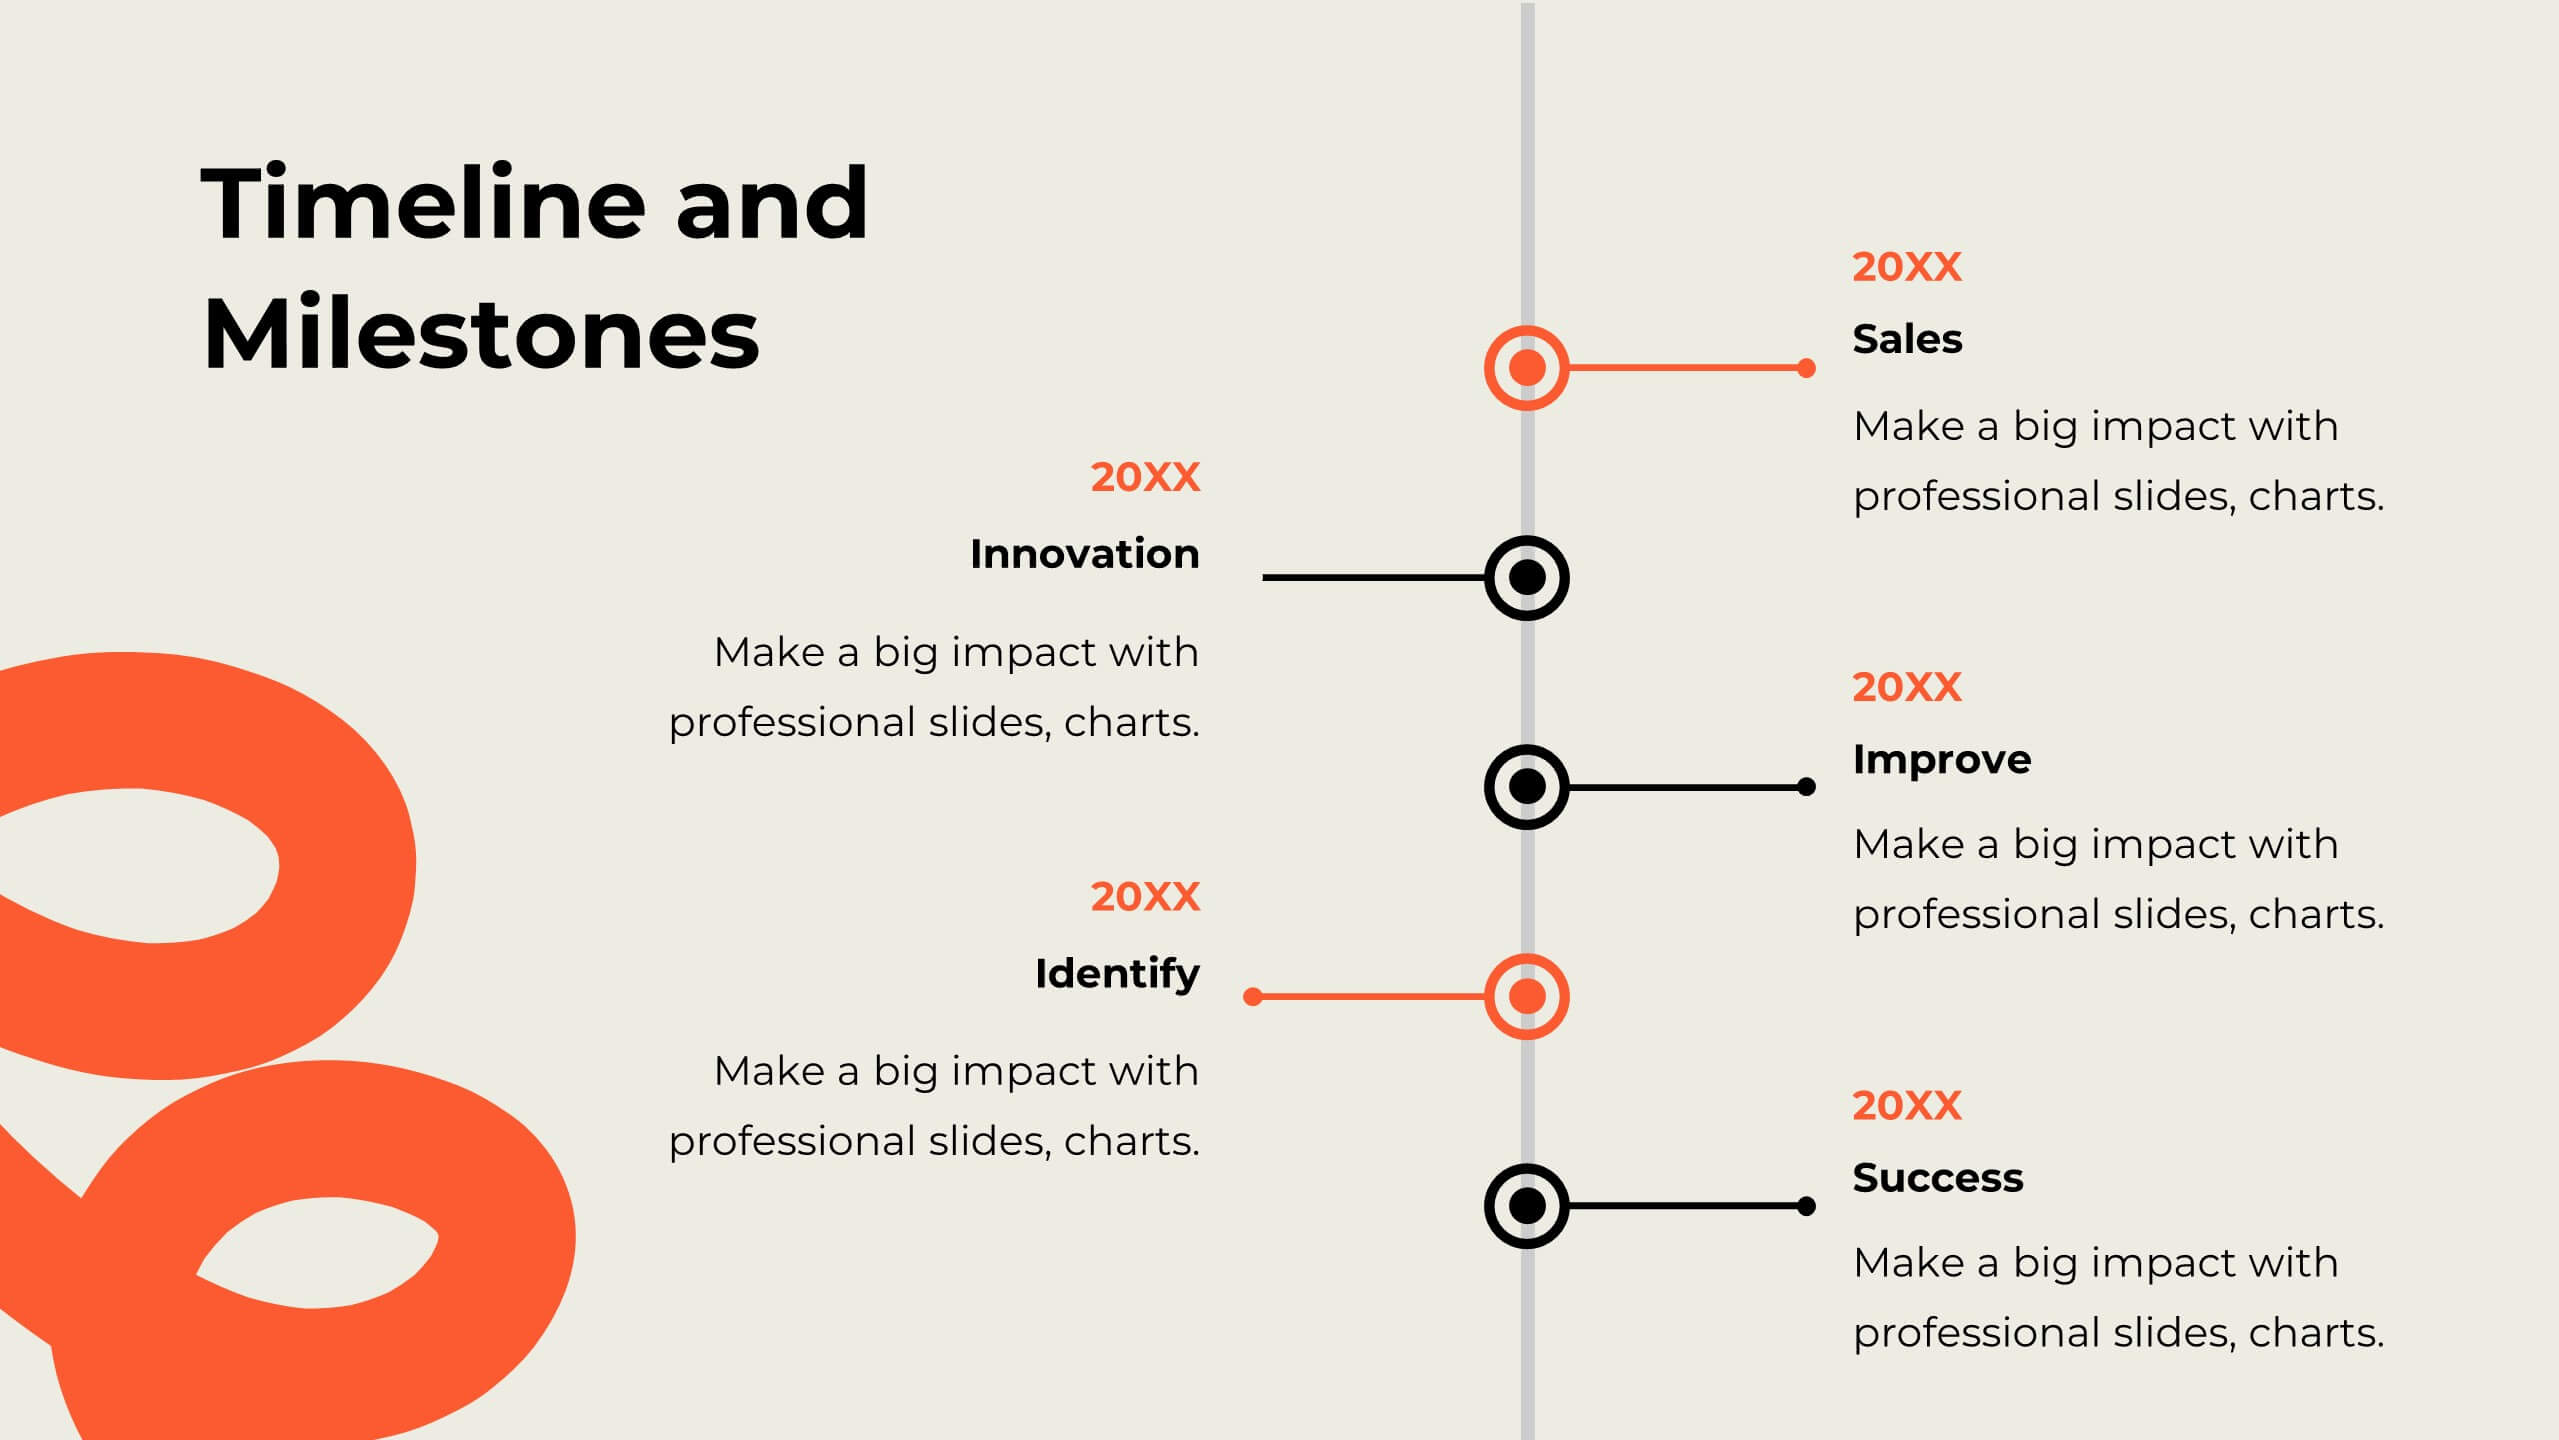
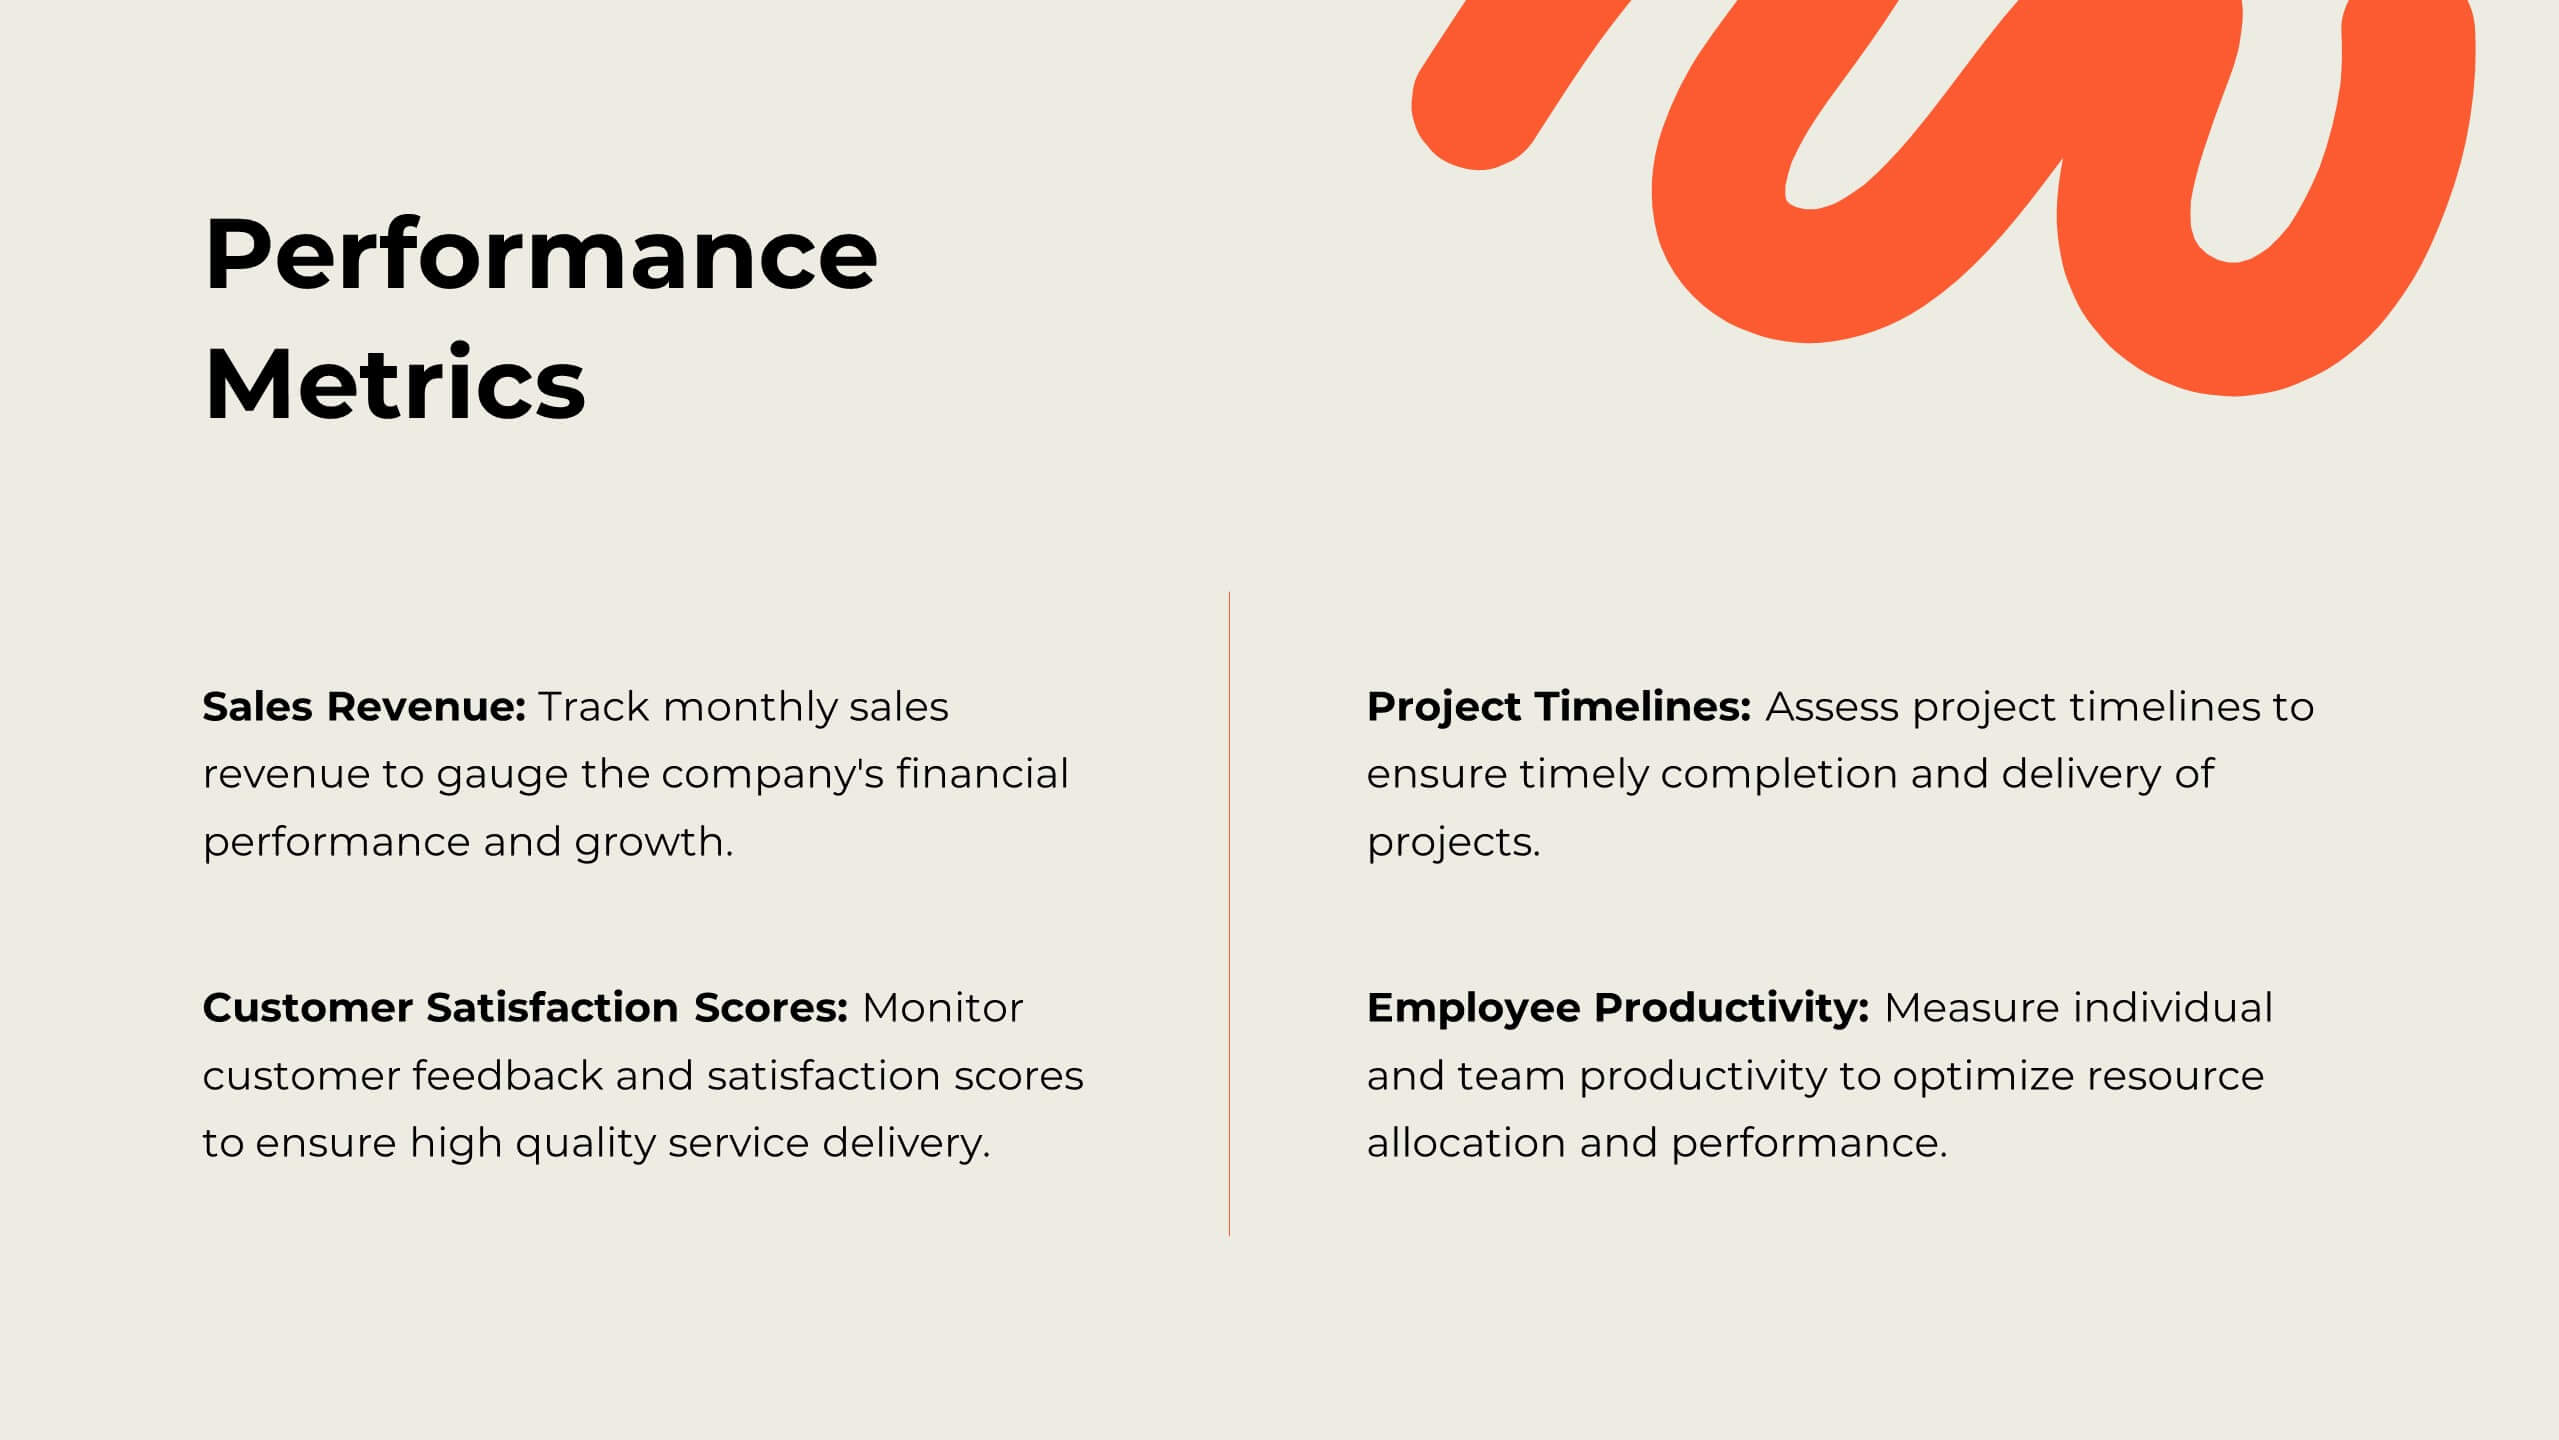
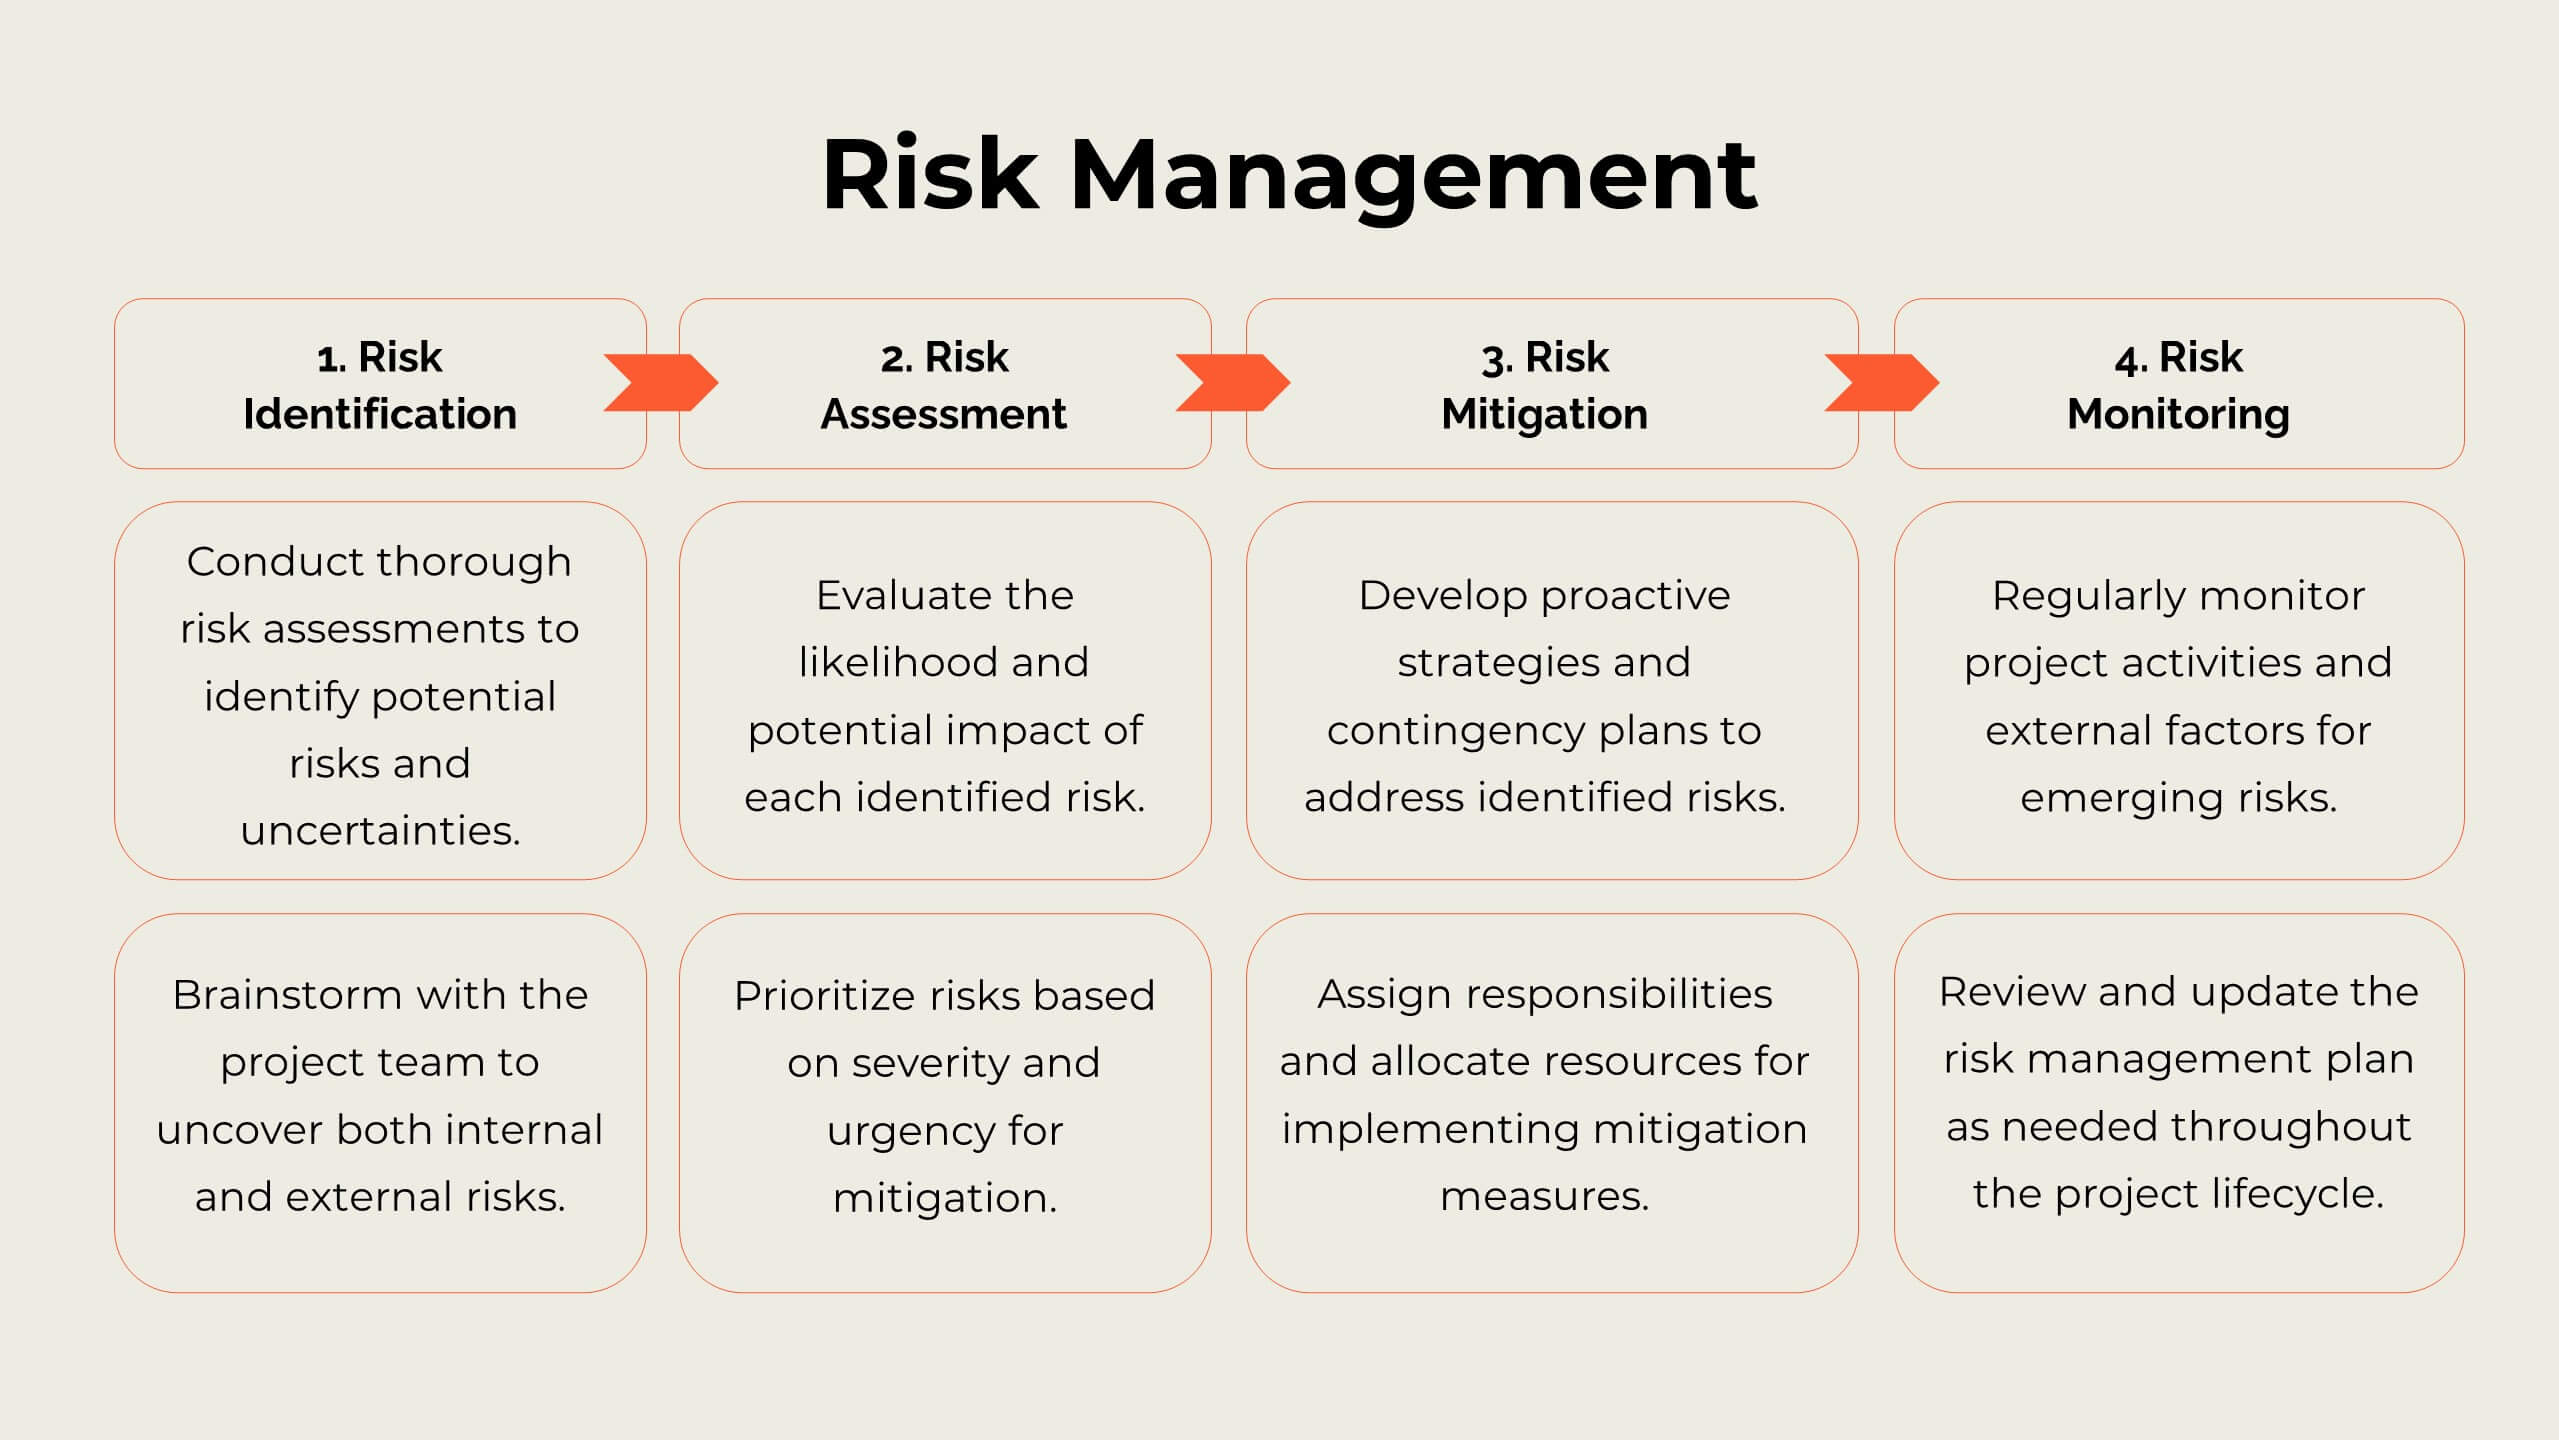
Revitalize your marketing efforts with this dynamic strategy plan template! Perfect for outlining objectives, competitive analysis, and target audience identification, it includes slides for SWOT analysis, resource allocation, and implementation plans. Engage stakeholders with vibrant visuals and comprehensive content. Compatible with PowerPoint, Keynote, and Google Slides for seamless presentations on any platform.


5 diapositivas
Value Chain Business Model Presentation
Spark fresh insight into how your organization creates value with this clean, arrow-based layout that makes every step feel intuitive and action-ready. This presentation breaks down key activities, support processes, and improvement opportunities in a clear visual flow perfect for strategy discussions. Fully compatible with PowerPoint, Keynote, and Google Slides.


5 diapositivas
Risk Assessment Heat Map Presentation
Evaluate risks effectively with a structured heat map. This Risk Assessment Heat Map helps visualize potential threats by mapping probability and impact levels. Ideal for risk management, business continuity planning, and decision-making. Fully customizable and compatible with PowerPoint, Keynote, and Google Slides for professional and seamless integration.


4 diapositivas
Blockchain and Cryptocurrency Market Analysis Presentation
Present complex blockchain structures and crypto market layers with clarity using the Blockchain and Cryptocurrency Market Analysis presentation template. Featuring a stacked cylinder diagram with four interactive data points, this layout is ideal for breaking down transaction flows, network layers, or decentralized finance (DeFi) ecosystems. Each title block offers space for concise key insights. Best suited for blockchain consultants, fintech startups, and crypto analysts. Fully compatible with PowerPoint, Keynote, and Google Slides.


3 diapositivas
Short-Term and Long-Term Action Goals Presentation
Plan with purpose using the Short-Term and Long-Term Action Goals Presentation. This clear, side-by-side layout helps you organize initiatives by timeframe—perfect for project planning, strategy roadmaps, or goal tracking. Fully editable in Canva, PowerPoint, and Google Slides for easy customization across teams and presentations.


8 diapositivas
Social Media Engagement Report Presentation
Deliver impactful campaign reviews with the Social Media Engagement Report Presentation. This dynamic layout uses a megaphone visual to amplify your messaging and organize engagement data into four key segments. Perfect for tracking audience reactions, measuring reach, or presenting content performance. Compatible with PowerPoint, Keynote, and Google Slides for seamless customization.


4 diapositivas
IT Network Infrastructure
Simplify the complexity of your digital ecosystem with this IT Network Infrastructure presentation. Designed to visualize connectivity, servers, and system architecture, this layout is perfect for IT teams, consultants, and tech-focused reports. Fully editable in PowerPoint, Keynote, and Google Slides for seamless integration into your workflow.


5 diapositivas
Division List Infographics
A Division List is a list of items or numbers that have been divided or categorized based on a certain criterion or set of criteria. These Infographics are visual representation of data that allows you to divide and categorize information into smaller groups or categories. These can be used to display any kind of data that requires grouping, such as military ranks, airlines, religion or virus symptoms. This template is designed using bold colors, various shapes, and icons to make the data more engaging and visually appealing. These are perfect for business presentations, marketing campaigns, and educational materials.


4 diapositivas
Real Estate Business Proposal
Make a lasting impression with this key-and-houses layout, perfect for unlocking your property pitch. Designed for real estate professionals, agencies, and consultants presenting market strategies or service offerings. Easily customizable in PowerPoint, Keynote, and Google Slides.


4 diapositivas
Effective Leadership Tips Presentation
Lead with clarity and confidence using this clean, modern presentation design. Perfect for sharing management insights, motivational principles, and communication strategies, it helps visualize ideas that inspire stronger teams and better decision-making. Fully editable and compatible with PowerPoint, Keynote, and Google Slides for effortless professional customization.

1 diapositiva
Geometric Shapes for Visual Clarity Presentation
Present your ideas with precision using this geometric-themed slide layout. Featuring four diamond icons in vibrant outline styles, this template is perfect for breaking down key business concepts. Ideal for professional briefings, marketing plans, or strategy decks. Fully customizable in Canva, PowerPoint, Keynote, and Google Slides.


5 diapositivas
Fitness Benefits Infographics
Fitness Benefits refer to the positive effects that physical activity and exercise can have on a person's health and well-being. This Infographic is a visual representation of the benefits that people can derive from regular exercise and physical activity. It is a great tool to educate people about the importance of staying fit and active, as well as inspire them to start or continue their fitness journey. Include additional information, such as tips for staying motivated, ideas for different types of exercise, and resources for further learning or support. This template can be a powerful tool to promote the importance of fitness and motivate people.


4 diapositivas
Economic Impact on Stock Market
Visualize financial cause and effect with this step-by-step economic impact infographic. Ideal for explaining market trends, policy changes, or fiscal outcomes, this slide uses a four-part arrow path starting with a money bag icon. Each stage—A to D—can be customized with data and analysis. Fully editable in PowerPoint, Keynote, and Google Slides.


21 diapositivas
Ember Echo Graphic Design Project Plan Presentation
The Ember Graphic Design Project Plan template is the perfect canvas for your creative journey! Kickstart your project with a sleek and professional introduction that sets the tone for your design vision. This template is designed to guide you through every step of the design process, from the initial brief to the final presentation. Highlight your target audience, concept development, and design elements with beautifully crafted slides that capture the essence of your project. Dive into the specifics with dedicated sections for brand identity components, textures, and the design process itself, ensuring that every detail is covered. The template also includes mood boards, prototypes, and design assets, making it easy to showcase your work in progress. With feedback and testing slides, you can iterate and refine your designs before presenting the final product. This template is fully compatible with PowerPoint, Keynote, and Google Slides, making it versatile and easy to use for any creative project.


4 diapositivas
Top Cryptocurrency Market Trends Presentation
Bring financial insights to life with a modern, data-focused layout designed to showcase the latest movements, growth, and innovations in digital assets. Ideal for analysts and entrepreneurs, it turns trends into clear visuals for any audience. Fully compatible with PowerPoint, Keynote, and Google Slides for easy customization and professional results.


6 diapositivas
Iceberg Chart Infographic
An iceberg infographic is a visual representation that uses the metaphor of an iceberg to convey information. This infographic template is designed to highlights the idea that only a small portion of the iceberg is visible above the waterline, while the majority of its mass remains hidden beneath the surface. The larger portion of the iceberg, submerged below the waterline, symbolizes the deeper or less obvious aspects of a topic. This can include underlying causes, complexities, challenges, or additional information that may not be immediately apparent. This is fully customizable and compatible with Powerpoint, Keynote, and Google Slides.