


Características


¿Tienes alguna pregunta?
Recomendar
20 diapositivas
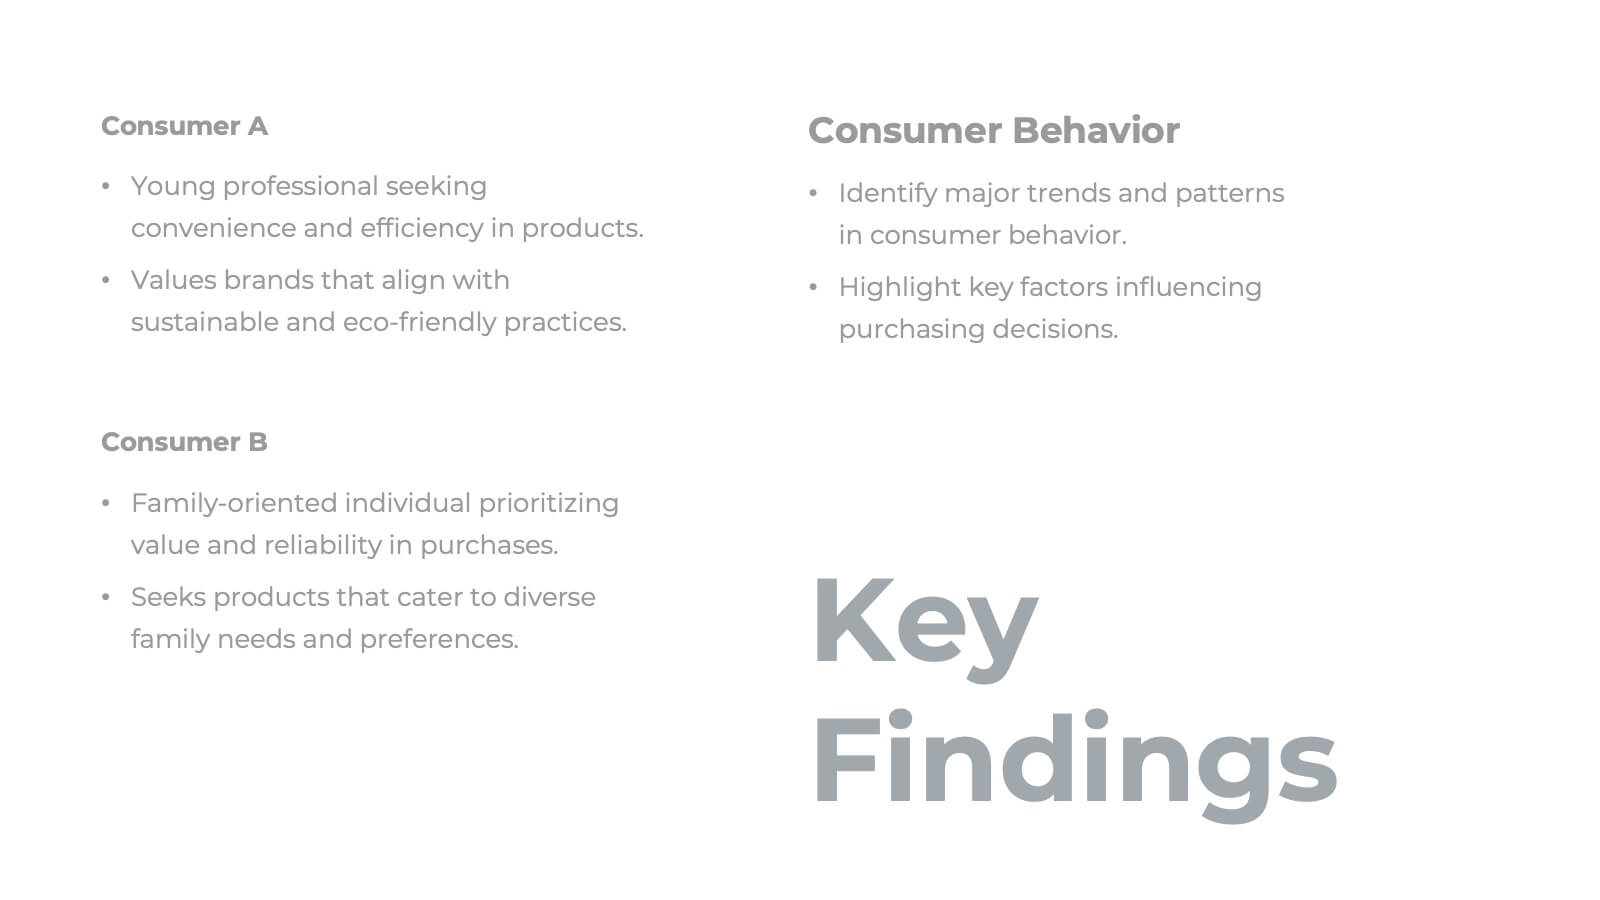
Malachite Research Proposal Presentation
Present your research findings with clarity and professionalism using this structured research presentation template! Covering all essential elements, from research objectives and methodology to key findings and implications, this template ensures your work is communicated effectively. It's perfect for academic, corporate, or scientific presentations. Compatible with PowerPoint, Keynote, and Google Slides, it's versatile and ready for your next project.


7 diapositivas
Technology Development Infographic Presentation
Technology has become an integral part of modern society and plays a crucial role in almost every aspect of our lives. This is a high quality, easily editable and fully layered infographic template. It includes many useful elements to add your data such as icons, charts, text boxes, bullet points, and a map to grab your audience’s attention. Showcase how technology has been developed over the years and how it is developing today. You can use this template for your class or for professional presentations. This is a multipurpose template, compatible with PowerPoint, Keynote and Google Slides.


2 diapositivas
Engaging Opening Introduction Presentation
Make a lasting first impression with this Engaging Opening Introduction Slide. Designed for professional presentations, networking events, and business pitches, this slide offers a modern, structured layout with a dynamic image section and clear text area. Fully customizable in PowerPoint, Keynote, and Google Slides, you can easily adjust colors, fonts, and content to match your brand.


21 diapositivas
Goldenshadow Professional Portfolio Showcase Presentation
A refined portfolio presentation template crafted to highlight professional achievements and expertise. Showcase featured projects, collaborations, and client testimonials with a sleek, modern design. Includes sections for services offered, awards, pricing, and contact information. Fully customizable and compatible with PowerPoint, Keynote, and Google Slides for impactful portfolio presentations.

24 diapositivas
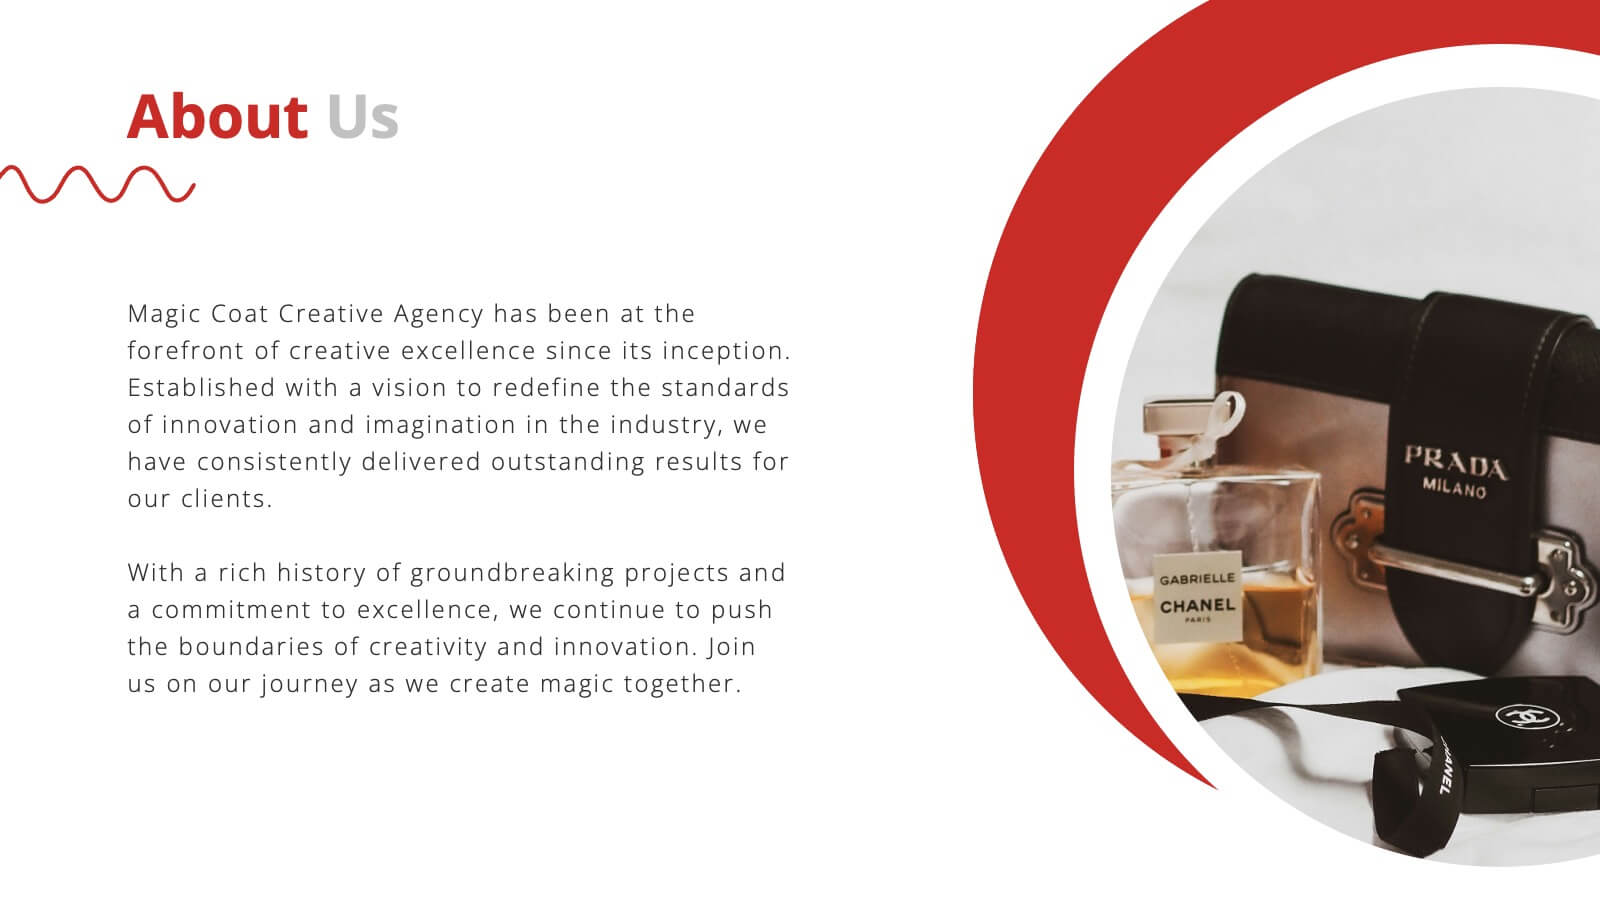
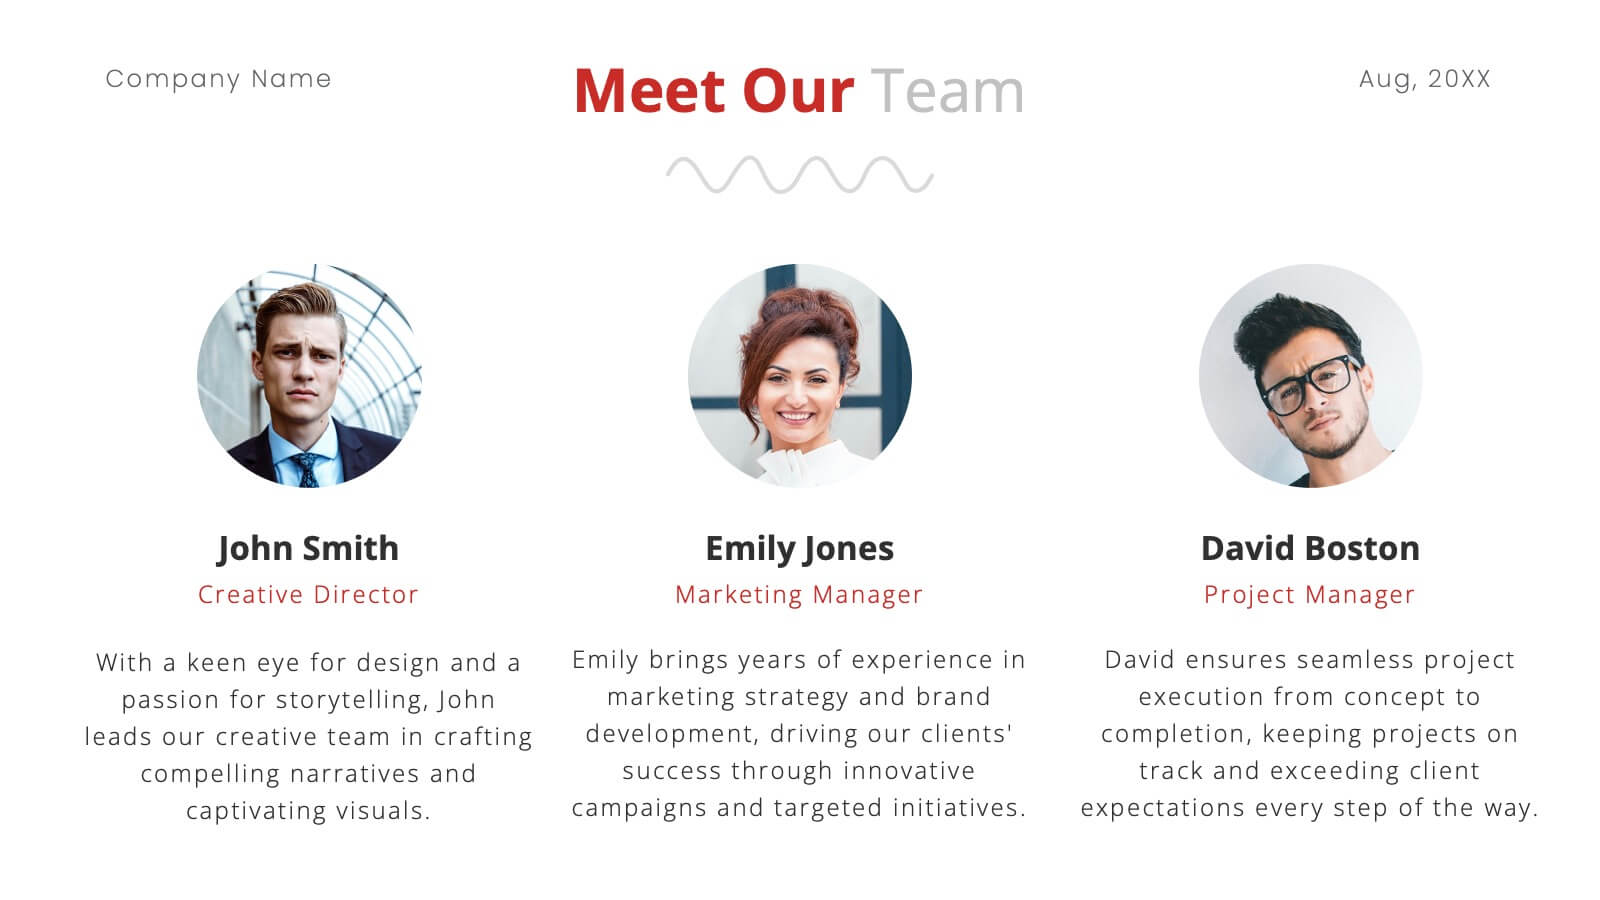
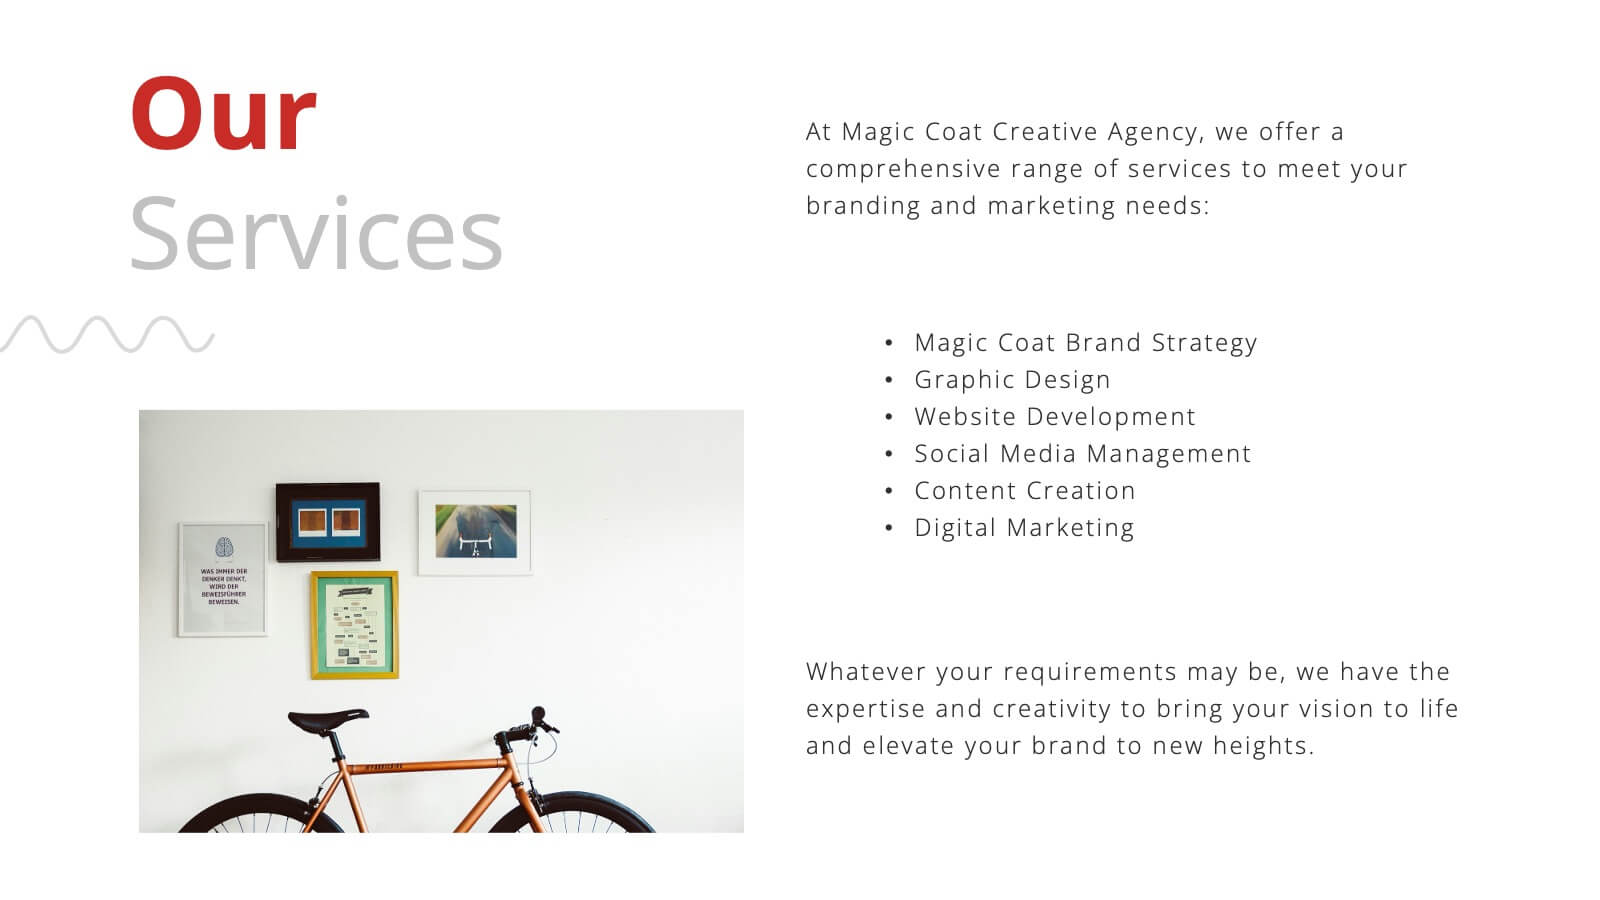
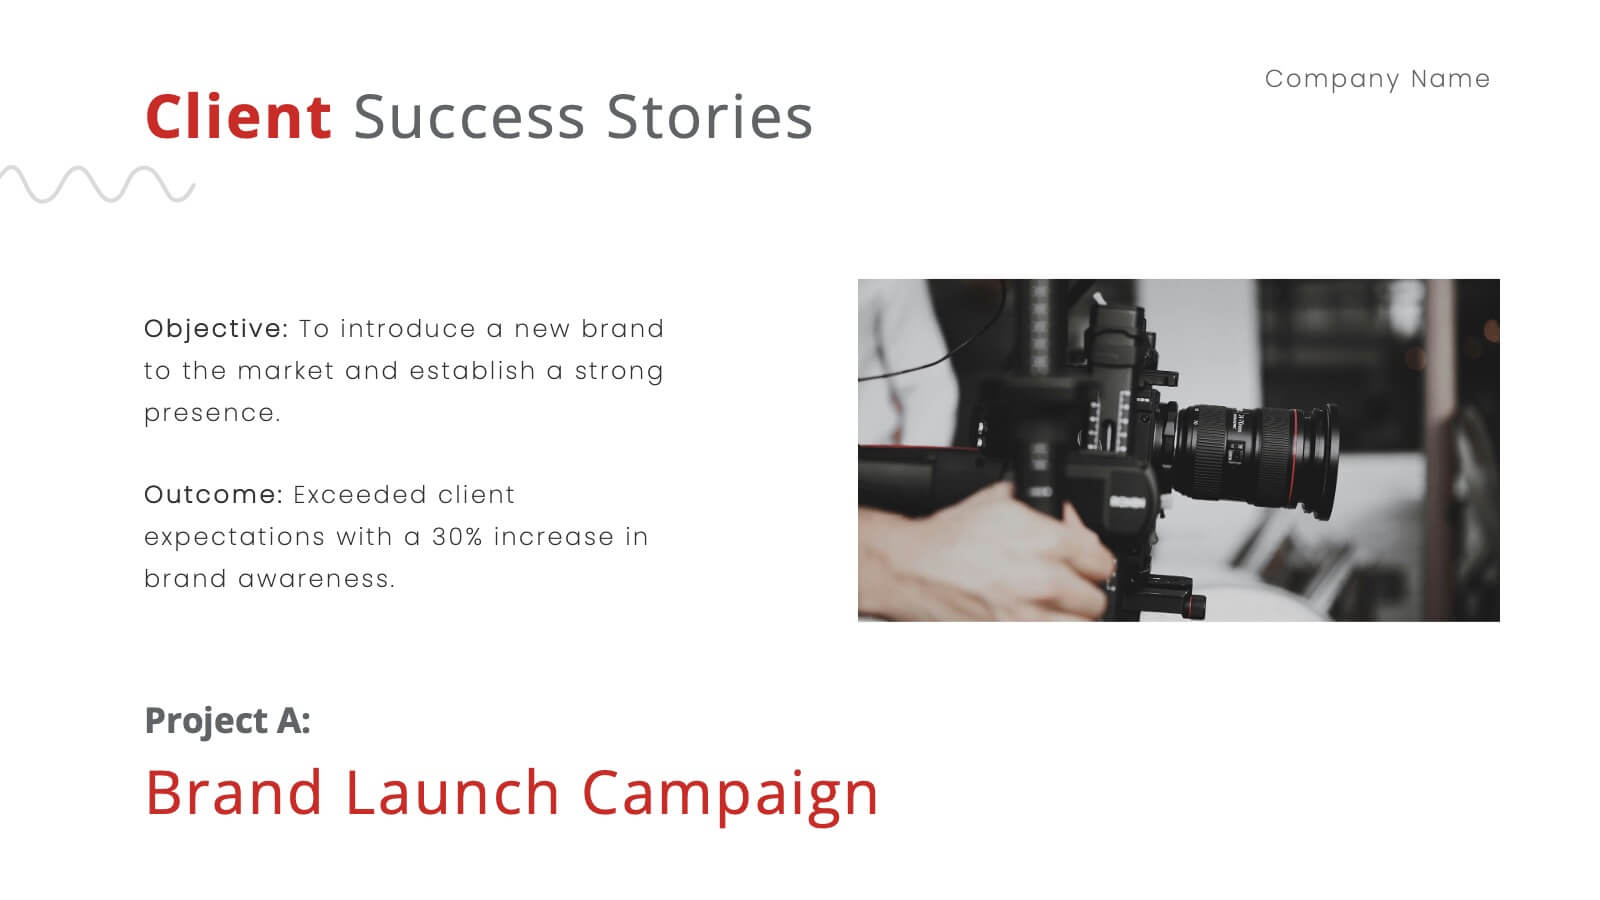
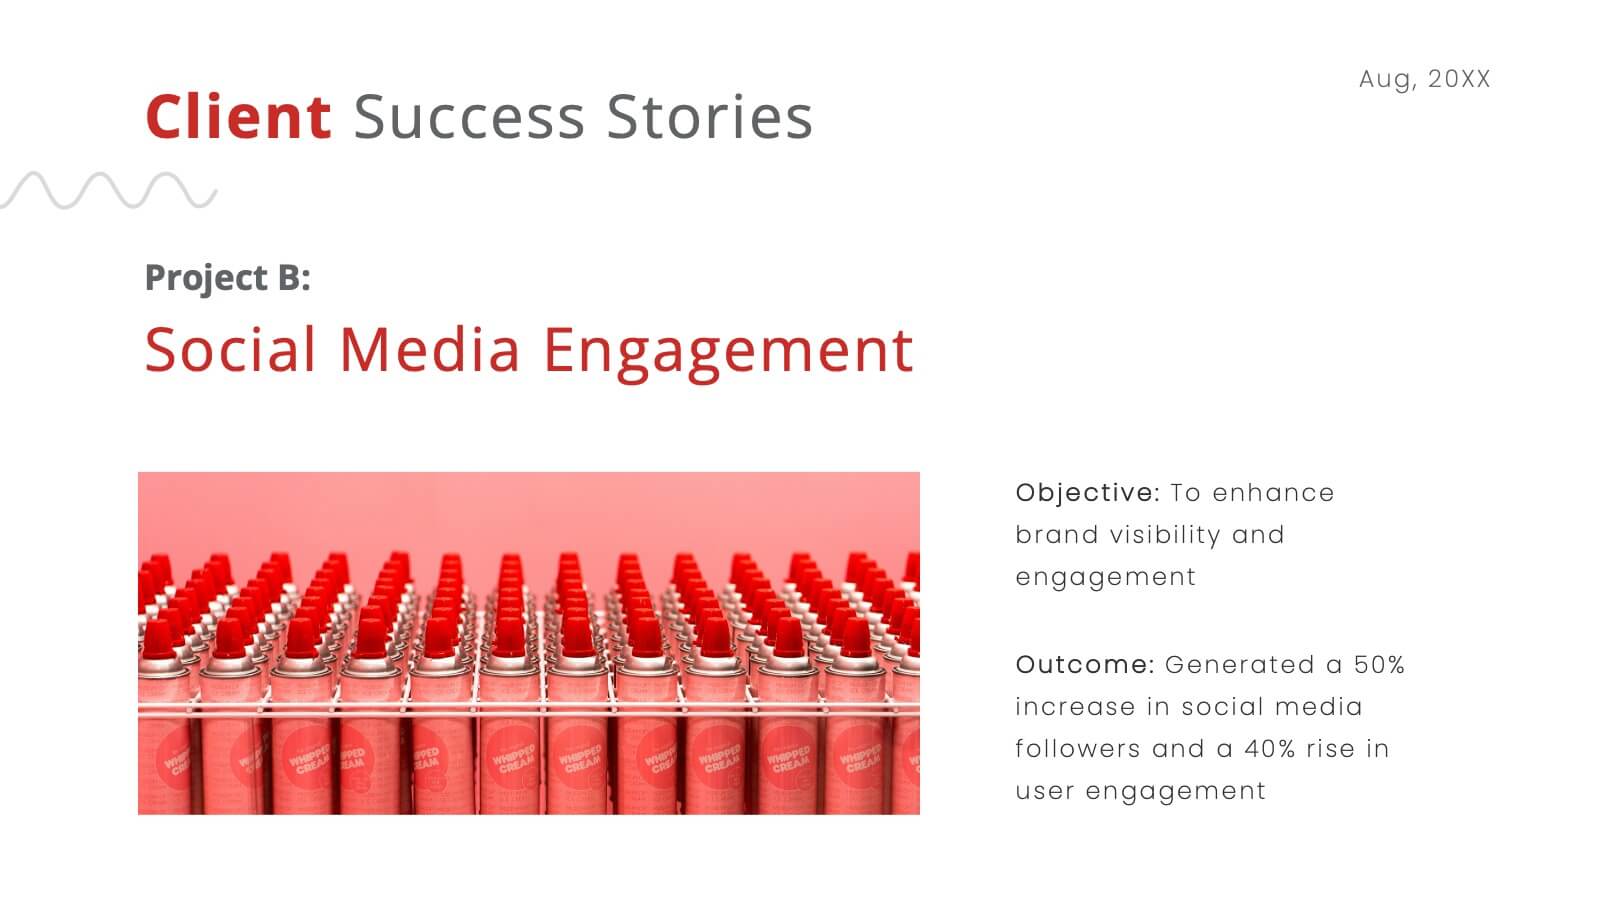
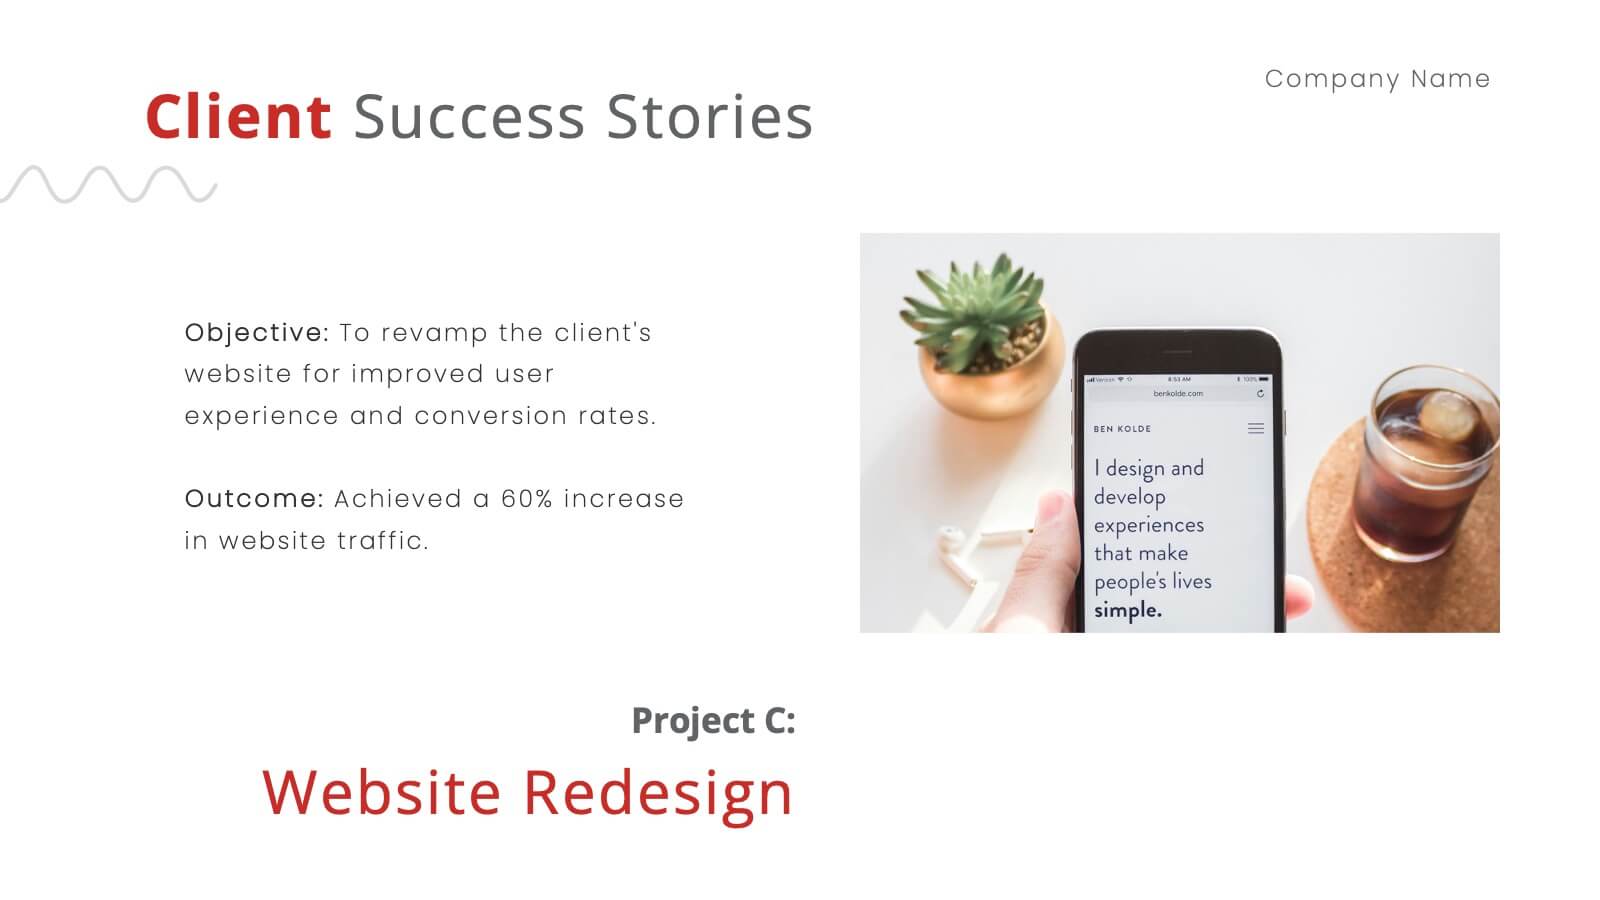
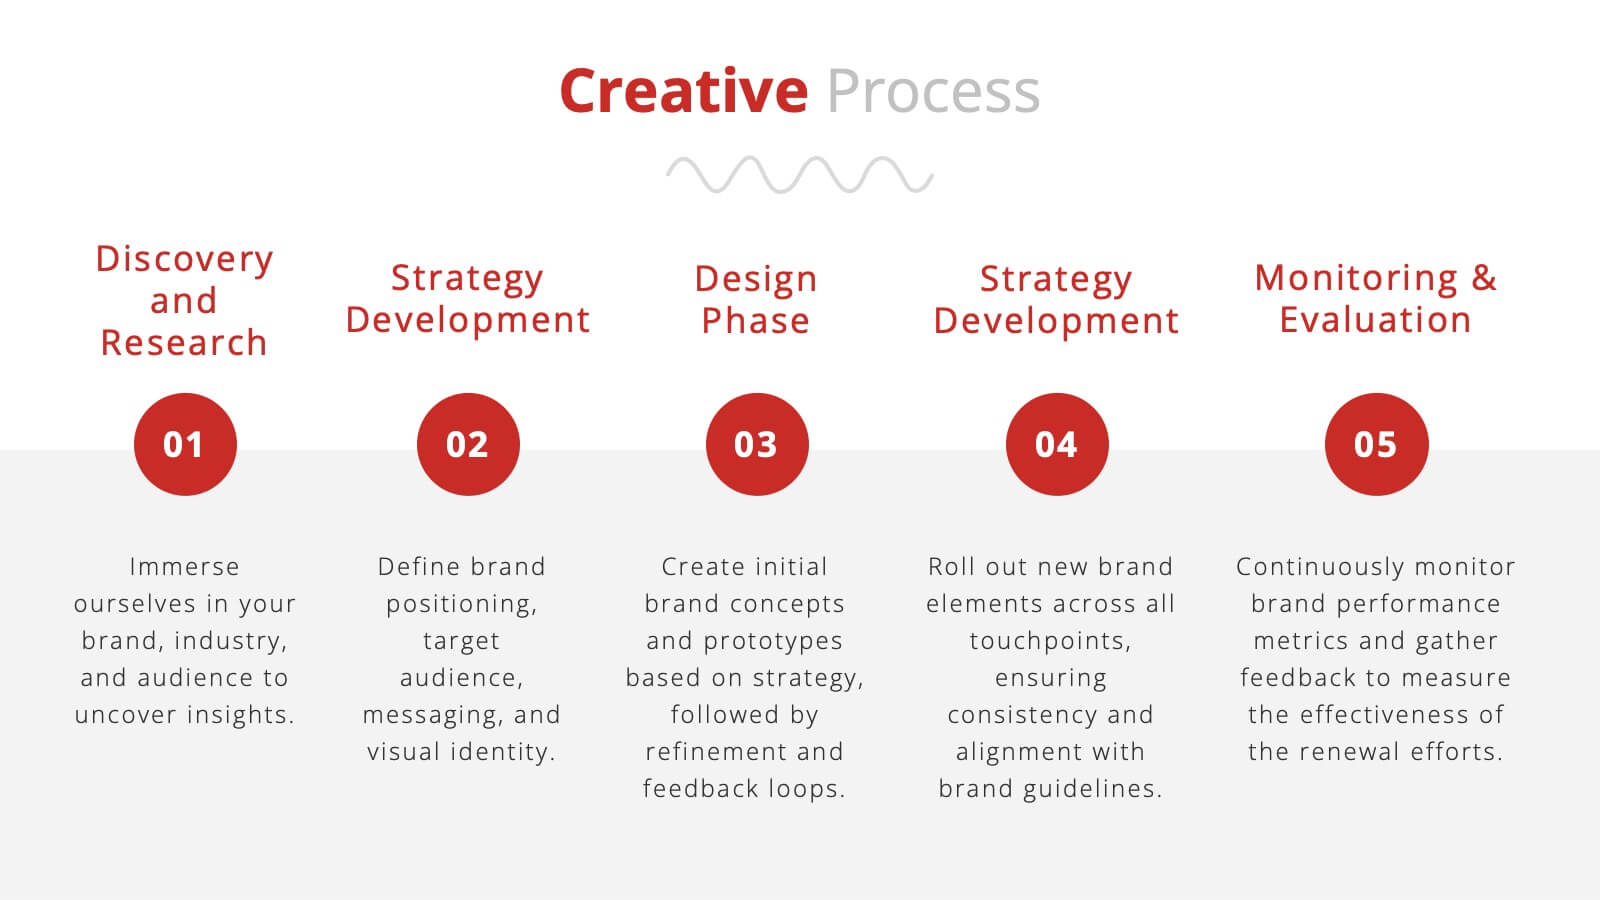
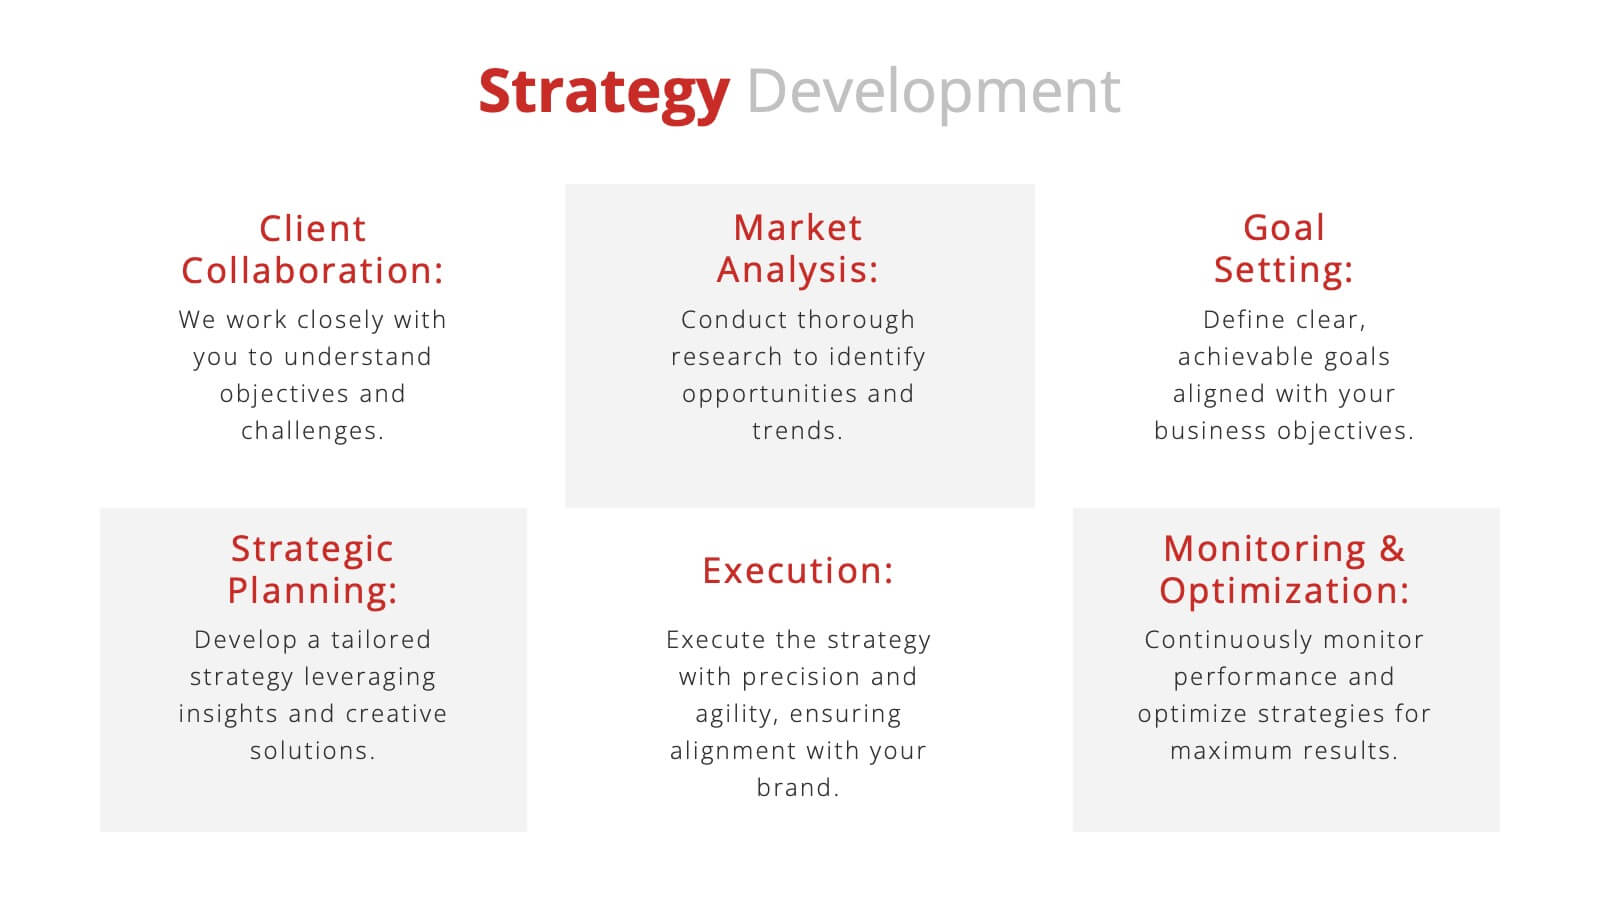
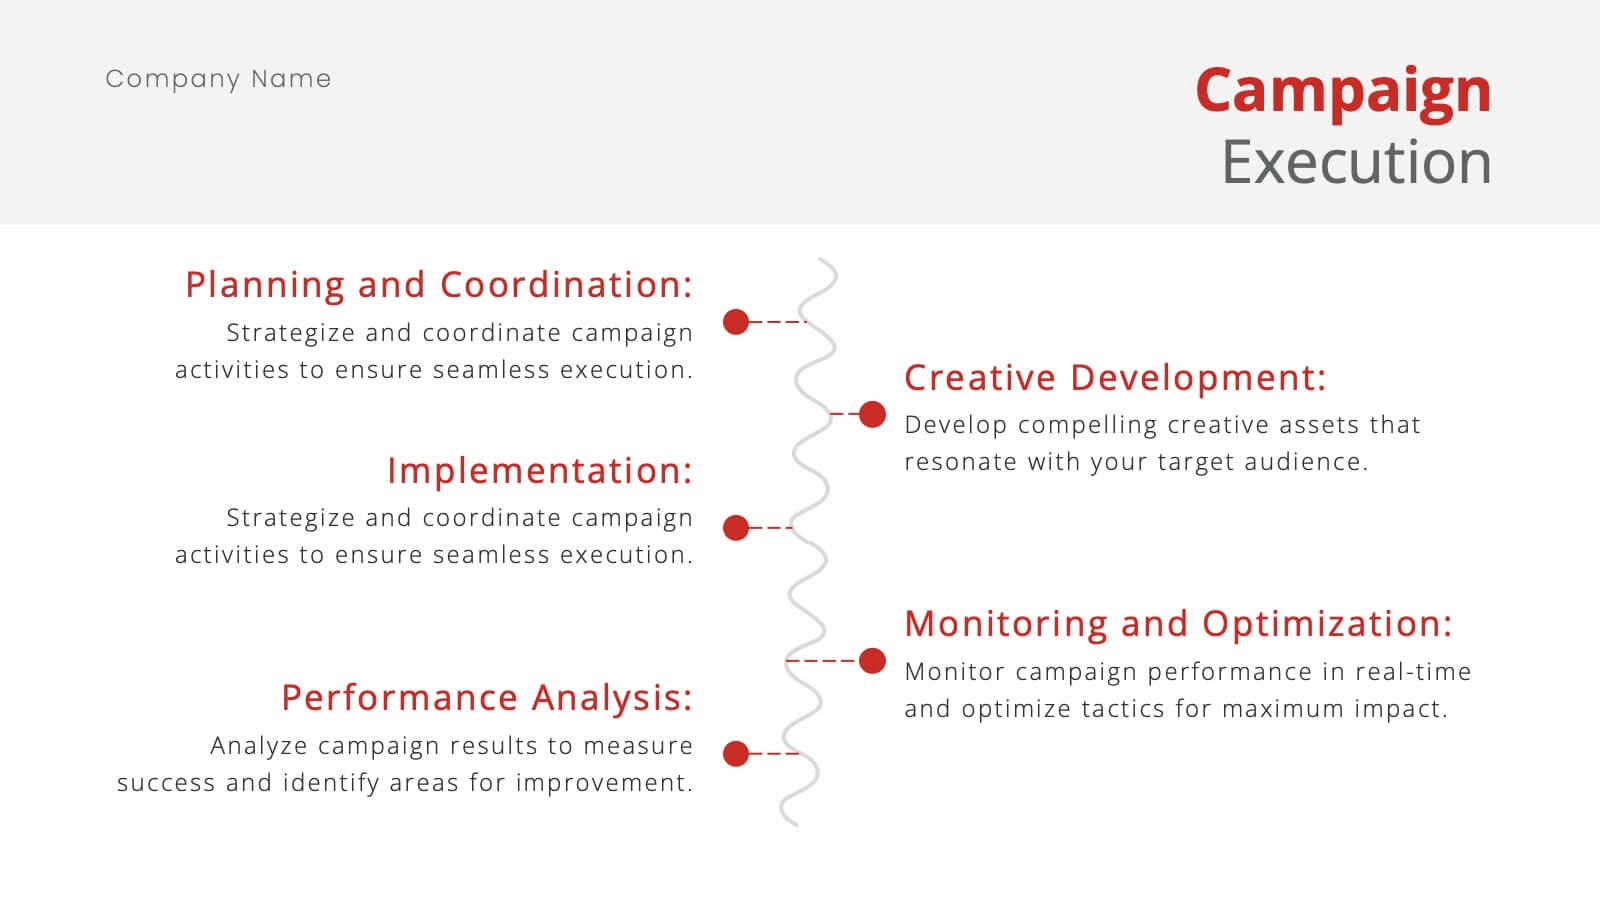
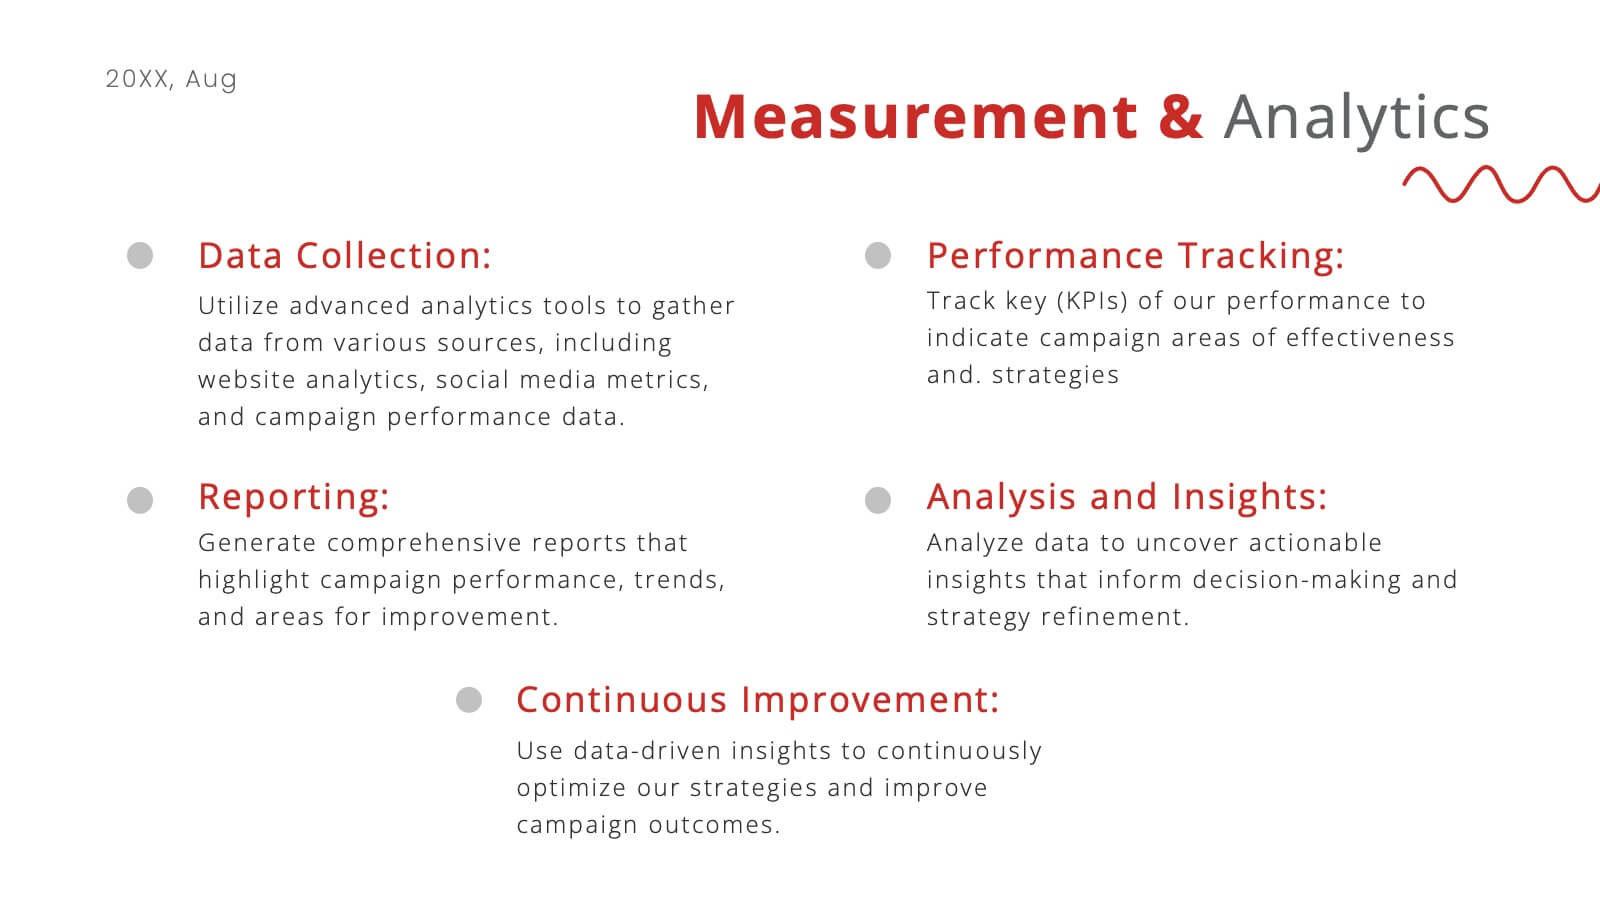
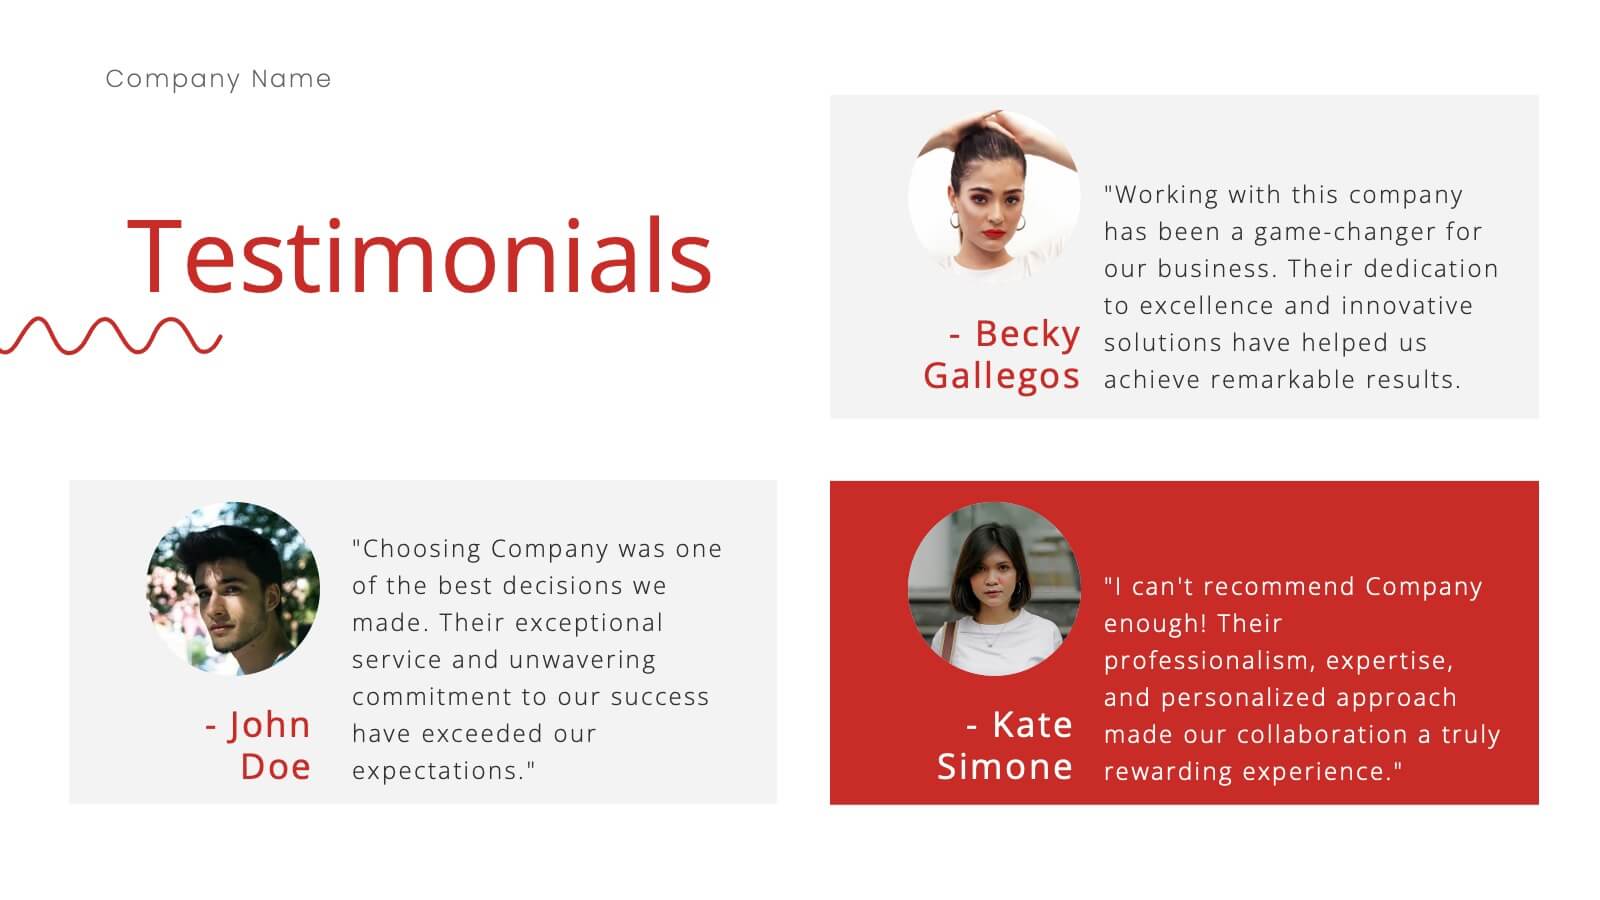
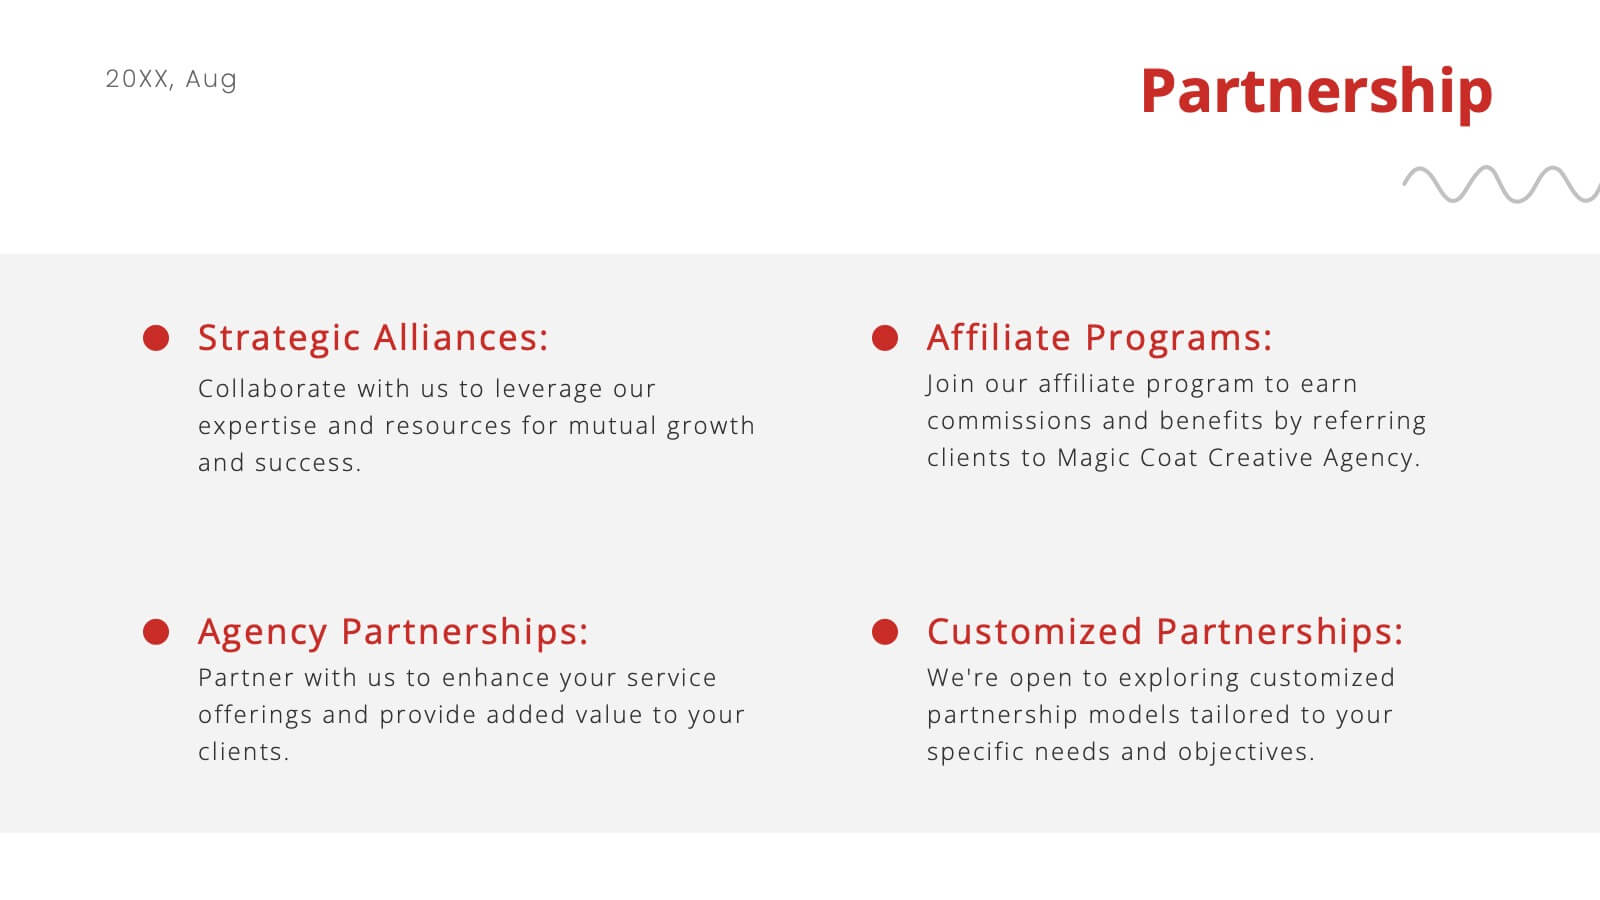
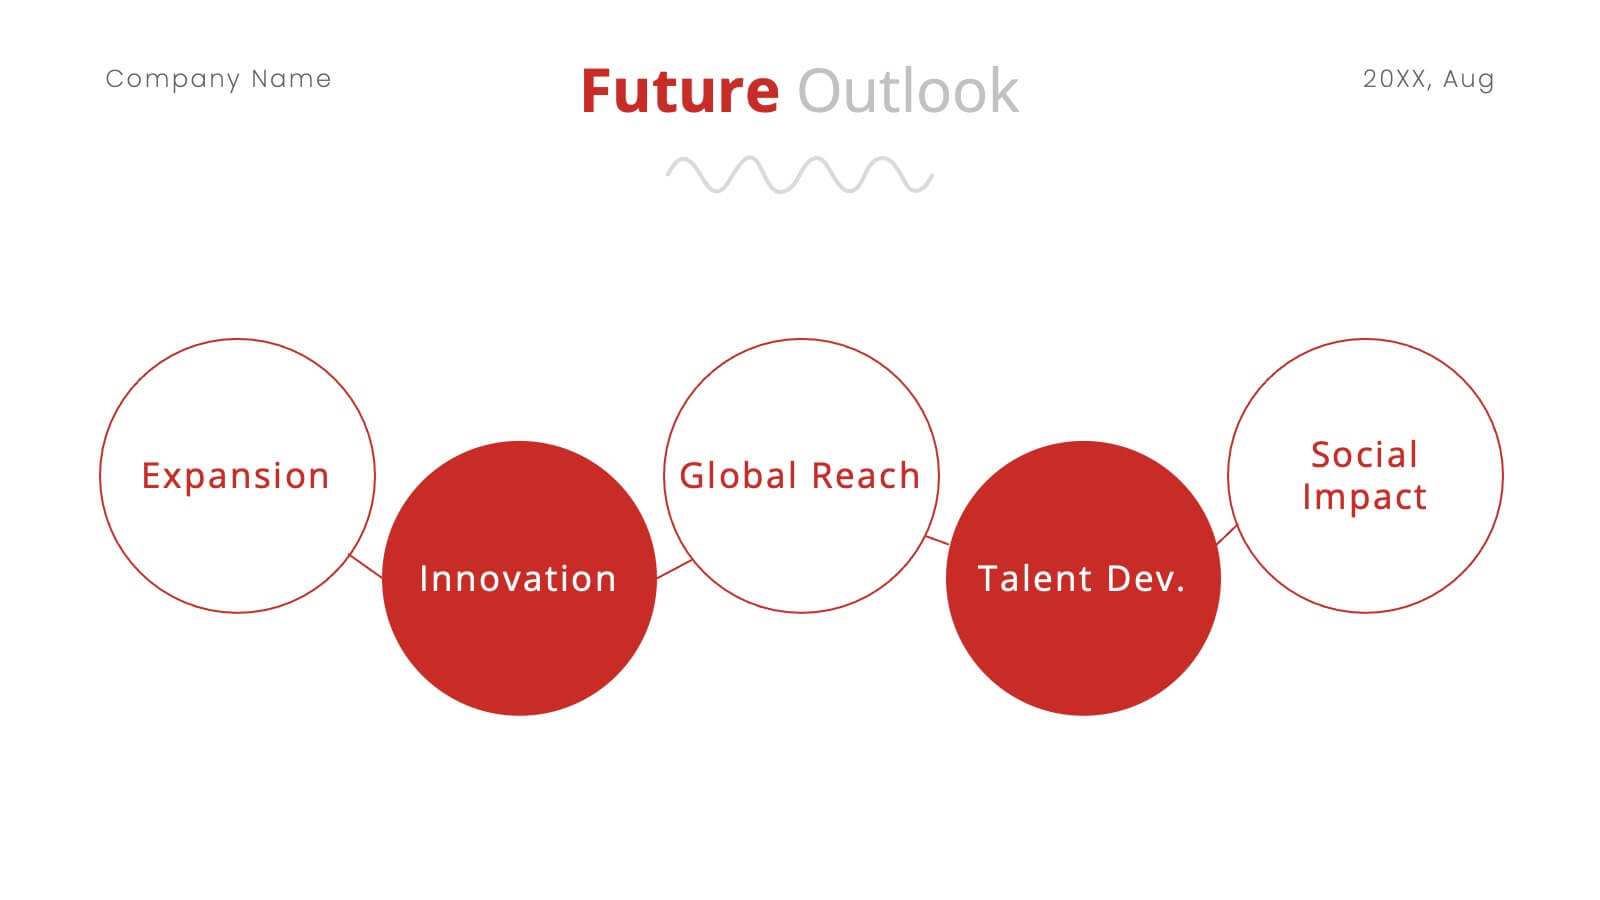
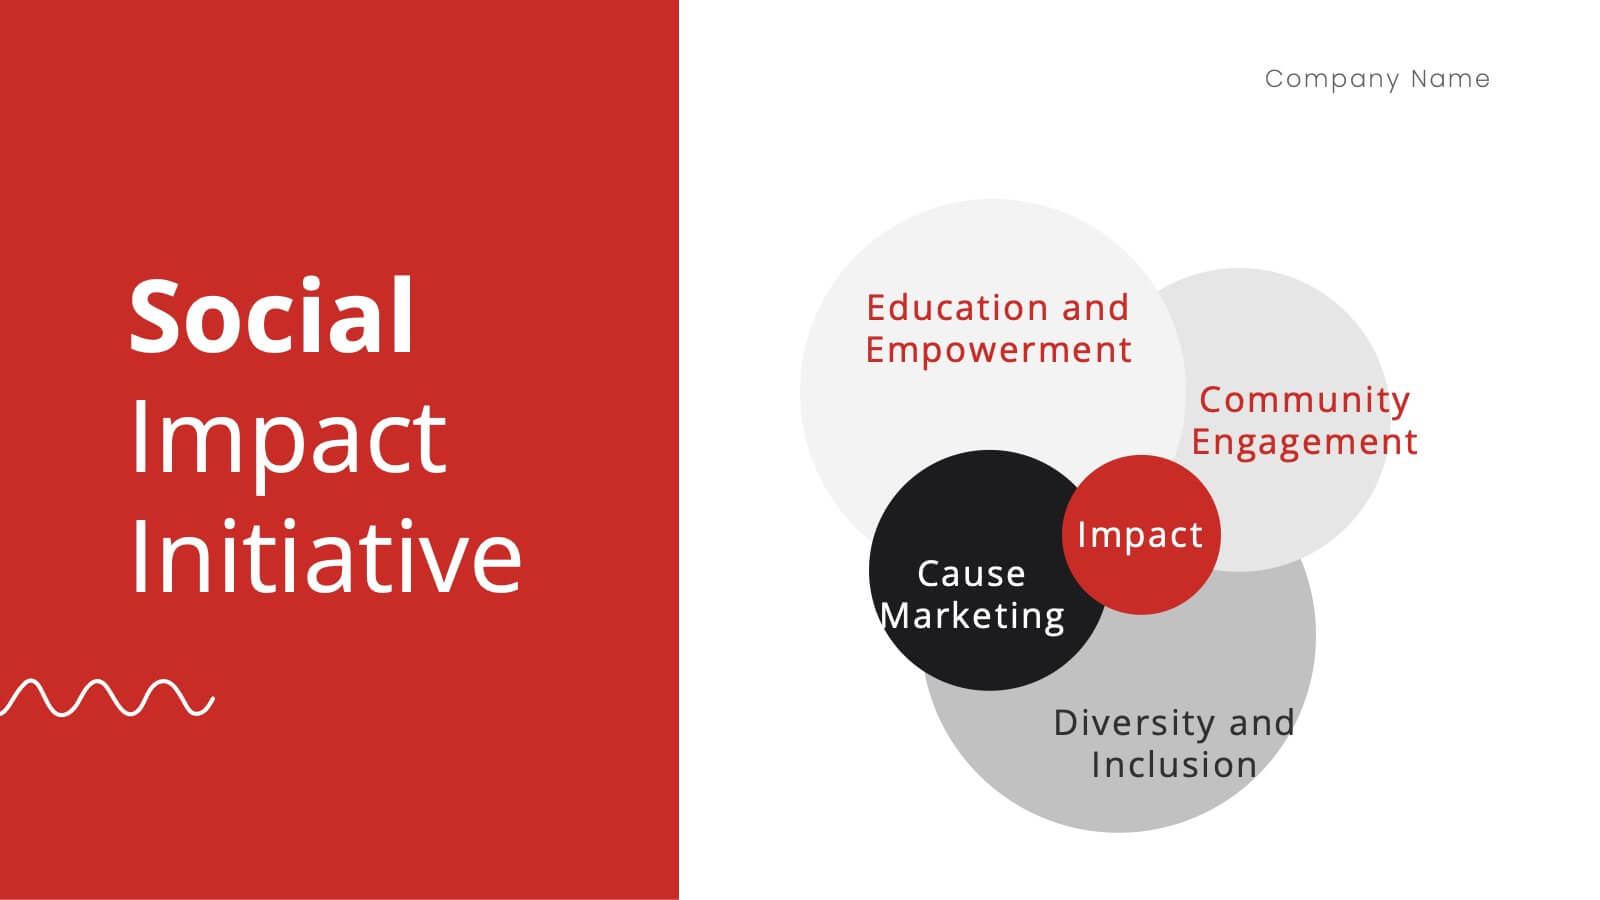
Nickel Advertising Agency Proposal Presentation
Take your advertising agency to the next level with this sleek and modern presentation template! Highlighting your services, team, success stories, and marketing strategies, it’s the perfect tool to showcase your agency’s strengths and capabilities. Fully customizable and compatible with PowerPoint, Keynote, and Google Slides, this template is ideal for impressing potential clients and partners.


4 diapositivas
Social Media Content Strategy Presentation
Engage your audience with this Social Media Content Strategy Presentation. Featuring side-by-side thumbs-up icons, this template visually contrasts two key focus areas—ideal for comparing campaign goals, content pillars, or platform strategies. Each section includes editable text blocks to outline insights clearly. Fully customizable and compatible with PowerPoint, Keynote, and Google Slides.


21 diapositivas
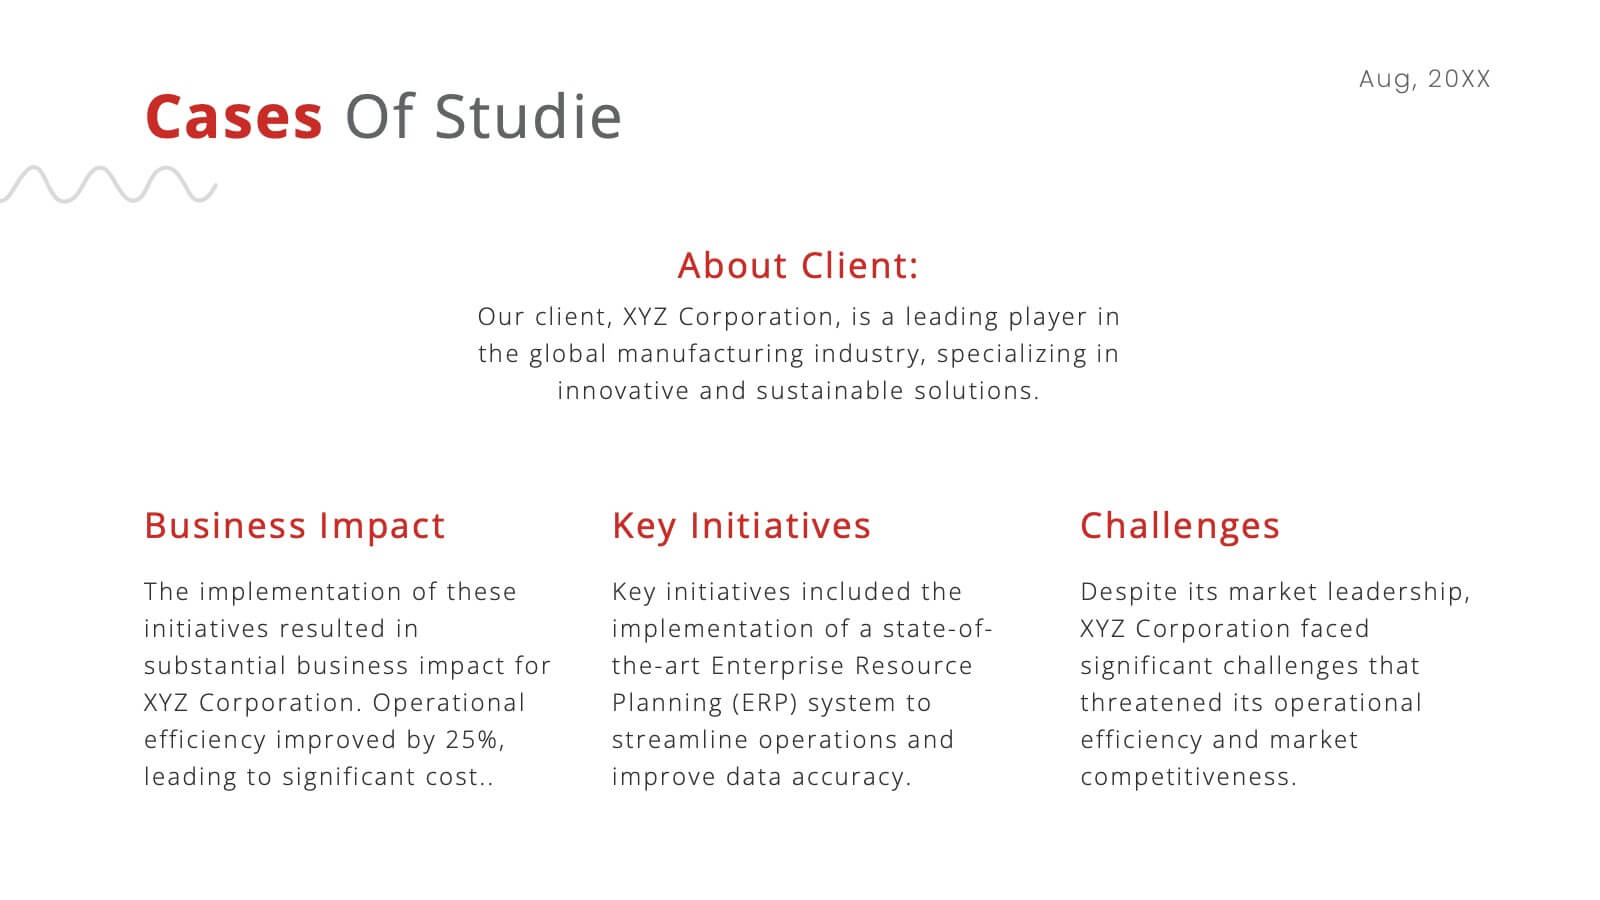
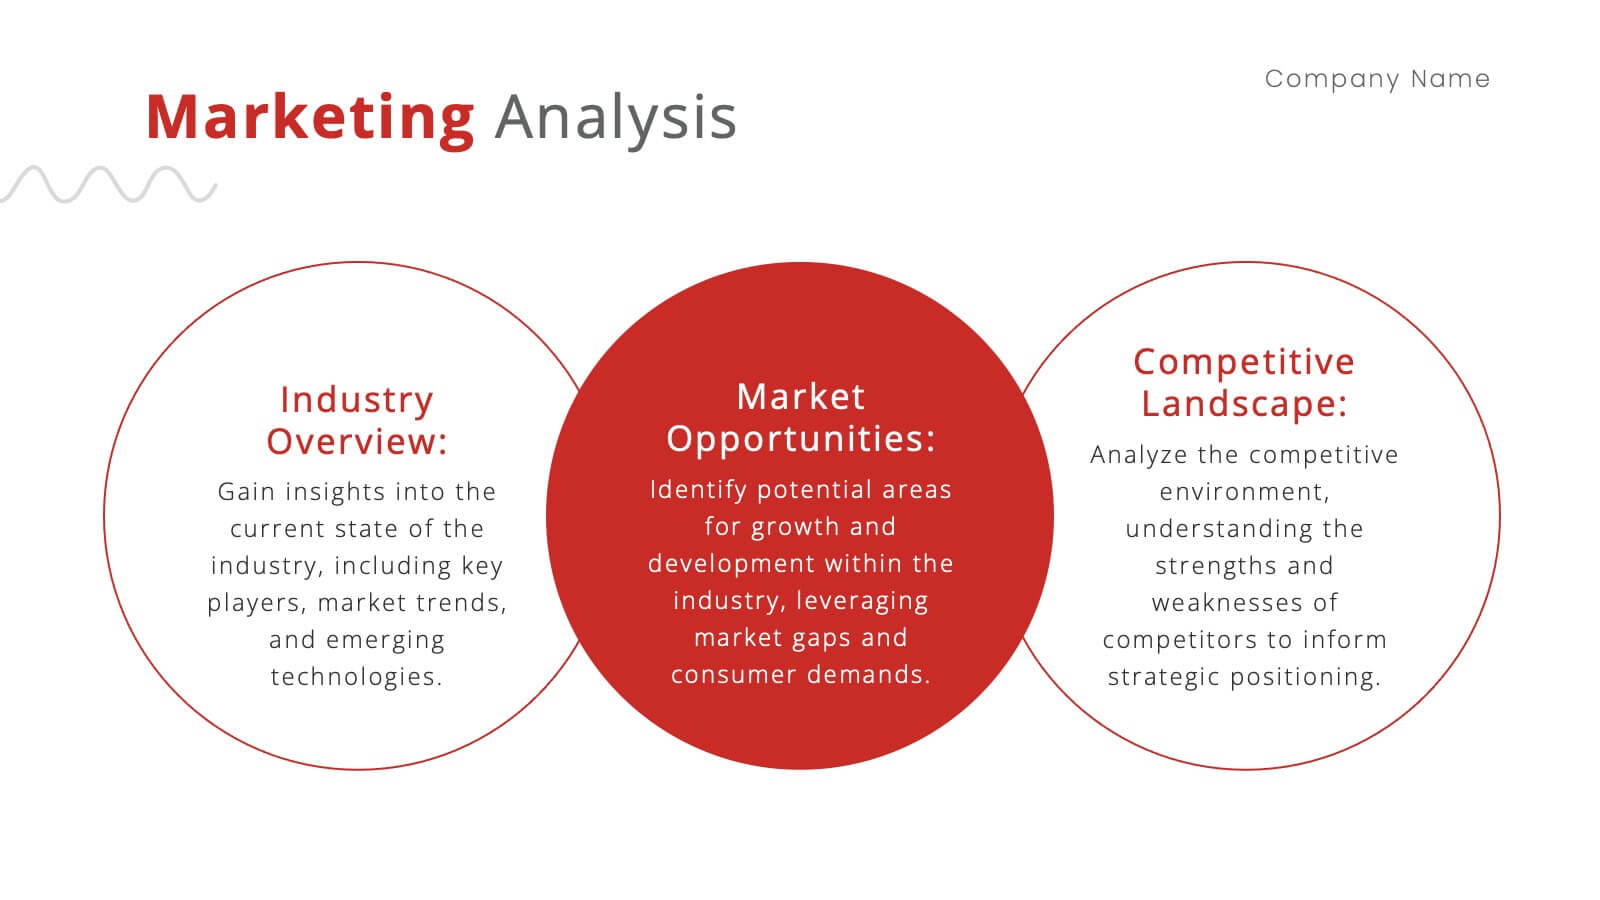
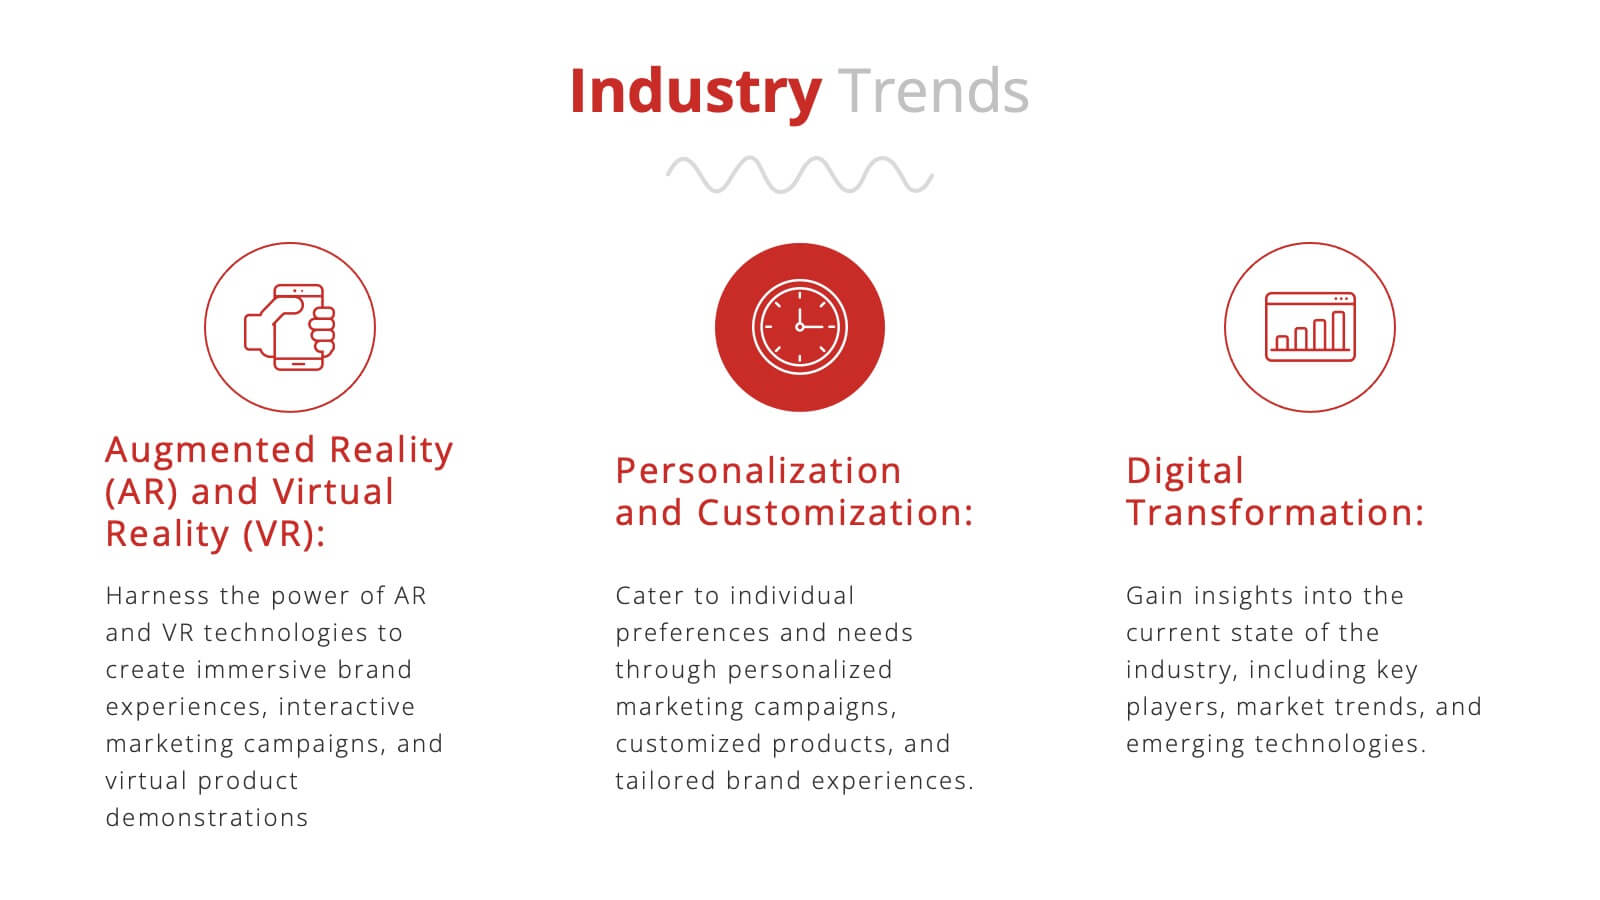
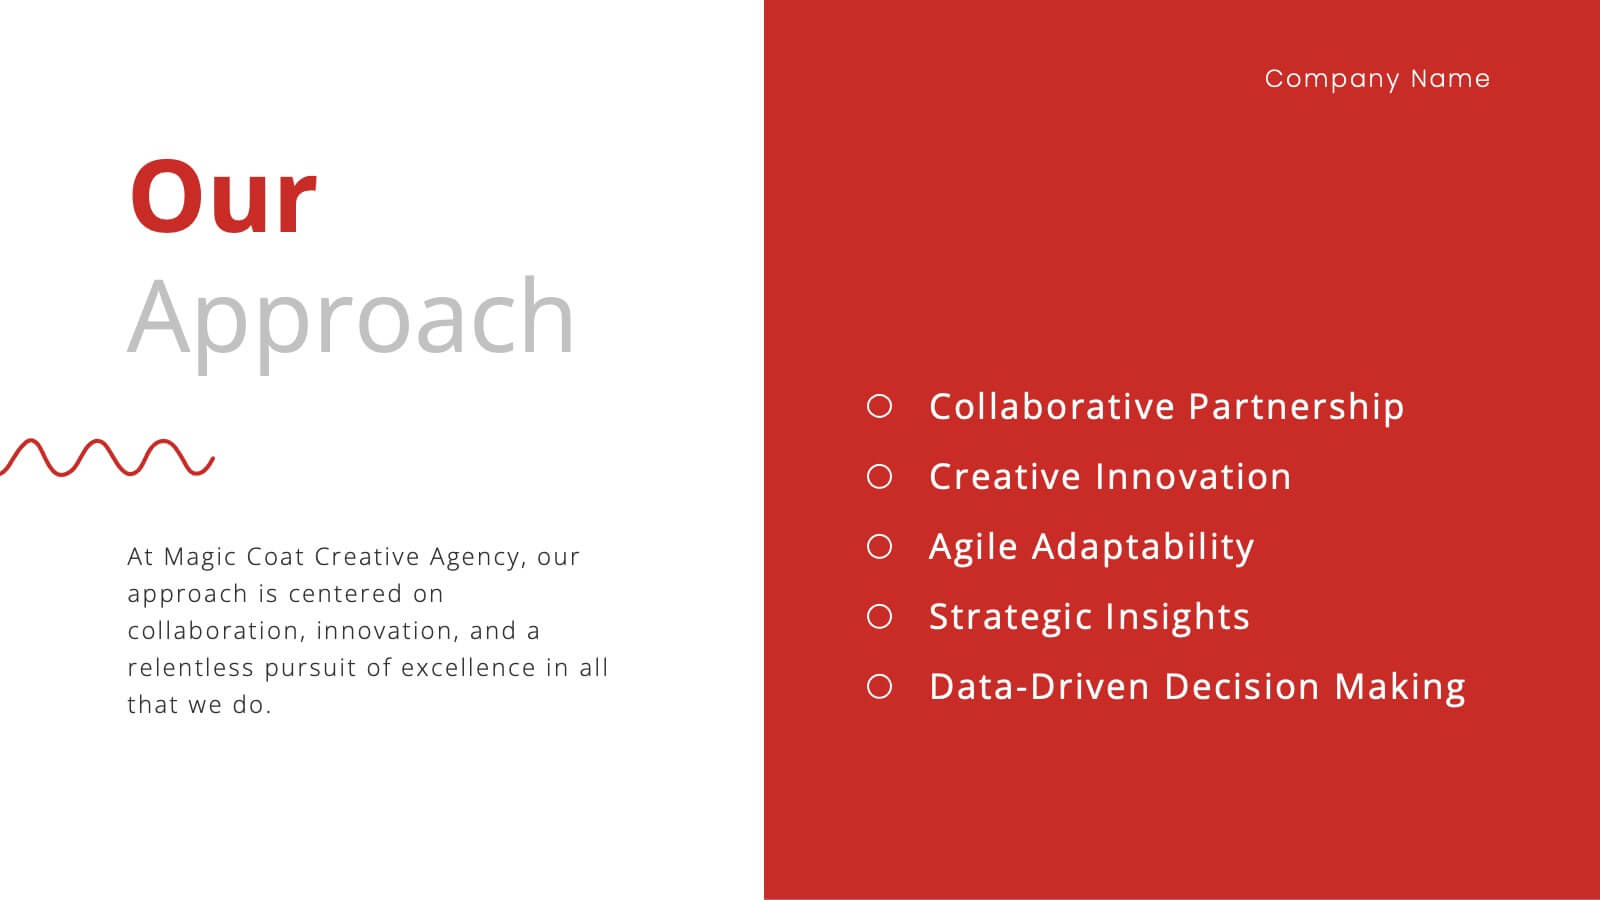
Creative Sales Pitch Presentation
Boost your sales presentations with this sleek, professional template designed to captivate and inform. With its modern design, clear layout, and strategic use of visuals, this template is perfect for showcasing sales strategies, performance metrics, and future opportunities. Compatible with PowerPoint, Keynote, and Google Slides, it's ideal for seamless use across all devices.


26 diapositivas
Remote Work Strategies Presentation
Enhance your team's flexibility with our Remote Work Strategies presentation template, designed for use with PowerPoint, Keynote, and Google Slides. This template is an invaluable asset for team leaders, HR professionals, and business consultants dedicated to cultivating a productive remote work culture. Our template is tailored to provide an in-depth analysis of remote work best practices, offering slides that cover essential strategies for communication, collaboration, and project management in a virtual environment. It also includes insights on setting up a successful home office, maintaining work-life balance, and leveraging technology for seamless remote operations. With customizable elements, you can illustrate the advantages of remote work, share success stories, and provide actionable tips to maximize team efficiency from afar. This template is SEO-optimized to ensure your presentation reaches those seeking to optimize their remote work operations and foster a thriving digital workplace.


10 diapositivas
Key Information Recap Summary
Conclude your presentation with clarity using this Key Information Recap Summary slide. Featuring a modern key-shaped design with four customizable sections, it’s perfect for summarizing essential insights. Fully compatible with PowerPoint, Keynote, and Google Slides.


4 diapositivas
Harvey Ball Ratings Presentation
Make your evaluations stand out with this sleek and intuitive presentation design. Perfect for rating performance, comparing metrics, or visualizing customer feedback, it brings clarity and visual balance to your data. Easily editable and fully compatible with PowerPoint, Keynote, and Google Slides for a smooth, professional presentation experience.


34 diapositivas
Bootstrapping Pitch Deck
Introducing our Bootstrapping Pitch Deck presentation! This template is designed to help you create a compelling pitch deck for your startup or business. With its minimal and modern design, this template will help you communicate your approach and showcase your business to potential investors, partners, or stakeholders. The slides are designed with a minimalist layout that allows for easy comprehension and emphasizes the key points of your pitch. The visuals, such as charts, graphs, and icons, are strategically used to convey information in a visually engaging manner and support your key messages. This template is fully customizable.


7 diapositivas
Remote Work Guidelines and Setup Presentation
Bring clarity to your remote work setup with this sleek visual guide—designed to communicate processes, tools, and best practices in one easy-to-follow layout. Whether you're onboarding a team or streamlining operations, this slide helps break it all down step by step. Fully compatible with PowerPoint, Keynote, and Google Slides.


6 diapositivas
5-Step SEO Marketing Funnel Presentation
Ignite your marketing story with a bold, flowing visual that makes every step feel purposeful and easy to follow. This presentation breaks down each stage of the SEO funnel, helping you explain strategy, performance, and conversion paths with clarity. Fully compatible with PowerPoint, Keynote, and Google Slides.


26 diapositivas
Remote Work Best Practices Creative Presentation
Navigate the world of telecommuting with our Remote Work Best Practices presentation template, available for Powerpoint, Google Slides, and Keynote. This template is specially designed for the modern remote work environment, incorporating a blend of professional and engaging visuals that reflect the flexibility and innovation of working from home. The template features customizable slides for outlining communication tools, scheduling, and mental health tips. Whether you're onboarding new staff or refining your company's remote policies, this template will help you present a comprehensive guide to succeeding in the remote work landscape.


7 diapositivas
Feedback Infographics Presentation Template
The goal of feedback is to recognize strengths and improve weaknesses. Feedback, both positive and negative, helps us see what we can improve on in order to better our results. This template is perfect for understanding how essential feedback is, and learning how to deliver feedback in a productive way. It provides positive criticism, showing what you can improve to achieve better results and success. Feedback provides the opportunity to learn, and is the most effective way to improve your skills. This template makes it simple to create an informed and well-rounded presentation to share.


7 diapositivas
One-Page Business Model Overview Presentation
Simplify your business strategy with this One-Page Business Model slide. Perfect for pitches or internal reviews, it maps out key elements like partners, activities, customers, and revenue on a single page. Clean, customizable blocks help communicate your vision clearly—ideal for startups, entrepreneurs, and teams needing quick business clarity.


7 diapositivas
Watercolor Strategy Infographic
Dive into a cascade of strategic insights with our watercolor strategy infographic. Presented on a crisp white canvas, the splash of yellow, green, and blue emanates a fluidity that mirrors the dynamic nature of business strategies. Each hue merges seamlessly to provide a visual treat while retaining the core informational value. Tailored for Powerpoint, Keynote, and Google Slides, this template is embellished with customizable graphics, intricate icons, and flexible image placeholders, making it an ideal choice for any strategic visualization. Let your strategy flow, vivid and vibrant, just like watercolors on paper.