


Características


¿Tienes alguna pregunta?
Recomendar


7 diapositivas
Housing Investment Strategy Presentation
Visualize housing strategies with this clean, key-focused layout. Featuring a central house-and-key icon flanked by six sections, this slide is perfect for outlining investment stages, market insights, or project milestones. Fully editable in Canva, PowerPoint, and Google Slides—ideal for real estate professionals, developers, or analysts presenting actionable housing strategies.


7 diapositivas
Weight Challenge Infographic Presentation
Challenges are essential for personal and professional growth, and they play an important role in our lives in several ways. This template is designed for any and all use. You can use it in business, academic presentations, or home. This template is designed to give you flexibility in your presentations and allow you to create dynamic content that stands out from the crowd. This is compatible with Powerpoint, Keynote, and Google Slides so you can easily edit your presentation. This template can be used for a variety of projects, including team building, goal setting and brainstorming!


4 diapositivas
Executive Data Overview Dashboard Presentation
Drive informed decision-making with the Executive Data Overview Dashboard Presentation. This sleek, data-centric slide layout features clean blocks for KPIs, progress percentages, and simple bar or donut charts—ideal for summarizing business insights, performance metrics, or operational updates. Fully editable in PowerPoint, Keynote, and Google Slides, it's designed for clarity, speed, and high-level reporting.


4 diapositivas
Top Priorities and Checklist Format Presentation
Stay focused and aligned with the Top Priorities and Checklist Format Presentation. This clear, checklist-based design is ideal for highlighting action items, goals, or key project deliverables. Visually guide your team with structured sections and a checklist illustration that reinforces accountability. Fully editable in PowerPoint, Keynote, and Google Slides.


23 diapositivas
Bracken Small Business Pitch Deck Presentation
This clean and professional presentation template is perfect for showcasing your business ideas, market opportunities, and growth strategies. It includes essential sections such as company background, SWOT analysis, financial performance, marketing plan, and revenue models. Key highlights like competitive advantages, investment opportunities, and milestones ensure a comprehensive and organized pitch to captivate investors and stakeholders. Fully customizable and compatible with PowerPoint, Keynote, and Google Slides.


4 diapositivas
Modern Transportation and Logistics Strategy Presentation
Move your audience through a fast-paced world of movement and delivery with a clean, visual slide that maps out each step of your logistics process. This layout helps explain workflows, supply chain stages, and transportation planning with clarity and ease. Fully compatible with PowerPoint, Keynote, and Google Slides.


5 diapositivas
Organizational Decision Support System Presentation
Visually showcase team alignment and consensus using the Organizational Decision Support System slide. This layout features a row of team icons paired with "Yes"/"No" speech bubbles, making it perfect for illustrating decision outcomes, vote breakdowns, or approval processes. Easily editable in PowerPoint, Keynote, and Google Slides.


5 diapositivas
New Venture Pitch Deck Structure Presentation
Outline your pitch with clarity using the New Venture Pitch Deck Structure Presentation. Designed for startups and entrepreneurs, this vertical timeline layout helps you present key sections like business model, problem/solution, and go-to-market strategy. Fully editable in PowerPoint, Canva, and Google Slides to fit your branding needs.


23 diapositivas
Ethelin Digital Strategy Presentation
The digital strategy presentation template is designed to showcase your company's goals, market analysis, and strategic initiatives. Featuring slides for SWOT analysis, performance metrics, and action plans, it’s perfect for business planning and stakeholder engagement. Fully customizable and compatible with PowerPoint, Keynote, and Google Slides.

20 diapositivas
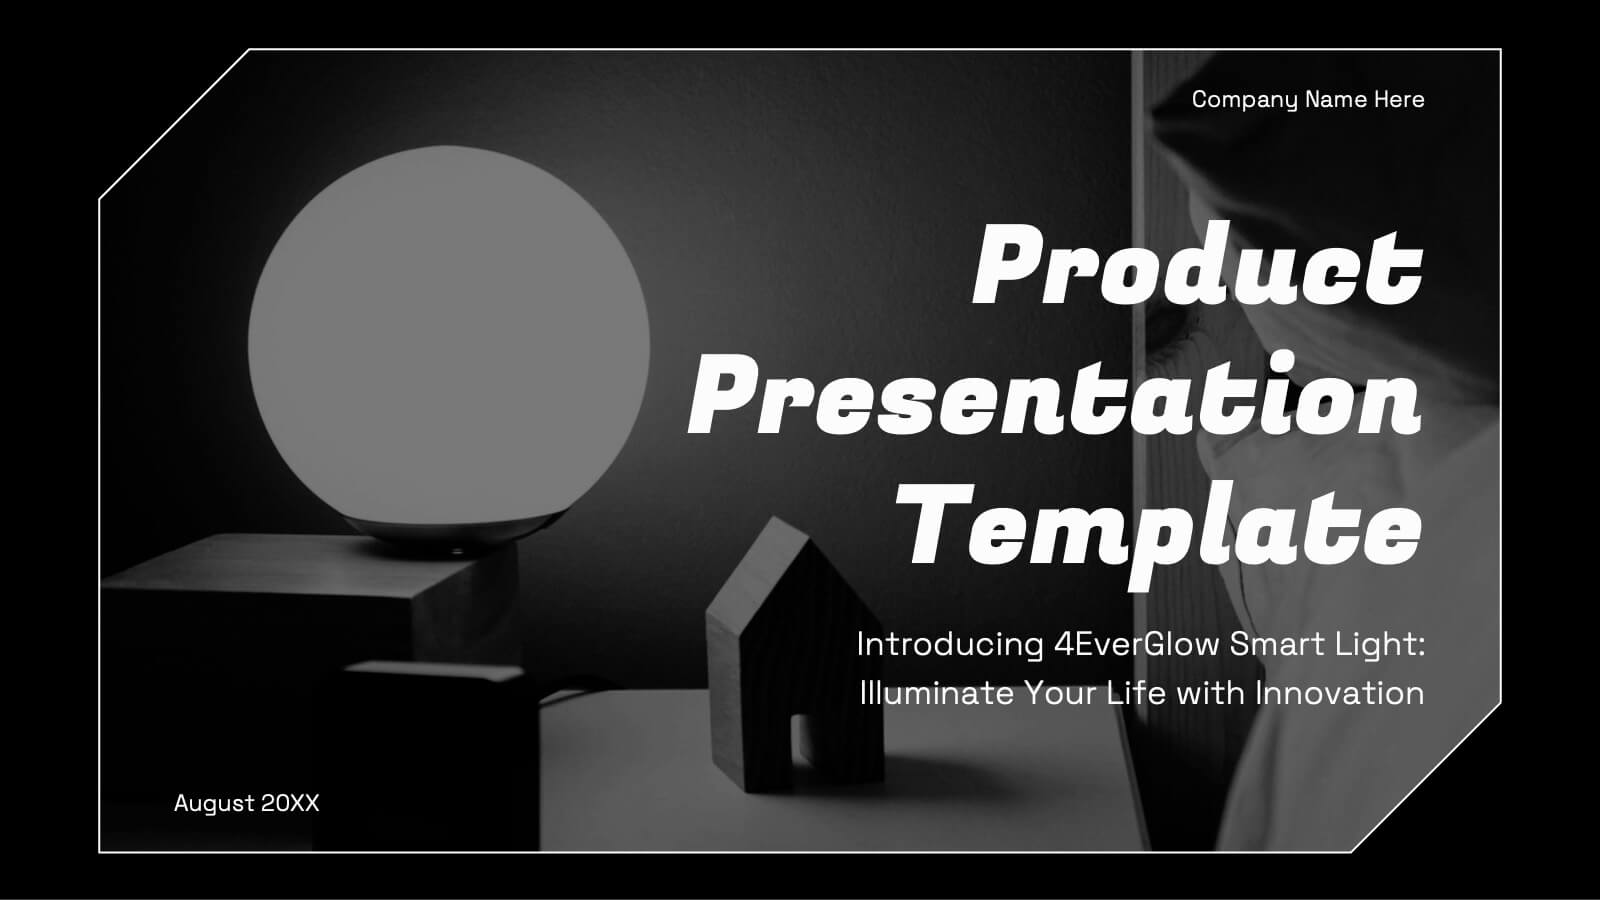
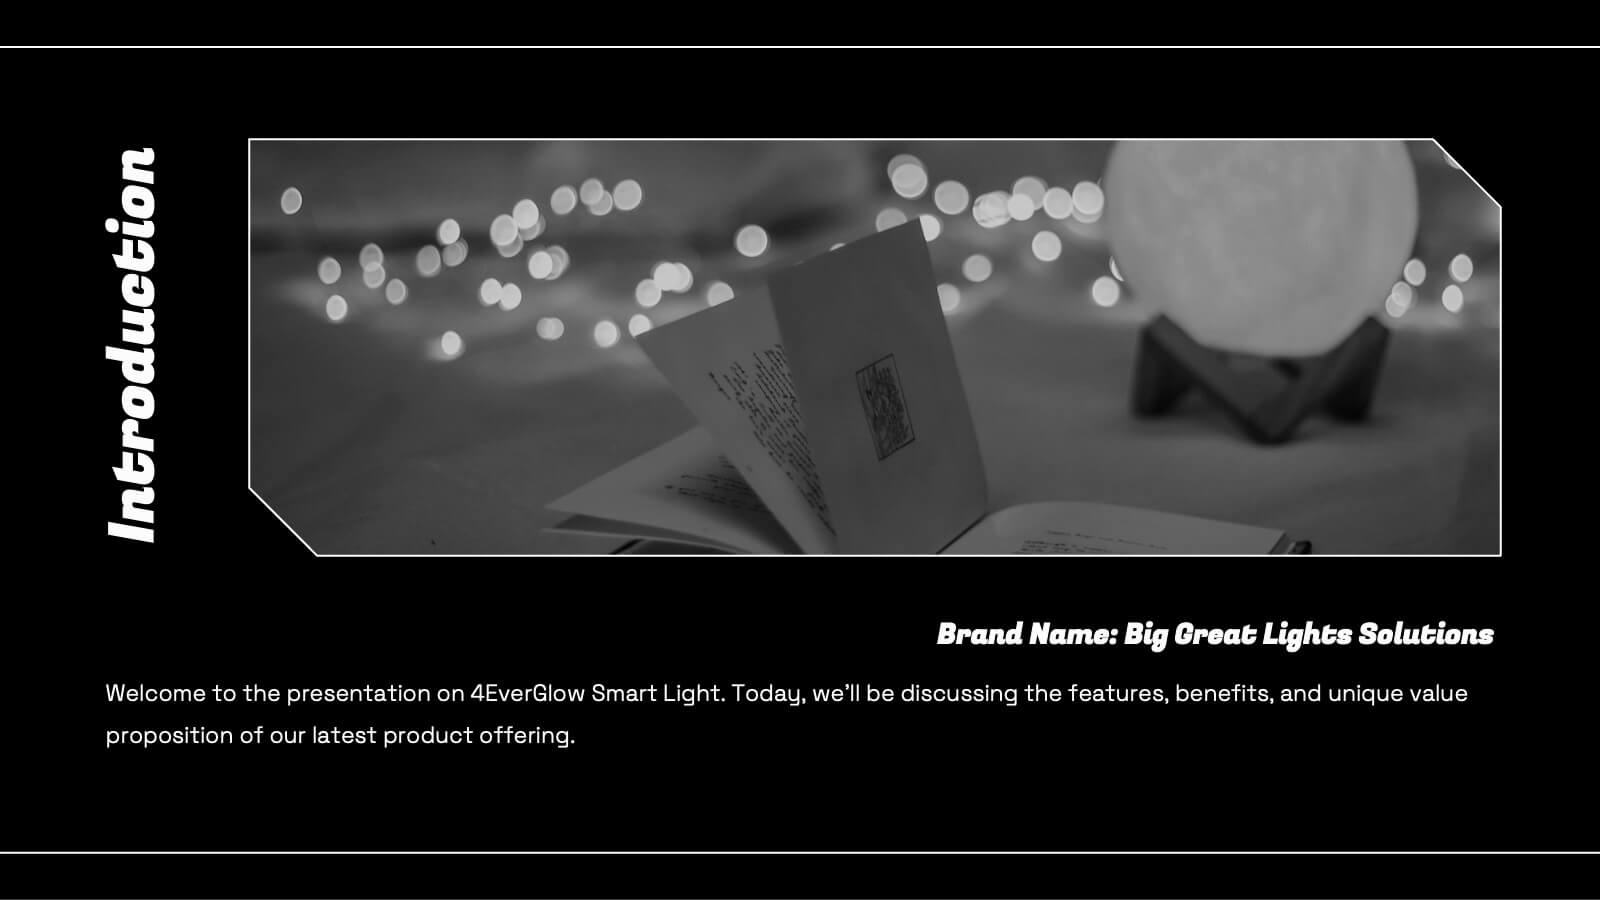
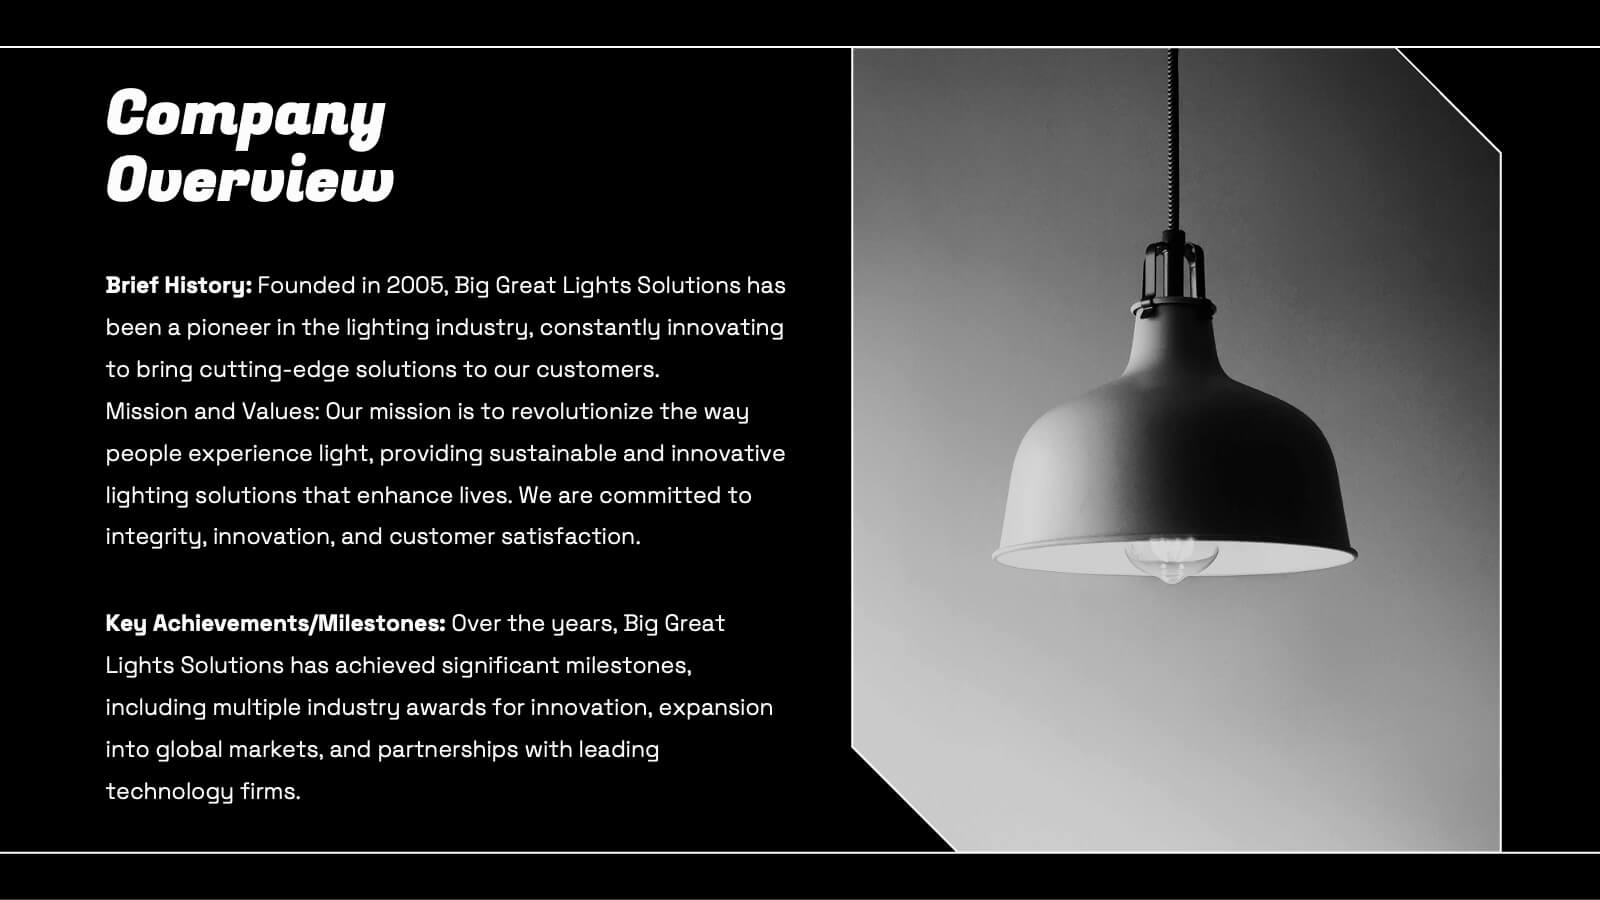
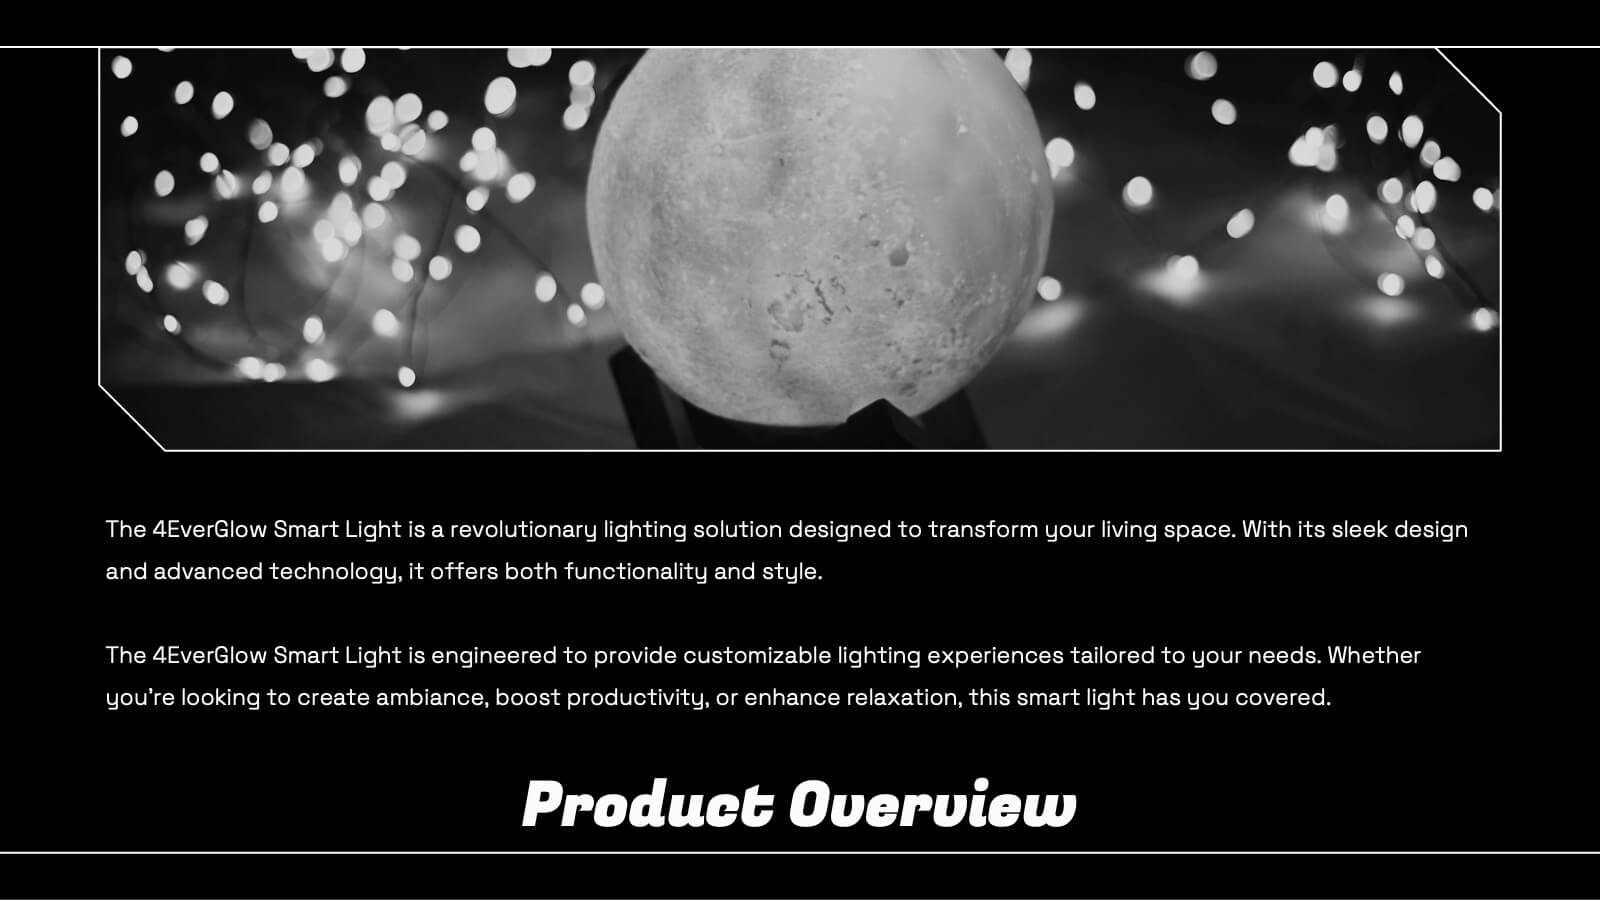
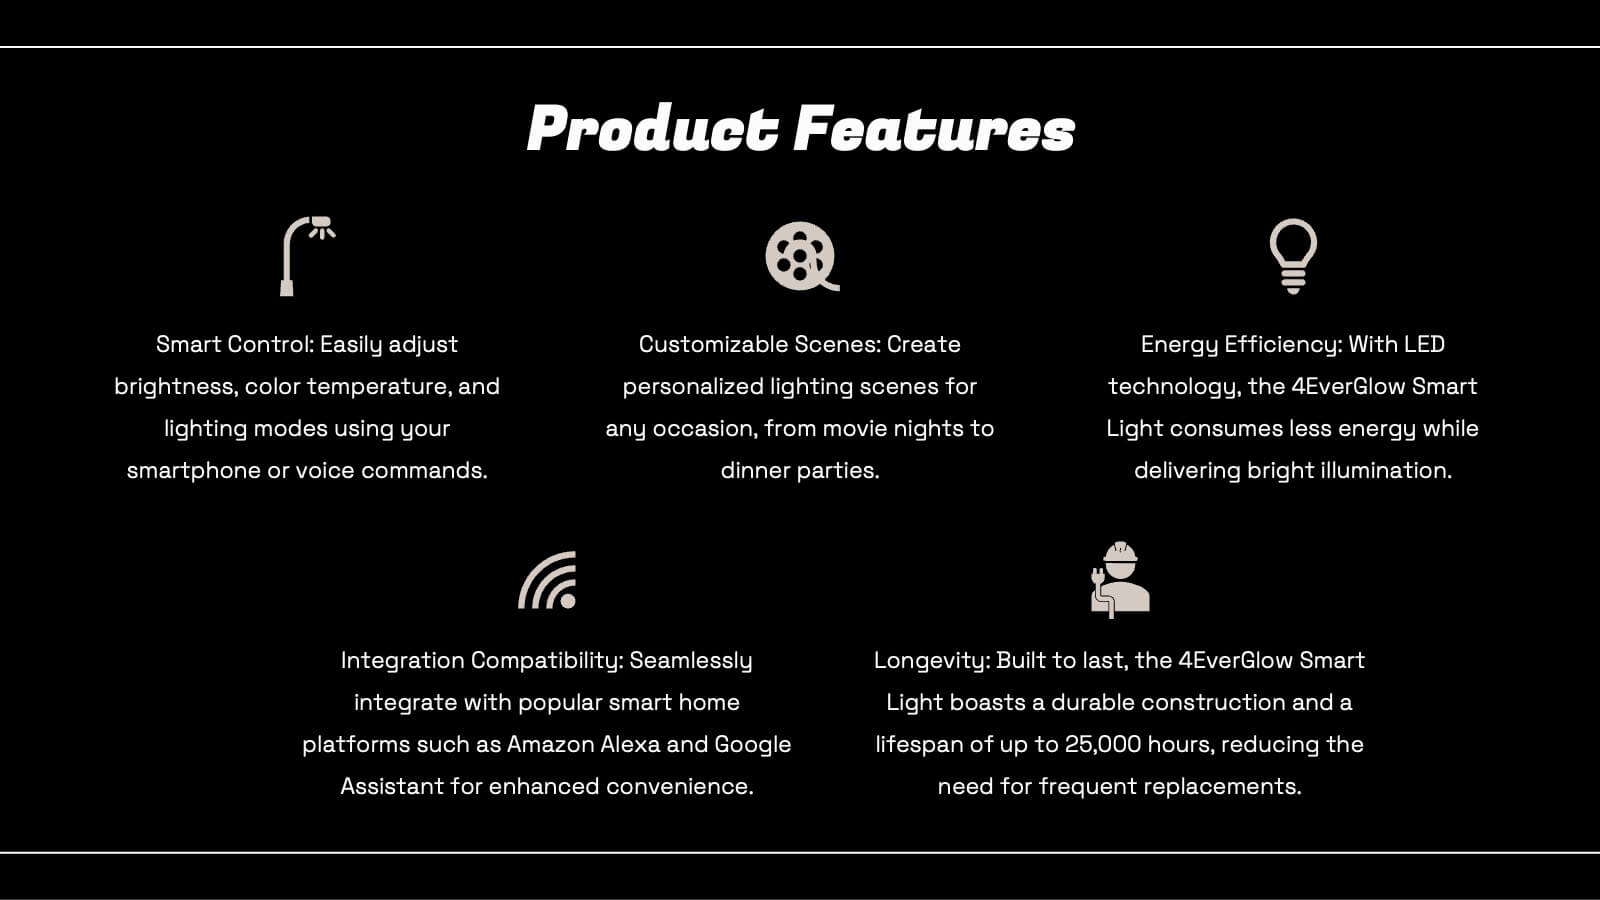
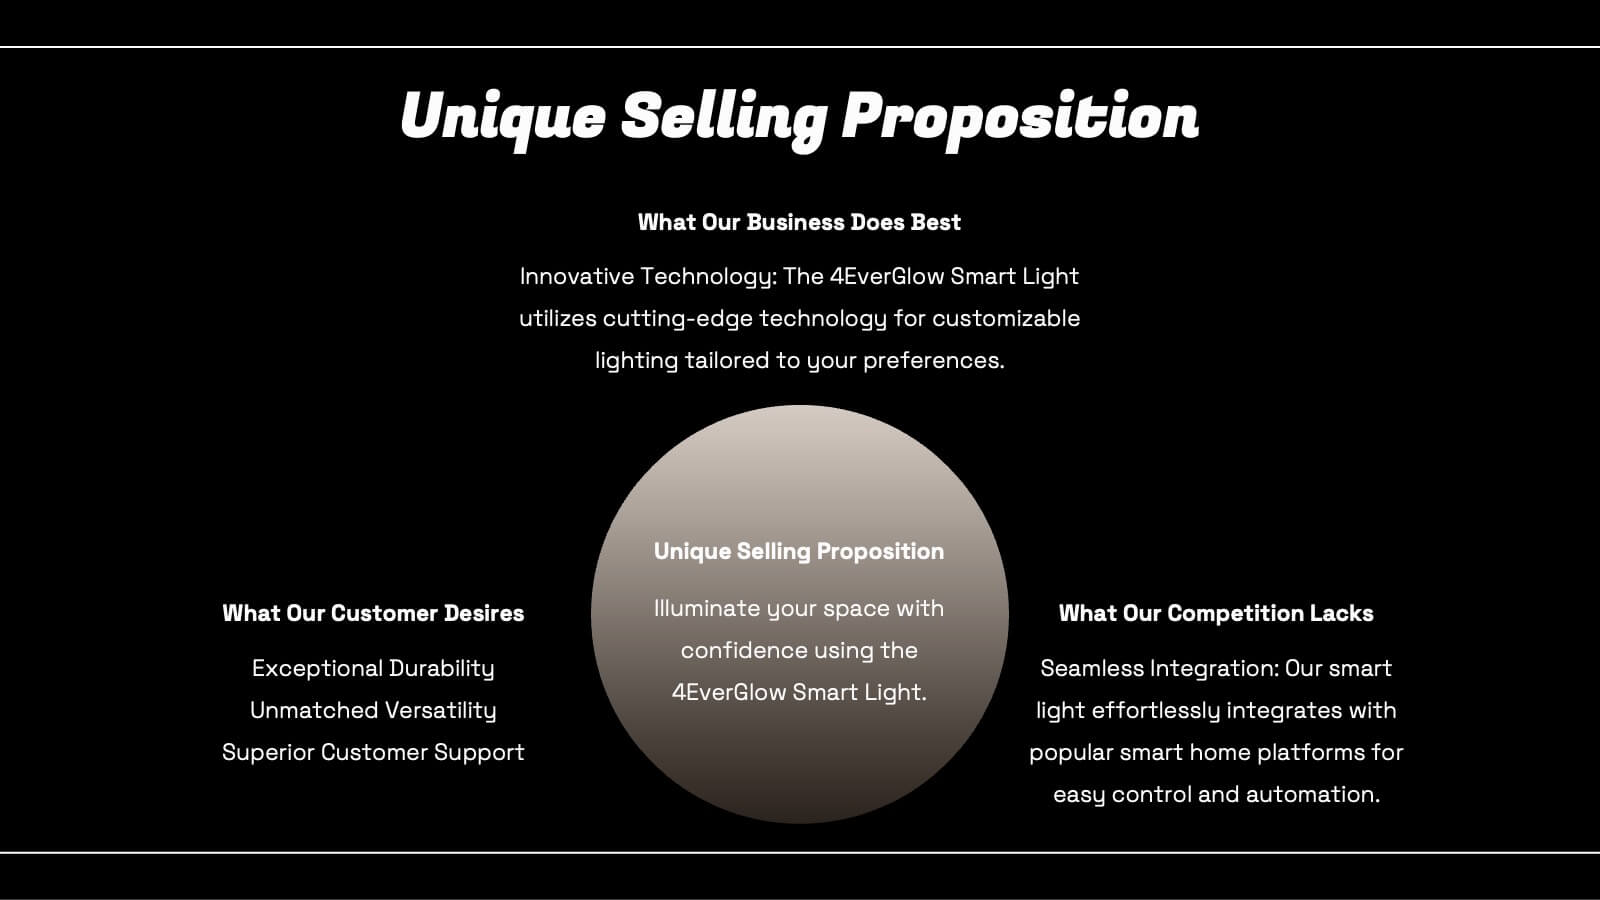
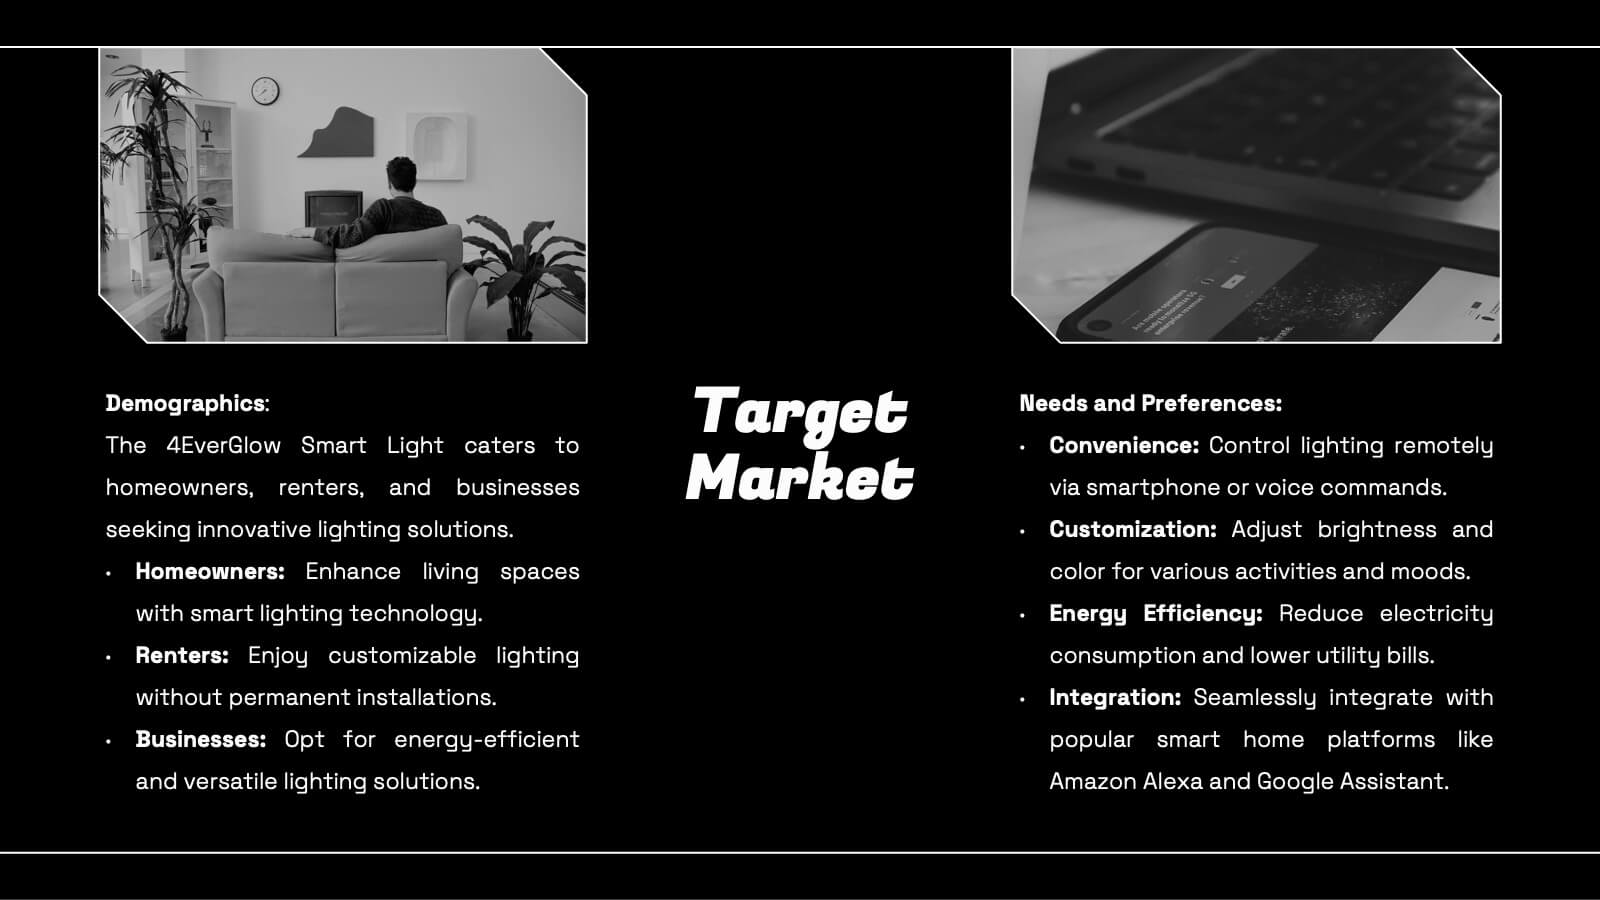
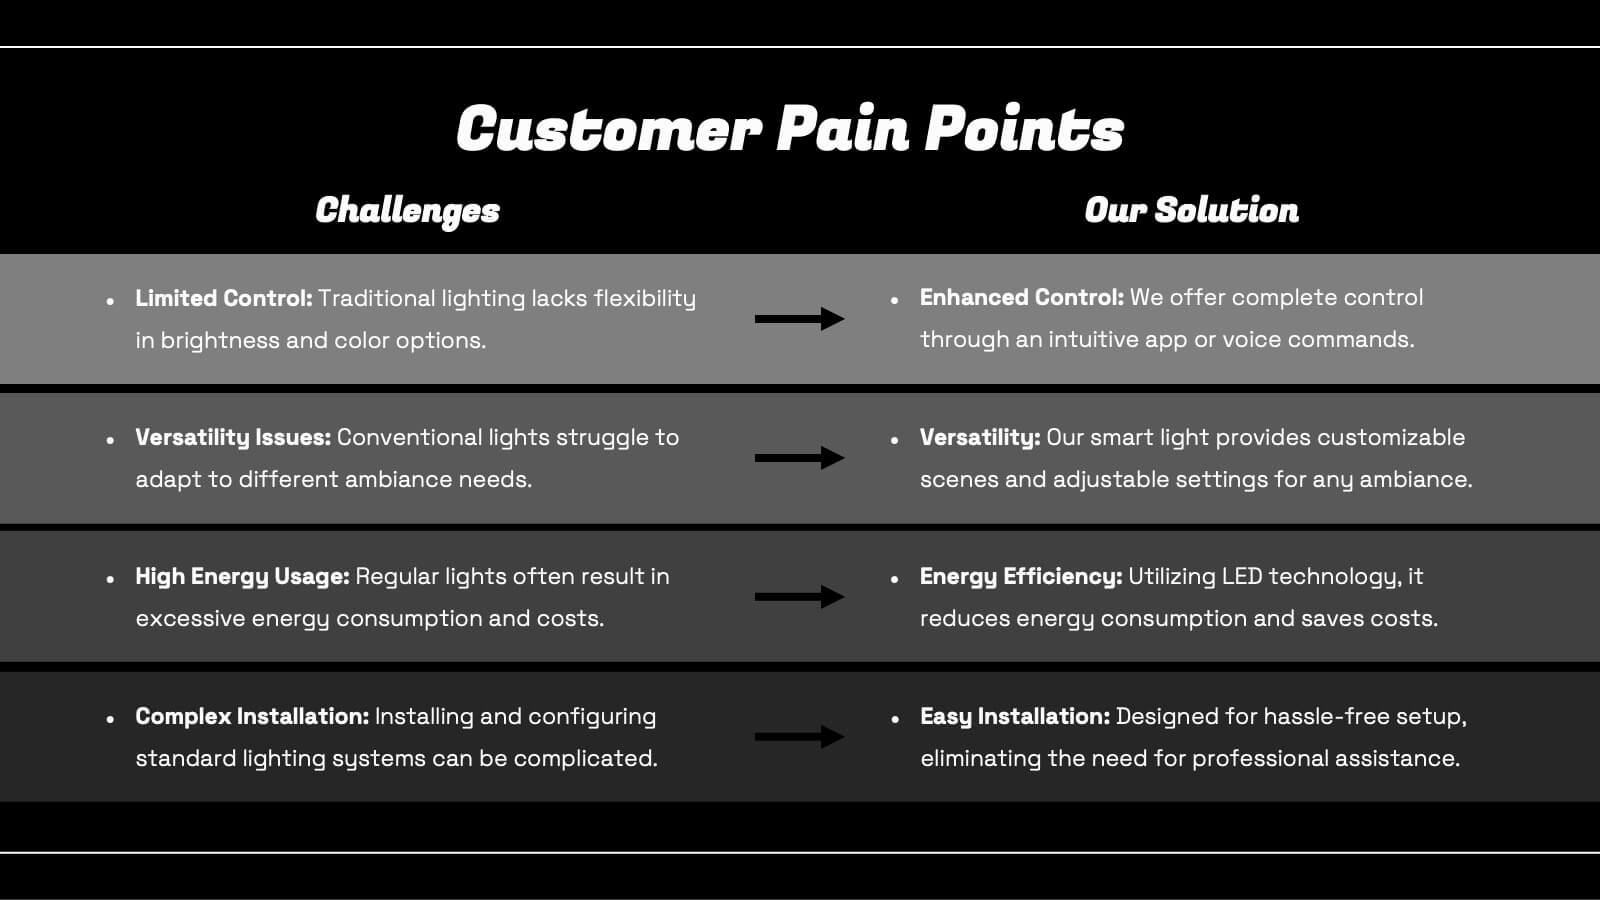
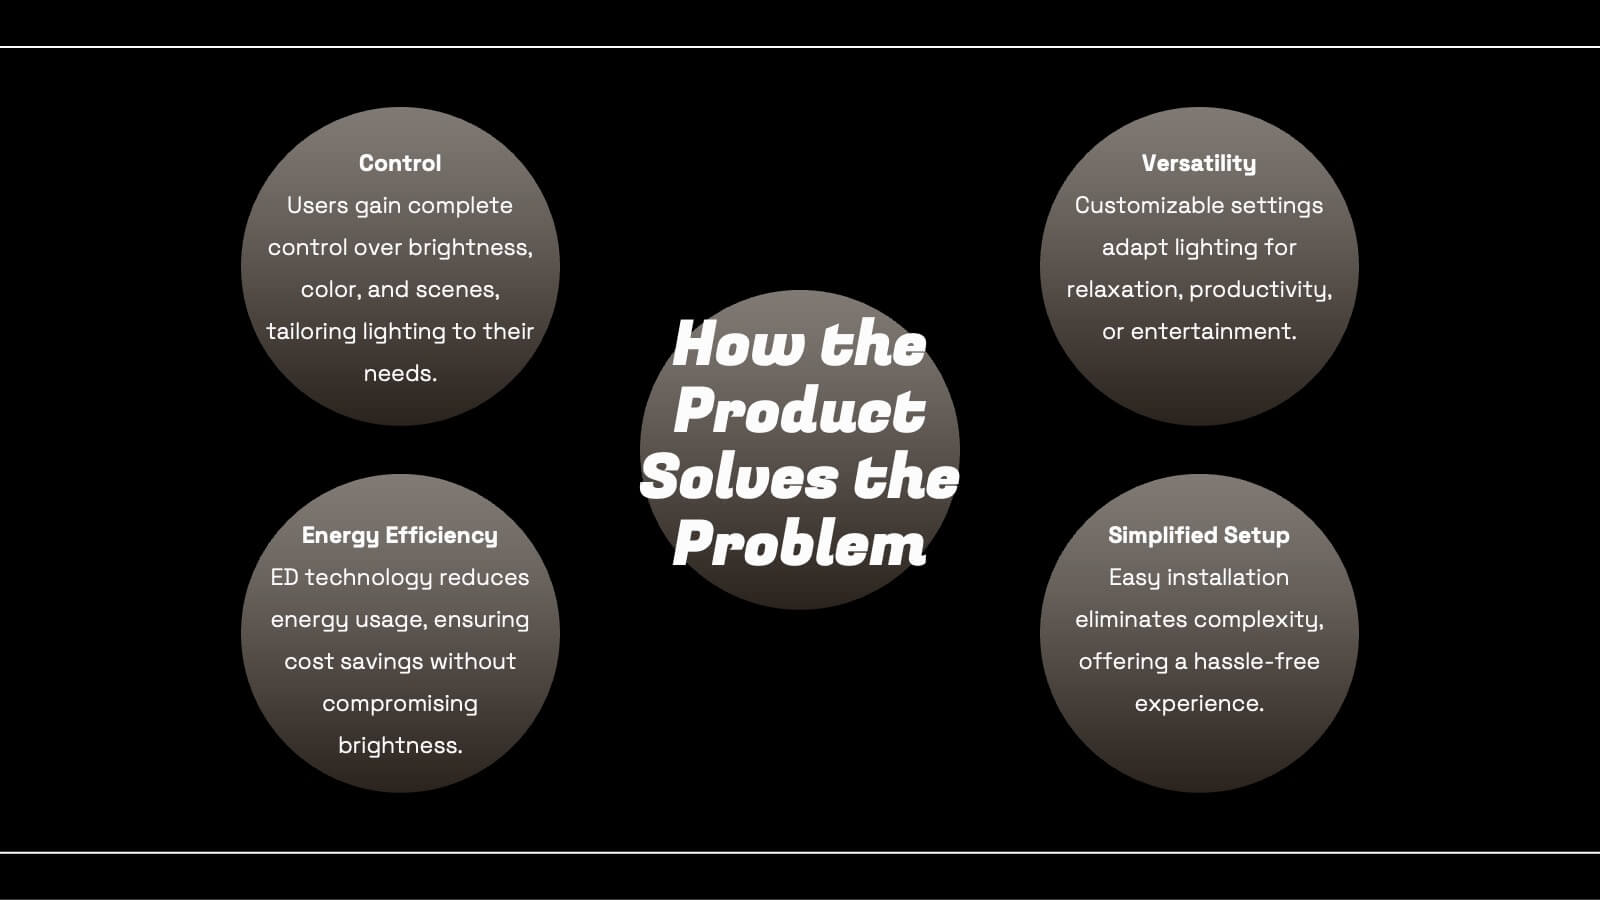
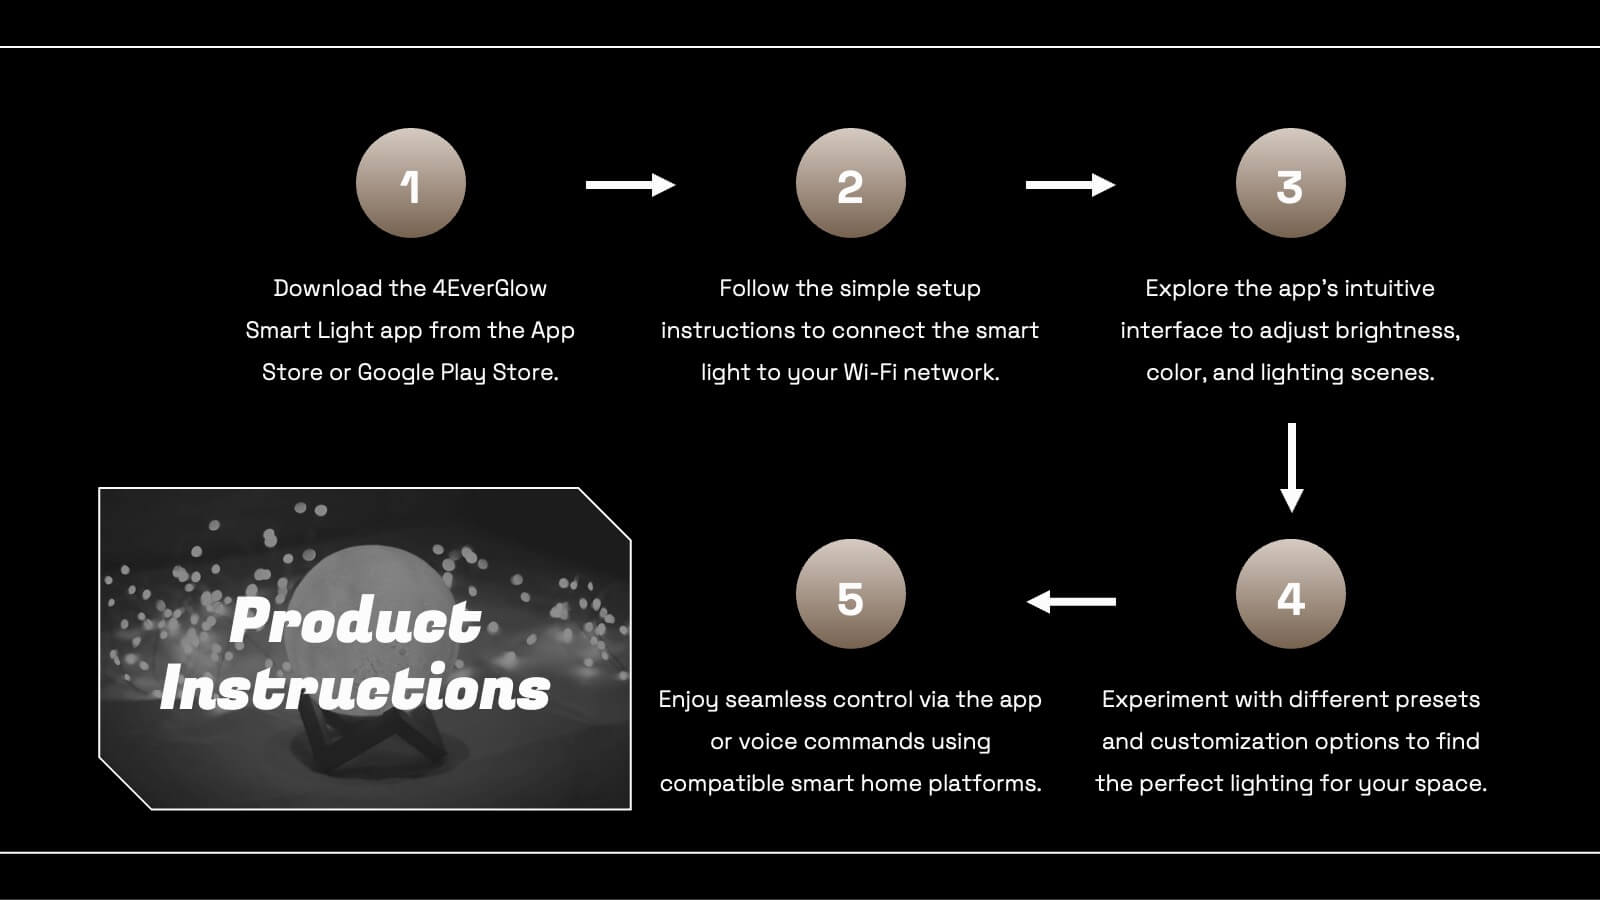
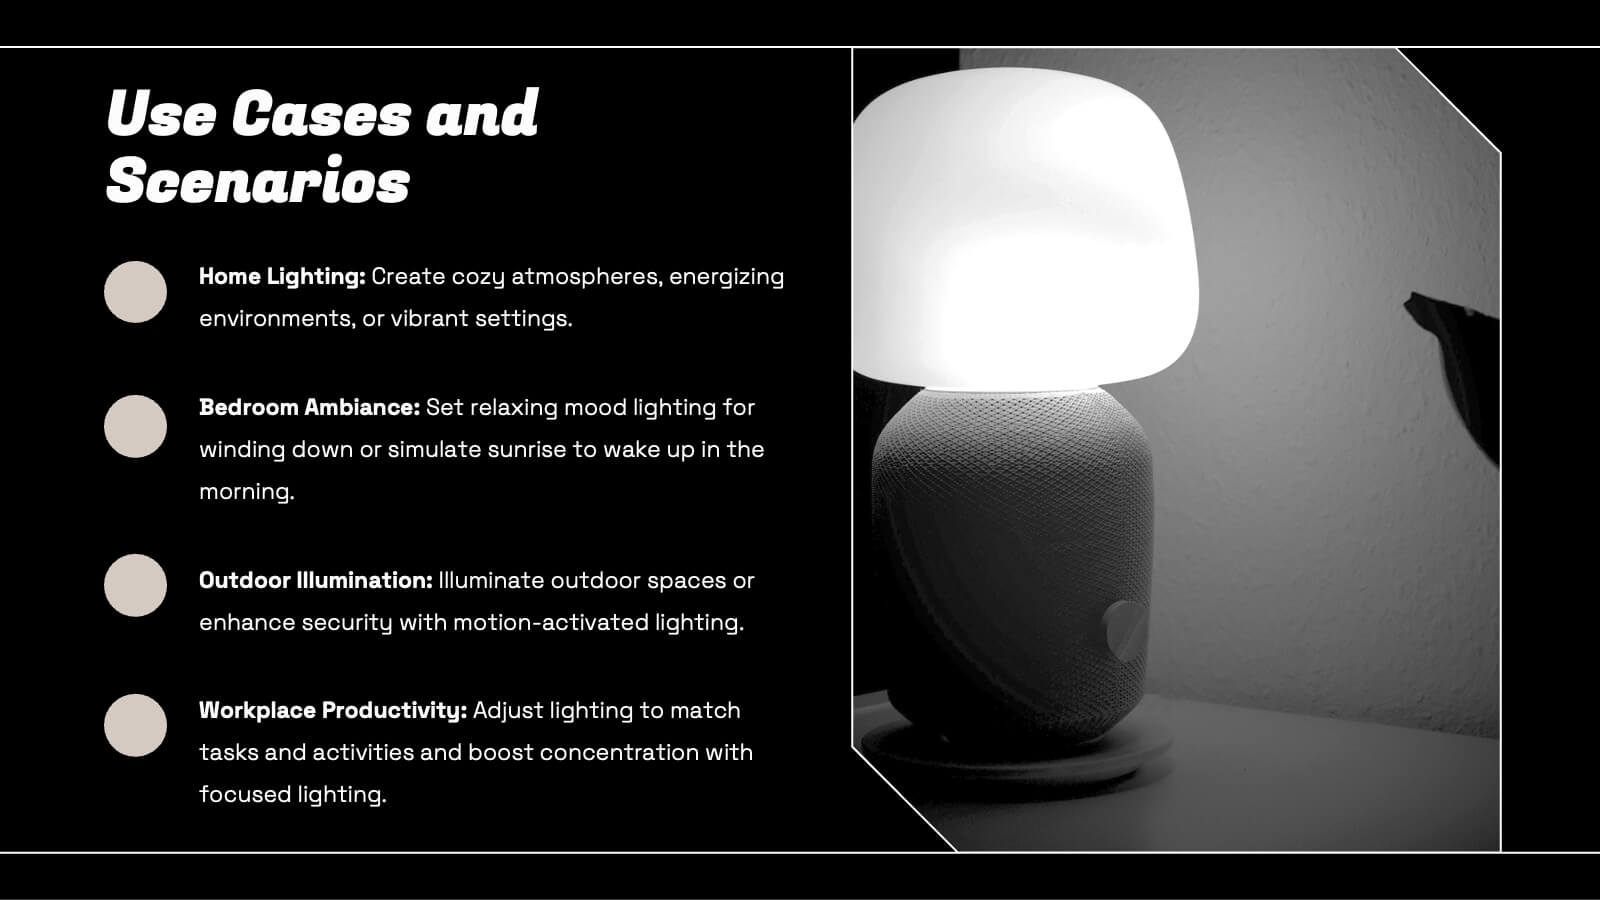
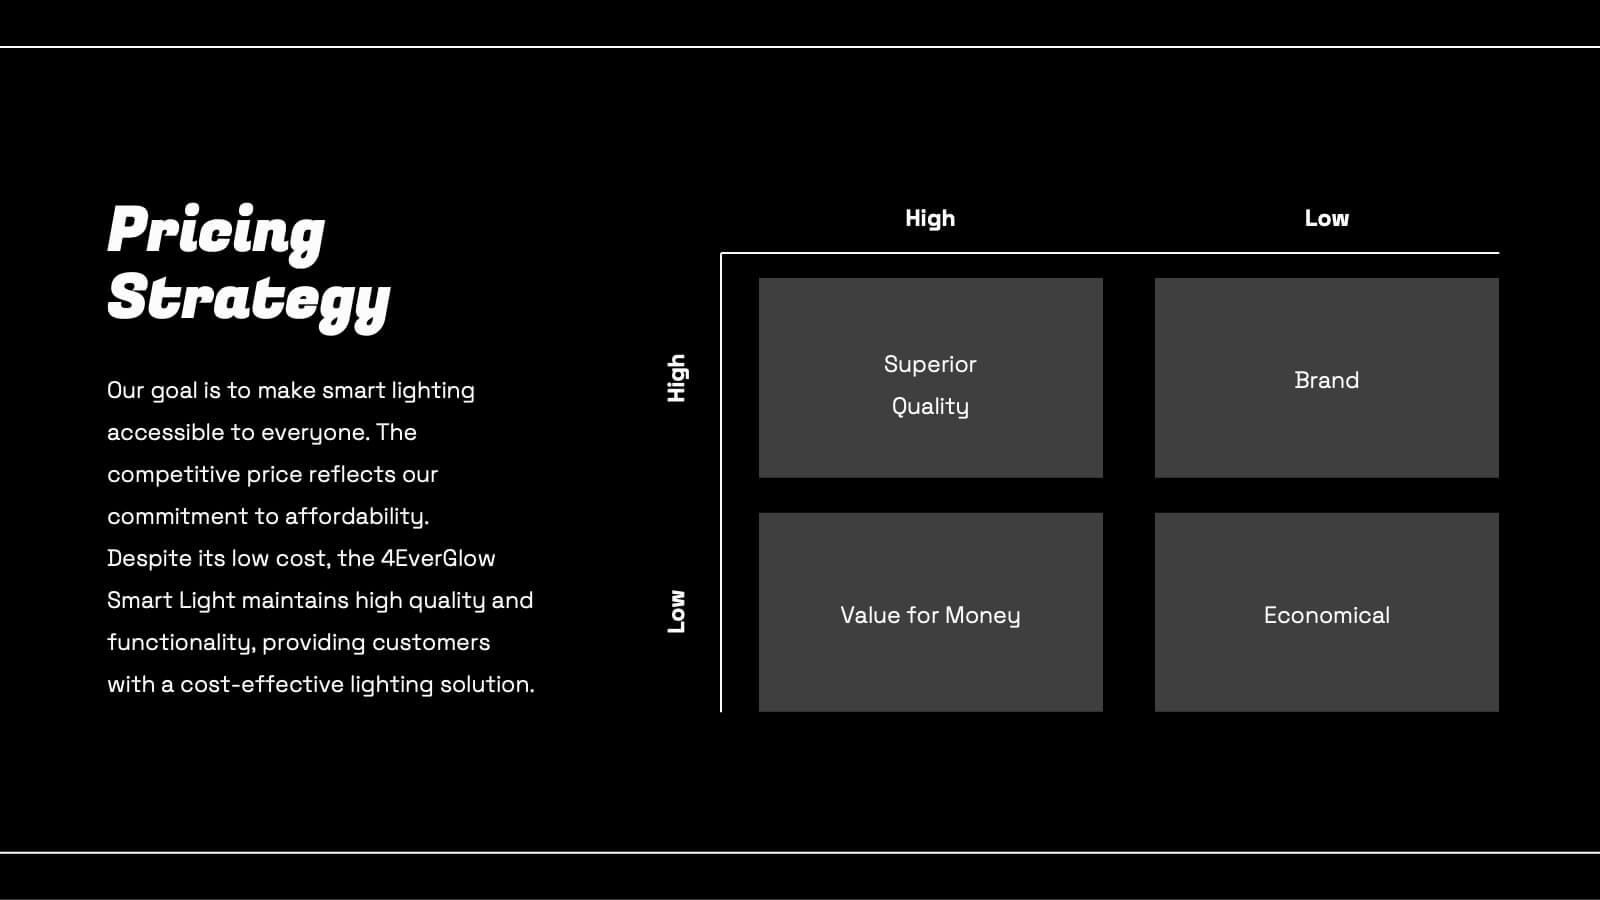
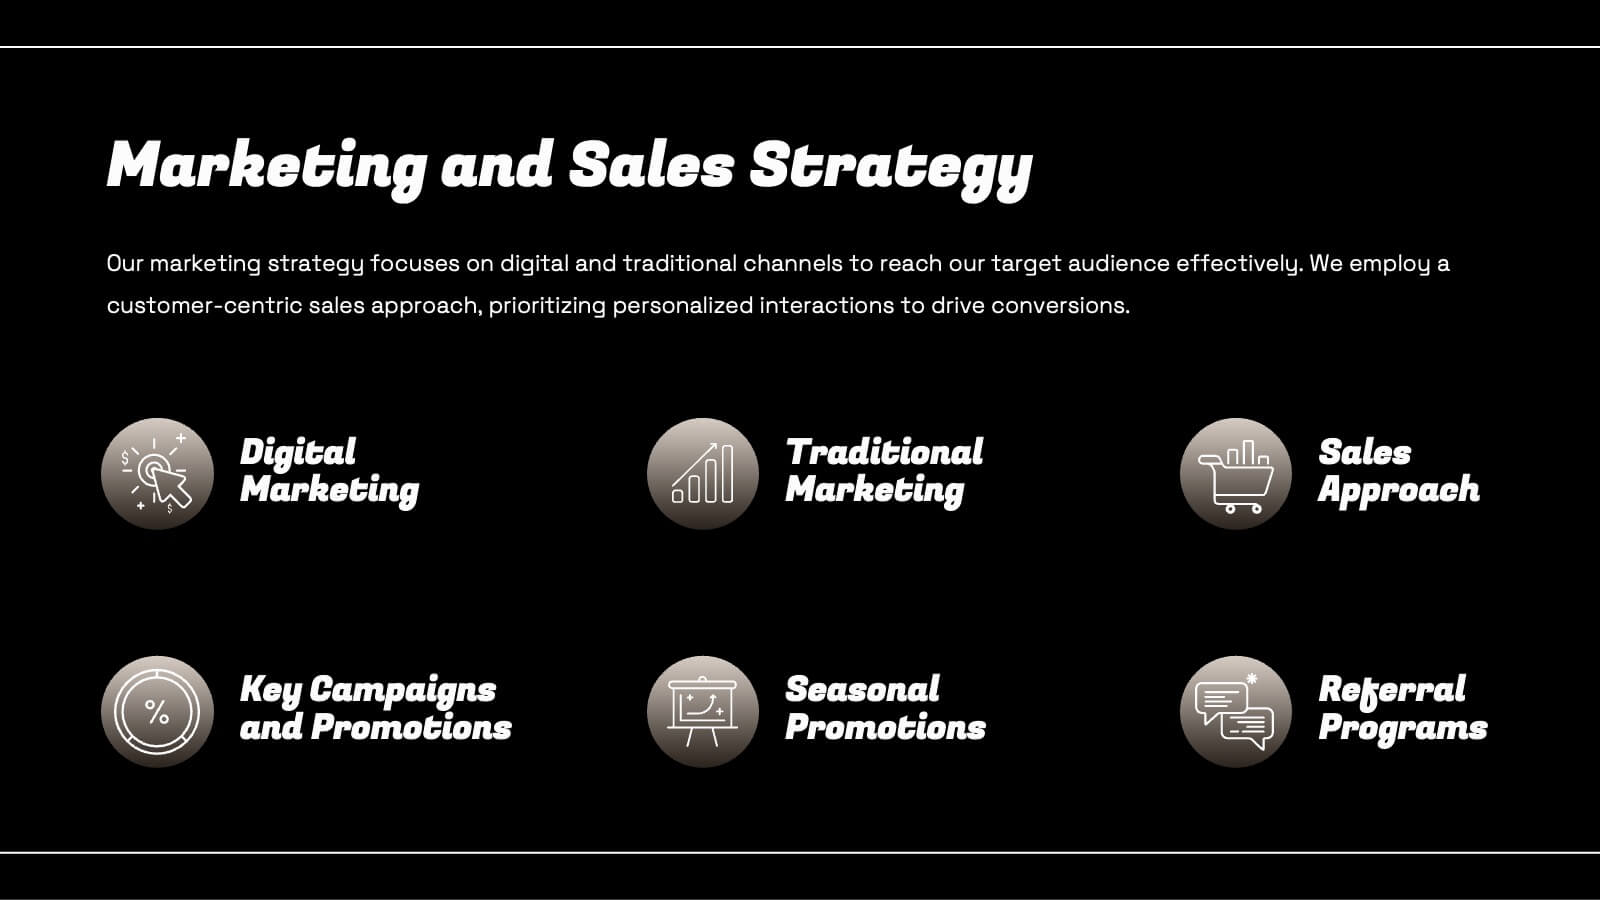
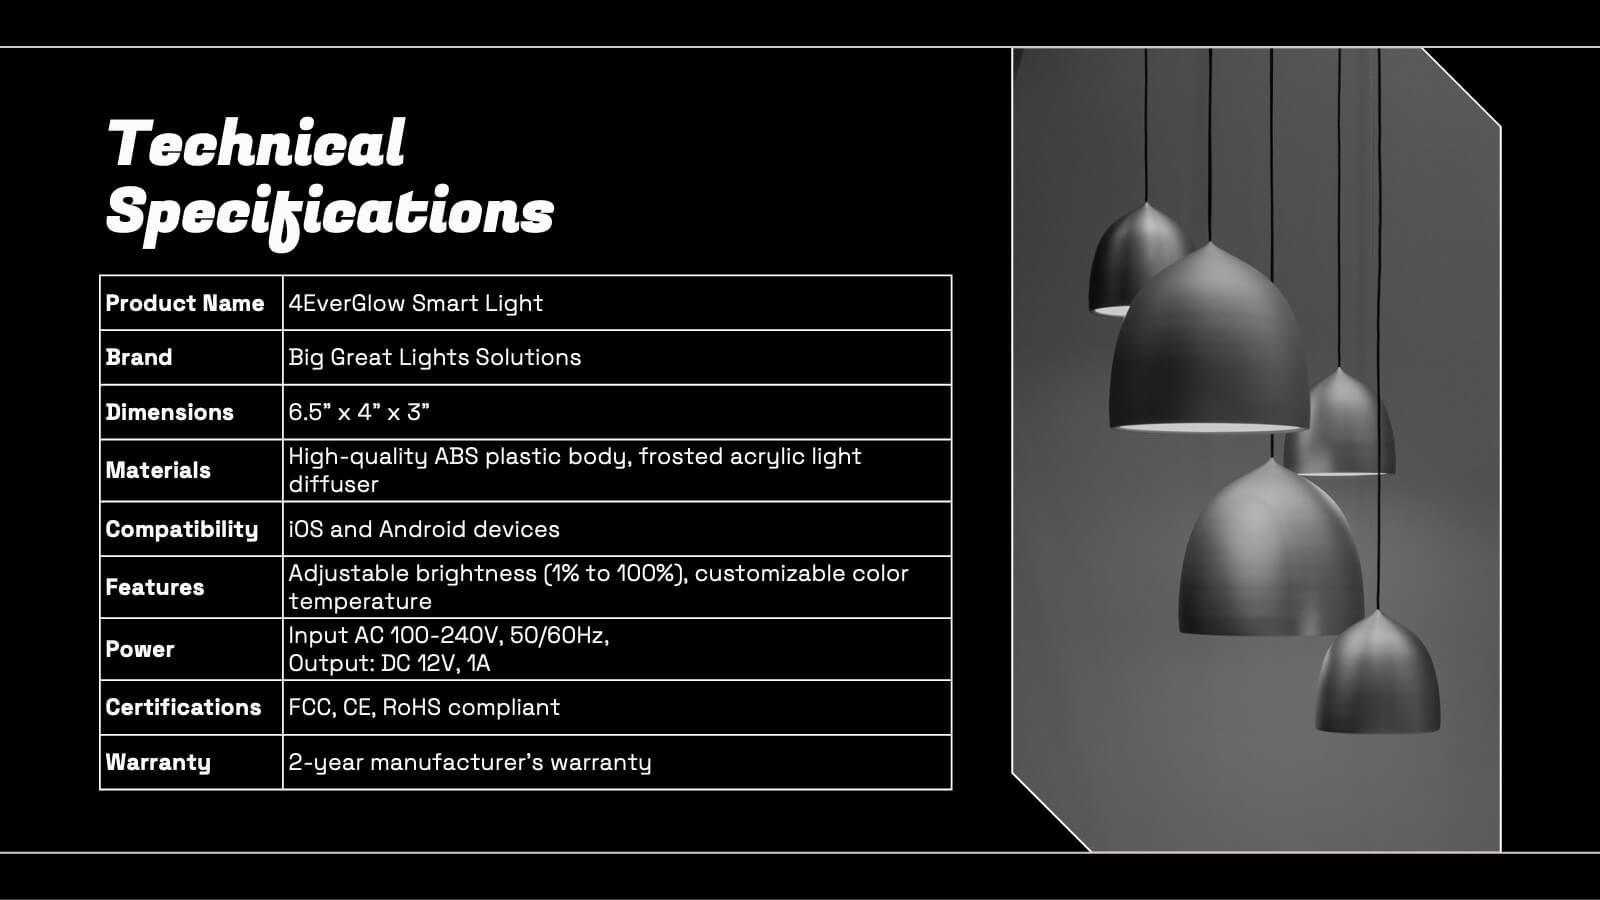
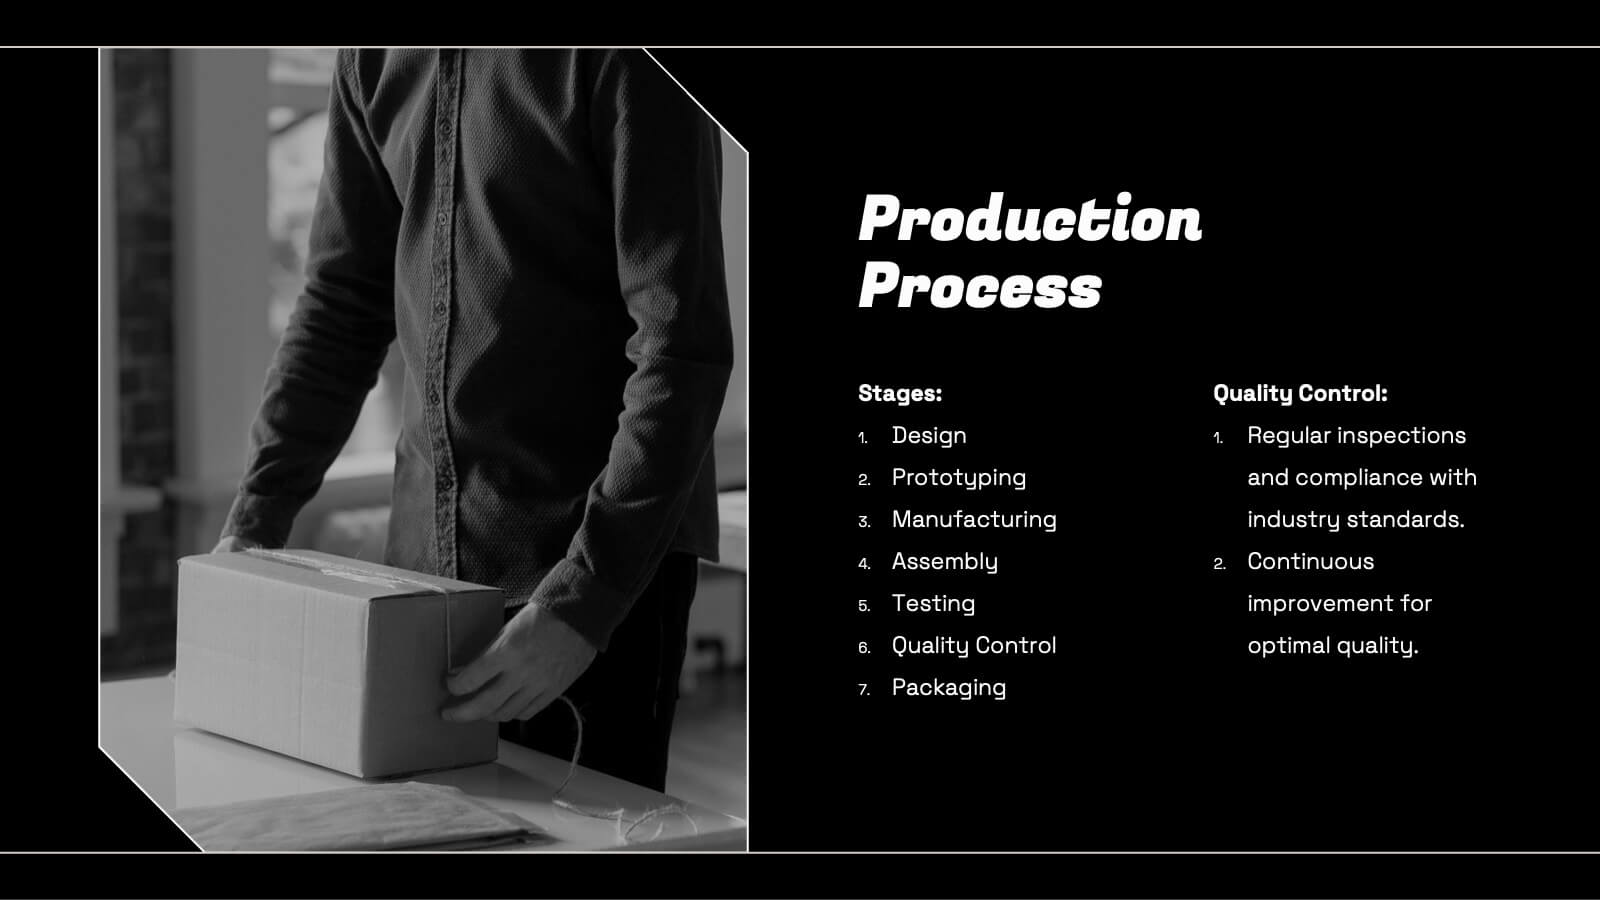
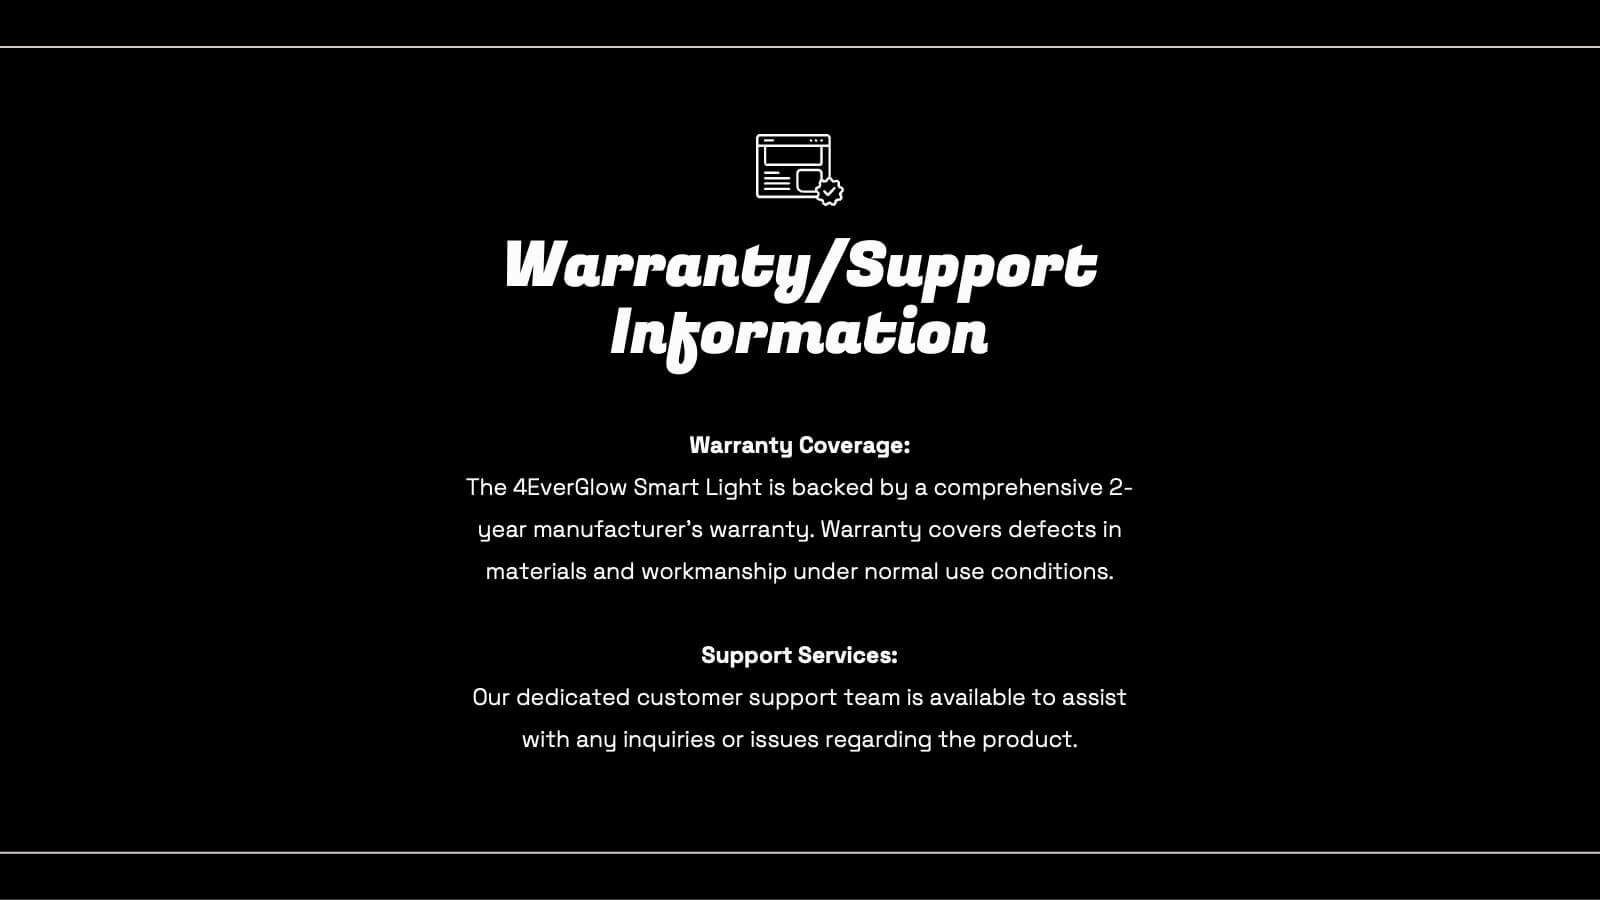
Smart Light Product Presentation
Enhance your product presentations with this Smart Lighting template. Designed for clarity and aesthetic appeal, it includes slides detailing product features, market analysis, technical specifications, and pricing strategies. Ideal for tech products, it's compatible with PowerPoint, Keynote, and Google Slides, ensuring broad accessibility and ease of use.


5 diapositivas
Hydrological Cycle Explained Presentation
Break down complex water systems with ease using the Hydrological Cycle Explained Presentation. This clean and modern slide illustrates each phase of the cycle—from precipitation to collection—with intuitive icons and a pipeline layout. Ideal for educational, environmental, or sustainability content. Fully editable in Canva, PowerPoint, Keynote, and Google Slides.


6 diapositivas
Strategic Planning Spider Diagram Presentation
Present your strategy with clarity using the Strategic Planning Spider Diagram Presentation. This template offers a bold, visual way to showcase performance across six core categories, helping teams align on goals and priorities. Easily customizable and compatible with PowerPoint, Keynote, and Google Slides. Ideal for executives and planners.


6 diapositivas
Financial Health Overview Dashboard Presentation
Simplify financial reporting with this Financial Health Overview Dashboard. Designed for analysts, executives, and consultants, it features a visual summary of key metrics and performance insights. Fully editable with icon placeholders and balanced layout. Ideal for PowerPoint, Keynote, and Google Slides presentations that demand clarity in financial storytelling.


7 diapositivas
Geometric Series Infographic
Geometric series have various applications in mathematics, physics, engineering, economics, and other fields. Get ready for a joyful expedition into the world of numbers, shapes, and patterns with our geometric series infographic. This template is a celebration of mathematical elegance, presented with a burst of enthusiasm to make learning a delightful adventure. This is fully customizable and compatible with Powerpoint, Keynote, and Google Slides. This allows you to paint a vivid picture by relating geometric series to real-life scenarios. Showcase how these mathematical visuals resonates in unexpected places.


5 diapositivas
SMART Objectives Slide Presentation
Kick your planning into gear with a bold, structured layout that makes goal-setting feel energetic and achievable. This presentation helps you outline clear objectives, track progress, and communicate strategy with a clean, organized flow designed for teams and leaders. Fully compatible with PowerPoint, Keynote, and Google Slides.


21 diapositivas
Cupid Sales Proposal Presentation
Elevate your next proposal with this sleek and professional presentation template! Ideal for outlining project goals, scope of work, and timelines, this template ensures that every detail is presented with clarity and impact. It includes sections for budget breakdowns, team expertise, and risk management strategies. Compatible with PowerPoint, Keynote, and Google Slides, it’s designed for flexibility and success.


20 diapositivas
Vitrumin Photography Portfolio Presentation
Showcase your creative work with this elegant and modern photography portfolio presentation template. Featuring essential slides such as an introduction, project highlights, creative process, awards, and client testimonials, this template is perfect for presenting your work professionally. Fully customizable and easy to edit, it's compatible with PowerPoint, Keynote, and Google Slides.