


Características


¿Tienes alguna pregunta?
Recomendar


5 diapositivas
Breast Cancer Prevention Infographics
Breast Cancer is a serious disease that affects millions of people worldwide. These infographics are visual representations of information that provide tips and strategies to help prevent breast cancer. These infographics include statistics about breast cancer, risk factors, and preventative measures that can be taken to reduce the risk of developing the disease. You can also use these to provide information on screening and early detection, such as mammograms and self-exams. The visuals in these infographics may include icons, images, graphs, and charts to make the information easy to understand.


4 diapositivas
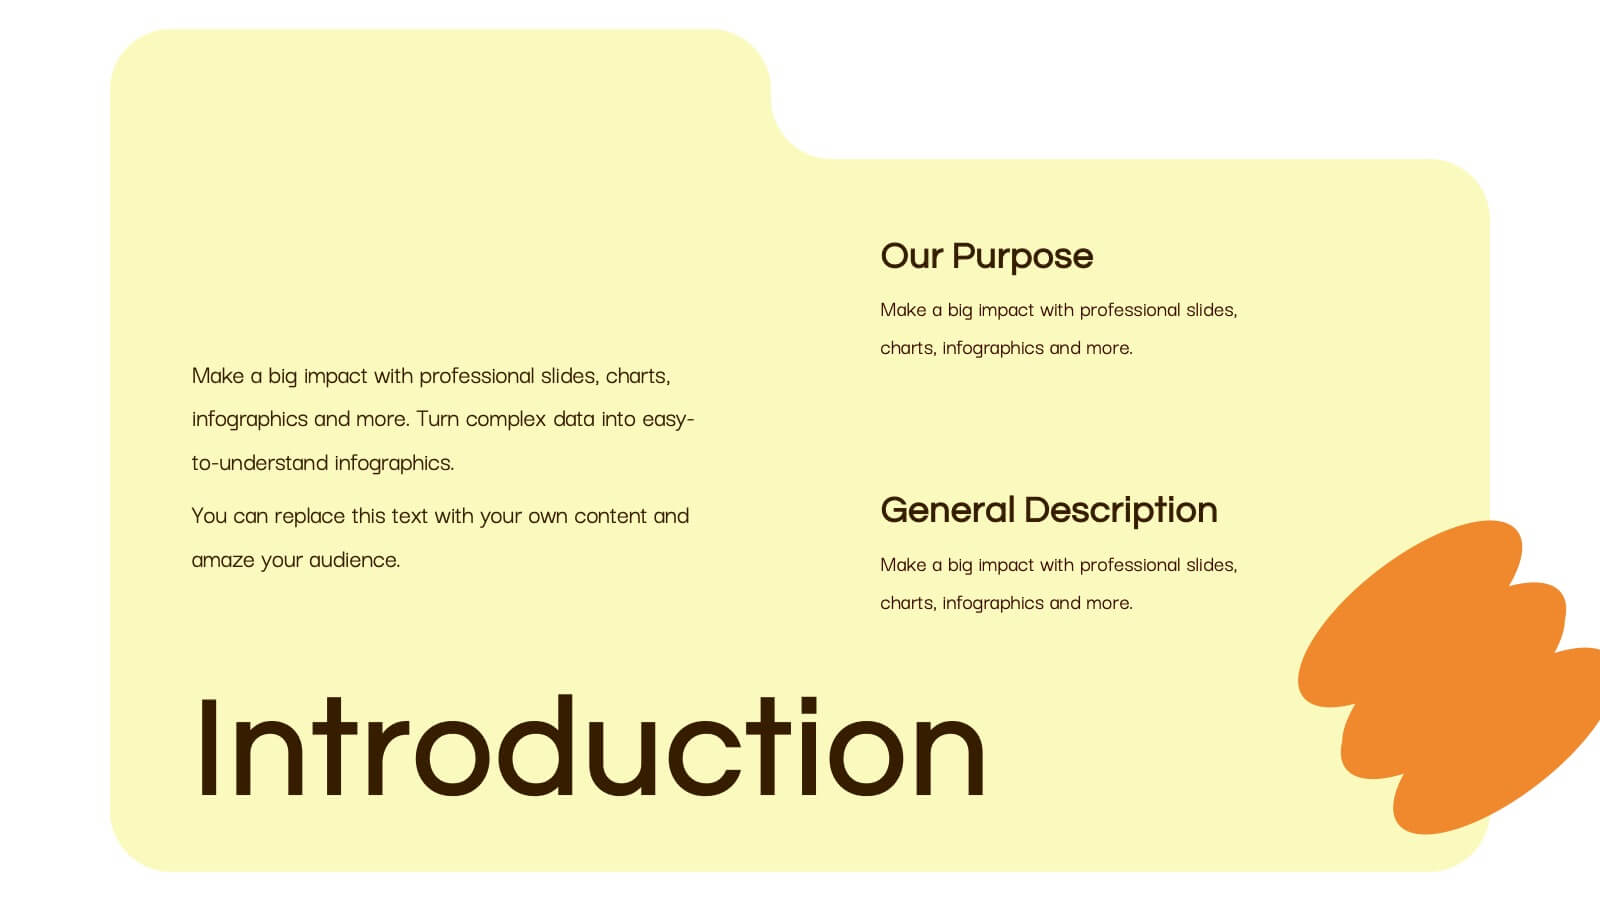
Defining Company Purpose Presentation
This template provides a visually engaging platform to articulate your organization's core values and mission. It features vibrant, clear sections for detailed insights, helping to communicate the foundational elements that drive business decisions and culture. Each slide is designed to support a cohesive narrative about your company's objectives and strategic direction, ensuring a professional presentation of your corporate ethos. This template is perfect for workshops, stakeholder meetings, or internal team alignments and is fully compatible with PowerPoint, Keynote, and Google Slides.


15 diapositivas
Business Proposal Infographic
A business proposal is a formal document that outlines a specific business endeavor, project, or venture, and presents a persuasive argument for why the proposed approach or solution is viable and advantageous. This infographic template is a tool for the business world to communicate business ideas, pitch a product or service, secure funding or partnerships, or enter into a business agreement. Fully customizable and compatible with Powerpoint, Keynote, and Google Slides. Showcase your unique value proposition and unveil how it fuels your journey to success. Energize your business propositions and set the stage for success!


4 diapositivas
Report Recap and Summary Section Presentation
Summarize key takeaways clearly with this Report Recap and Summary Section slide. Featuring a step-by-step horizontal layout with bold numbering, icons, and text boxes, this design helps emphasize three main points or stages in your report. Ideal for executive briefs or performance reviews. Fully editable in Canva, PowerPoint, or Google Slides.


7 diapositivas
Europe Map Infographic Presentation Template
Europe is a continent located in the northern part of the globe and surrounded by water on three sides. It is bordered by the Atlantic Ocean to the west, the Arctic Ocean to the north, and the Mediterranean Sea to the south. Europe is divided into roughly forty four countries and dependent territories, each one with its own unique identity, cuisine and culture. This European map template is a vector map of an outline of Europe, with color-coded and labeled countries and a legend. This map template can be used for presentations, reports and blogs about tourism it's a simple and clean style map.


5 diapositivas
Problem-Solving and Business Solutions
Simplify complex challenges with this dynamic problem-solving and business solutions slide. Designed with a clear, step-by-step layout, this template helps outline problems, strategies, solutions, and outcomes in a visually engaging way. Ideal for workshops, strategic planning sessions, consulting proposals, and team brainstorming. Fully editable and compatible with PowerPoint, Keynote, and Google Slides.


5 diapositivas
Customer Retention and Loyalty Marketing Presentation
Showcase your loyalty strategies in a visually compelling way with this modern shopping cart-themed slide. Ideal for outlining customer retention initiatives, this template highlights five key tactics or rewards using numbered icons and clean layout sections. Great for marketers, retail teams, and business consultants. Fully editable in PowerPoint, Keynote, and Google Slides.


7 diapositivas
Lean Startup Strategy Presentation
Present your investment strategy with clarity and impact using this triangle diagram slide. Ideal for showcasing the relationship between key funding stages, investor types, or business milestones, this layout offers a clean structure with labeled nodes (A, B, C) and supporting icons. Fully editable in PowerPoint, Keynote, and Google Slides for seamless customization.


6 diapositivas
Project Overview and Key Takeaways Presentation
Summarize your project outcomes with clarity and impact using this Project Overview and Key Takeaways slide. Featuring a clean layout with a dedicated section for a brief overview and key metrics, plus four hexagonal milestones for your main insights. Perfect for wrap-up reports, client updates, or stakeholder reviews. Fully editable in PowerPoint, Keynote, and Google Slides.
20 diapositivas
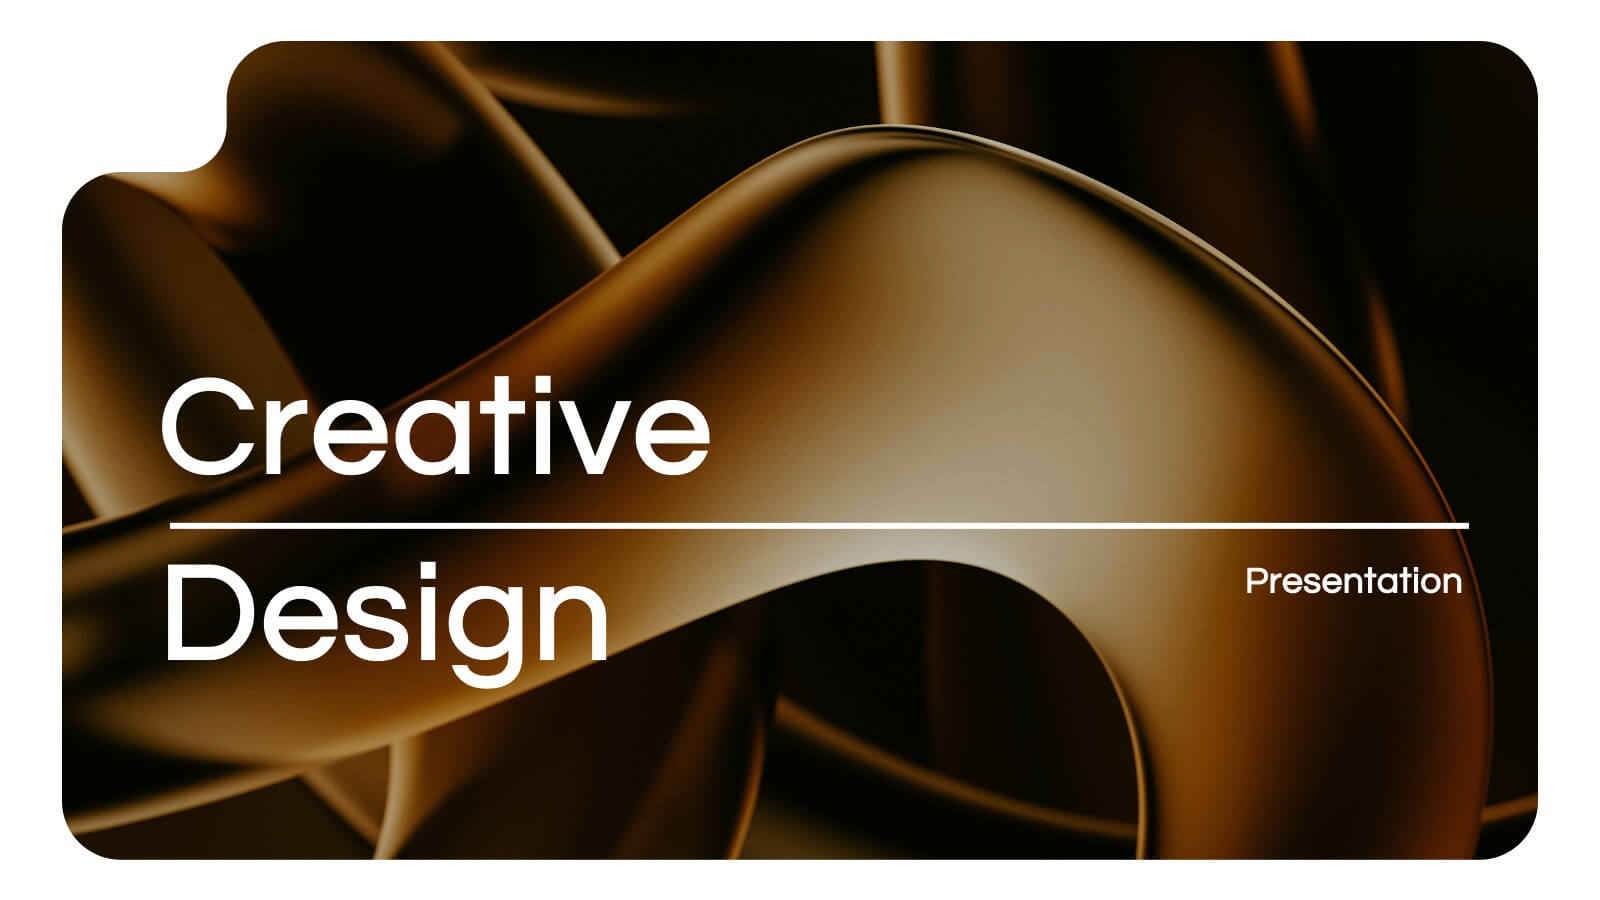
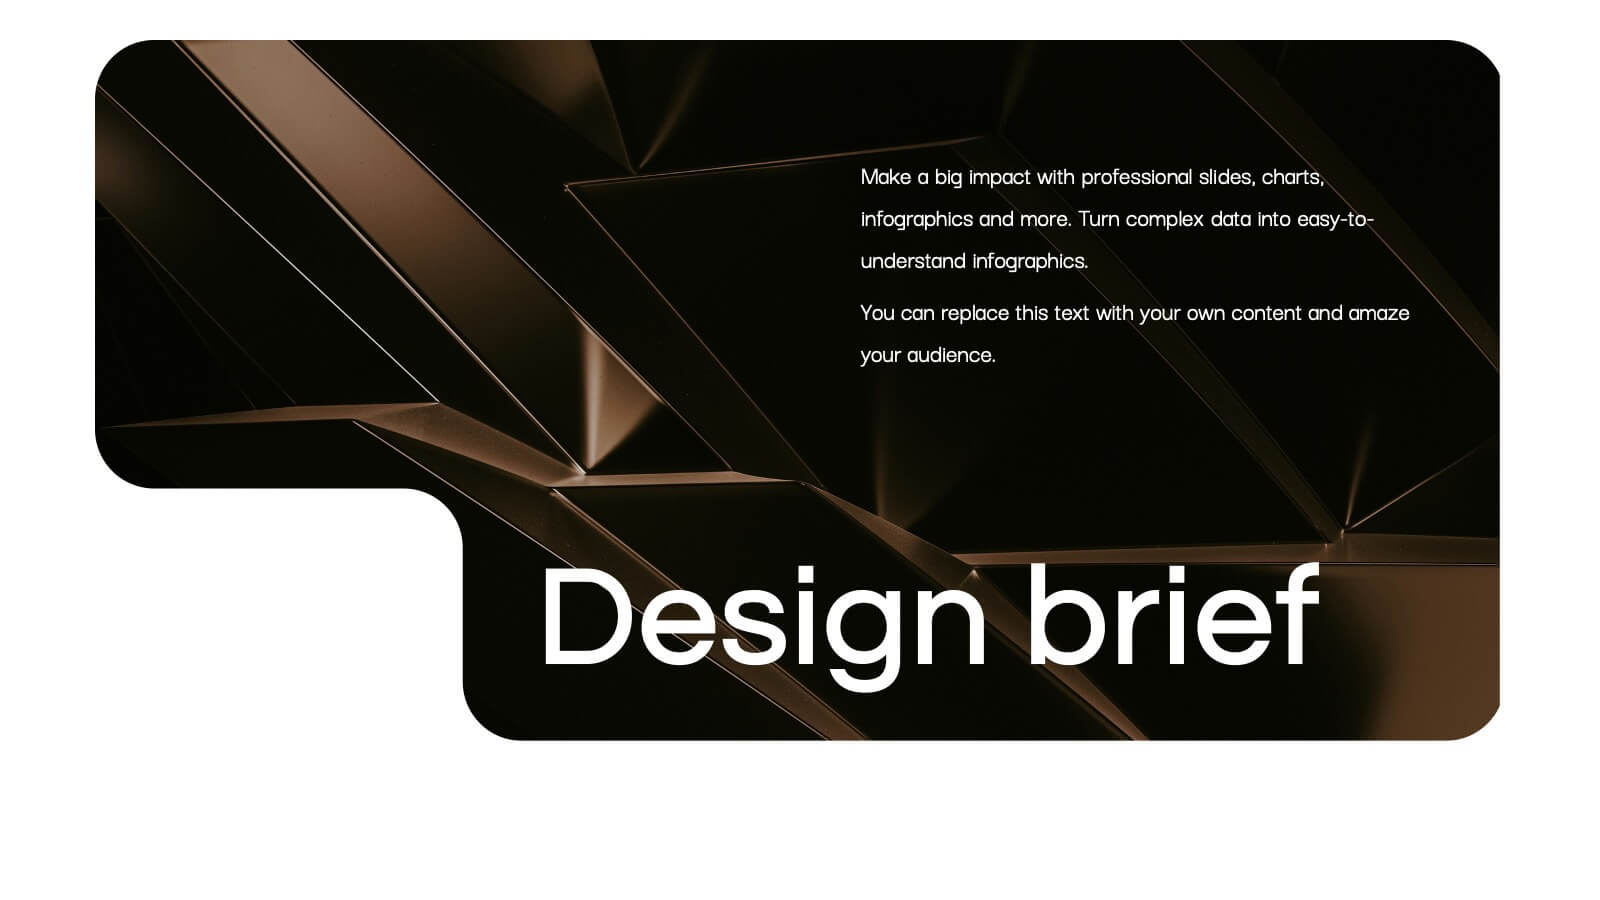
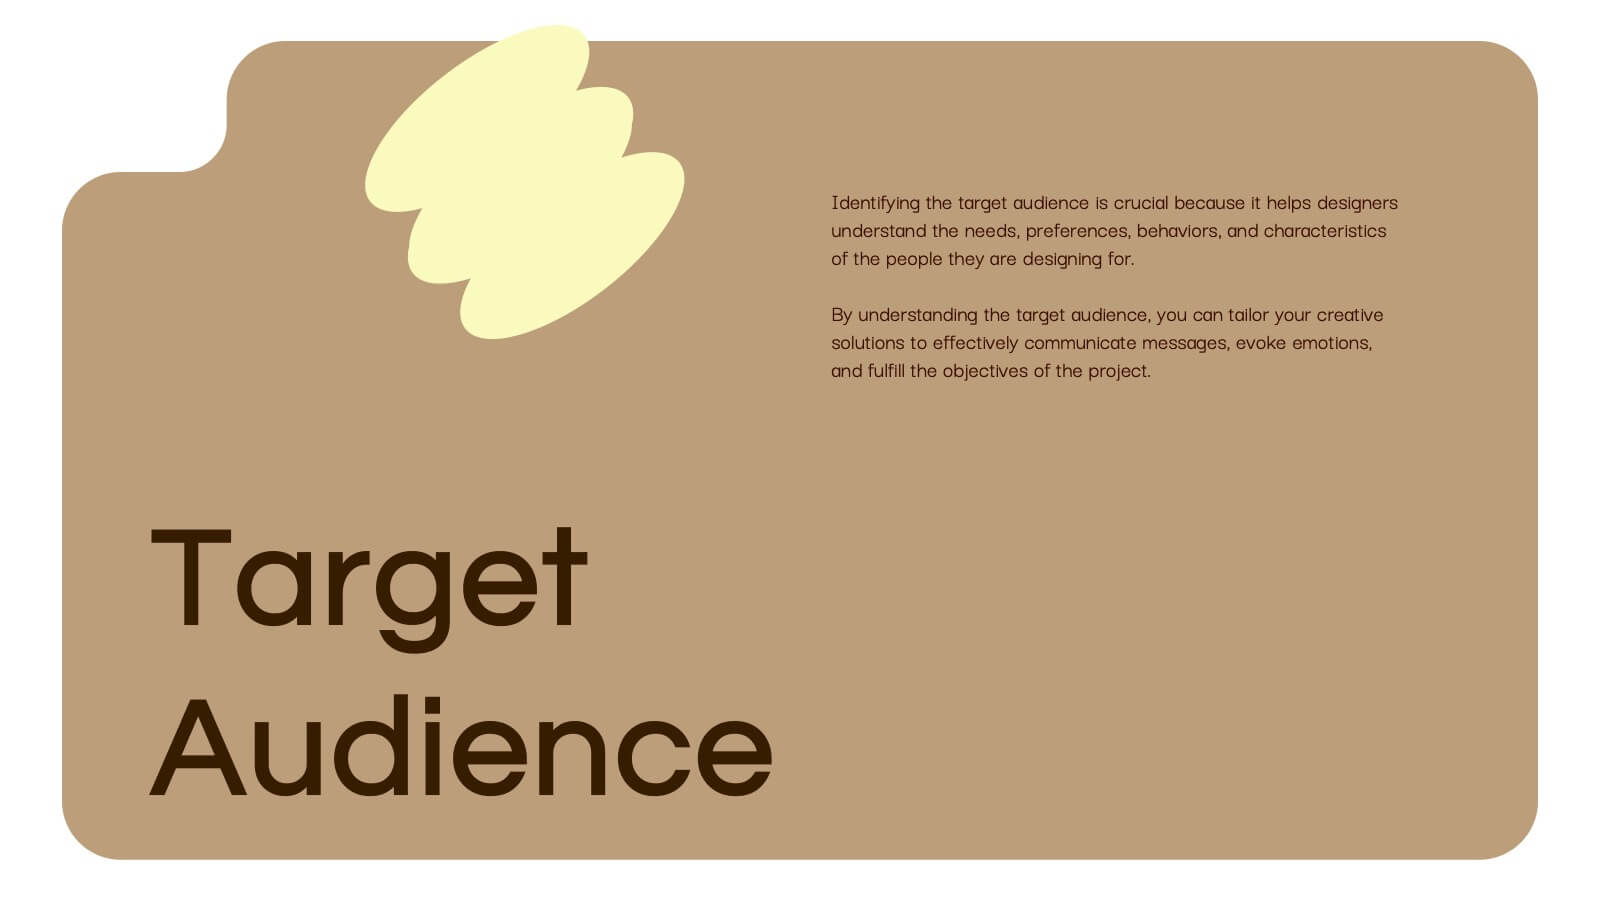
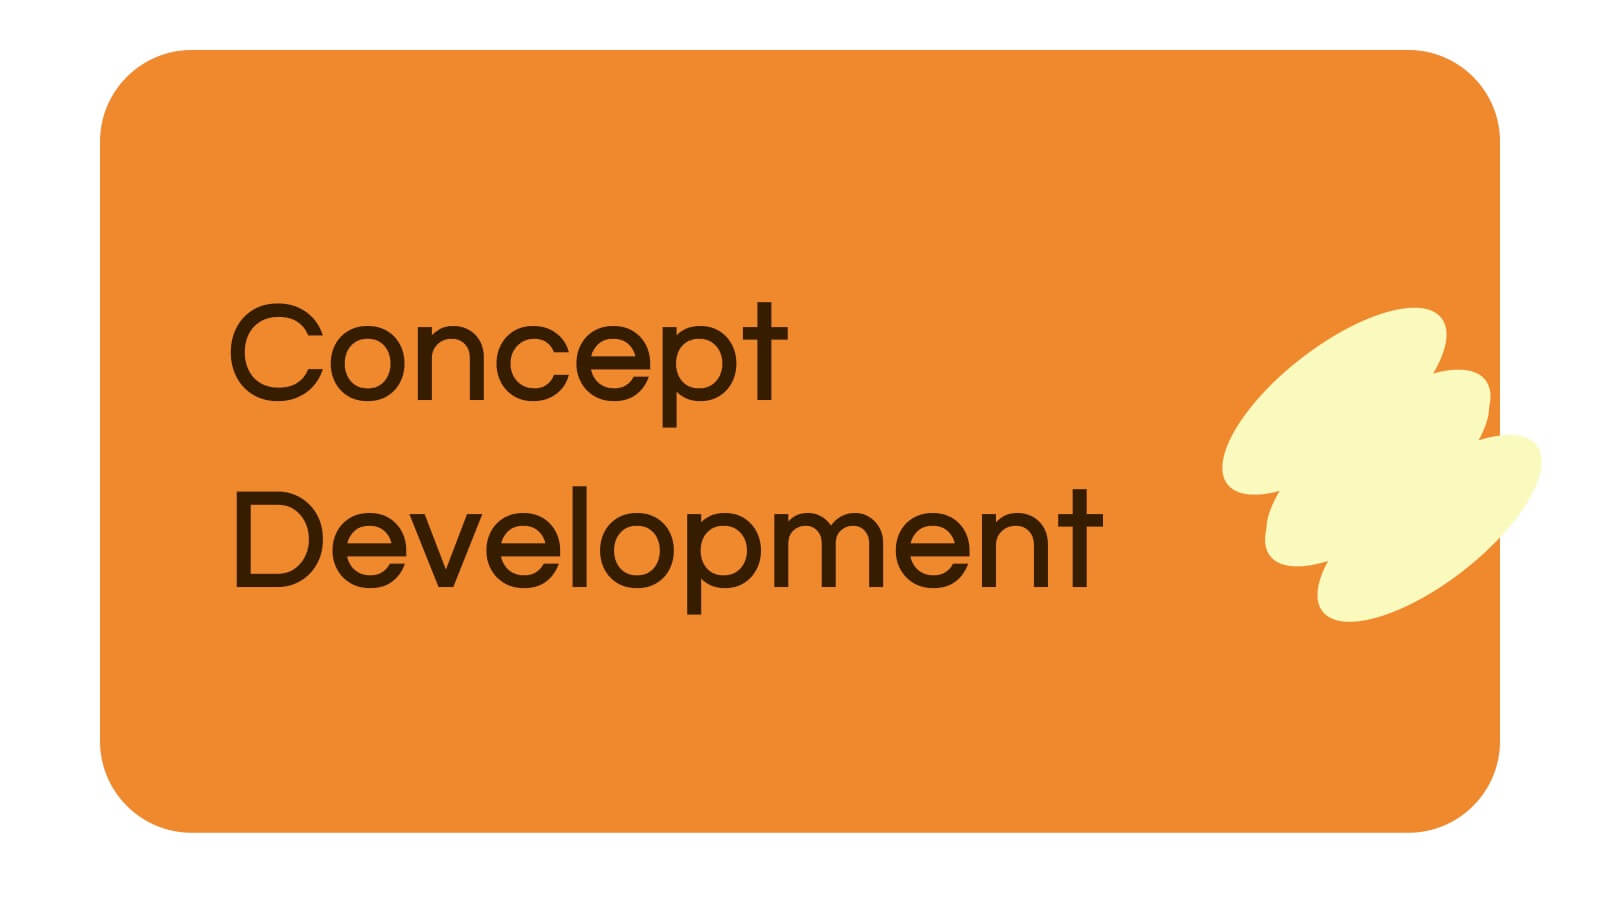
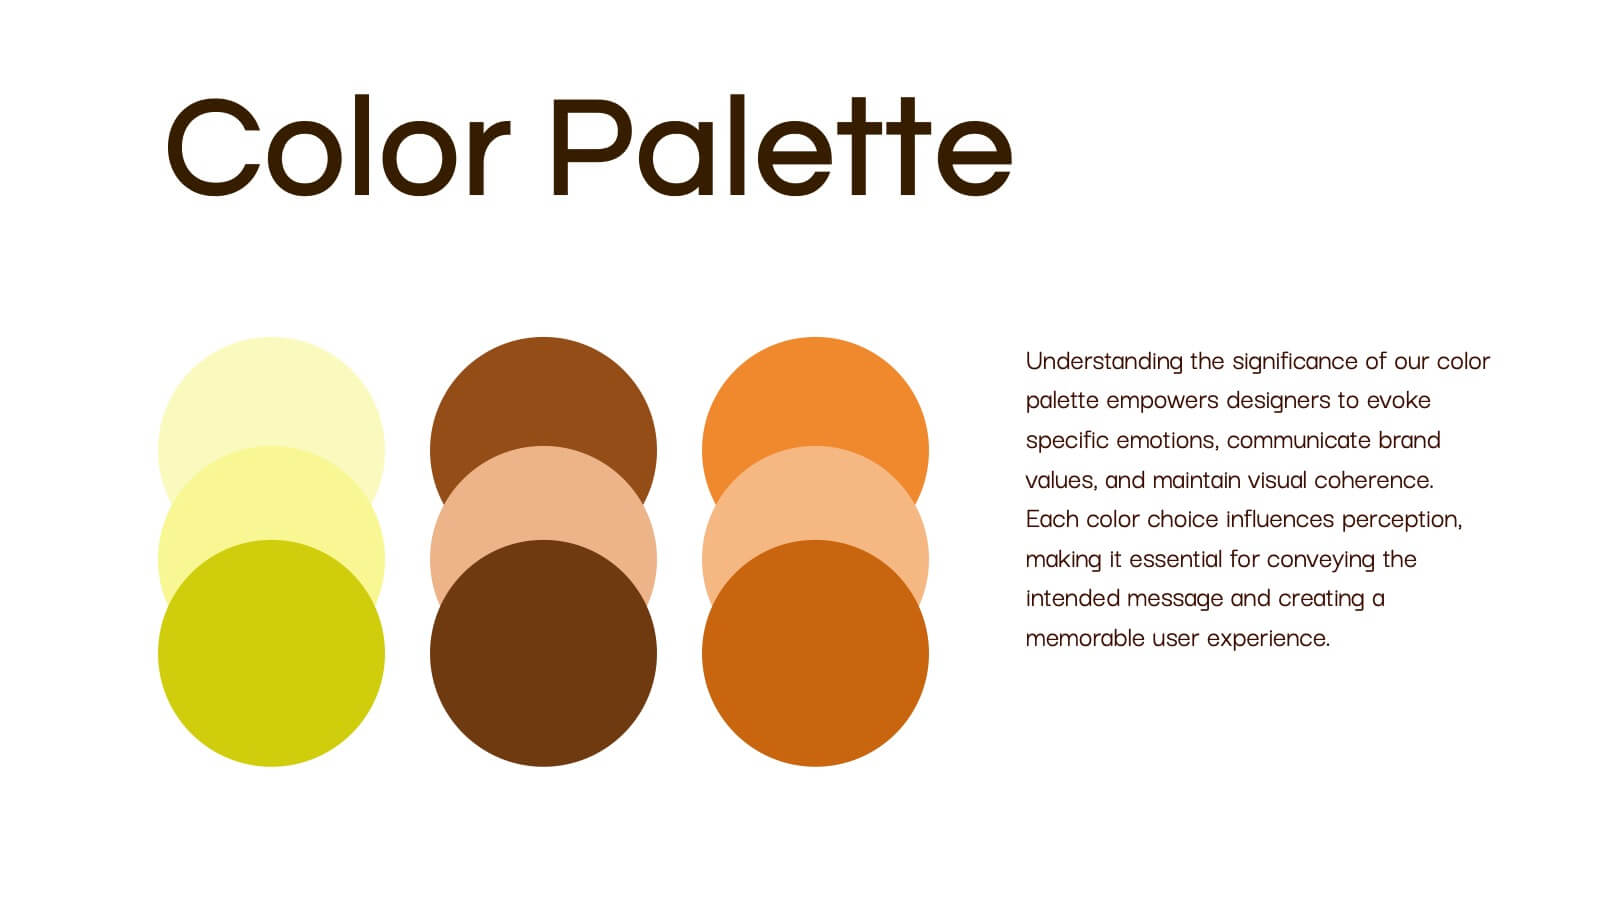
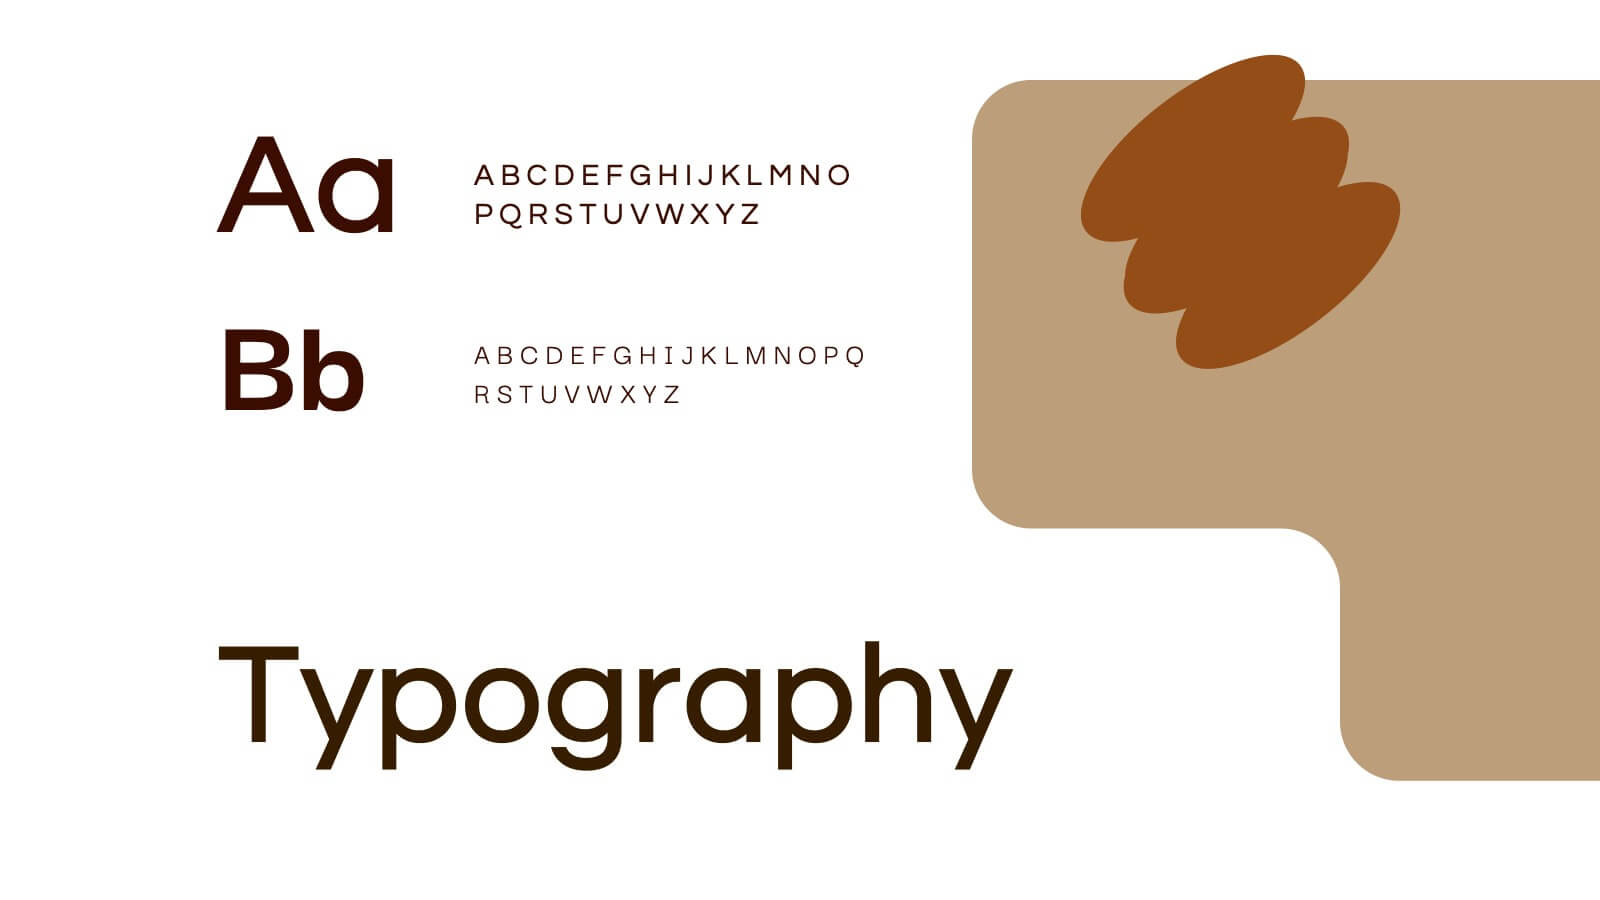
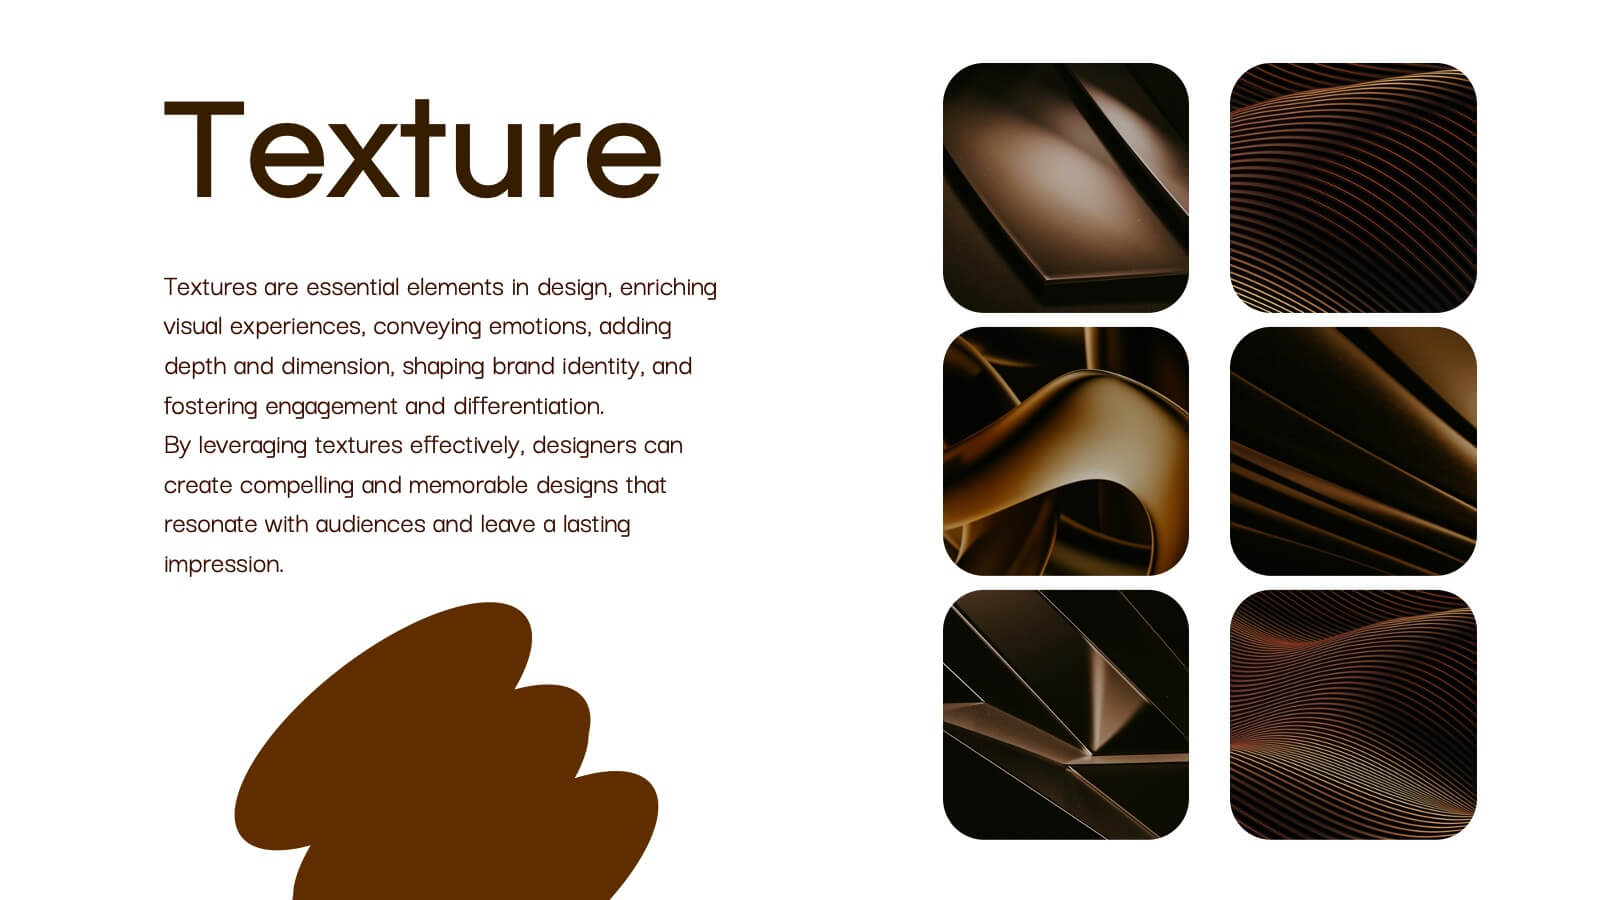
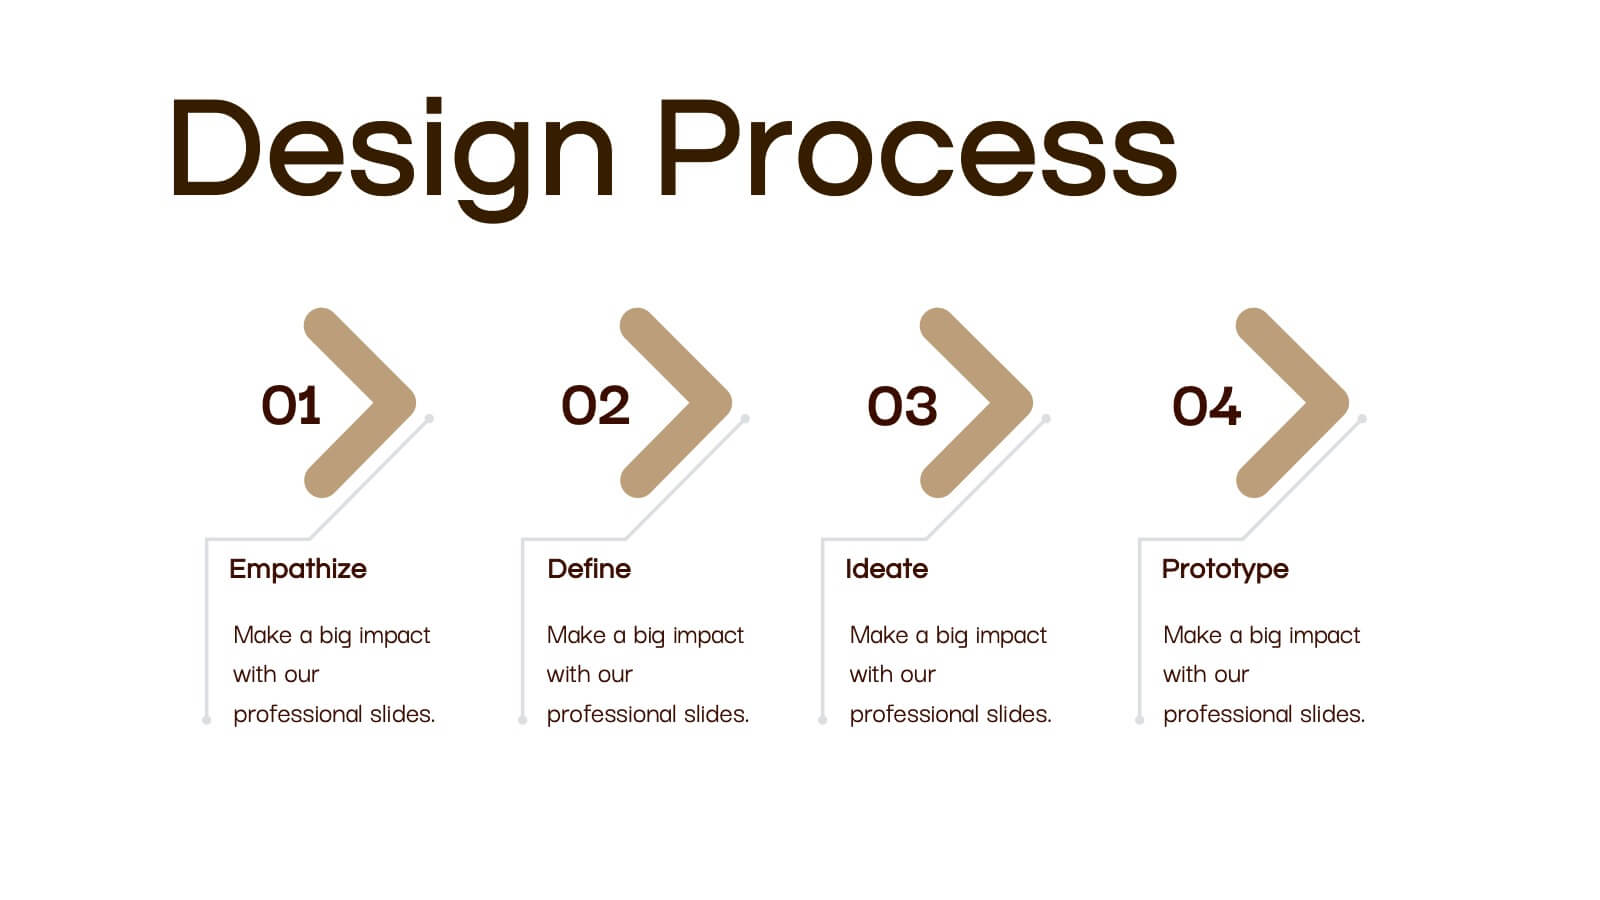
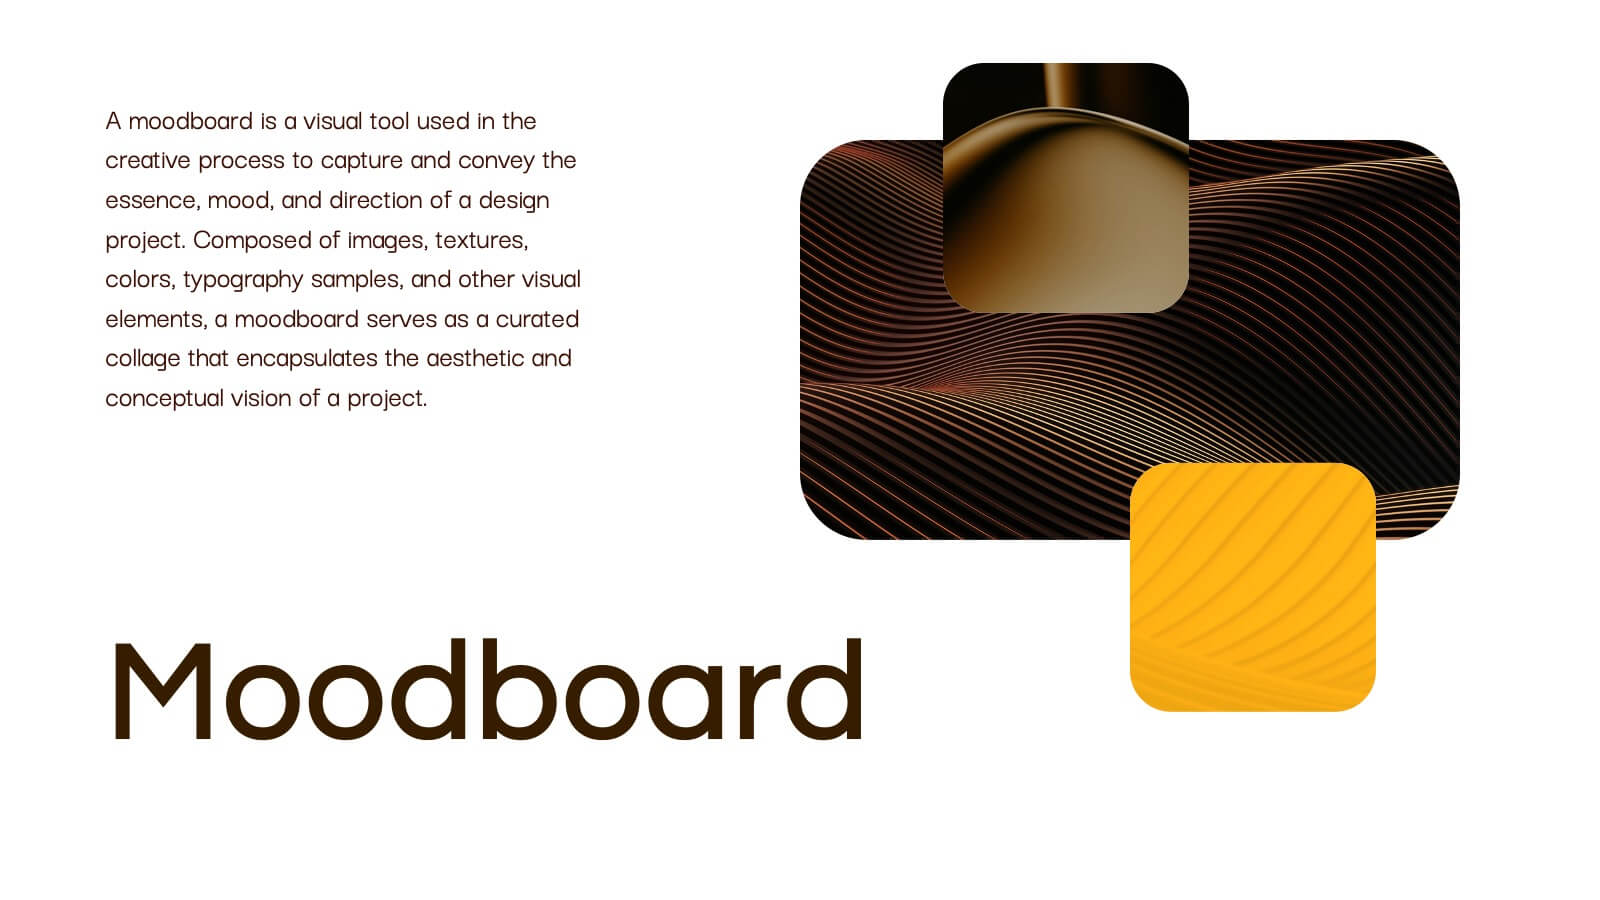
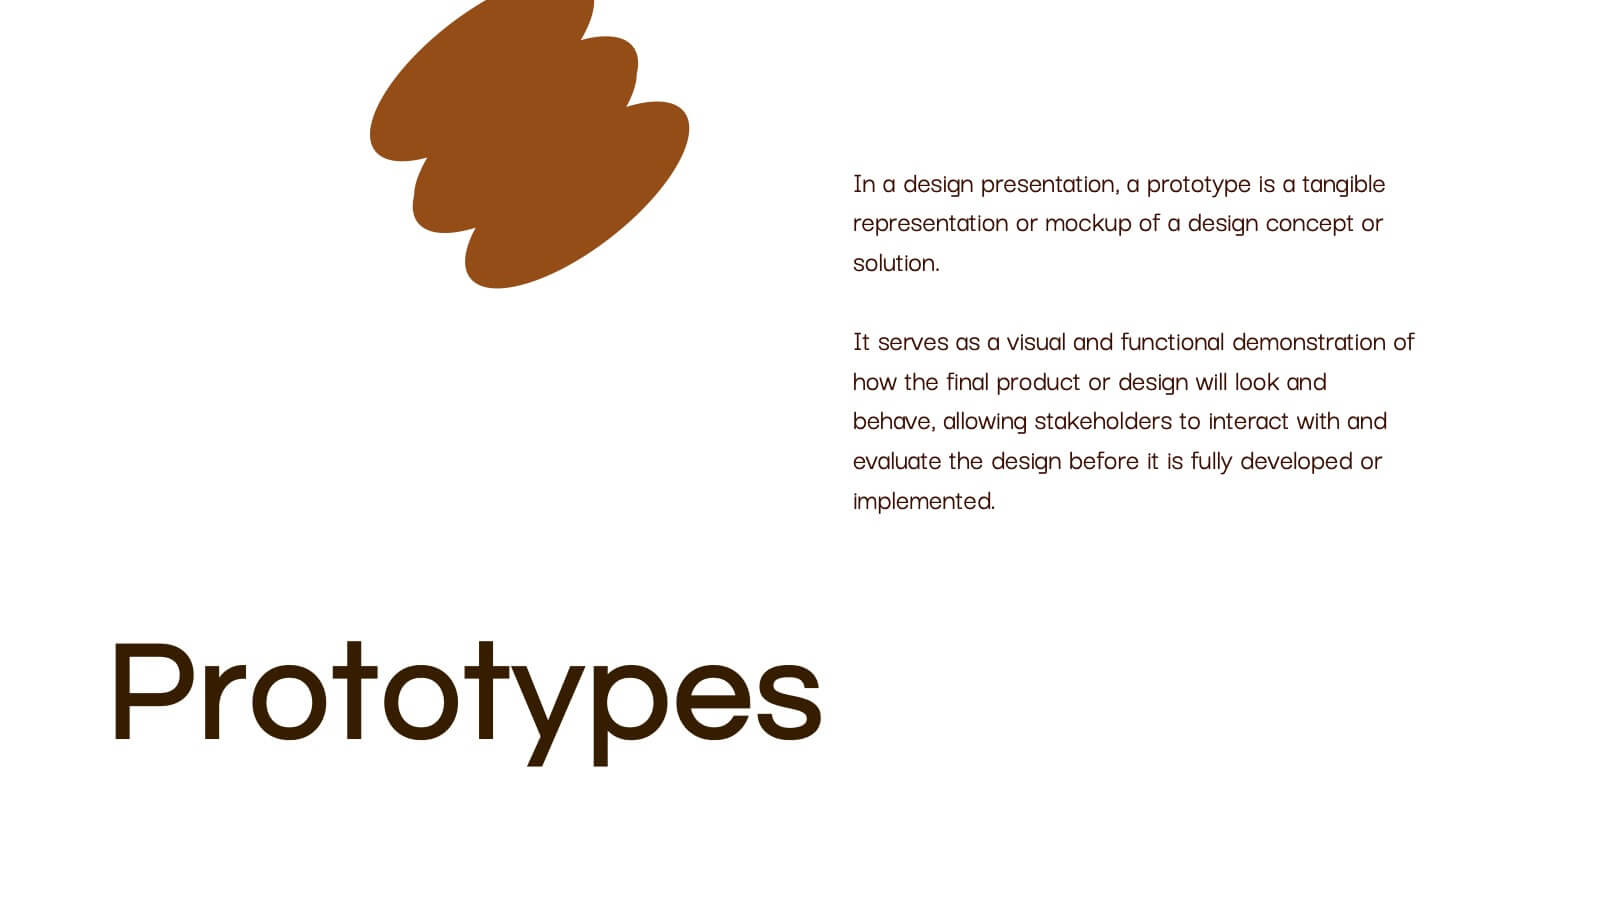
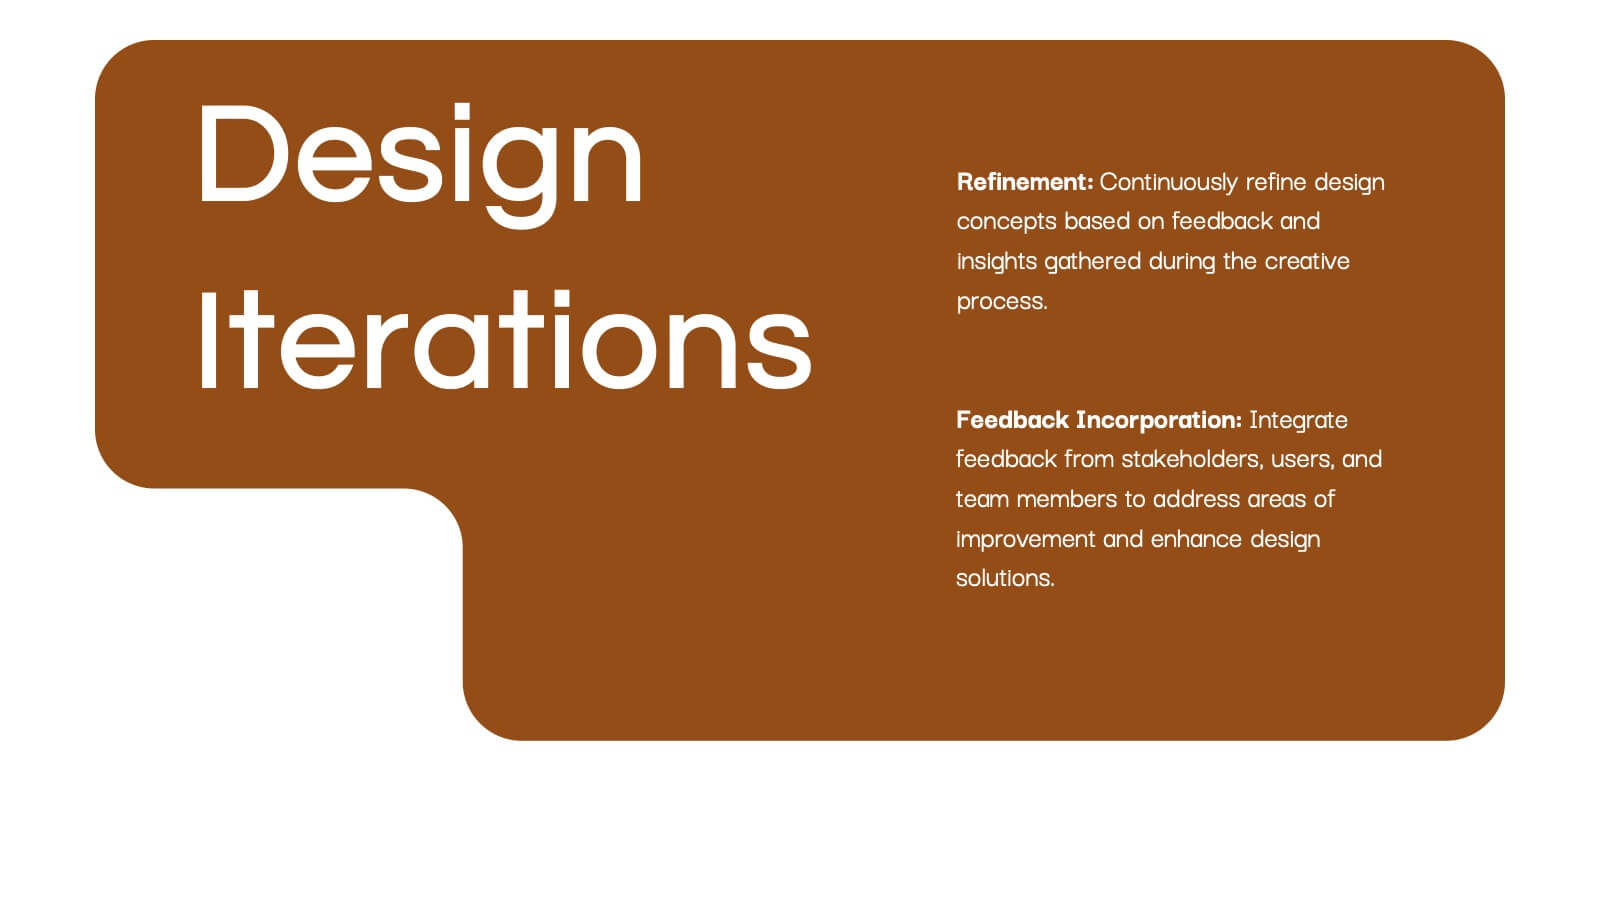
Obsidian Creative Design Report Presentation
Bring your creative vision to life with this stunning design presentation template! Perfect for showcasing your design process, from concept development and mood boards to typography and final assets. Ideal for creative professionals, this template offers clarity and style at every step. Compatible with PowerPoint, Keynote, and Google Slides, it’s your ultimate tool for design presentations.


6 diapositivas
Sales Strategy 30-60-90 Day Plan Presentation
Drive sales success with this structured 30-60-90 day strategy template! Designed to help sales teams and professionals set clear objectives, track progress, and optimize performance, this layout ensures a smooth transition from planning to execution. Fully customizable and compatible with PowerPoint, Keynote, and Google Slides for seamless presentations.


6 diapositivas
Organizational Change Process Presentation
Make complex transitions look simple with this modern visual template. Perfect for illustrating every stage of organizational change, this infographic-style design helps communicate key steps with clarity and focus. Easily editable and professionally designed, it's compatible with PowerPoint, Keynote, and Google Slides for seamless integration into your workflow.


7 diapositivas
IT Architecture Solution Infographic
Enhance your presentations with our IT Architecture Solution infographic, tailored for optimal clarity in Powerpoint, Keynote, and Google Slides. This infographic offers a comprehensive visual tool to simplify complex IT structures, ideal for professionals aiming to articulate intricate systems with ease. Its design facilitates a clear understanding of hierarchical IT frameworks, making it perfect for educational environments, business meetings, and tech conferences. Our IT Architecture Solution infographic is crafted to aid in the seamless conveyance of IT strategies and structures. The intuitive layout provides a straightforward narrative to IT infrastructure, ensuring your audience grasps technical details without feeling overwhelmed. This infographic is a must-have for anyone presenting IT concepts, delivering a balanced combination of simplicity and detail that caters to both novice and expert levels. With compatibility across various presentation platforms, this infographic integrates smoothly into your existing slides, enhancing your ability to communicate effectively in the digital age. Elevate your IT presentations with this essential visual aid.


26 diapositivas
Beauty Products Company Profile Presentation
A beauty products company is a business that specializes in the development, manufacturing, marketing, and sale of various beauty and skincare products. This presentation template is designed to showcase your cosmetics and skincare brand in the most captivating and alluring way possible. With a blend of elegance and modernity, this template is your beauty brand's ticket to leaving a lasting impression on clients, investors, and partners. Fully customizable and compatible with Powerpoint, Keynote, and Google Slides. The sophisticated color palette will reflect the elegance of your beauty company.


4 diapositivas
Case Analysis for Executive Decision Making Presentation
Guide stakeholders through data-driven insights with the Case Analysis for Executive Decision Making Presentation. This layout uses a clear upward progression with labeled steps to showcase milestones, challenges, or strategic outcomes—perfect for leadership meetings or high-level reviews. Fully customizable in PowerPoint, Keynote, and Google Slides.


4 diapositivas
Executive Summary Business Presentation
Summarize key business insights effectively with this executive summary template! Designed to present an overview of your strategy, problem statement, solutions, and conclusions in a structured format, this layout ensures clarity and impact. Ideal for reports, proposals, and business plans. Fully customizable and compatible with PowerPoint, Keynote, and Google Slides.


6 diapositivas
Personal Goals Infographics
The "Personal Goals" infographic template is a highly motivational and visually engaging resource, crafted specifically for PowerPoint, Keynote, and Google Slides. This template is perfect for life coaches, educators, and individuals looking to visually articulate their personal objectives and action plans. This template adeptly encapsulates key facets of personal goal setting, including short-term and long-term objectives, milestones, and strategies for achievement. The design promotes a clear depiction of each goal, along with the steps and timelines necessary for success. This makes it an invaluable tool for personal development workshops, coaching sessions, or even individual self-reflection and planning. The aesthetic of the template is uplifting and focused, with a color scheme that inspires positivity and determination. This not only makes the presentation visually appealing but also resonates with the theme of personal growth and ambition. Whether used for motivational seminars, educational purposes, or personal planning, this template ensures that the journey towards personal goals is laid out in a visually stimulating, organized, and inspiring manner.