


Características


¿Tienes alguna pregunta?
Recomendar


5 diapositivas
Alcohol Effects Infographics
Alcohol can have various effects on the body and mind, depending on the amount consumed, the individual's tolerance, and other factors. These unique vertical Infographics provide information about the physical, psychological, and social effects of alcohol use. They are designed to educate people about the risks of drinking too much and the consequences of alcohol abuse. To help you present your data these include statistics, illustrations, and other visual aids to help your audience understand the impact of alcohol on their health. By providing information about the effects of alcohol, this helps people make informed decisions about alcohol use.


7 diapositivas
Team Member Overview Slide Presentation
Bring your team’s story to life with a clean, engaging layout that makes every role instantly clear. This presentation helps you introduce key members, outline responsibilities, and highlight individual strengths in a simple, structured way that’s easy for any audience to follow. Fully compatible with PowerPoint, Keynote, and Google Slides.


4 diapositivas
Colorful Brainstorming Mind Map Presentation
A spark of imagination is all it takes to bring ideas to life, and this presentation helps you map them with clarity and flow. Designed to simplify complex thinking, it organizes concepts into visually connected clouds for effortless brainstorming. Fully compatible with PowerPoint, Keynote, and Google Slides.


6 diapositivas
Market Pressure Analysis with Five Forces Presentation
The Market Pressure Analysis with Five Forces Presentation offers a creative and easy-to-understand layout for applying Porter's Five Forces model. Designed with a distinctive star-like visual, each force—New Entry, Supplier, Competitive Rivalry, Buyer, and Substitutes—is clearly labeled with alphabetical markers (A–E) and corresponding icons. This format is perfect for showcasing industry dynamics in strategy meetings, marketing analysis, or competitive research. Each force can be highlighted individually for focused discussion. Fully customizable and compatible with PowerPoint, Keynote, and Google Slides.


4 diapositivas
Problem-Solving Puzzle Diagram Presentation
The "Problem-Solving Puzzle Diagram Presentation" template effectively showcases a creative approach to illustrating complex problem-solving strategies. Each piece of the puzzle represents a unique aspect of the solution process, encouraging viewers to consider how different components fit together to achieve a successful outcome. The diagram uses contrasting colors to differentiate between the sections clearly, making it easy for the audience to follow along and understand the interconnections. This template is perfect for business analysts, project managers, or any professional involved in strategic planning and problem-solving. It's designed to facilitate discussions in workshops, meetings, or team collaborations where visual aids can enhance comprehension and engagement in developing solutions.


5 diapositivas
Root Cause Analysis Fishbone Format Presentation
Break down complex problems with the Root Cause Analysis Fishbone Format Presentation. Designed to identify contributing factors visually, this diagram helps teams analyze causes across multiple categories—ideal for quality control, troubleshooting, and process improvement. Fully editable in Canva, PowerPoint, or Google Slides for effortless customization.


8 diapositivas
7-Step Business Process Presentation
Streamline your workflow with this 7-Step Business Process template. Perfect for illustrating step-by-step strategies, milestones, and project phases. Easily customizable with editable colors, icons, and text to fit your brand. Enhance presentations with a professional, clean layout. Compatible with PowerPoint, Keynote, and Google Slides for seamless integration.


6 diapositivas
Business Model Canvas Resources Infographic
Embark on a journey through the essential concept of the Business Model Canvas (BMC)! This infographic serves as your gateway to understanding how this versatile tool can revolutionize your business strategy. From identifying key elements to optimizing your business model, we reveal the secrets that make the BMC an invaluable resource. Discover how the BMC can guide you in crafting a sustainable and adaptable business strategy. Learn to align your resources, activities, and customer focus to achieve competitive advantage. Explore real-world examples of successful businesses that have leveraged the BMC to innovate and grow. With this engaging infographic, compatible with PowerPoint, Keynote, and Google Slides, sharing your understanding of the Business Model Canvas is effortless. Empower yourself with the knowledge to revolutionize your business approach. Dive into the world of the BMC and embark on a journey of strategic exploration and innovation.


5 diapositivas
Sustainable Development Goals Deck Presentation
Present your sustainability roadmap with clarity using the Sustainable Development Goals Deck. Designed for highlighting eco-initiatives, circular strategies, and responsible development objectives. The circular layout supports goal-based narratives and strategic breakdowns. Fully editable in PowerPoint, Keynote, and Google Slides—ideal for ESG reports, environmental pitches, or CSR presentations.


5 diapositivas
Vaccine Myths Infographic
Vaccine Myths are false or misleading claims about vaccines that can contribute to vaccine hesitancy and misinformation. These infographic templates are designed to debunk common misconceptions and myths surrounding vaccines. These visually appealing and informative templates are ideal for healthcare professionals, educators, and organizations aiming to promote accurate information about vaccines and combat vaccine hesitancy. These infographics aim to educate and empower individuals to make informed decisions about vaccination and contribute to public health efforts. Compatible with Powerpoint, Keynote, and Google Slides.


10 diapositivas
Leadership and Team Management Presentation
Enhance team leadership with the Leadership and Team Management presentation template. Featuring a structured layout with a clear hierarchy, this template helps illustrate management strategies, team roles, and leadership principles. Perfect for business leaders, HR professionals, and trainers. Fully customizable and compatible with PowerPoint, Keynote, and Google Slides.


5 diapositivas
Online Advertising and SEO Marketing Presentation
Elevate your digital marketing strategy with this engaging infographic template! Designed for clarity, it simplifies online advertising and SEO concepts, covering key metrics, trends, and strategies. Perfect for teams, clients, or stakeholders, it’s fully customizable and compatible with PowerPoint, Keynote, and Google Slides for seamless presentations that captivate and inform.


6 diapositivas
Corporate Responsibility Sustainability Plan Presentation
Present your sustainability vision with the Corporate Responsibility Sustainability Plan Presentation. Designed around a tree-themed layout, this infographic highlights six key initiatives—perfect for showcasing environmental, social, and governance (ESG) efforts. Ideal for CSR reports, strategy decks, or stakeholder presentations. Fully editable in Canva, PowerPoint, Keynote, and Google Slides.


8 diapositivas
Virtual Team Collaboration Presentation
The "Virtual Team Collaboration" presentation template is designed to highlight different facets of teamwork in a remote setting. Each slide features a central visual metaphor illustrated by connected circles, symbolizing the interconnected nature of virtual team activities and communication. The layout provides placeholders for titles and descriptive text, making it suitable for detailing various aspects of virtual collaboration such as project management, communication protocols, and role assignments. The design encourages a clear and organized presentation of information, facilitating discussions on best practices and strategies for effective remote teamwork.


6 diapositivas
Risk and Return Investment
Illustrate the delicate balance between risk and reward with this visual concept. This presentation uses a see-saw metaphor to compare investment risk versus financial return, ideal for finance professionals, consultants, and educators. Fully customizable in PowerPoint, Keynote, and Google Slides.


22 diapositivas
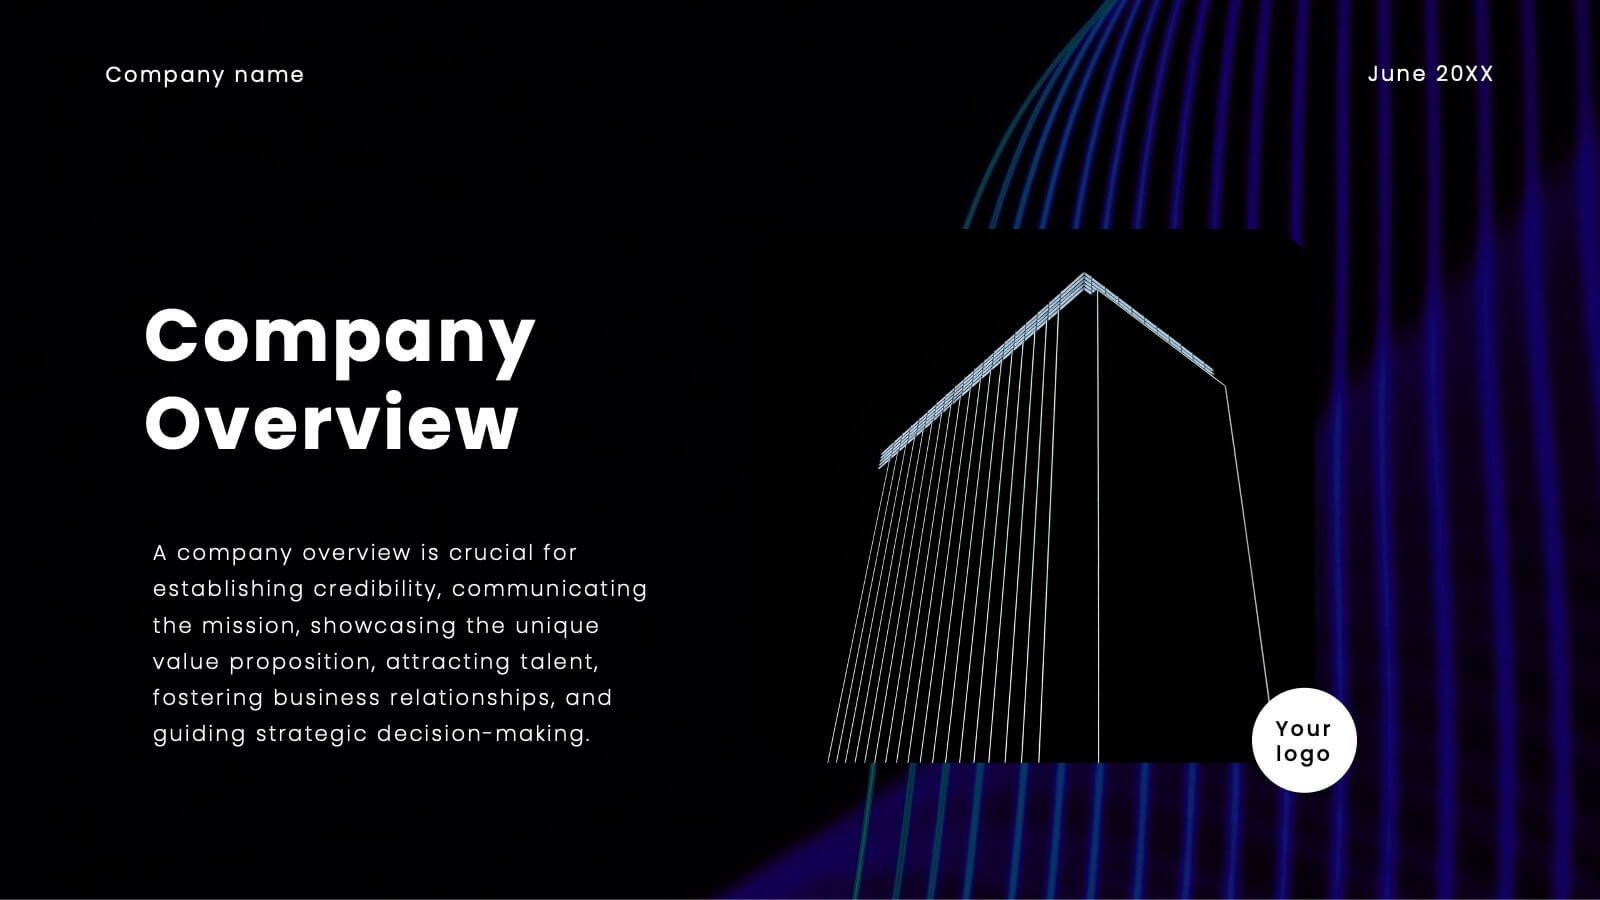
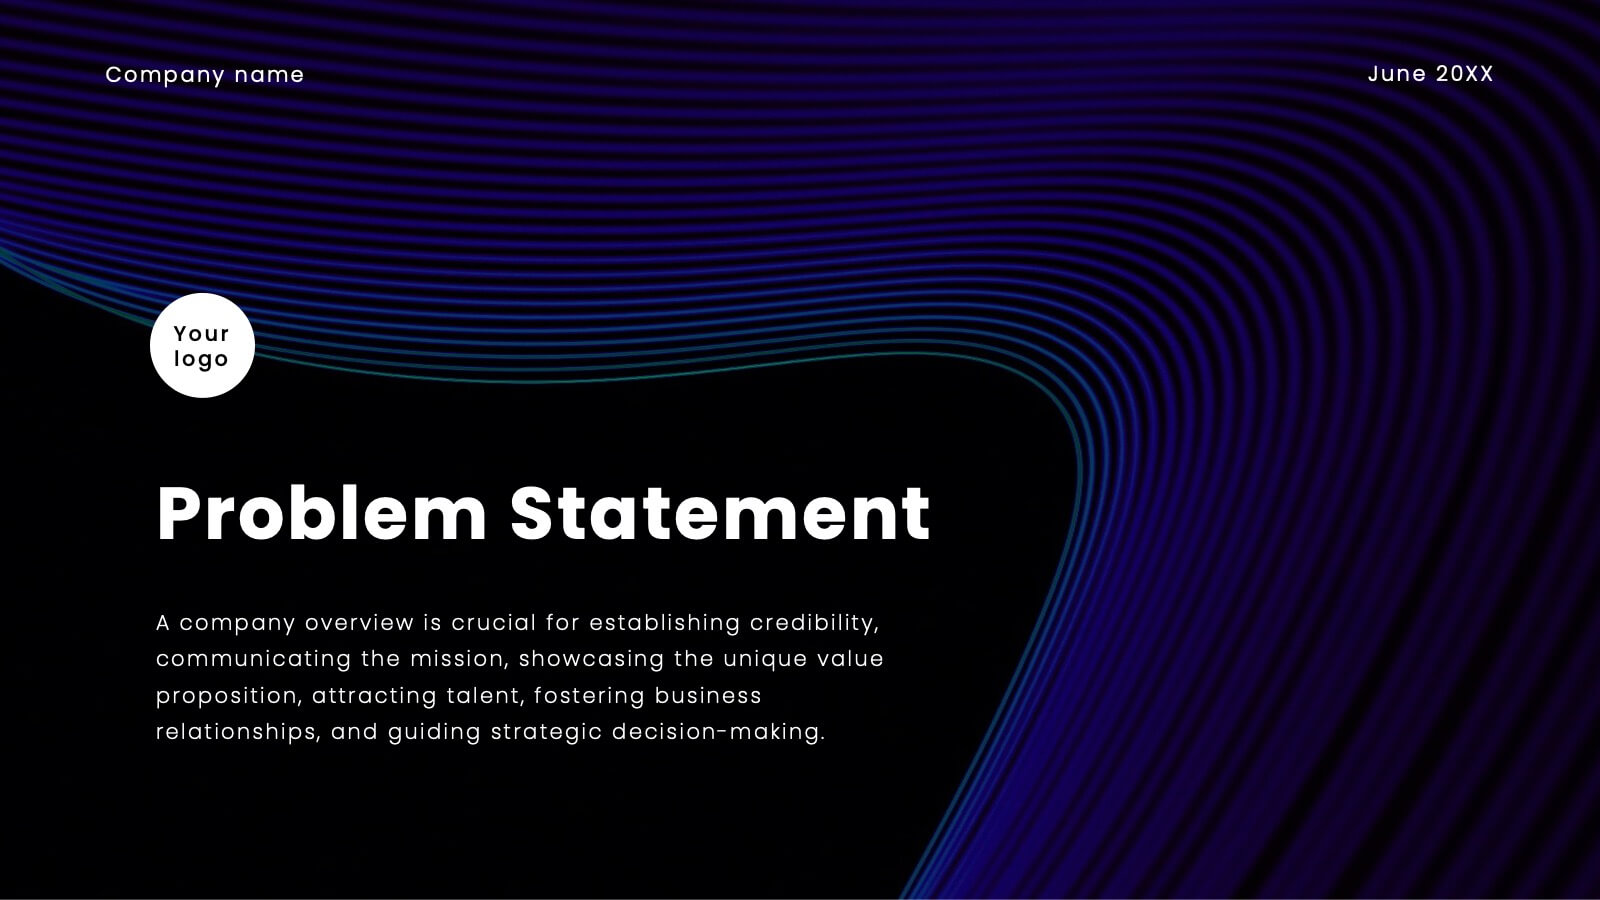
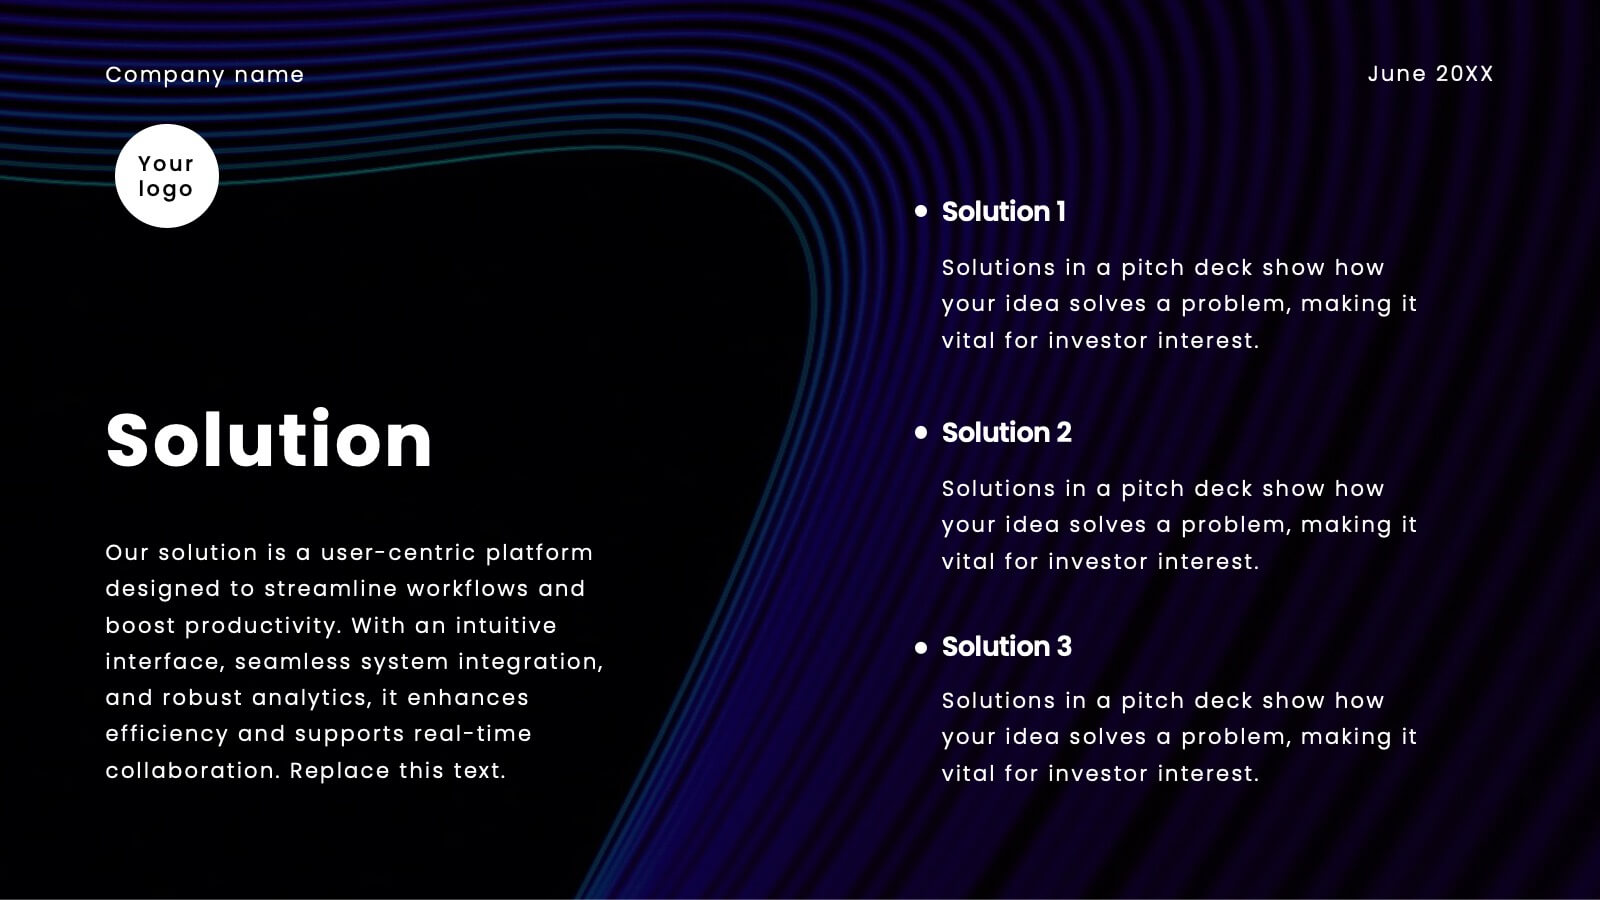
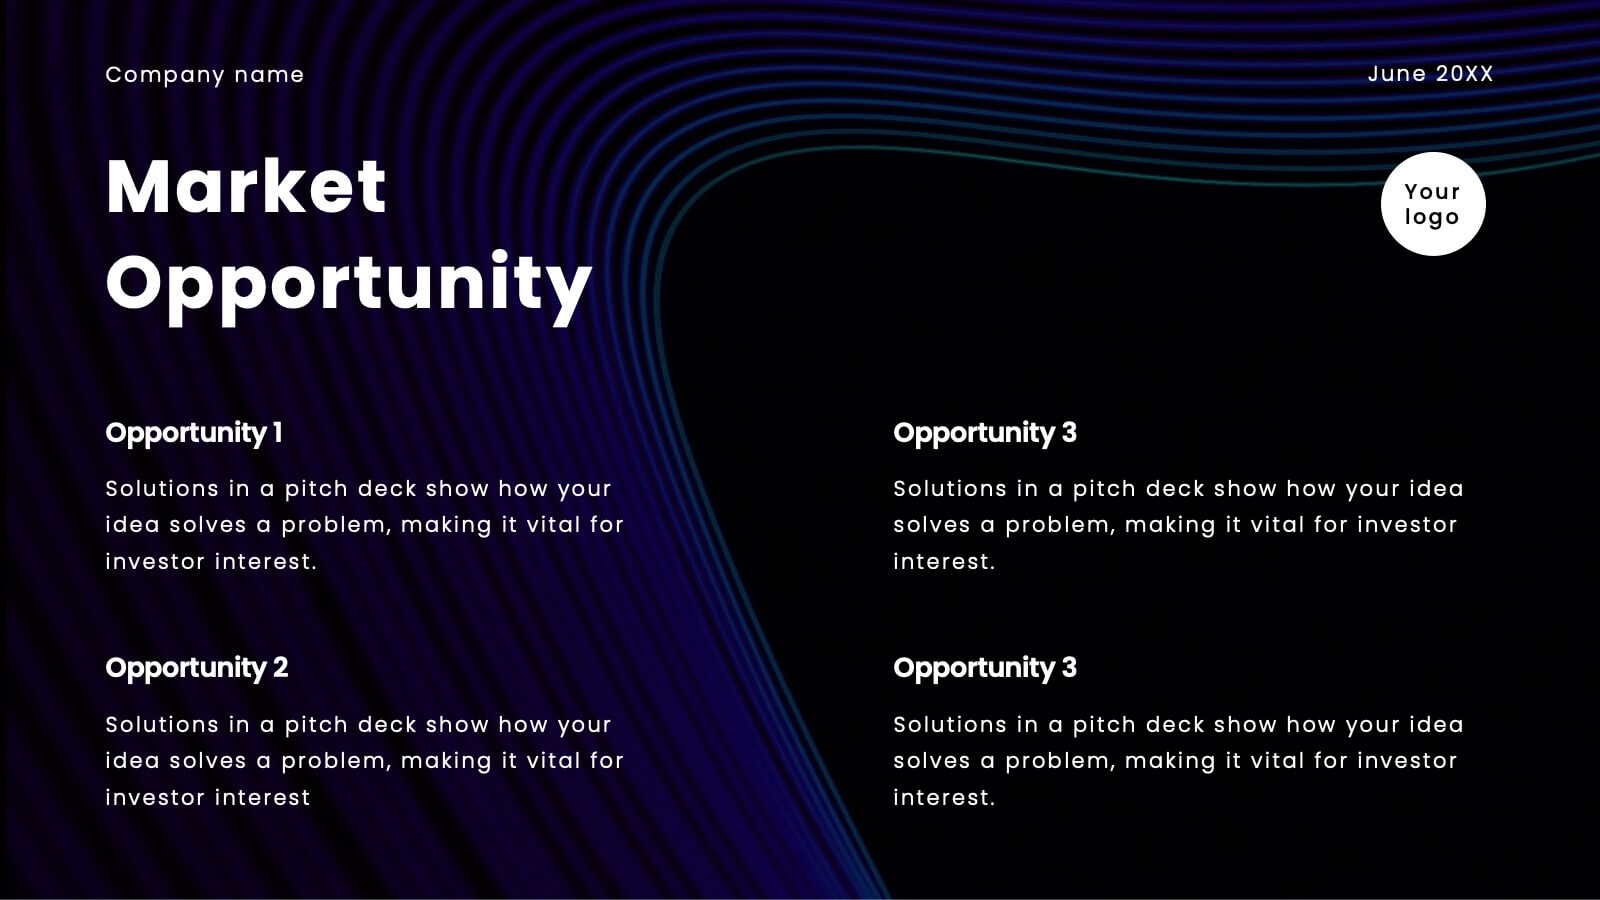
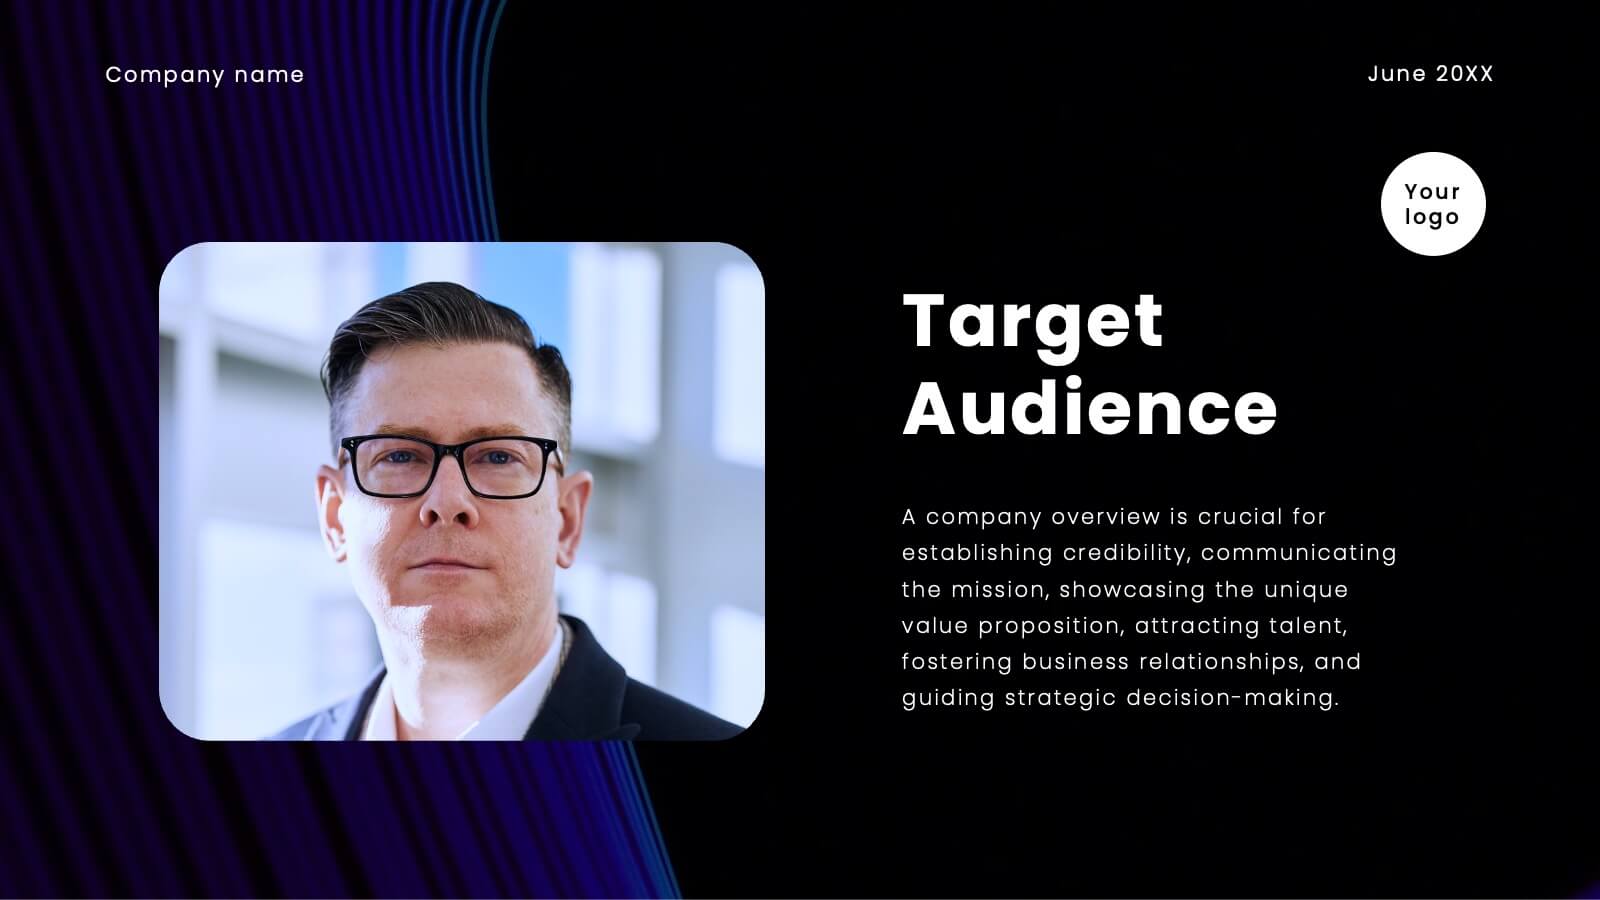
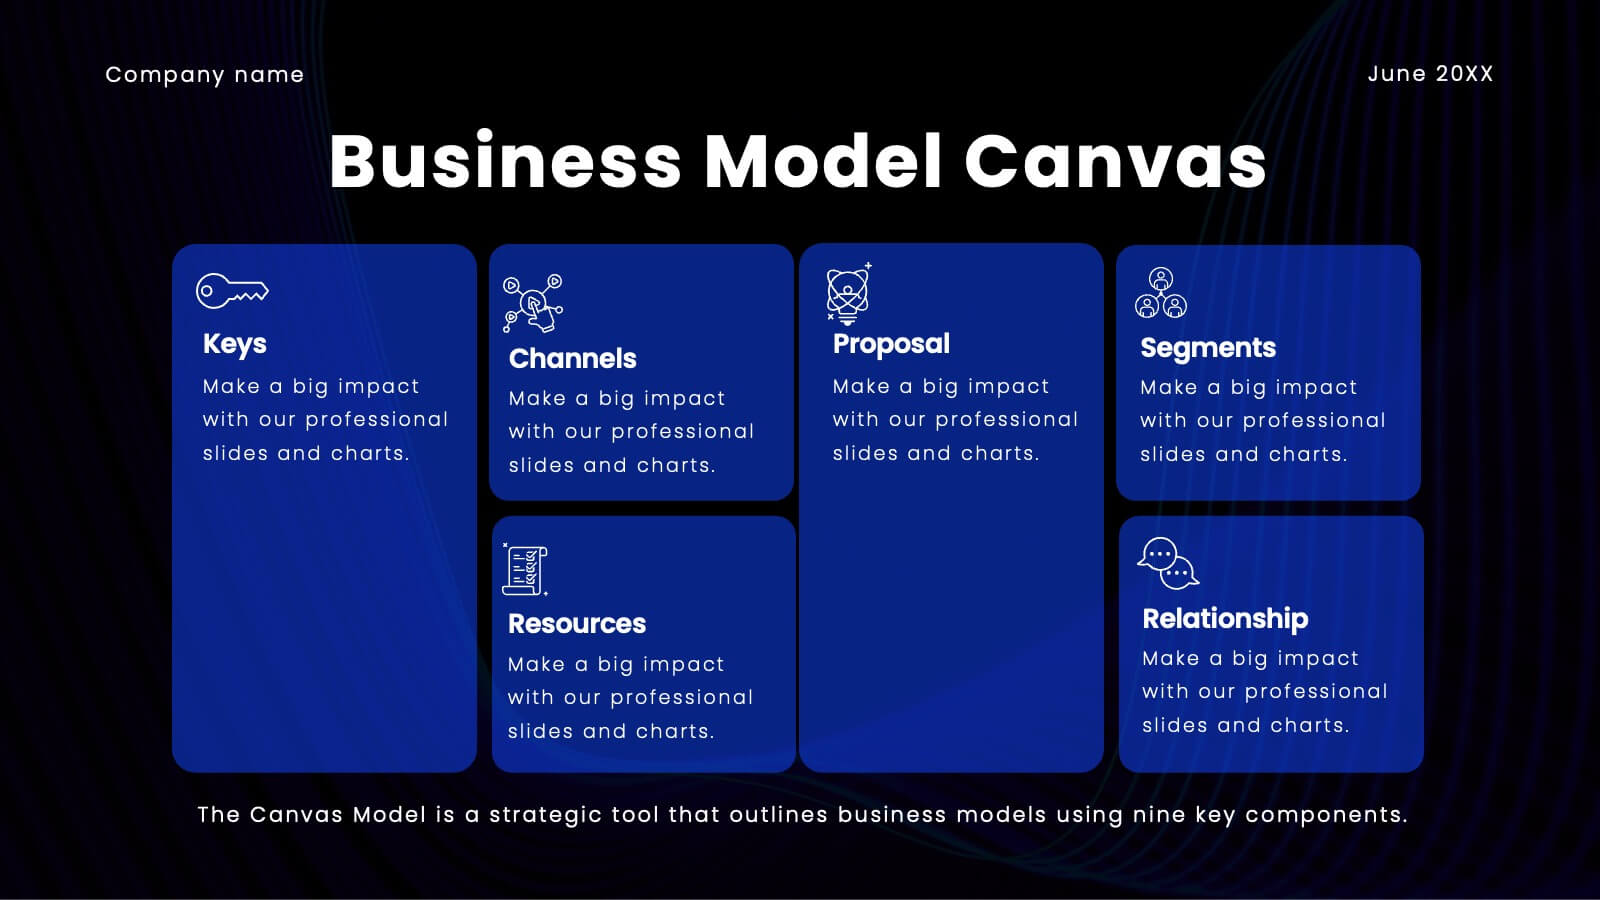
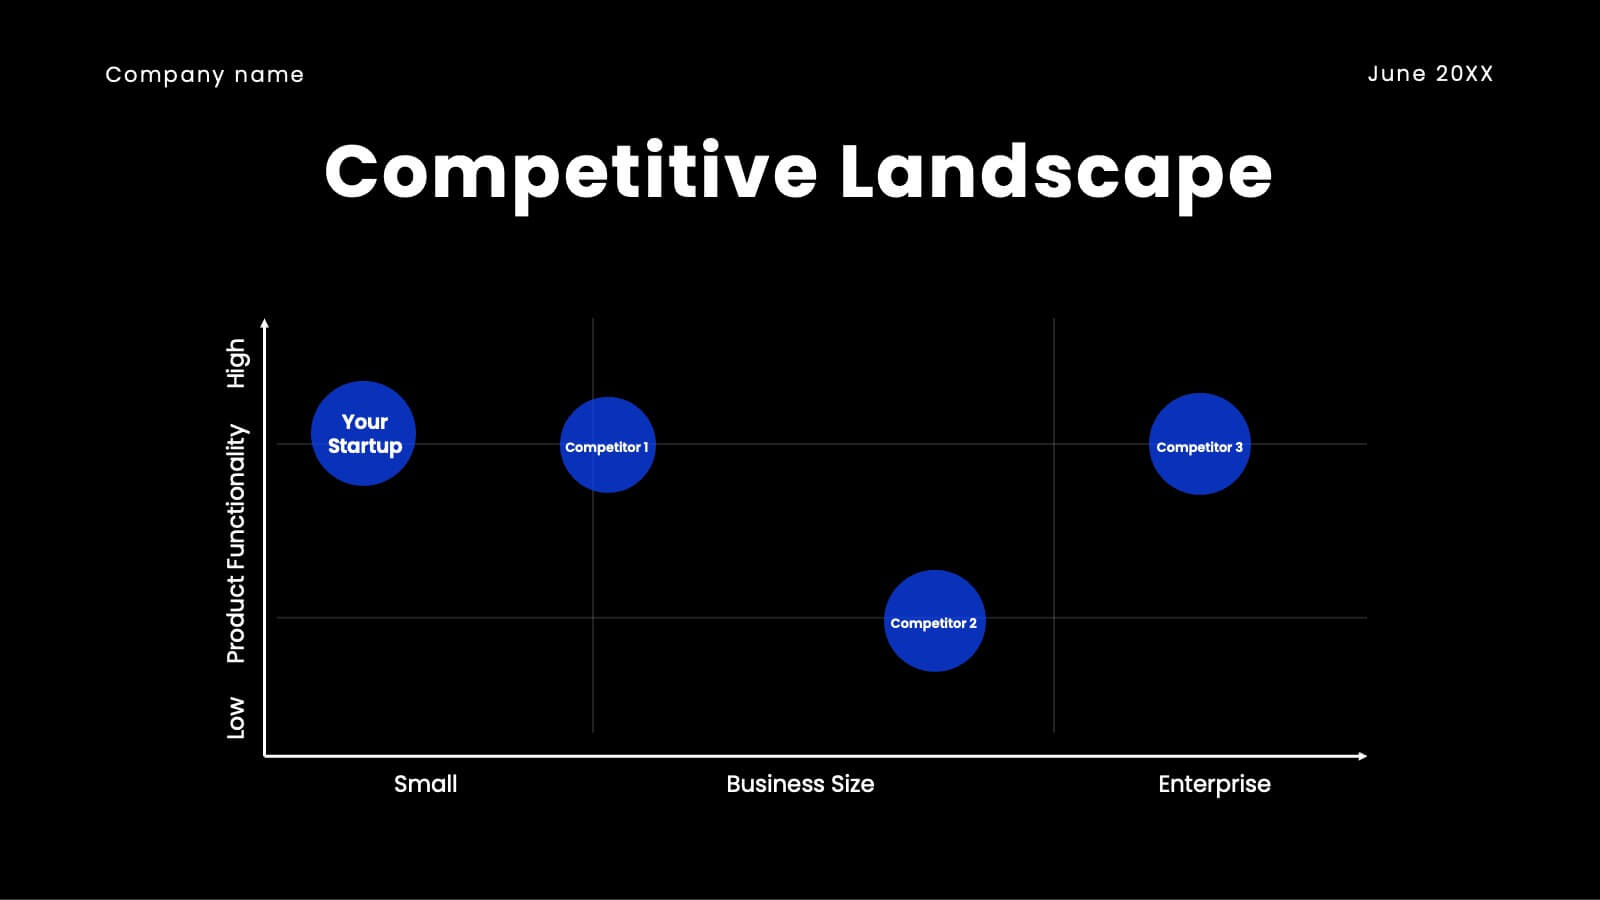
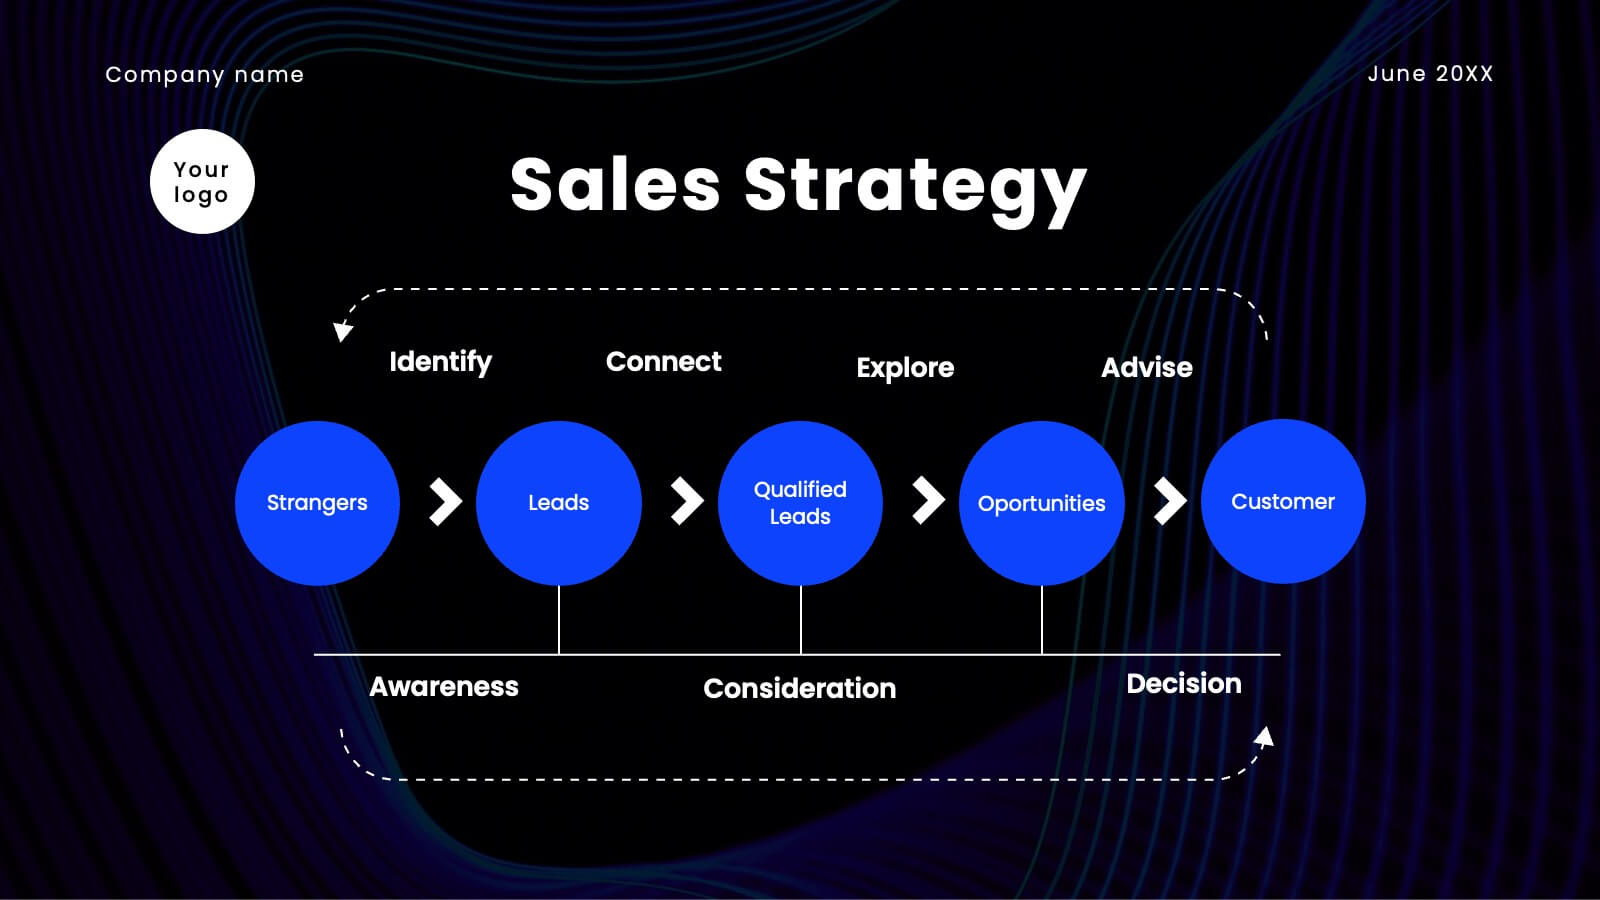
Jolt Business Idea Pitch Deck Presentation
Prepare to electrify your audience with a pitch deck that’s nothing short of spectacular! This high-impact template is designed to captivate, engage, and persuade your stakeholders with every slide. It’s more than just a presentation; it’s your gateway to showcasing your company’s unique value proposition, innovative solutions, and future growth potential in a way that’s visually stunning and incredibly compelling. From the moment you unveil your company overview to the final slide on financials and funding requirements, this template ensures your pitch is memorable, powerful, and impossible to ignore. The sleek, modern design highlights your strategic vision, competitive advantages, and market opportunities, making a bold statement that you’re ready to lead the future. Compatible with PowerPoint, Keynote, and Google Slides, this pitch deck template is your ultimate tool for turning heads and securing buy-in from investors, partners, and clients alike!


7 diapositivas
Europe Map Infographic Presentation Template
Europe is a continent located in the northern part of the globe and surrounded by water on three sides. It is bordered by the Atlantic Ocean to the west, the Arctic Ocean to the north, and the Mediterranean Sea to the south. Europe is divided into roughly forty four countries and dependent territories, each one with its own unique identity, cuisine and culture. This European map template is a vector map of an outline of Europe, with color-coded and labeled countries and a legend. This map template can be used for presentations, reports and blogs about tourism it's a simple and clean style map.