


Características


¿Tienes alguna pregunta?
Recomendar


7 diapositivas
Porter's Five Forces Diagram
Porter's Five Forces is a strategic framework developed by Michael Porter that helps analyze the competitive environment of an industry. The five forces are represented in a diagram to understand the competitive dynamics and attractiveness of an industry or market. In this infographic template, the forces are represented as five segments of a circle or a graphical illustration with arrows and descriptions. Compatible with Powerpoint, Keynote, and Google Slides. This template is a powerful, bold, and insightful tool that dissects competitive forces, revealing strategic insights for businesses.


5 diapositivas
Architecture and Construction Strategy Presentation
Lay the foundation for success with this clean, construction-inspired presentation design. Ideal for showcasing project strategies, development phases, or architectural plans, it helps you communicate structure and vision with clarity. Fully customizable and compatible with PowerPoint, Keynote, and Google Slides for effortless editing and professional results.


21 diapositivas
Somnara Full-Service Agency Project Plan Presentation
Present your agency’s expertise with a comprehensive project plan template designed to impress clients and stakeholders. This sleek and professional layout allows you to outline your mission and vision, highlight team strengths, and showcase core services with clarity. Use the client testimonials and case studies sections to establish credibility and trust. Visualize your strategic approach with dedicated slides for market analysis, creative process, and execution strategy. The template also includes detailed sections for partnership opportunities, social responsibility initiatives, and a future outlook, ensuring a holistic view of your agency’s capabilities and forward-thinking approach. Fully editable and compatible with PowerPoint, Google Slides, and Keynote, this template is perfect for full-service agencies seeking to elevate their presentations. Customize each slide to reflect your unique value and deliver impactful, results-oriented proposals.
5 diapositivas
Business Strategy Arrow Presentation
Enhance your strategic planning with the Business Strategy Arrow Presentation. This visually structured template guides your audience through a step-by-step progression, making it ideal for business roadmaps, strategic plans, and goal-oriented workflows. Easily customize the colors, text, and icons to align with your brand. Fully compatible with PowerPoint, Keynote, and Google Slides for effortless editing and professional presentations.


8 diapositivas
Monthly and Weekly Planning Calendar Presentation
Stay ahead of your schedule with this all-in-one monthly and weekly planner template. Designed for professionals and teams who need to balance long-term goals with daily priorities, this presentation offers a 6-week overview, to-do list, notes section, and weekday breakdown. With sleek color-coded tabs and editable labels, it’s perfect for time-blocking, campaign tracking, or event coordination. Easily customizable in PowerPoint, Keynote, and Google Slides.


7 diapositivas
Agenda Infographic
Organize and present your meeting or event agendas with our professionally designed slide templates. Each template is tailored to help you clearly outline the schedule and topics, ensuring that your meetings are both structured and efficient. These templates feature a variety of layouts that can accommodate different types of agendas, from detailed hourly breakdowns to high-level overviews. The use of engaging graphics, bullet points, and timeline visuals aids in presenting the sequence of events or discussion topics in a clear and appealing manner. Color coding and distinct typographic hierarchies make it easy to navigate through the agenda, enhancing readability and viewer engagement. Fully customizable, these slides allow you to adapt the design to your corporate colors, add your logos, and rearrange elements to suit your specific meeting needs. Ideal for business meetings, conferences, workshops, and seminars, these agenda slides are essential tools for keeping your events organized and on track.


6 diapositivas
Harvey Ball Assessment Infographics
Evaluate performance or satisfaction with our Harvey Ball Assessment infographic template. This template is fully compatible with popular presentation software like PowerPoint, Keynote, and Google Slides, allowing you to easily customize it to represent and communicate assessment results using Harvey Balls. The Harvey Ball Assessment infographic template offers a visually engaging platform to visually depict evaluations, ratings, or levels of satisfaction using Harvey Balls. Whether you're a manager, HR professional, or evaluator, this template provides a user-friendly canvas to create informative presentations and reports to convey assessment outcomes effectively. Enhance your assessment reporting with this SEO-optimized Harvey Ball Assessment infographic template, thoughtfully designed for clarity and ease of use. Customize it to showcase assessment data, ratings, and scores, making it a valuable tool for sharing performance or satisfaction levels with your audience. Start crafting your personalized infographic today to communicate your assessment results efficiently.


21 diapositivas
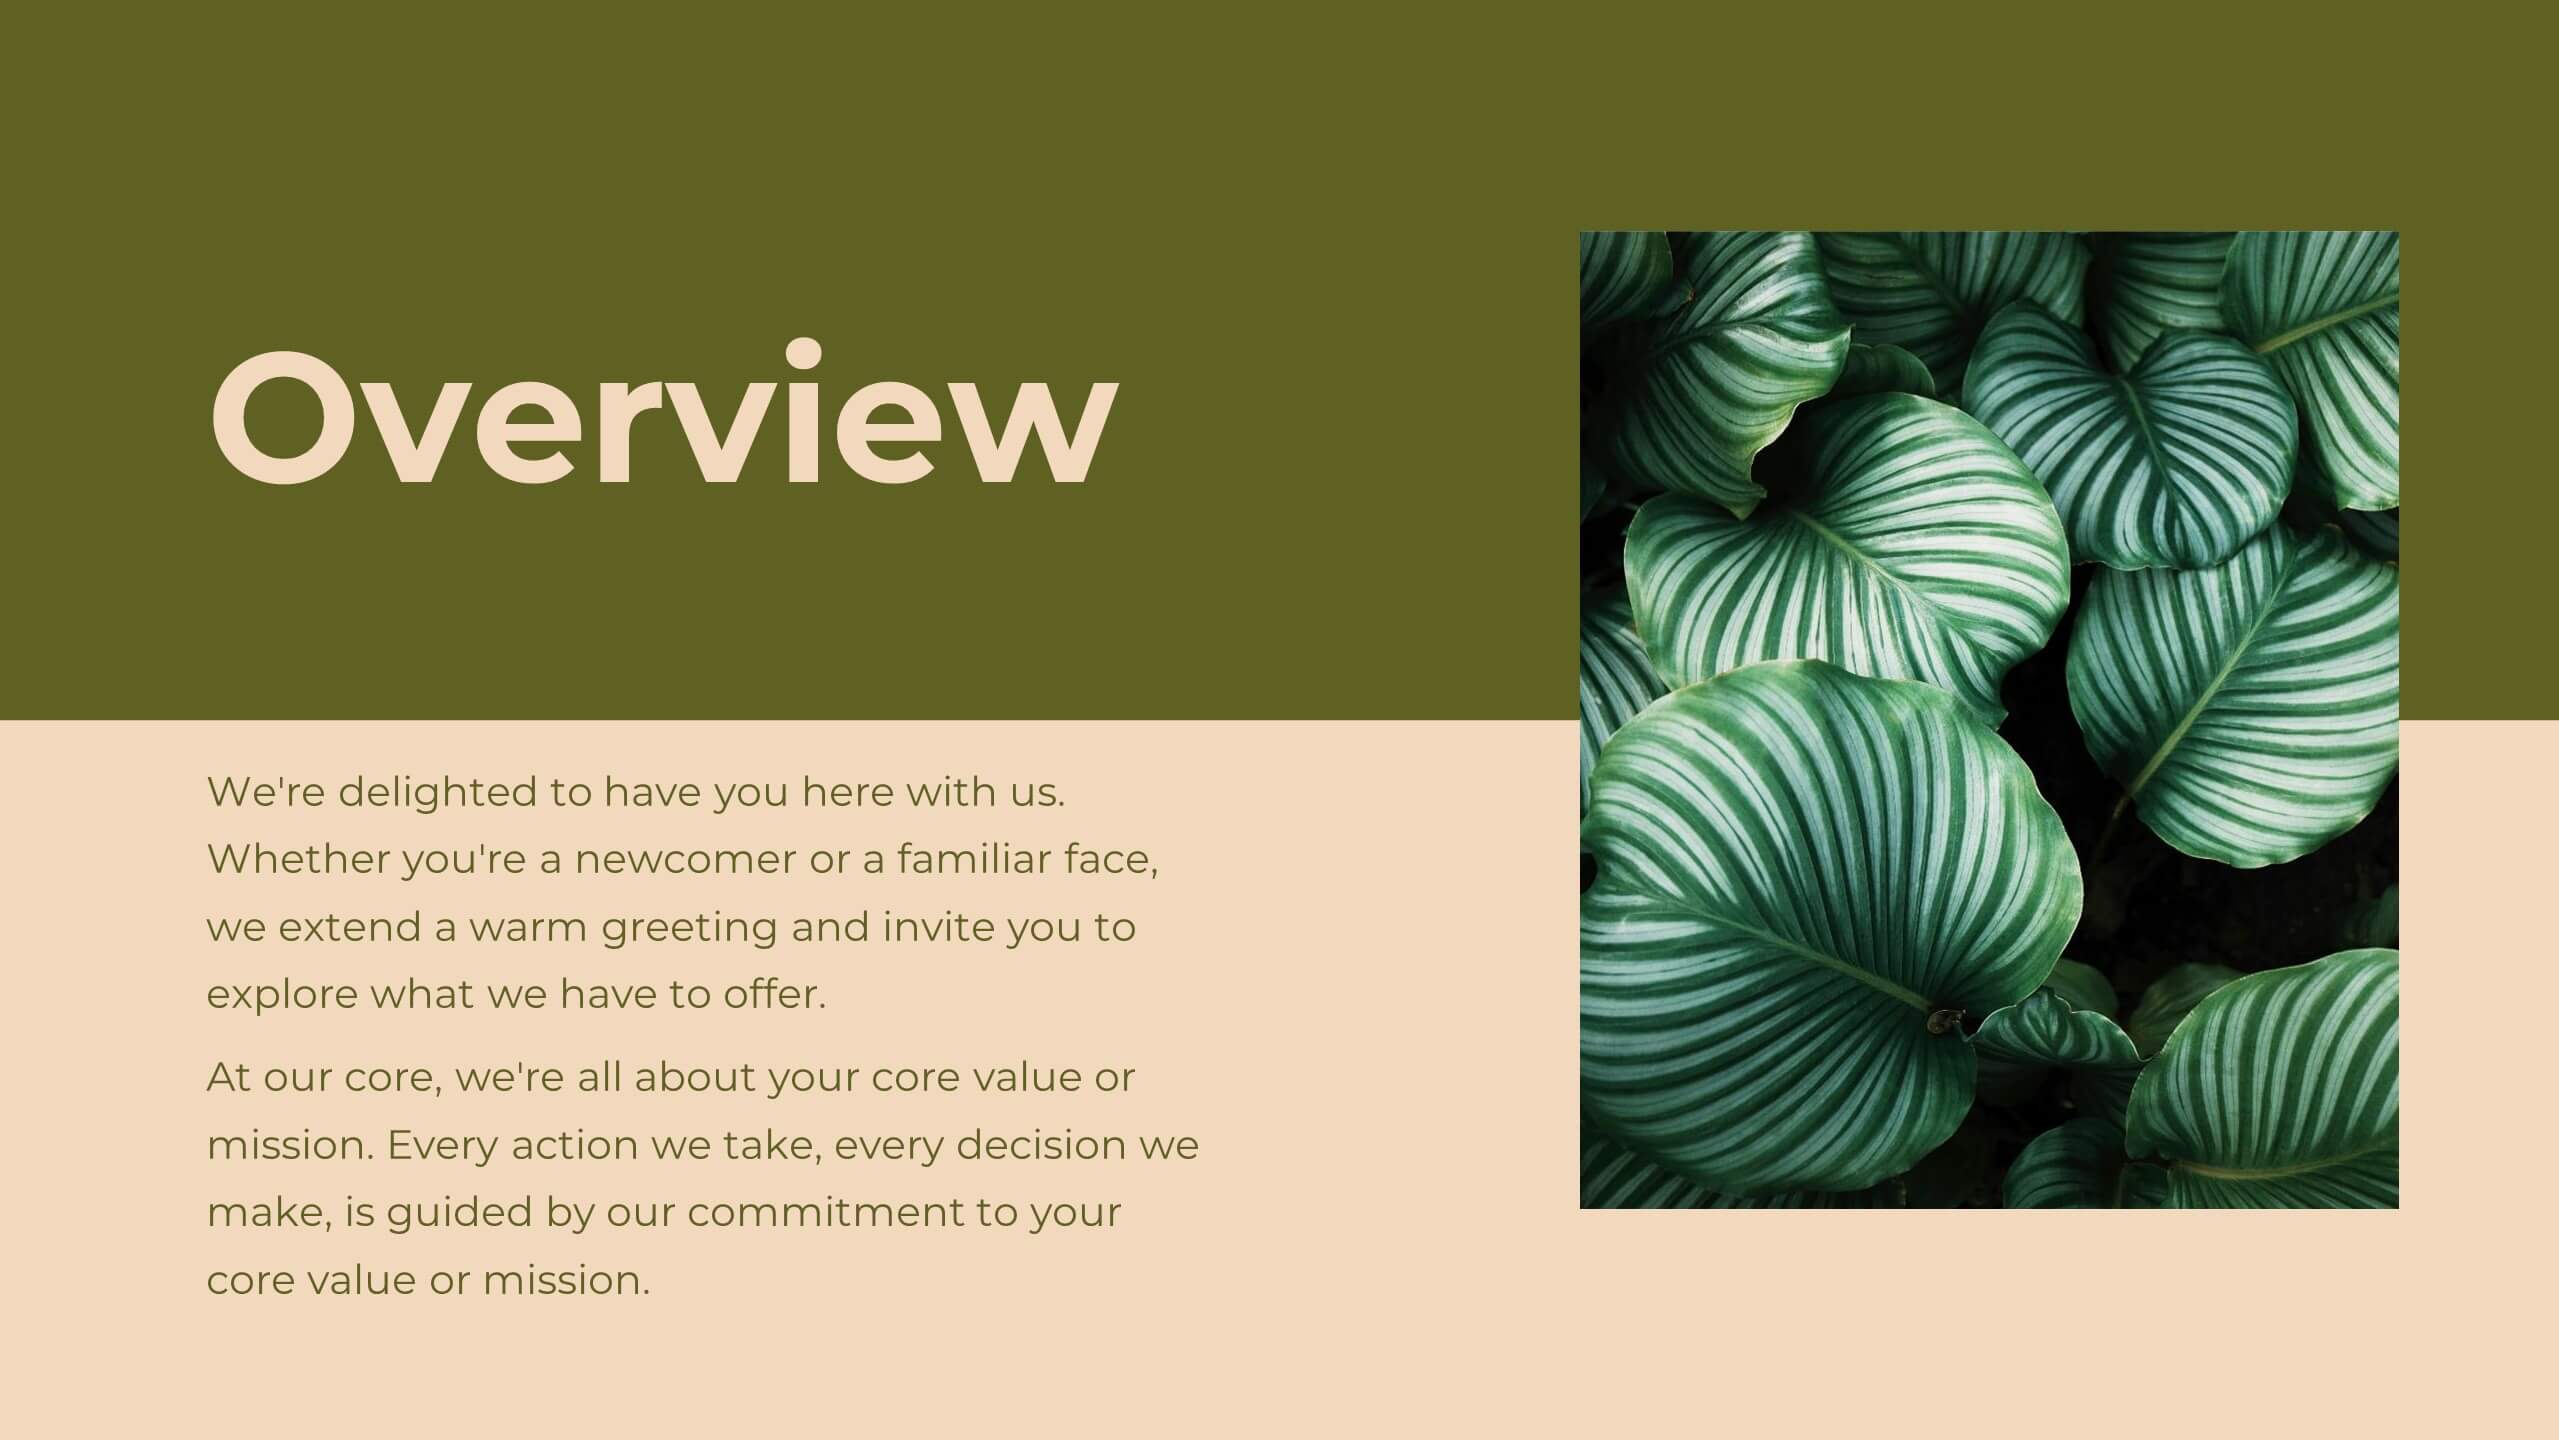
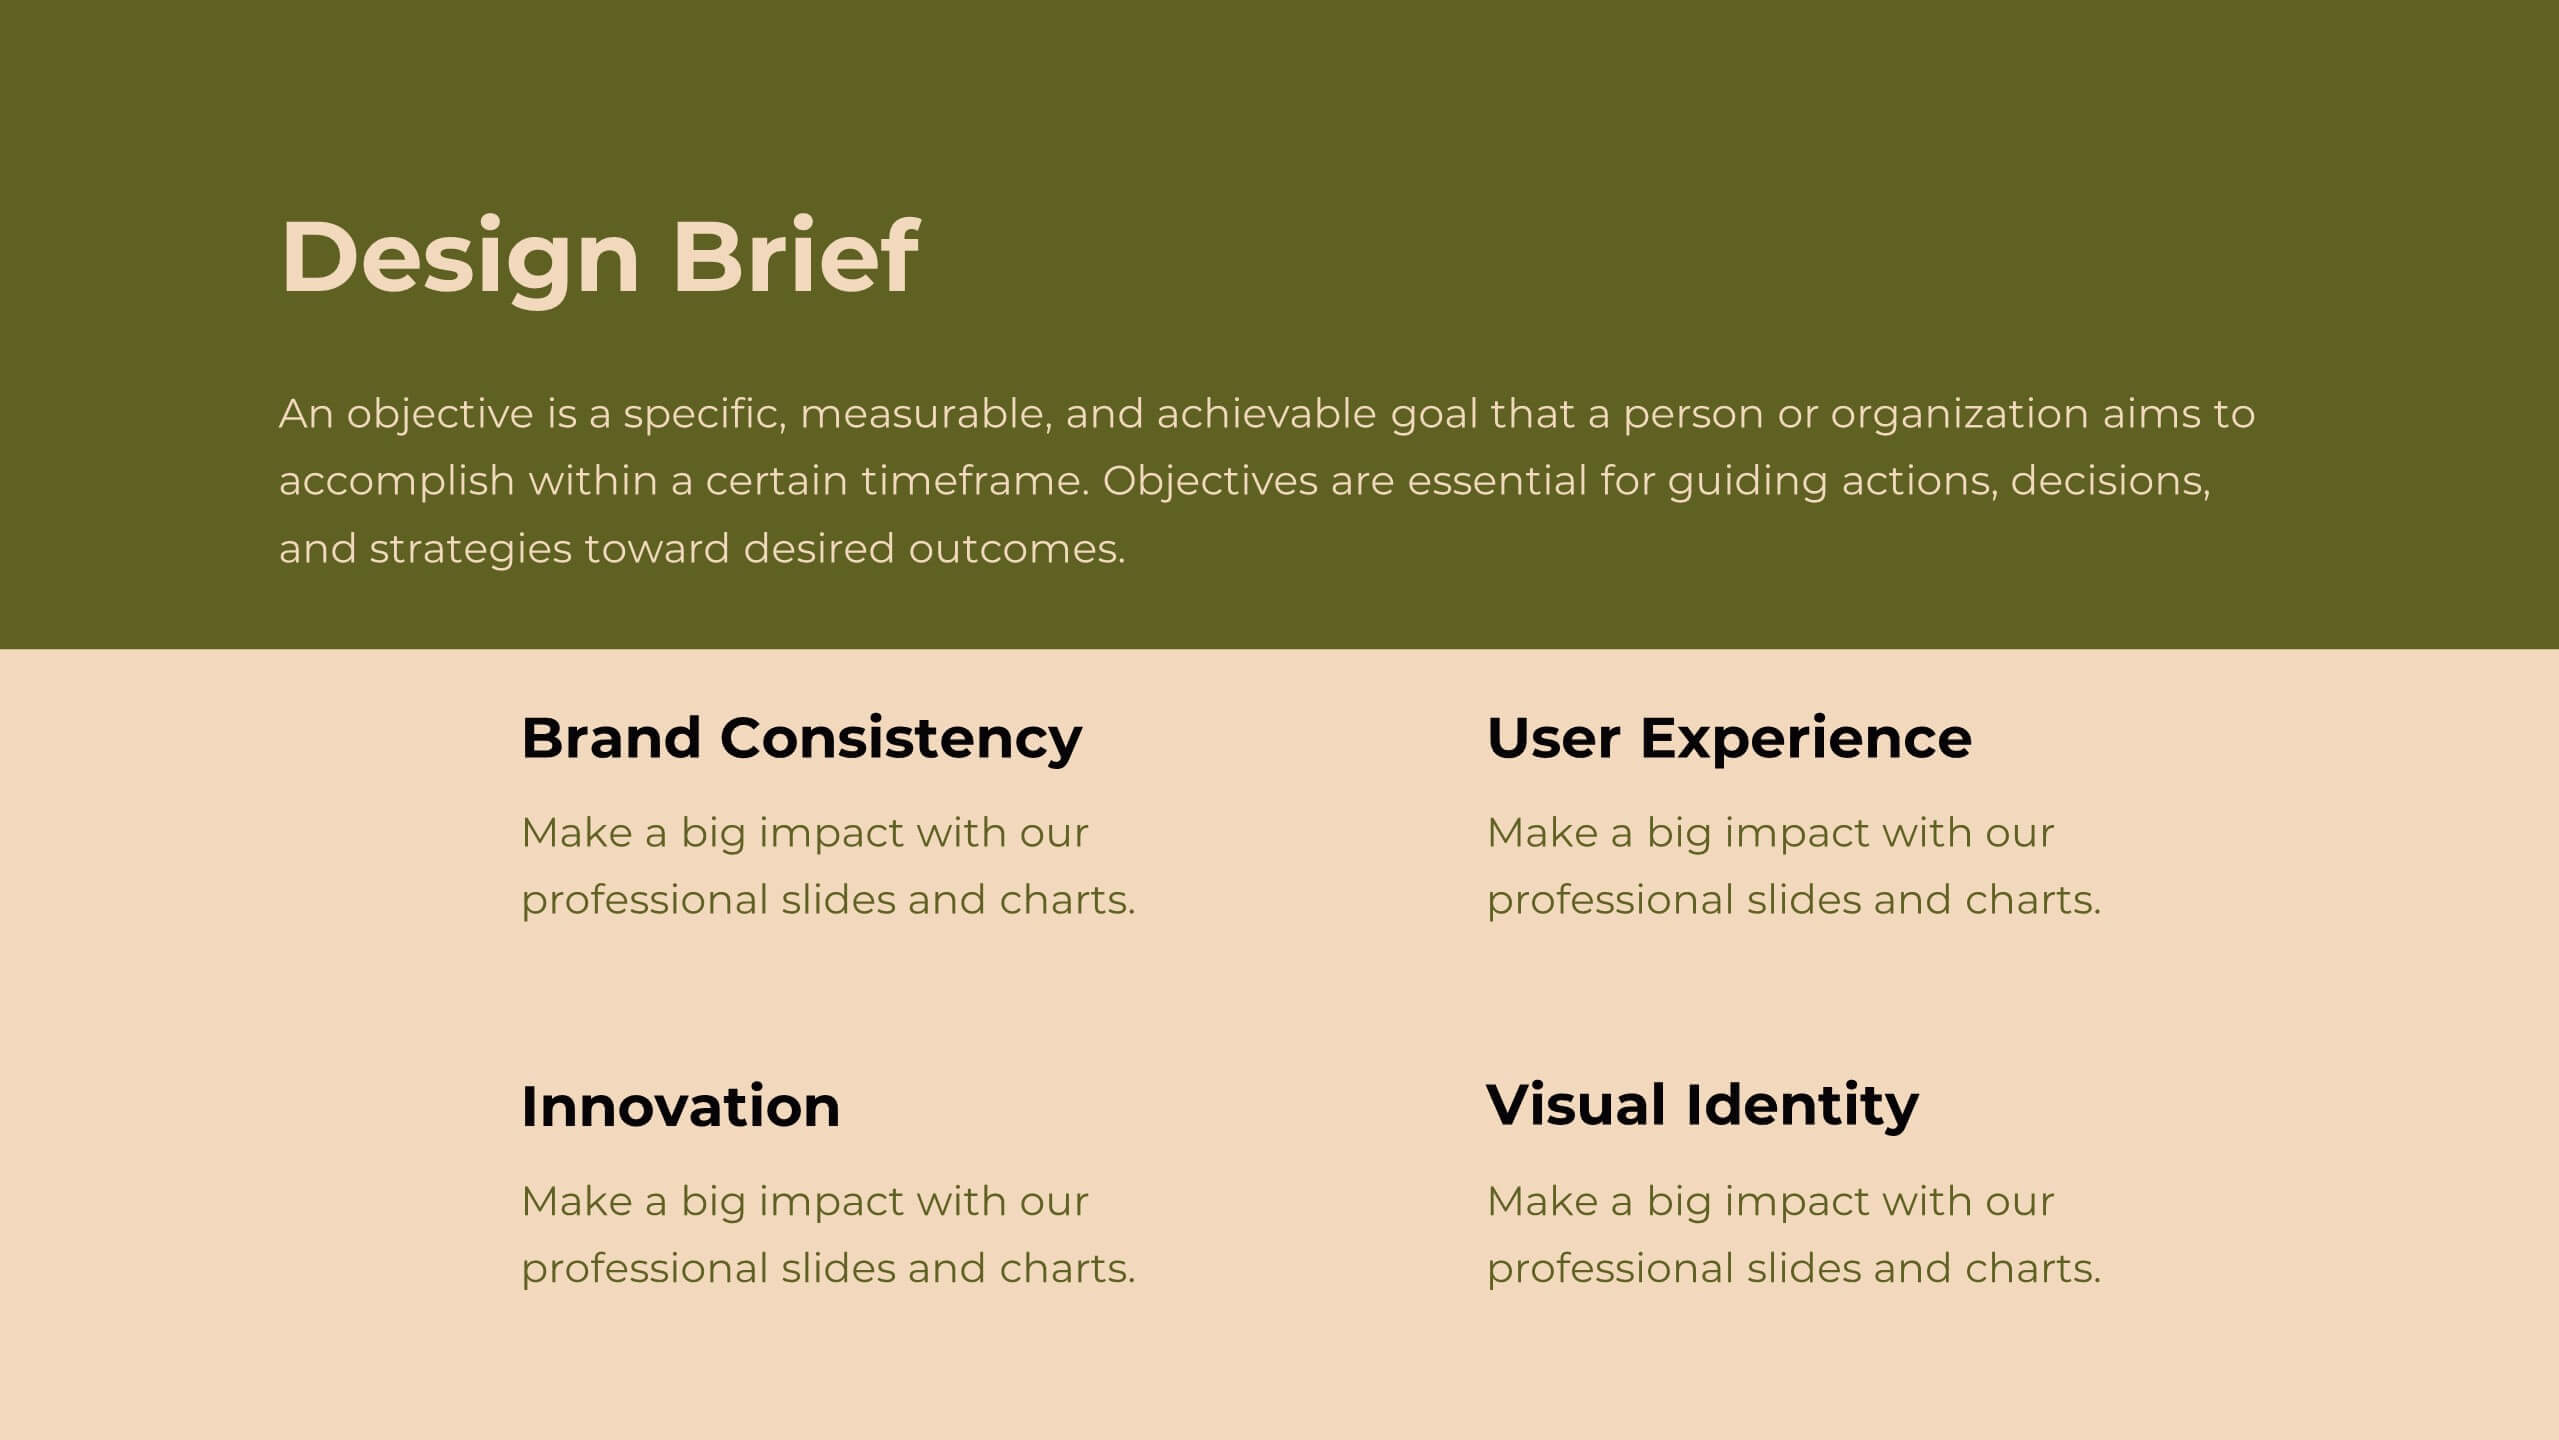
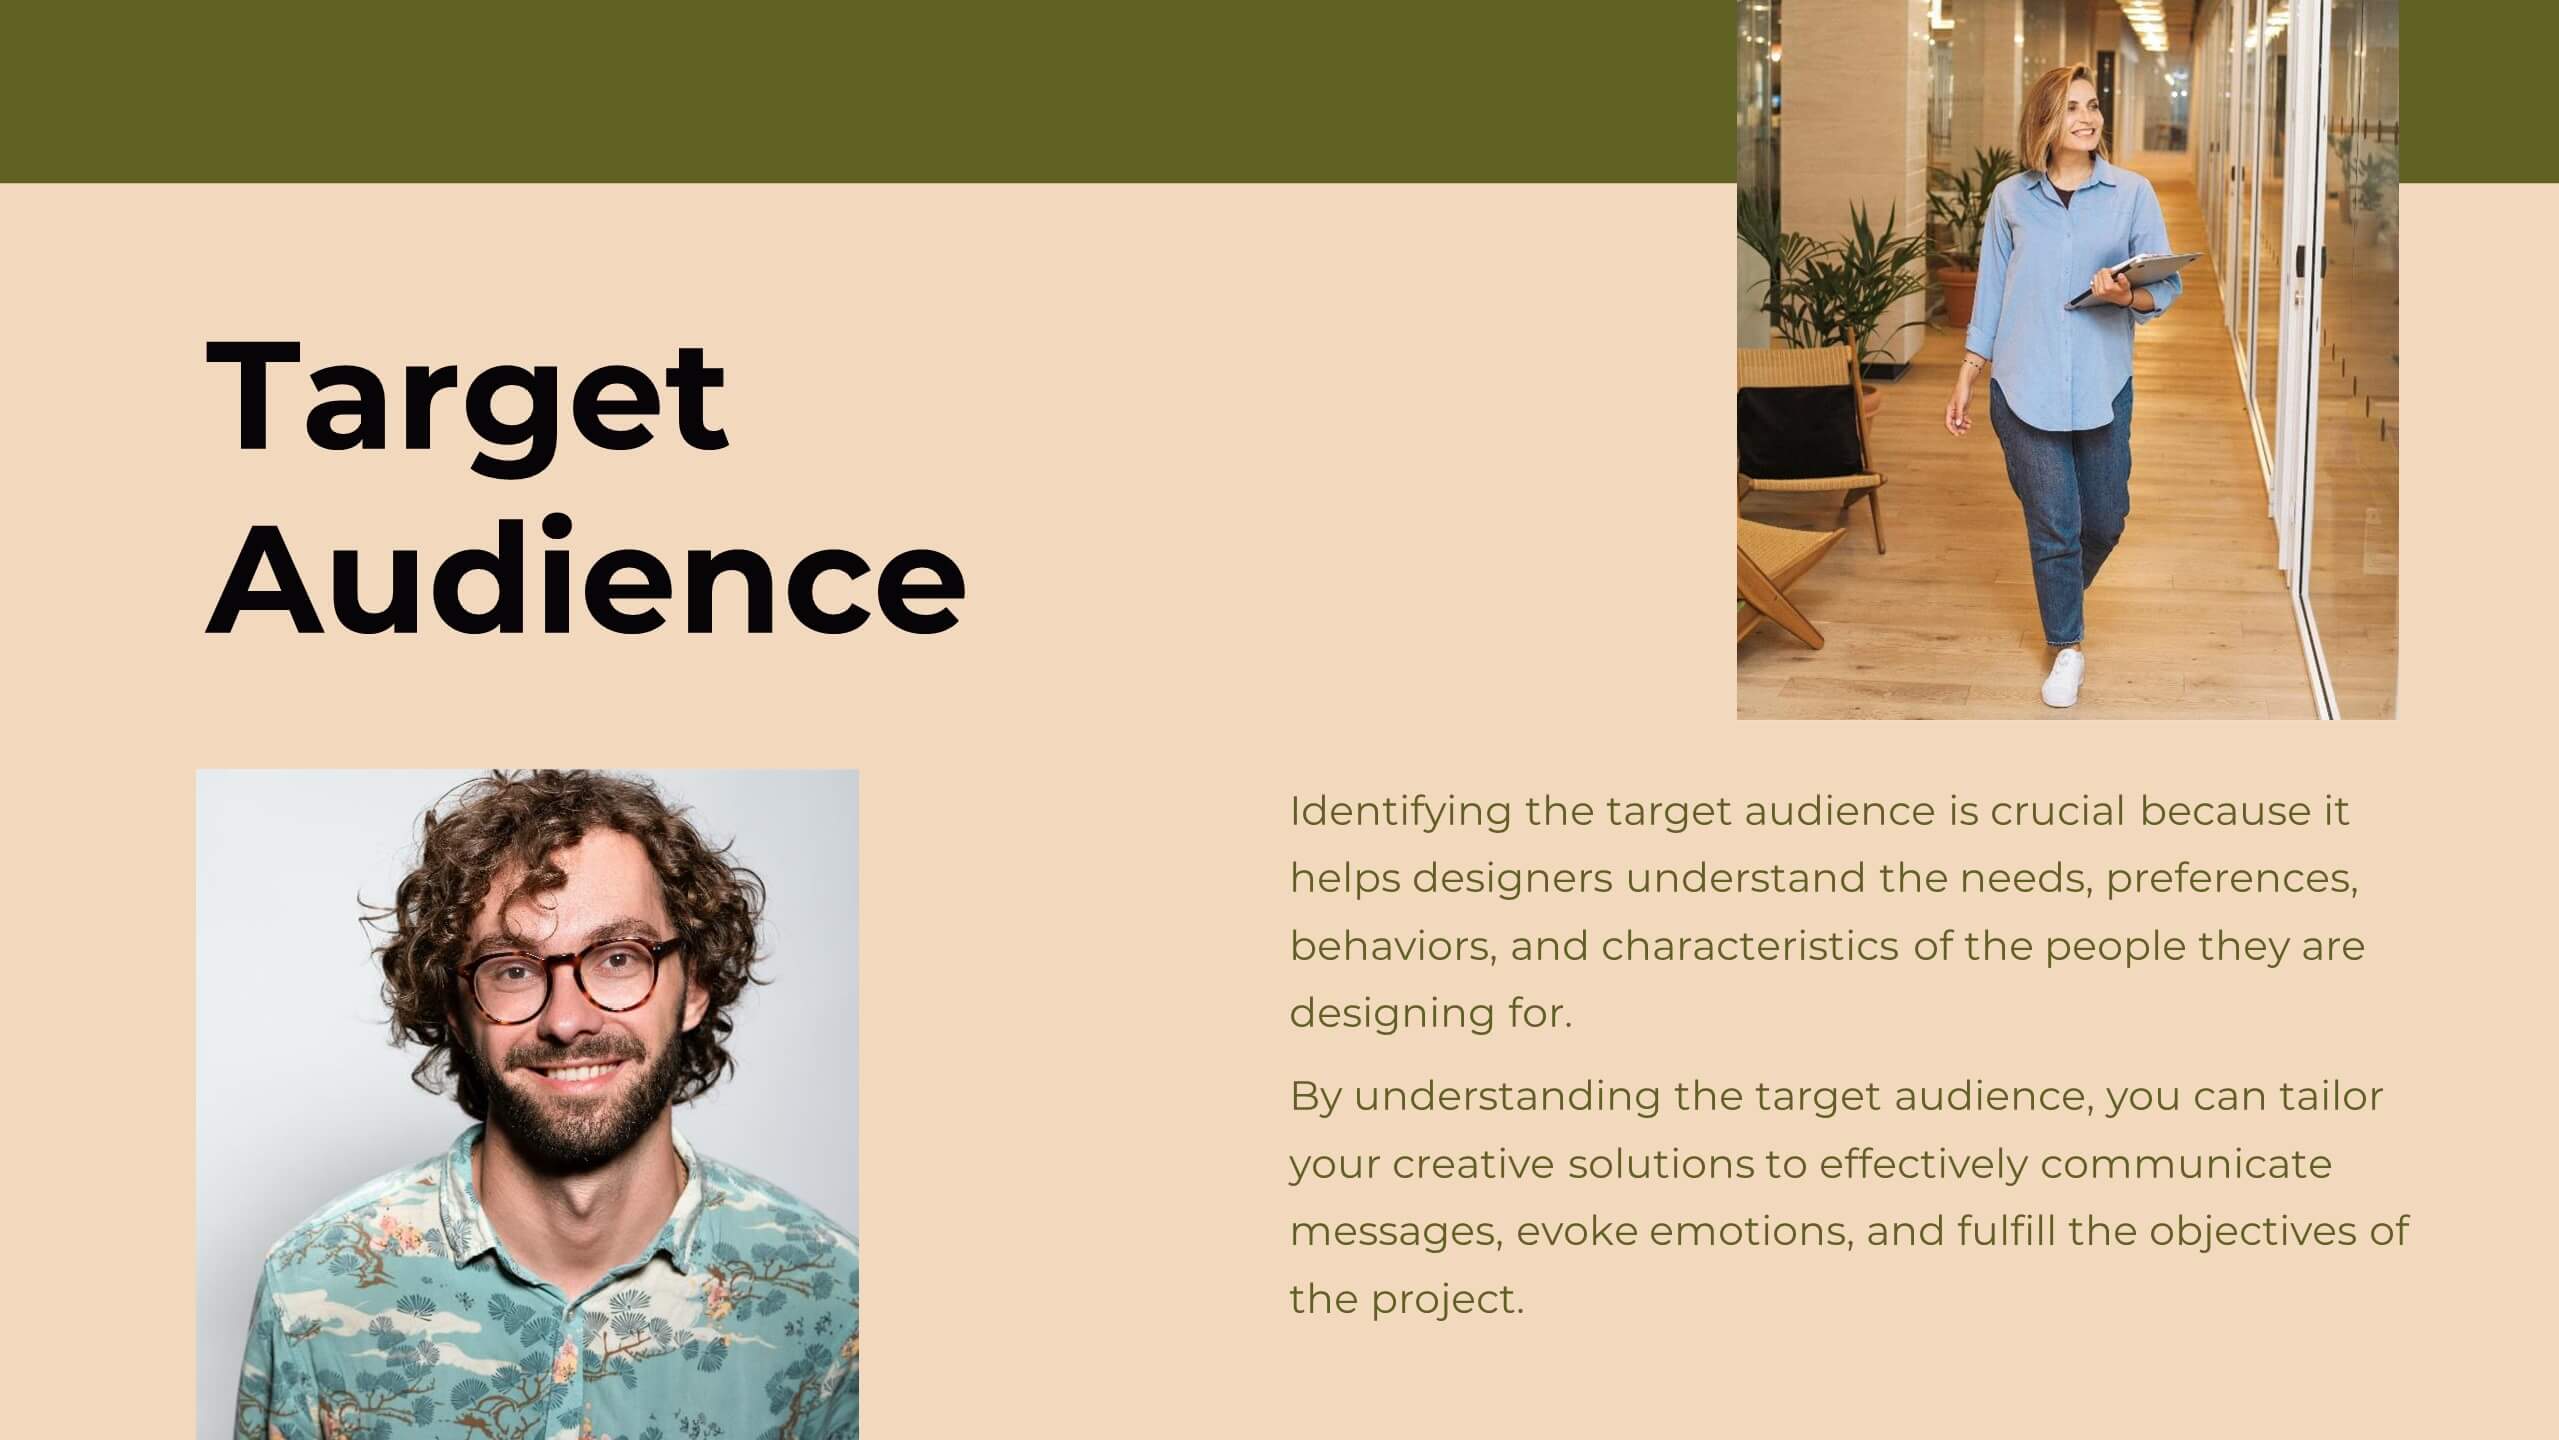
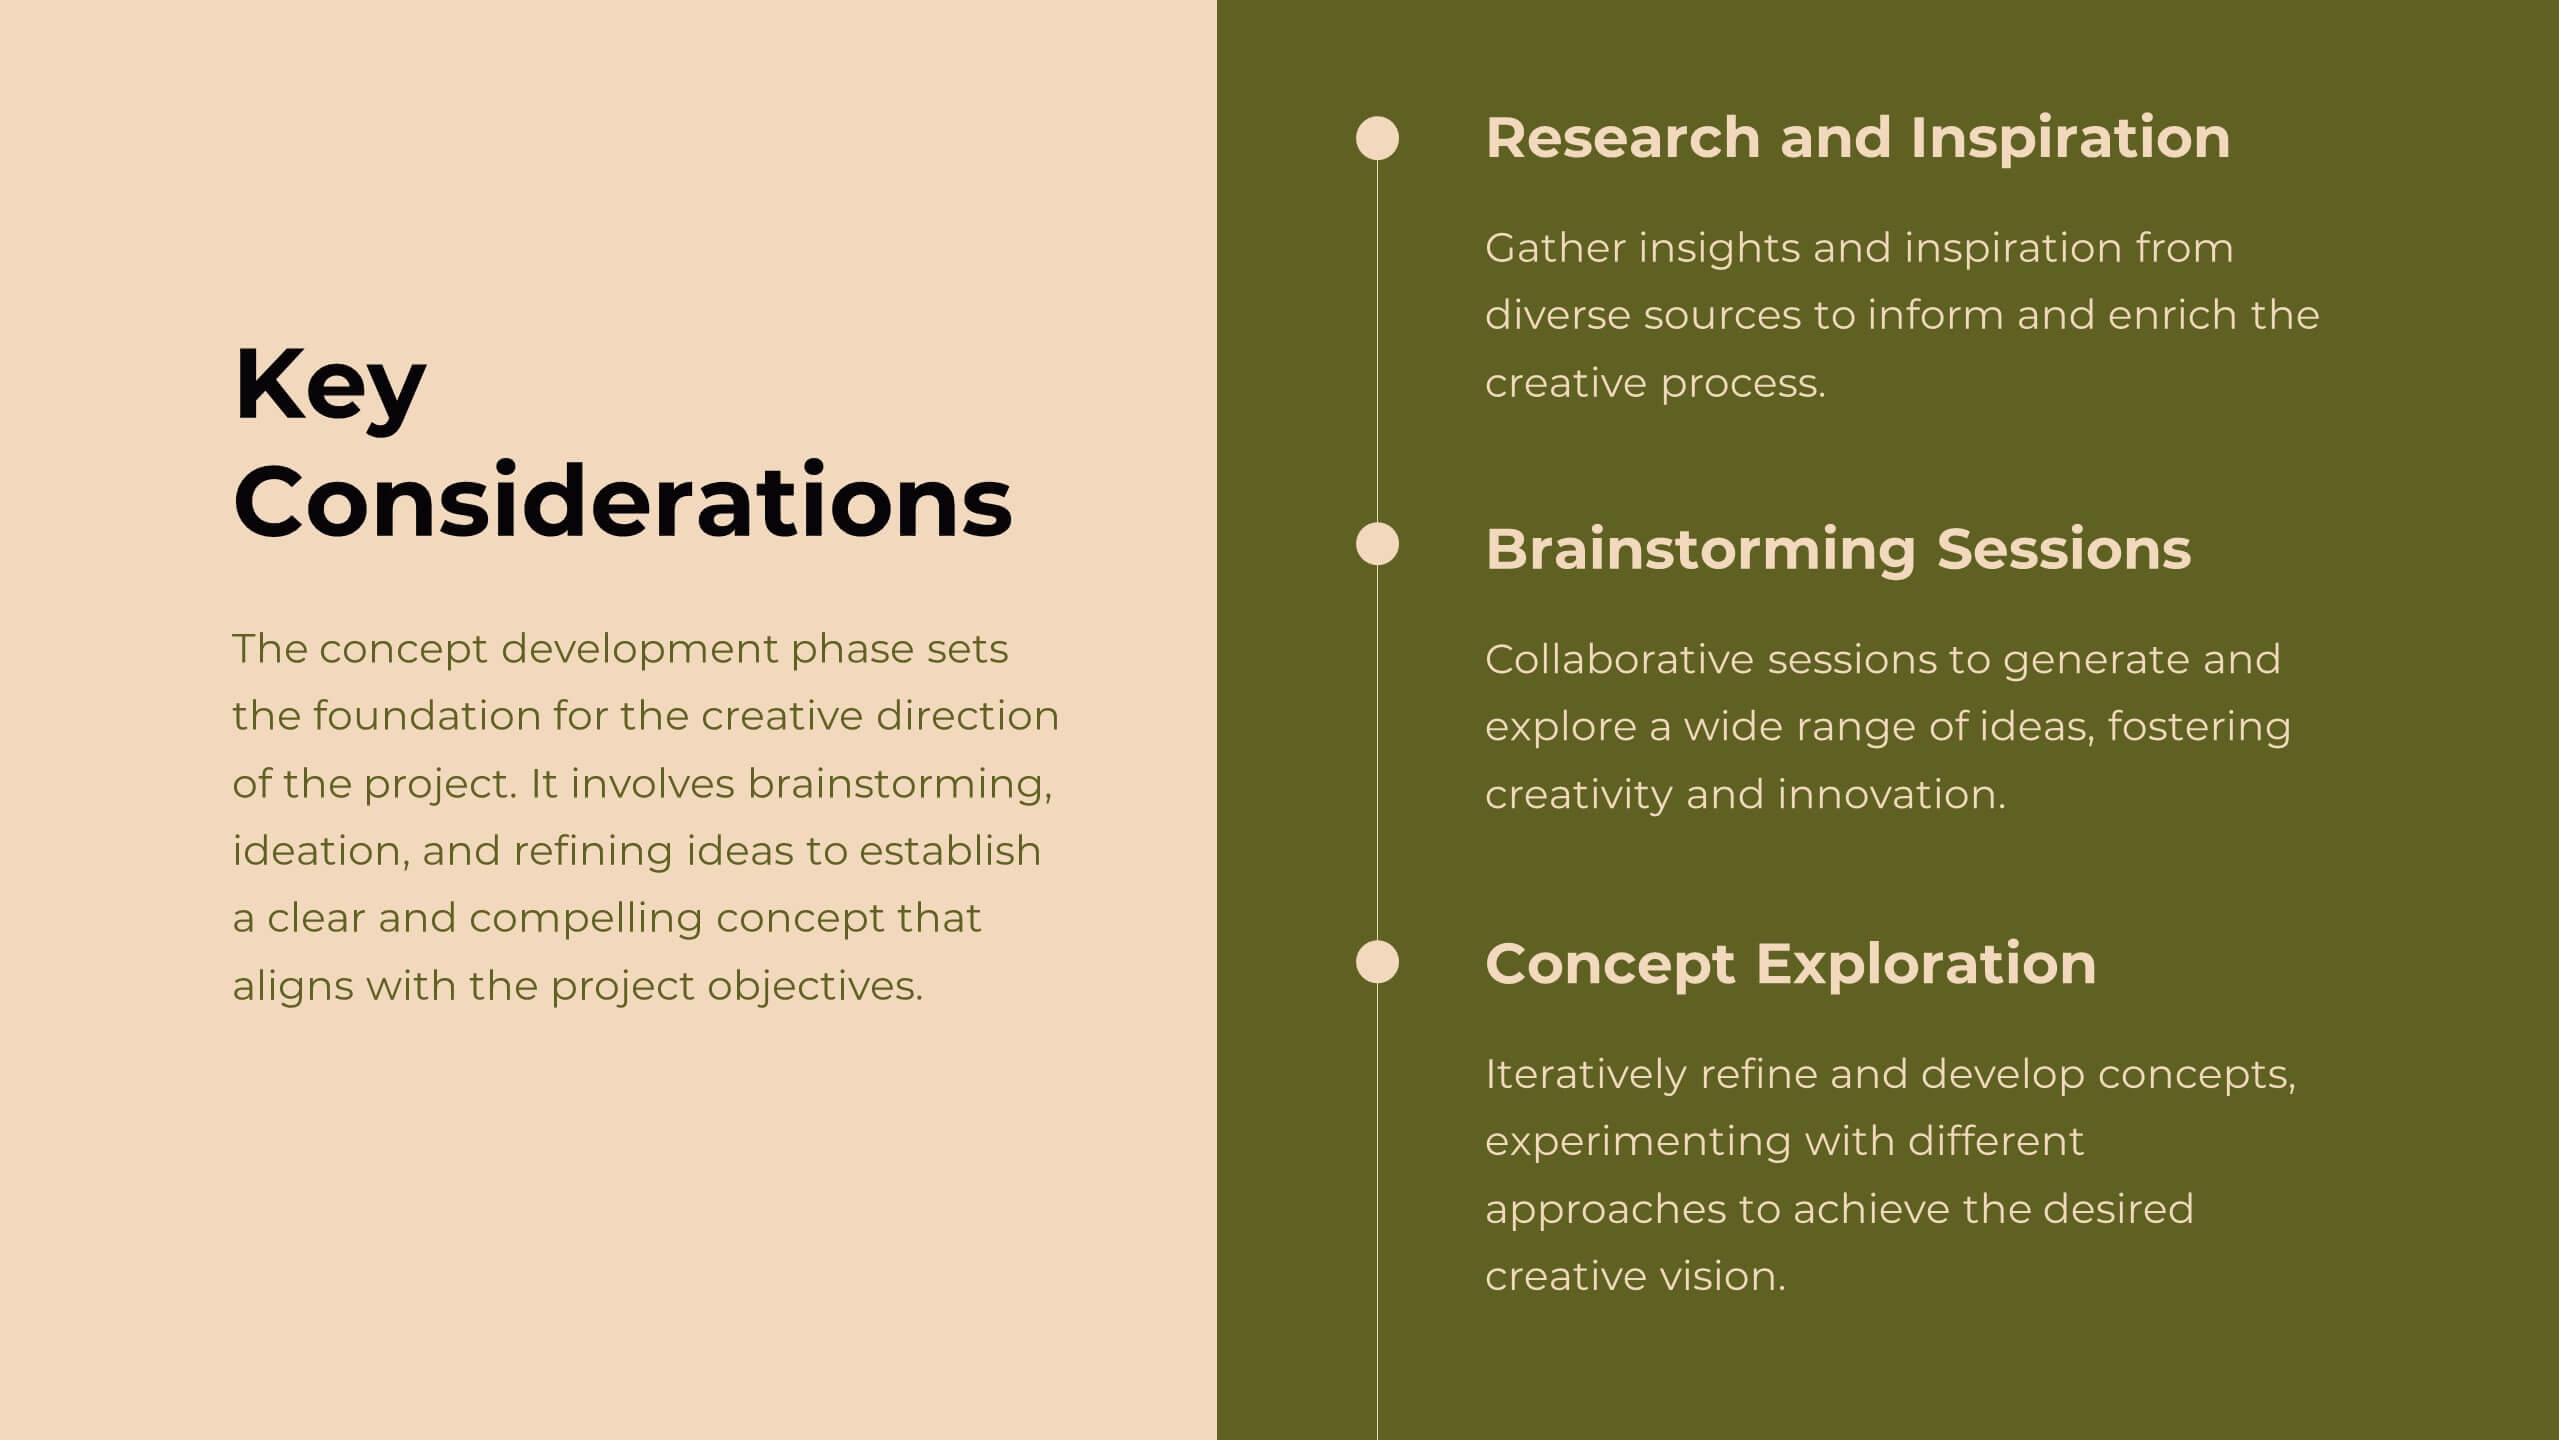
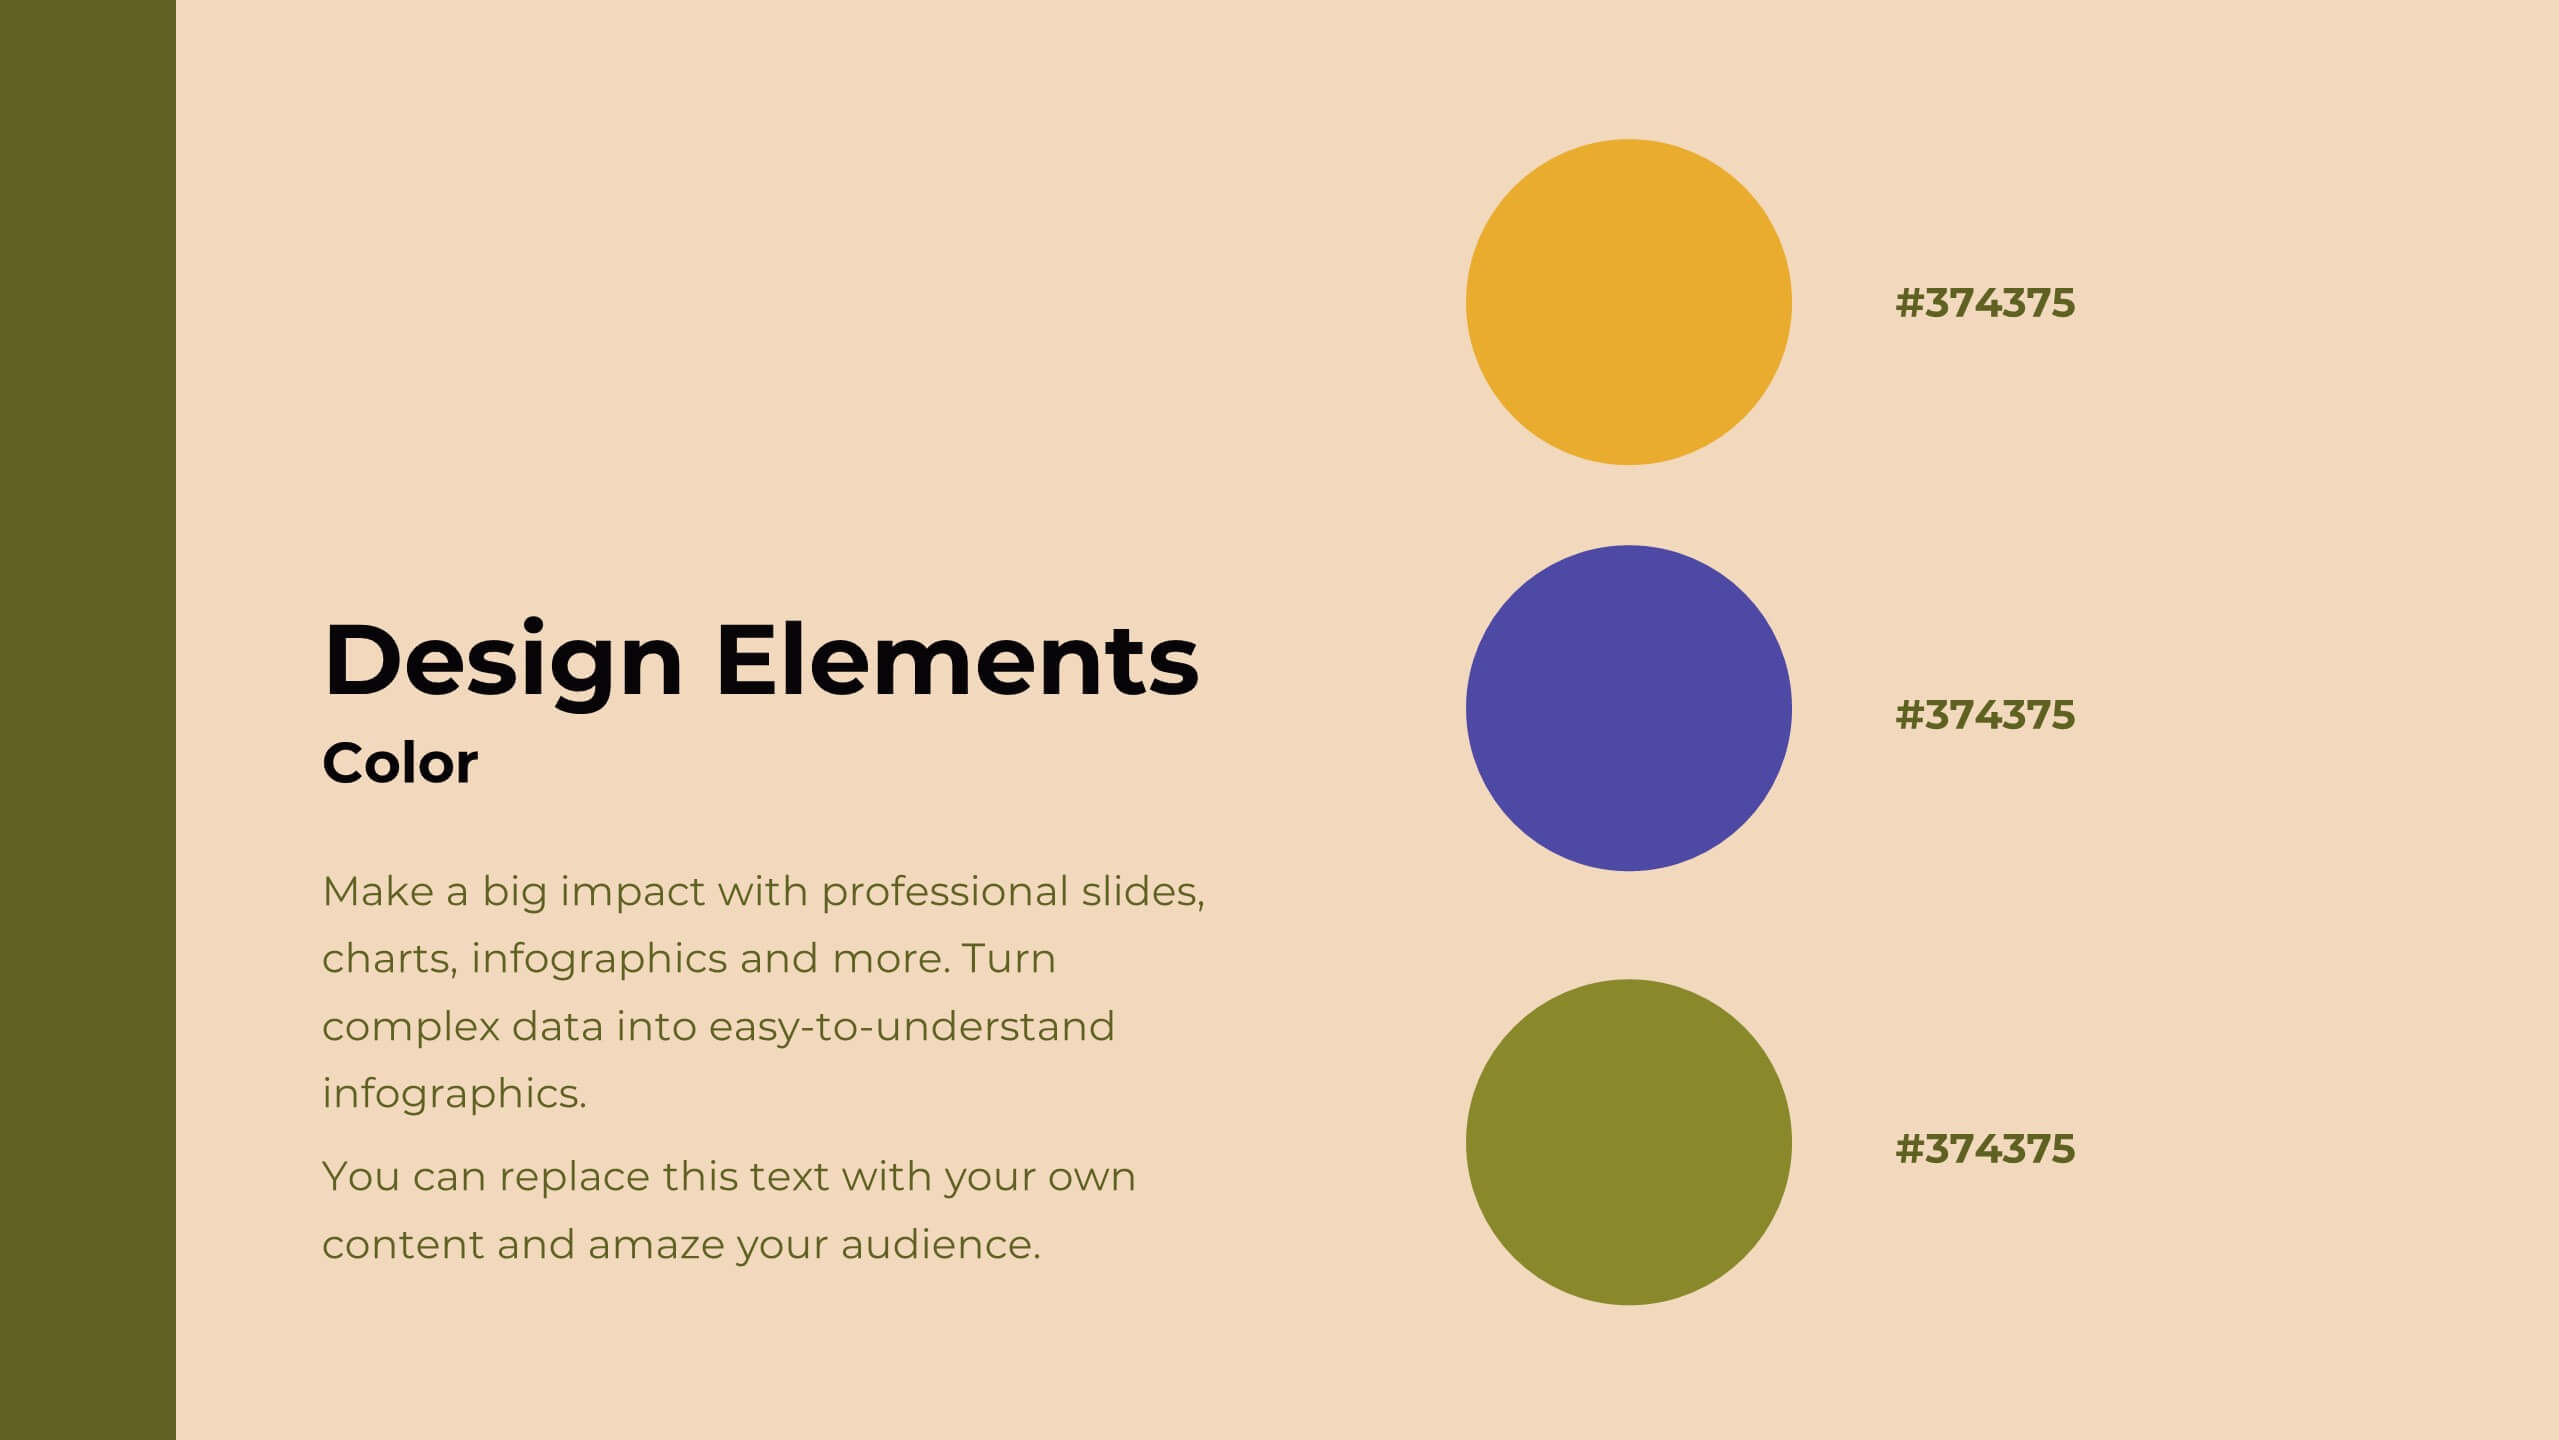
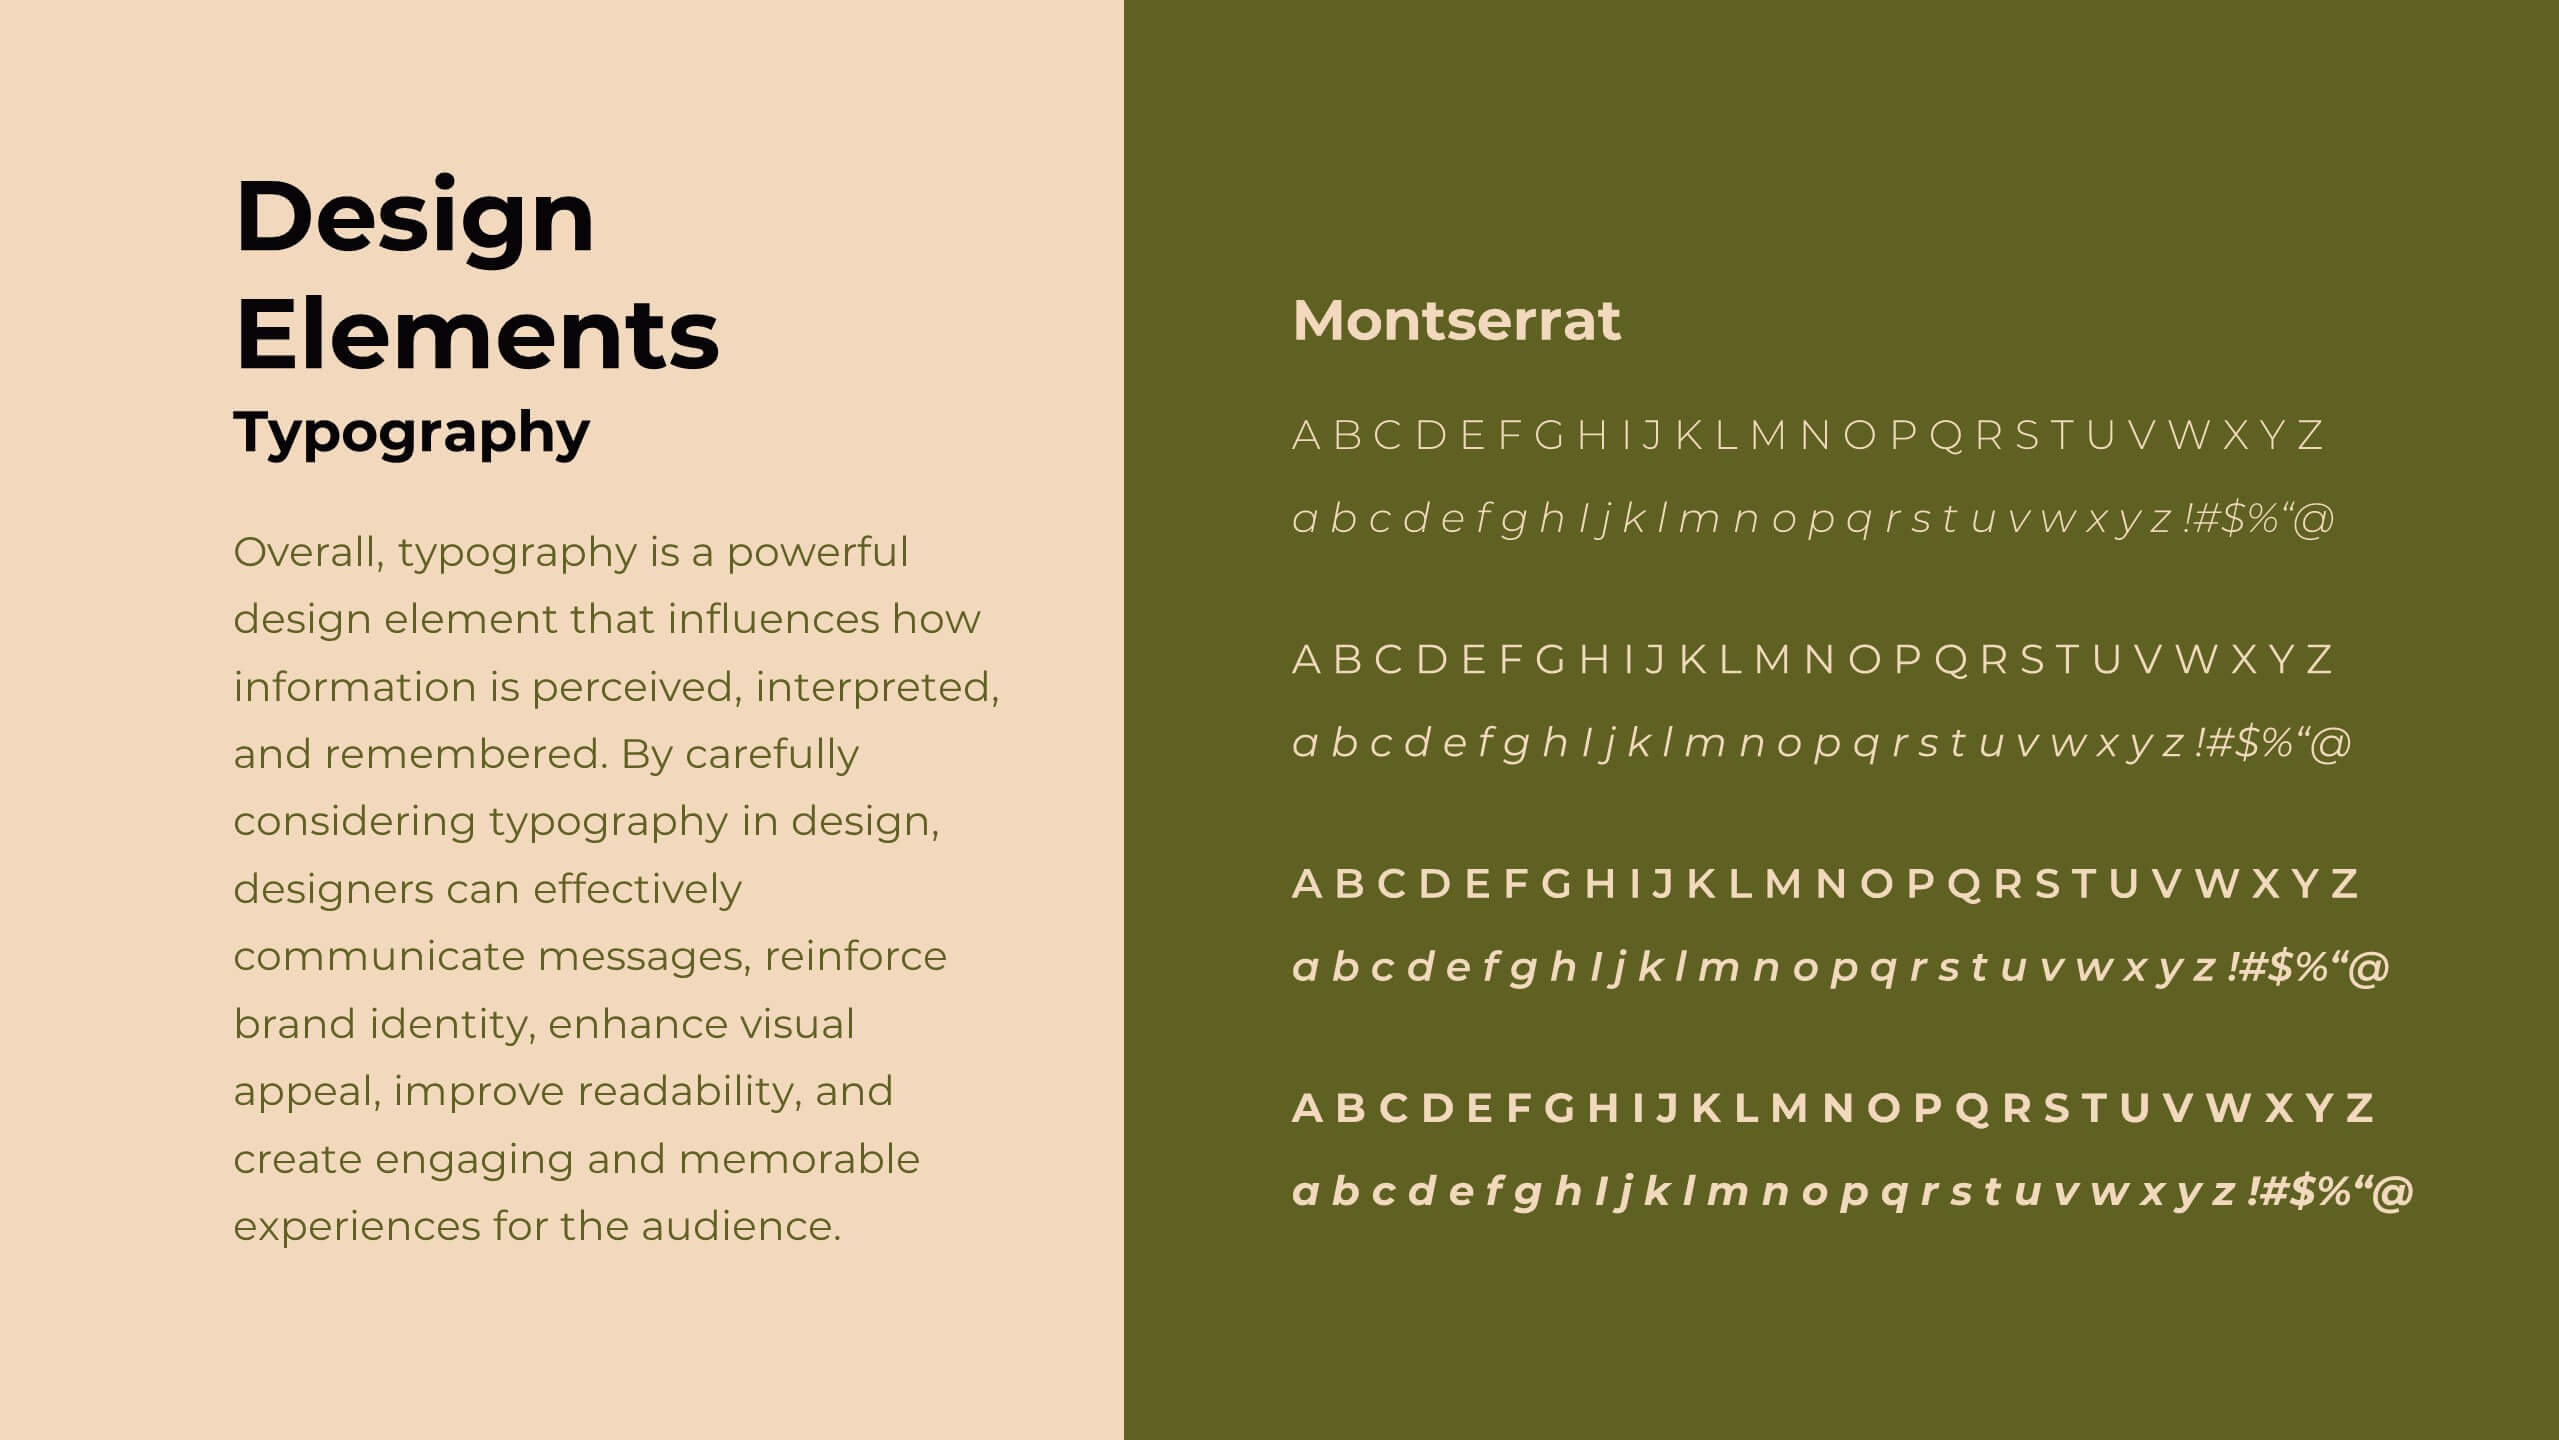
Delta Design Strategy Proposal Presentation
Transform your design strategy with this elegant proposal template! Perfect for presenting design briefs, target audience insights, and concept development. Ideal for designers and creative teams aiming to align vision and execution. Compatible with PowerPoint, Keynote, and Google Slides, this template ensures your design strategy is clear, professional, and compelling. Elevate your projects today!


6 diapositivas
Funding Request Project Proposal
Visually communicate your project's financial needs using this tiered Funding Request Project Proposal slide. With a stacked layout ideal for outlining budget categories or funding stages, it’s perfect for grant applications, investor decks, or internal pitches. Fully customizable in PowerPoint, Keynote, and Google Slides.


8 diapositivas
Revenue Projection and Expense Planning Presentation
Simplify your financial forecasting with our Revenue Projection and Expense Planning template. This intuitive tool is designed for effectively mapping out revenue streams and budget allocations, making it easier to visualize and manage financial goals. Ideal for businesses and finance professionals, it's compatible with PowerPoint, Keynote, and Google Slides, ensuring seamless integration into any presentation workflow.


26 diapositivas
Green Business Initiatives Presentation
Lead the charge in sustainability with our Green Business Initiatives presentation template. This eco-friendly template, fully compatible with PowerPoint, Keynote, and Google Slides, is designed for forward-thinking professionals committed to environmental stewardship. Showcase your company's dedication to sustainability with slides that highlight green policies, sustainable practices, and the long-term benefits of eco-conscious operations. The template's customizable elements allow you to present your environmental initiatives with clarity and impact, ensuring your message resonates with your audience. Whether you're a green startup or an established corporation, our template is SEO-optimized to help you spread the word about your commitment to the planet. Engage stakeholders and encourage industry-wide change with a presentation that underscores the value of green business strategies.


6 diapositivas
McKinsey 7S Model Articles Infographics
Explore the seven critical elements that make up the McKinsey 7S Model, including Strategy, Structure, Systems, Shared Values, Skills, Style, and Staff. Each of these components plays a vital role in shaping your company's success. This infographic is compatible with popular presentation tools like PowerPoint, Keynote, and Google Slides, making it effortless to incorporate into your next business presentation. Unlock the secrets of organizational effectiveness with this concise and visually appealing resource. Enhance your understanding of the McKinsey 7S Model and supercharge your company's performance today. Get ready to transform your business strategy with this user-friendly infographic.


5 diapositivas
Dual Axis Butterfly Diagram Presentation
Give your data the spotlight it deserves with a modern layout designed for clarity and balance. This presentation is perfect for comparing two perspectives, processes, or variables side by side in a visually appealing way. Fully customizable and compatible with PowerPoint, Keynote, and Google Slides.


20 diapositivas
Feronia Marketing Proposal Presentation
Present your marketing strategy with this visually engaging proposal deck, featuring sections on objectives, methodology, budget breakdown, and client testimonials. Ideal for structured presentations, it’s compatible with PowerPoint, Keynote, and Google Slides, offering a flexible format to captivate and convince clients or stakeholders.


6 diapositivas
Tree Diagram for Process Mapping
Visualize workflows with clarity using this Tree Diagram slide. Designed to map six key process steps branching from a central trunk, it's ideal for illustrating strategic plans, organizational flows, or project lifecycles. Fully editable in PowerPoint, Keynote, and Google Slides for cross-platform flexibility.


7 diapositivas
E-Learning System Infographic
E-Learning, short for electronic learning, refers to a learning system or educational approach that utilizes electronic technology, particularly the internet and digital devices, to deliver educational content and facilitate learning. This infographic template is crafted to guide and inspire educators, learners, and e-learning enthusiasts alike. Explore the facets that make up a successful e-learning ecosystem, providing a roadmap for seamless digital education delivery. Compatible with Powerpoint, Keynote, and Google Slides. This infographic is your guide to navigating the digital educational landscape.


6 diapositivas
Business Logic Flow Chart
Streamline complex processes with the Business Logic Flow Chart Presentation. This modern, curved connector design helps you visually outline up to five sequential steps or logic paths, using colorful icons and editable text fields. Ideal for business workflows, strategic plans, or data flow maps. Fully compatible with PowerPoint, Keynote, and Google Slides.