


Características


¿Tienes alguna pregunta?
Recomendar


7 diapositivas
Cloud Architecture Infographic
Cloud technology is reshaping the digital landscape, and understanding its architecture is paramount. Dive into the intricacies of cloud systems with our cloud architecture infographic, crafted in a crisp white and serene blue palette. This visual tool demystifies the layers and components that constitute cloud frameworks. IT professionals, enterprise architects, and business decision-makers will greatly benefit from this structured depiction. Fully tailored for a smooth experience on PowerPoint, Keynote, and Google Slides, this infographic serves as a cornerstone for all looking to harness the potentials of cloud infrastructure.

23 diapositivas
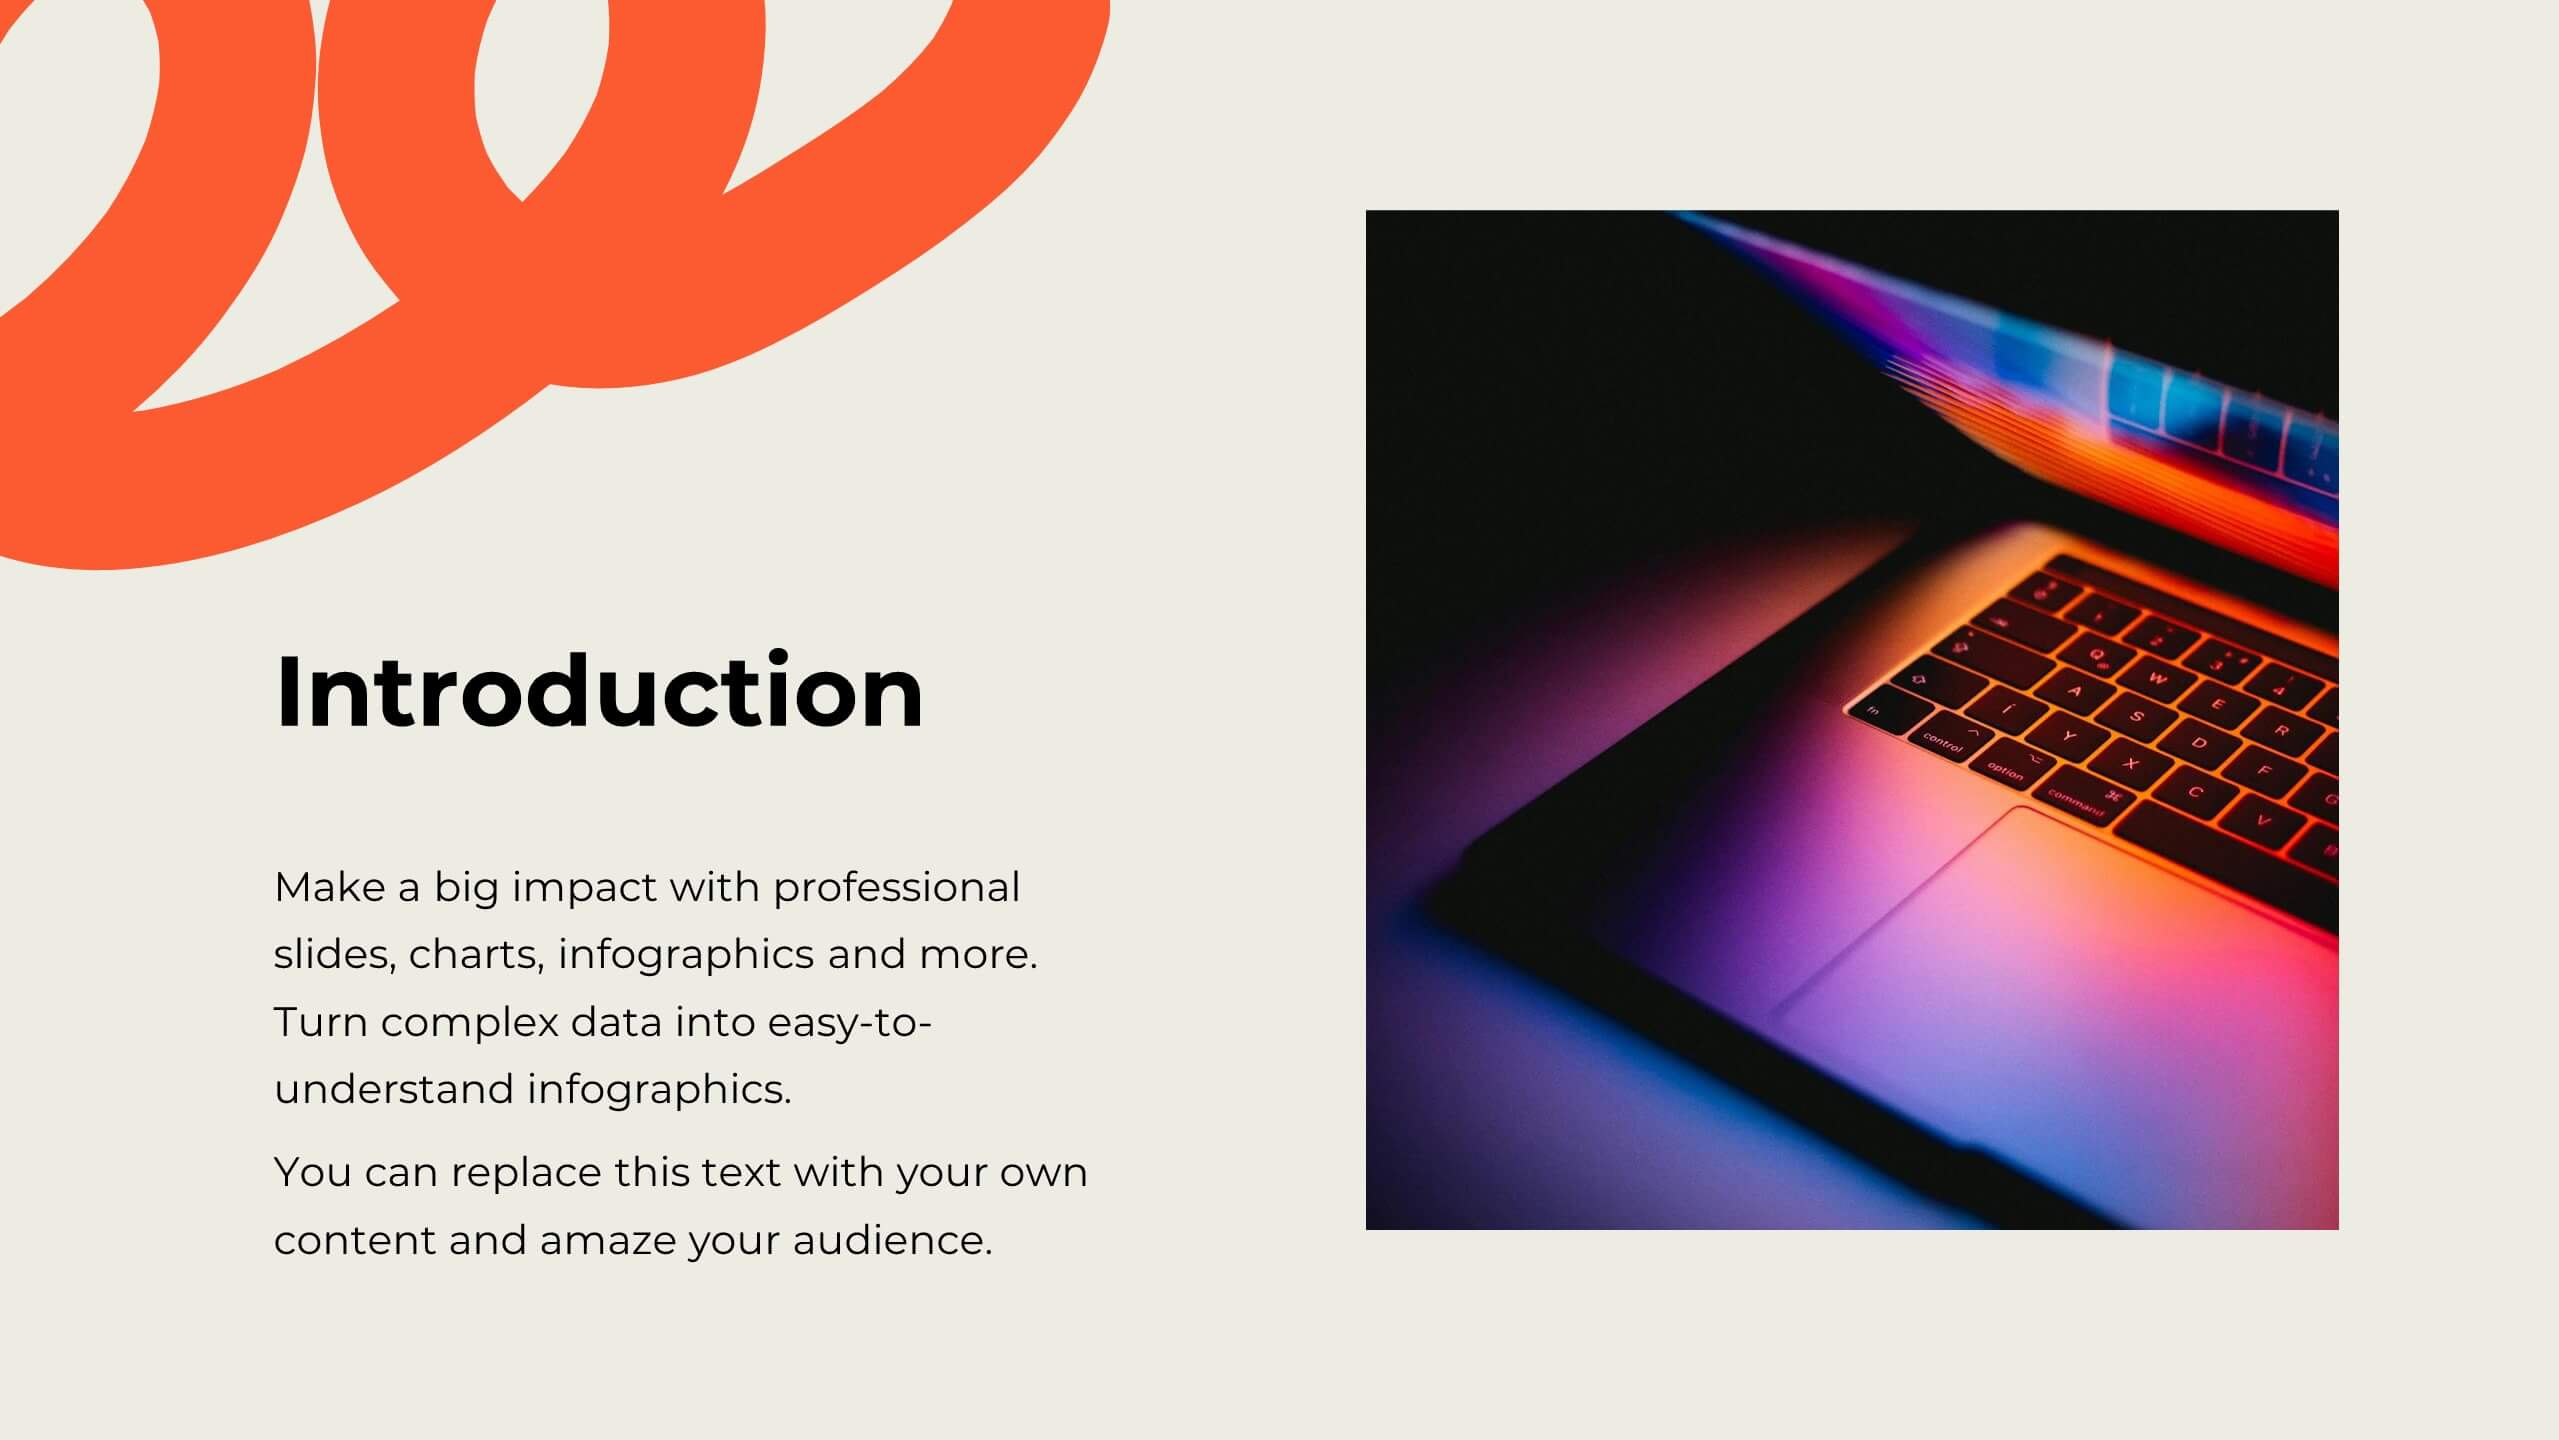
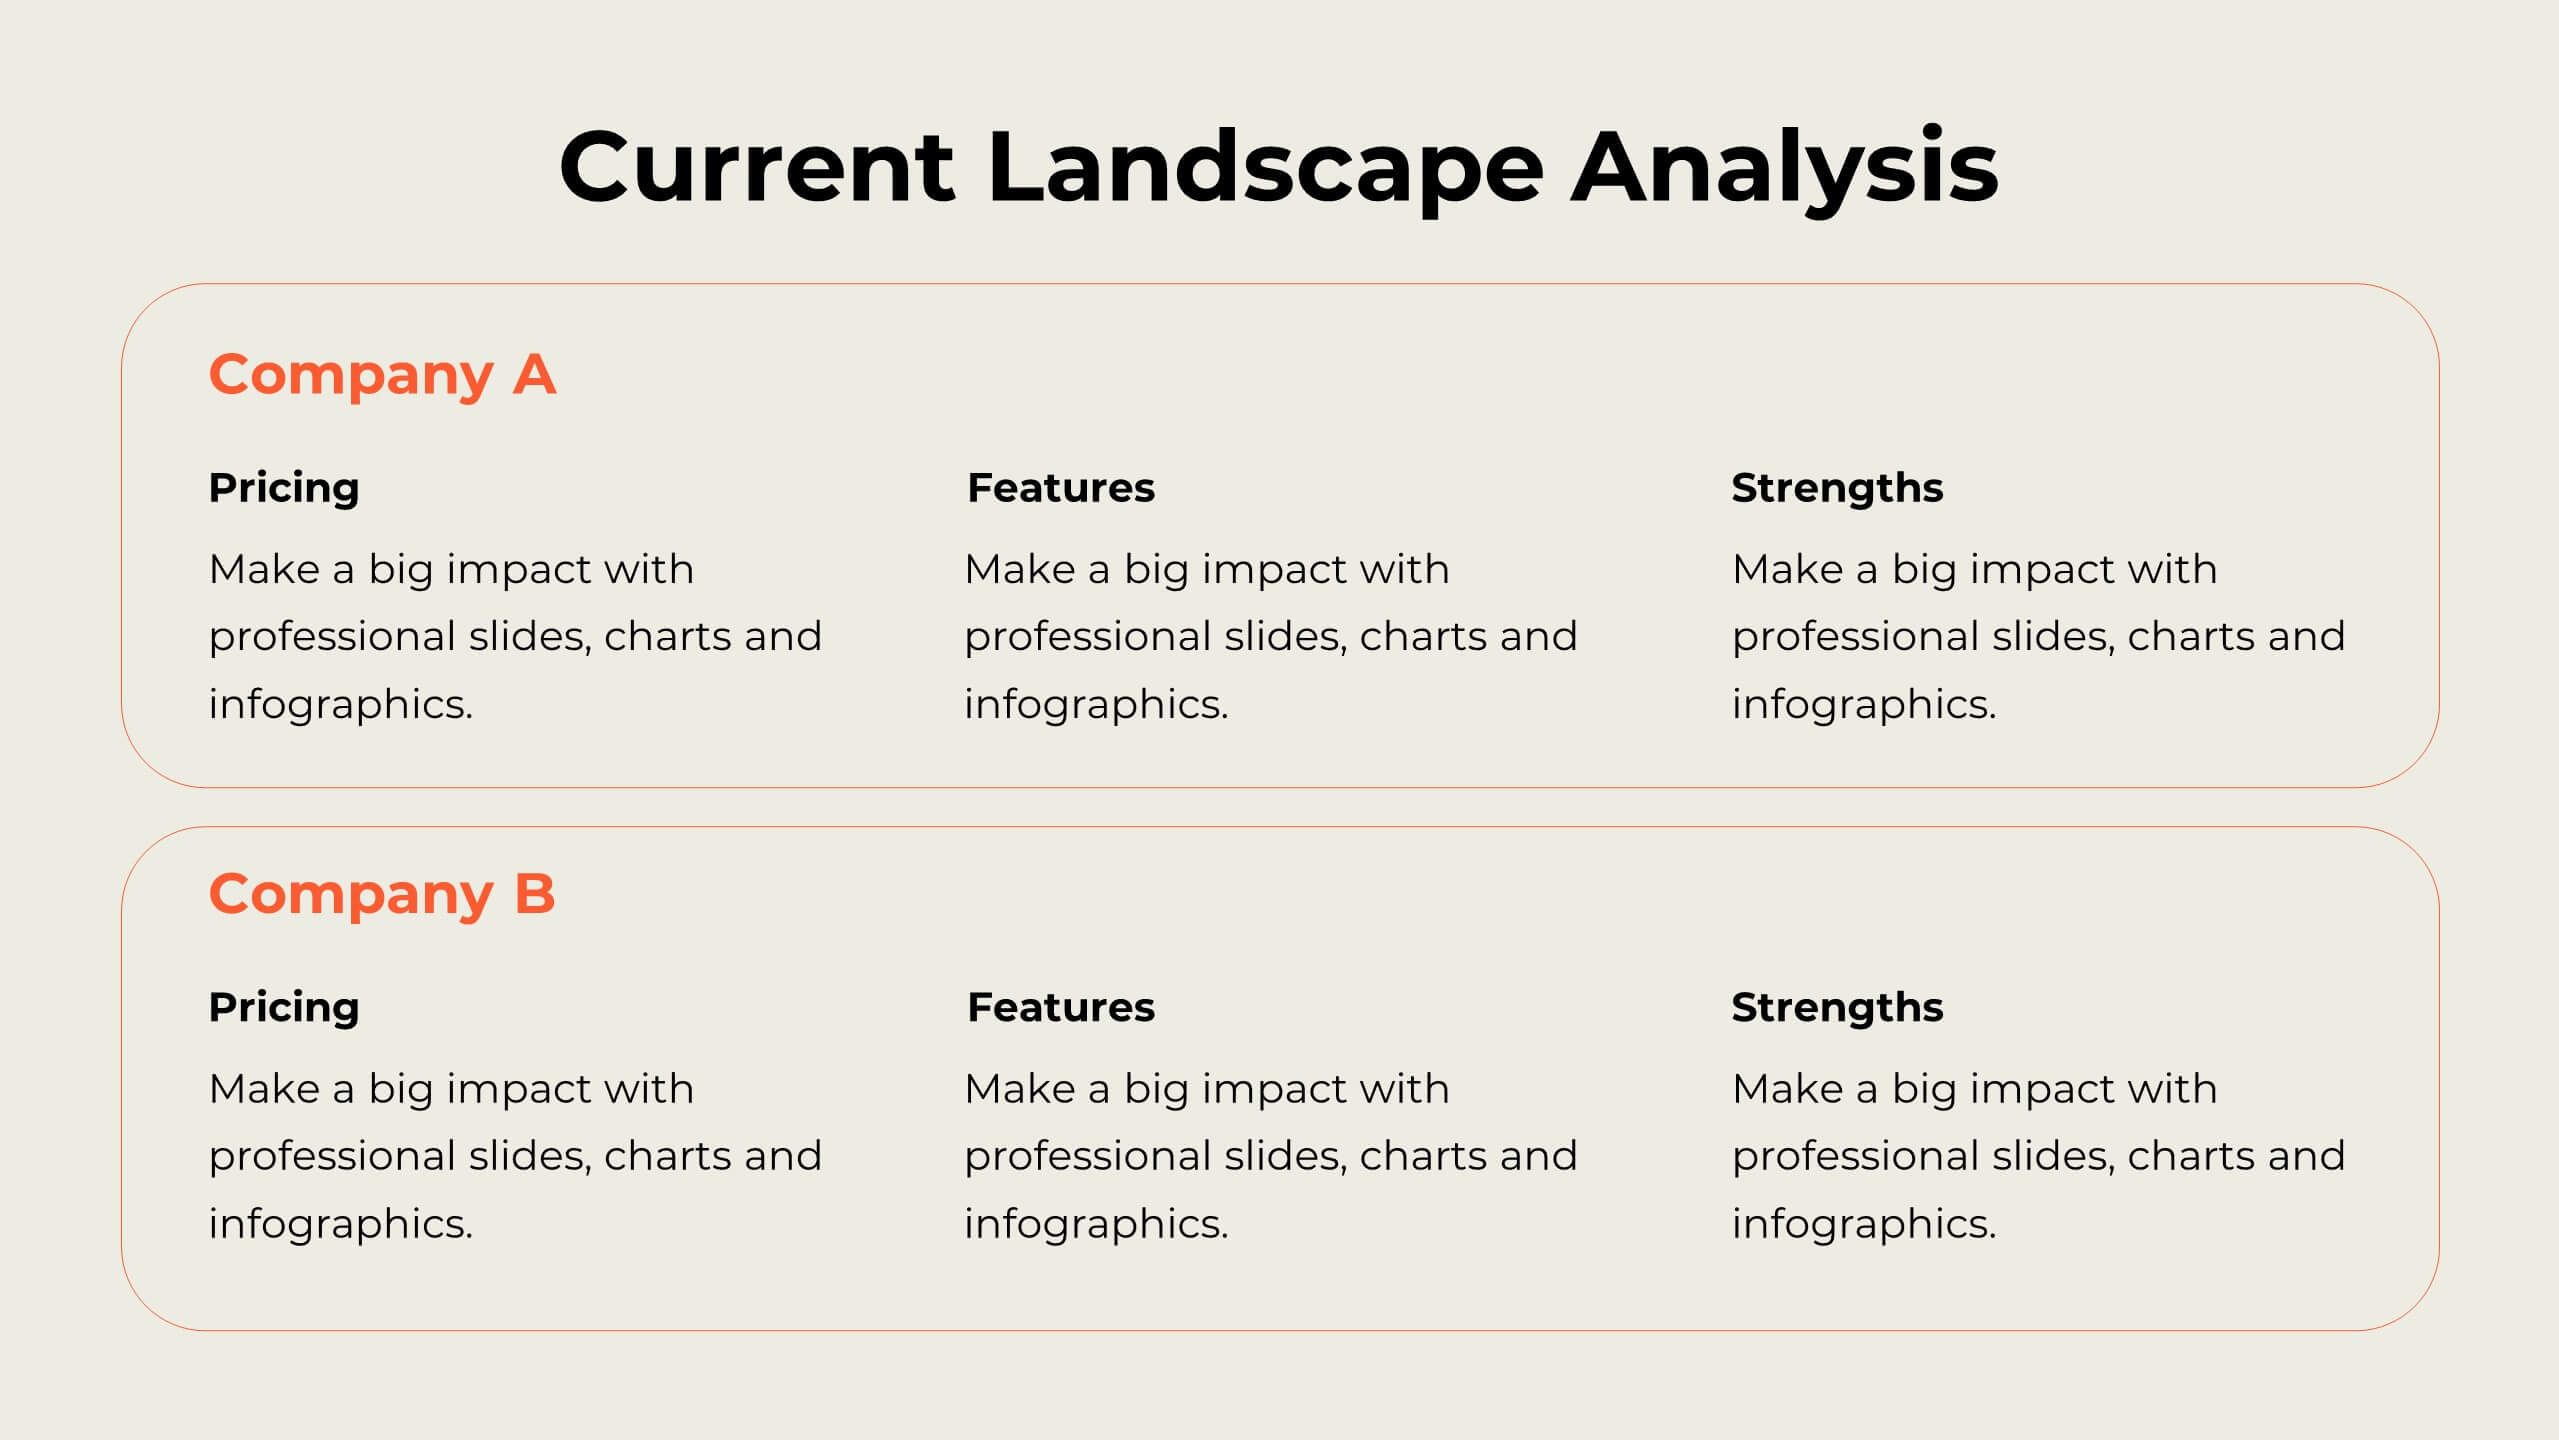
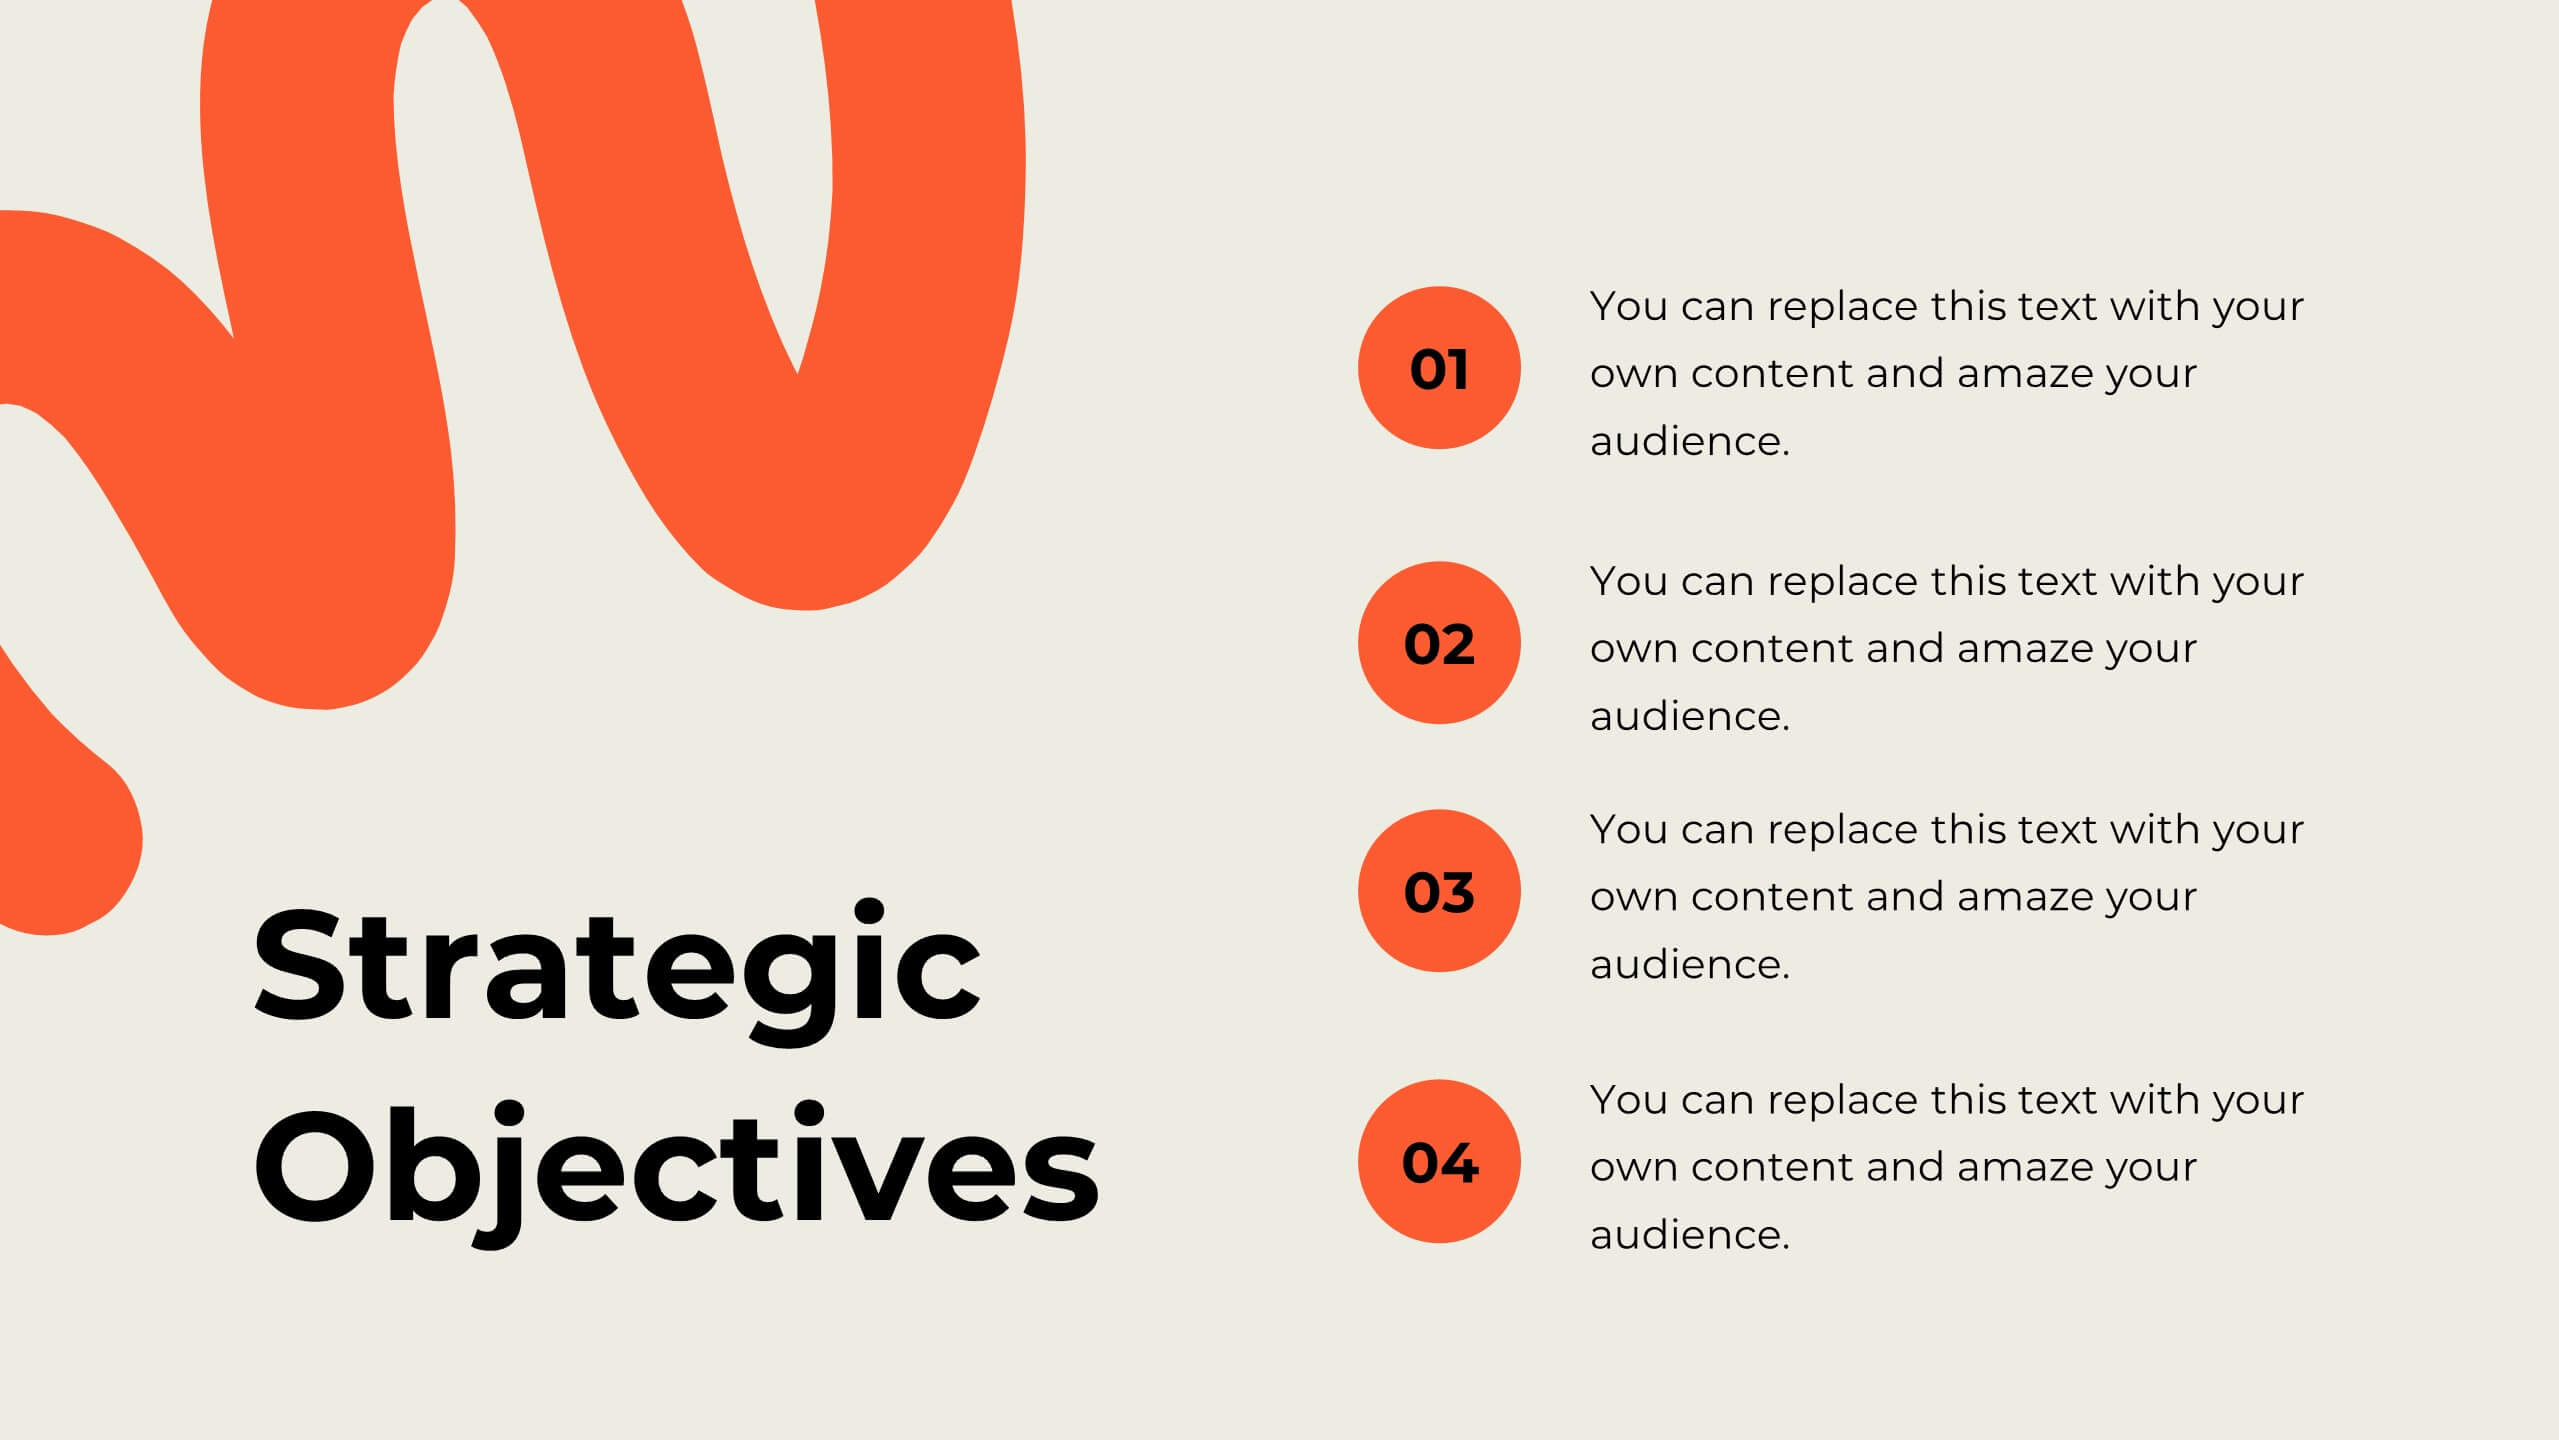
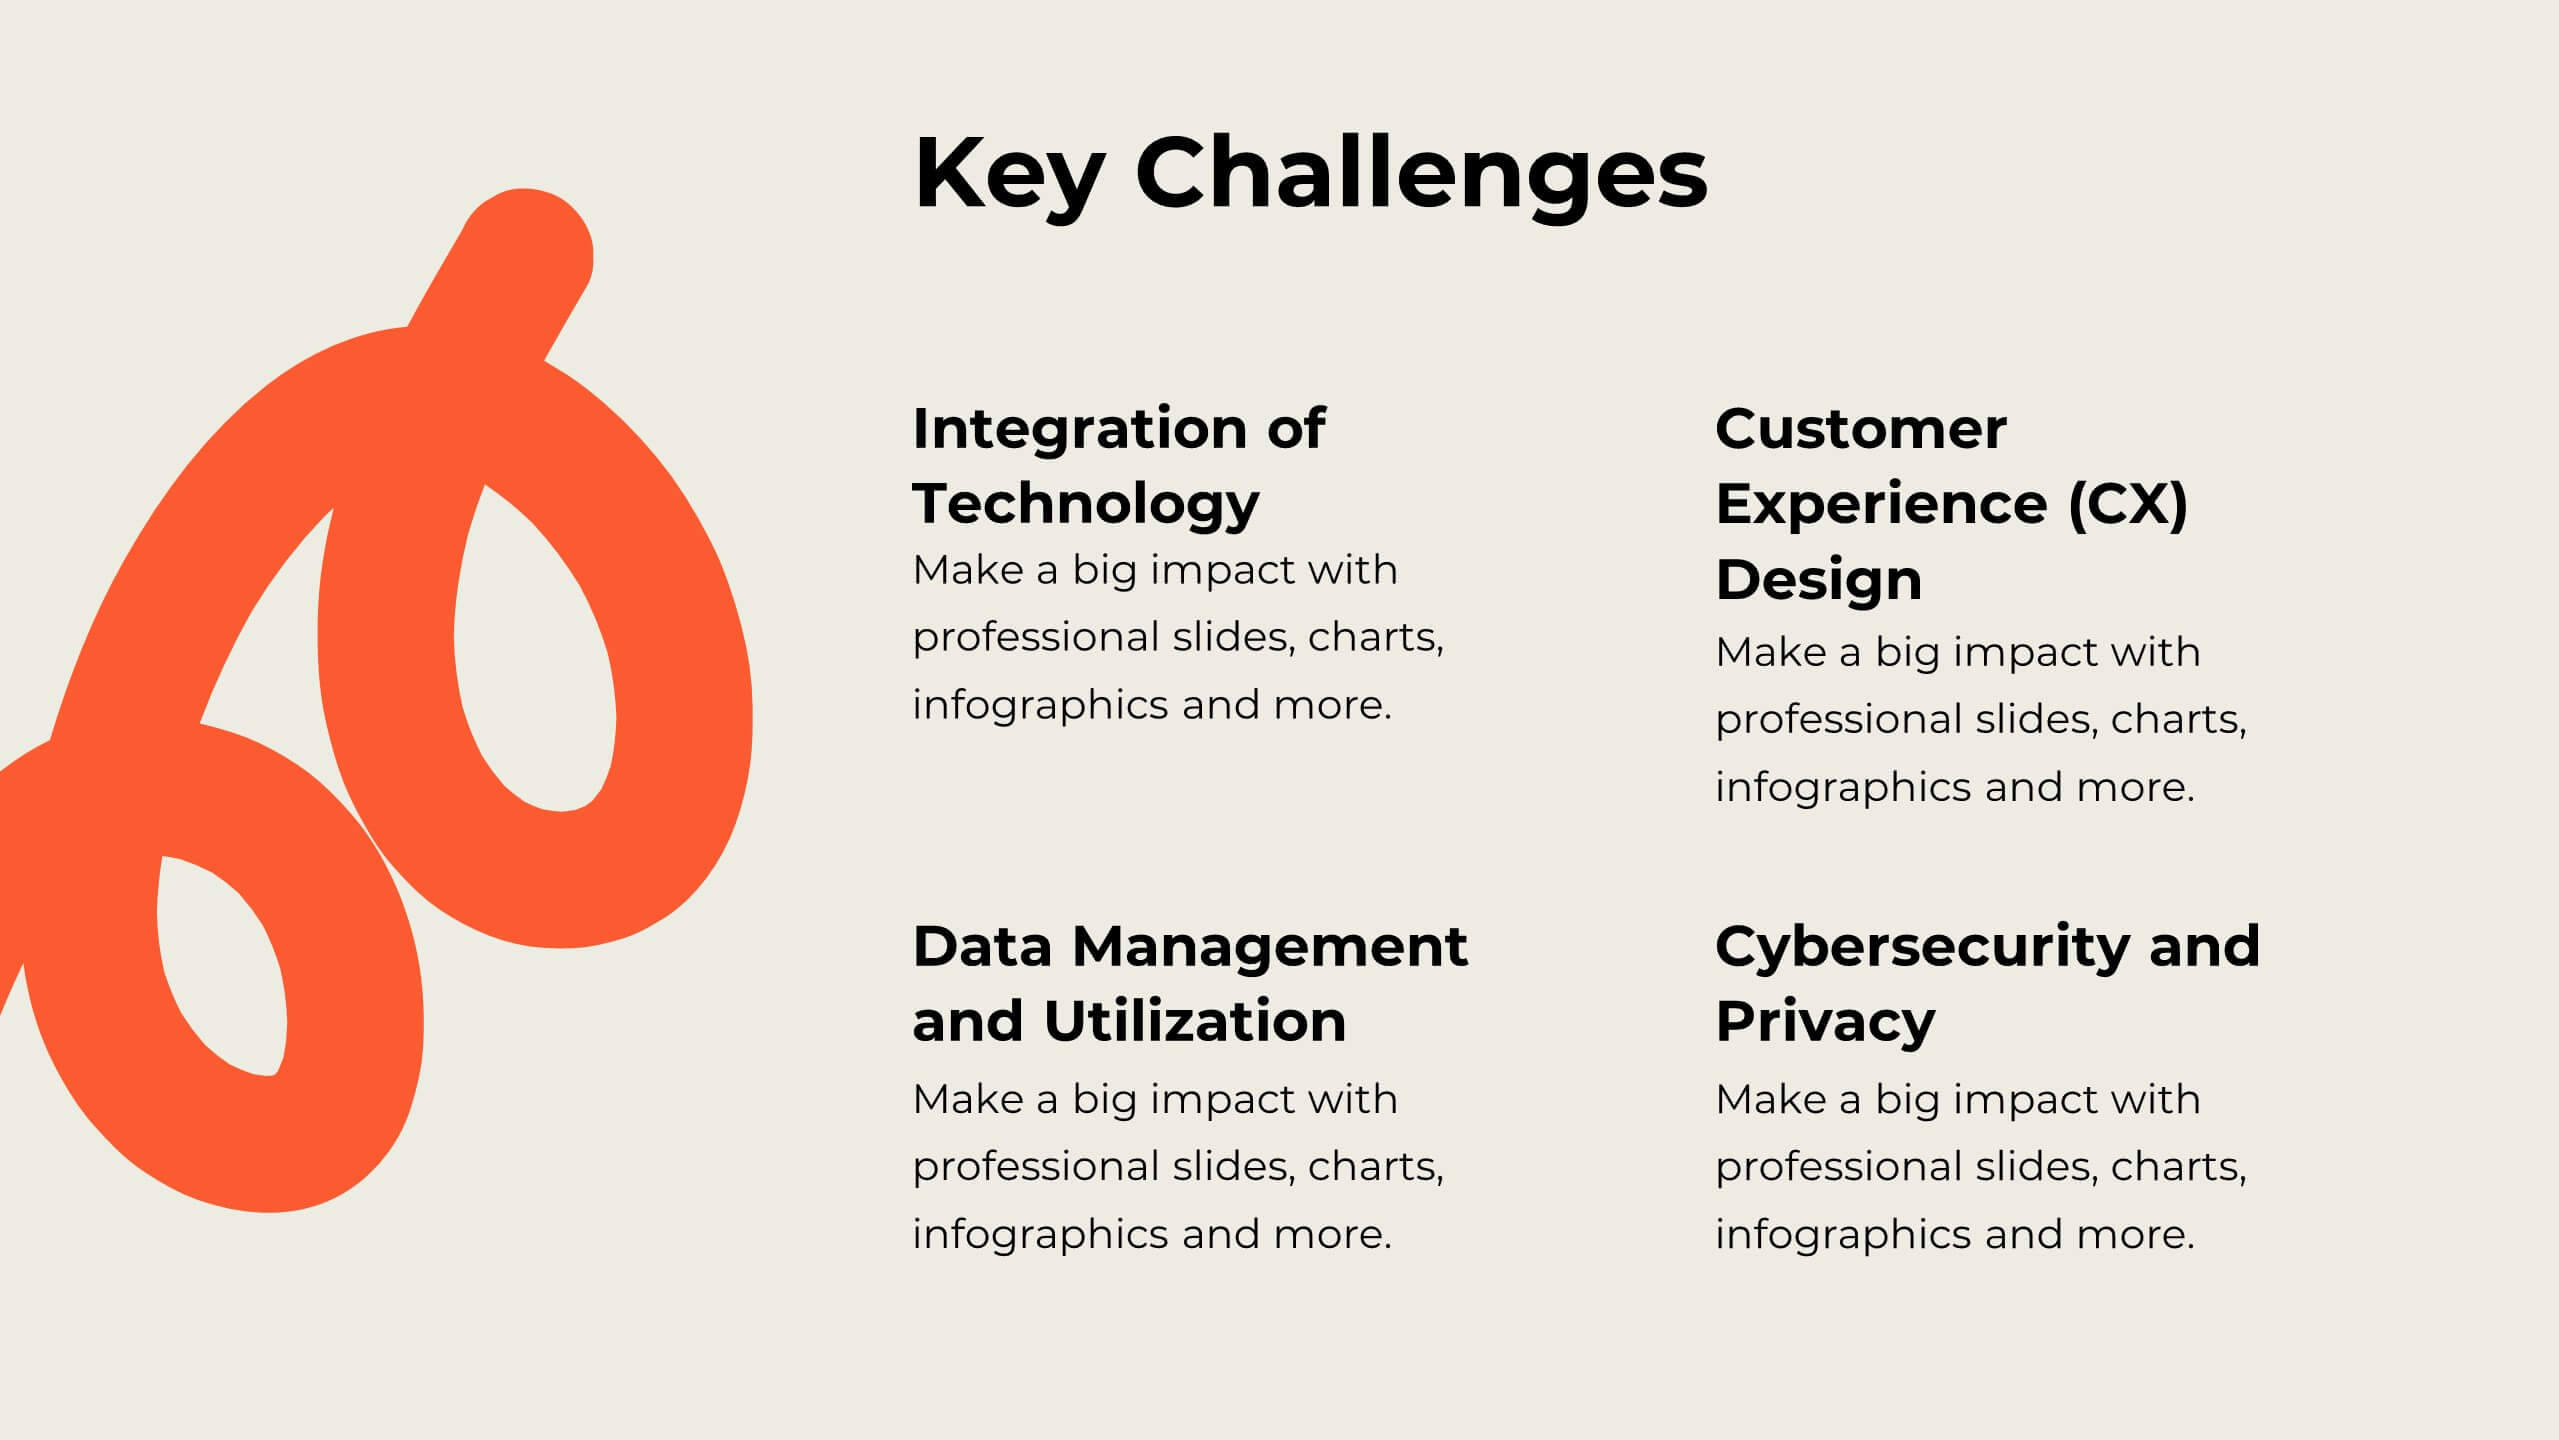
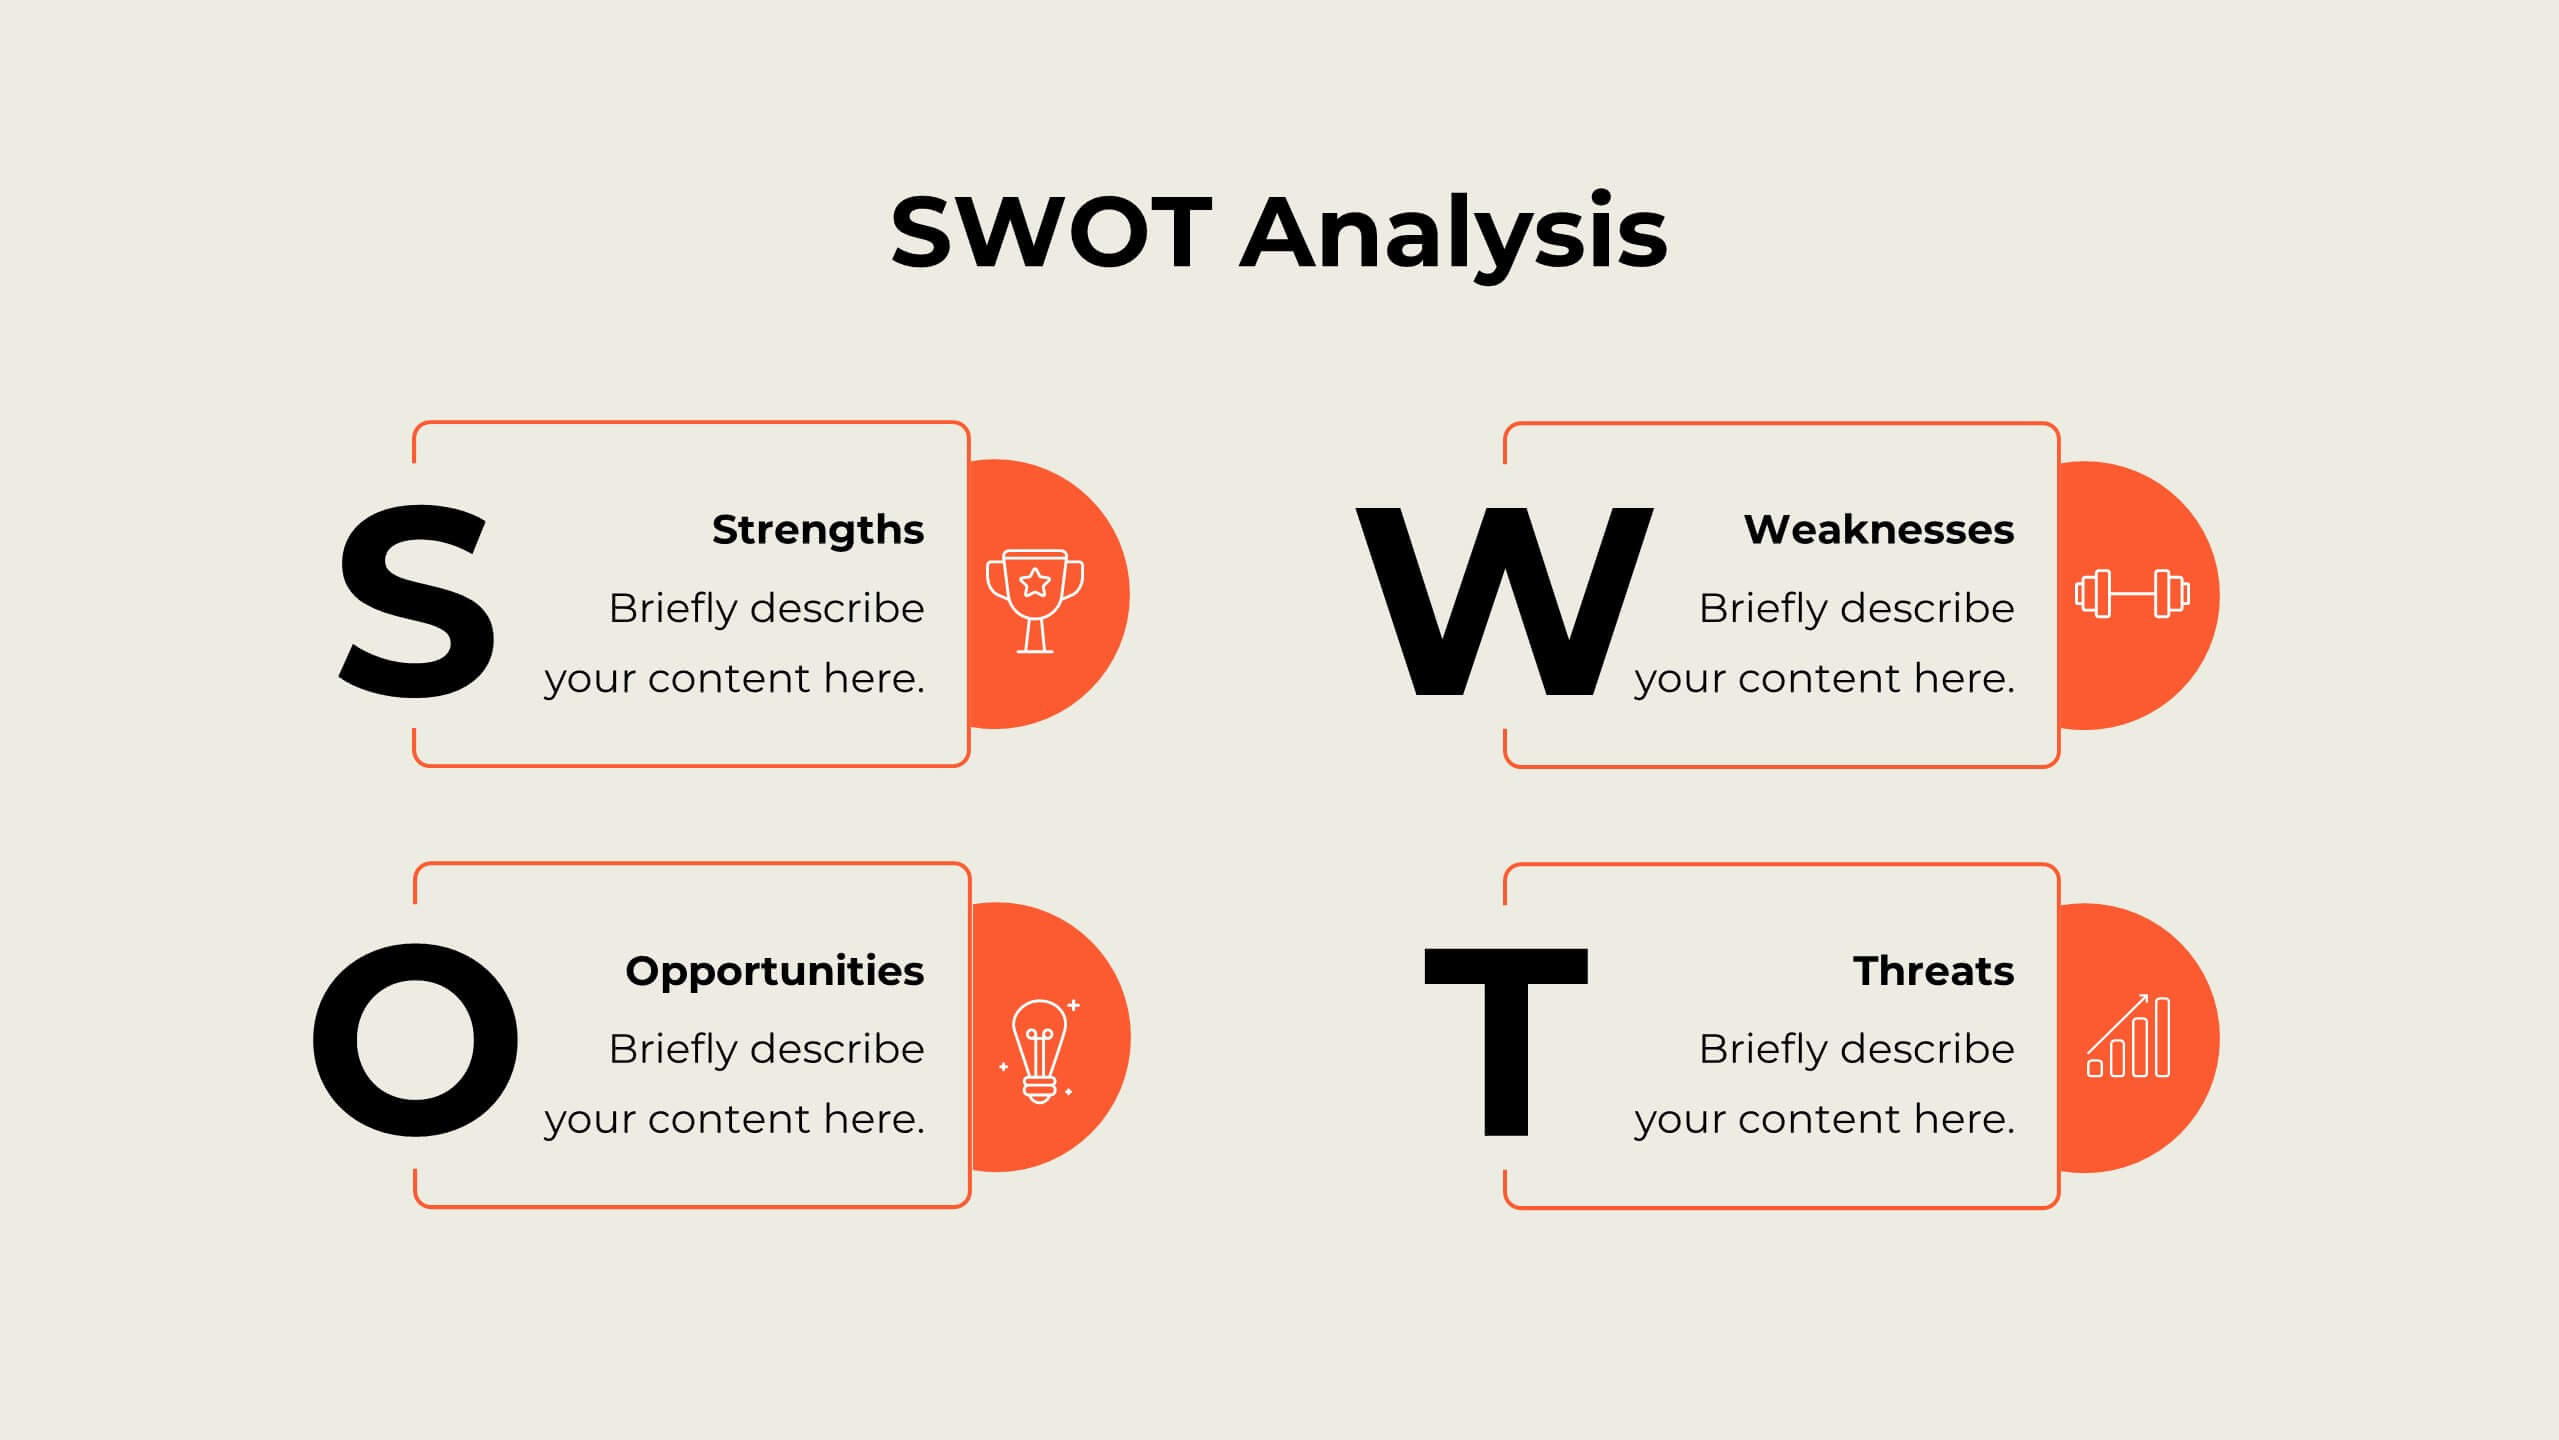
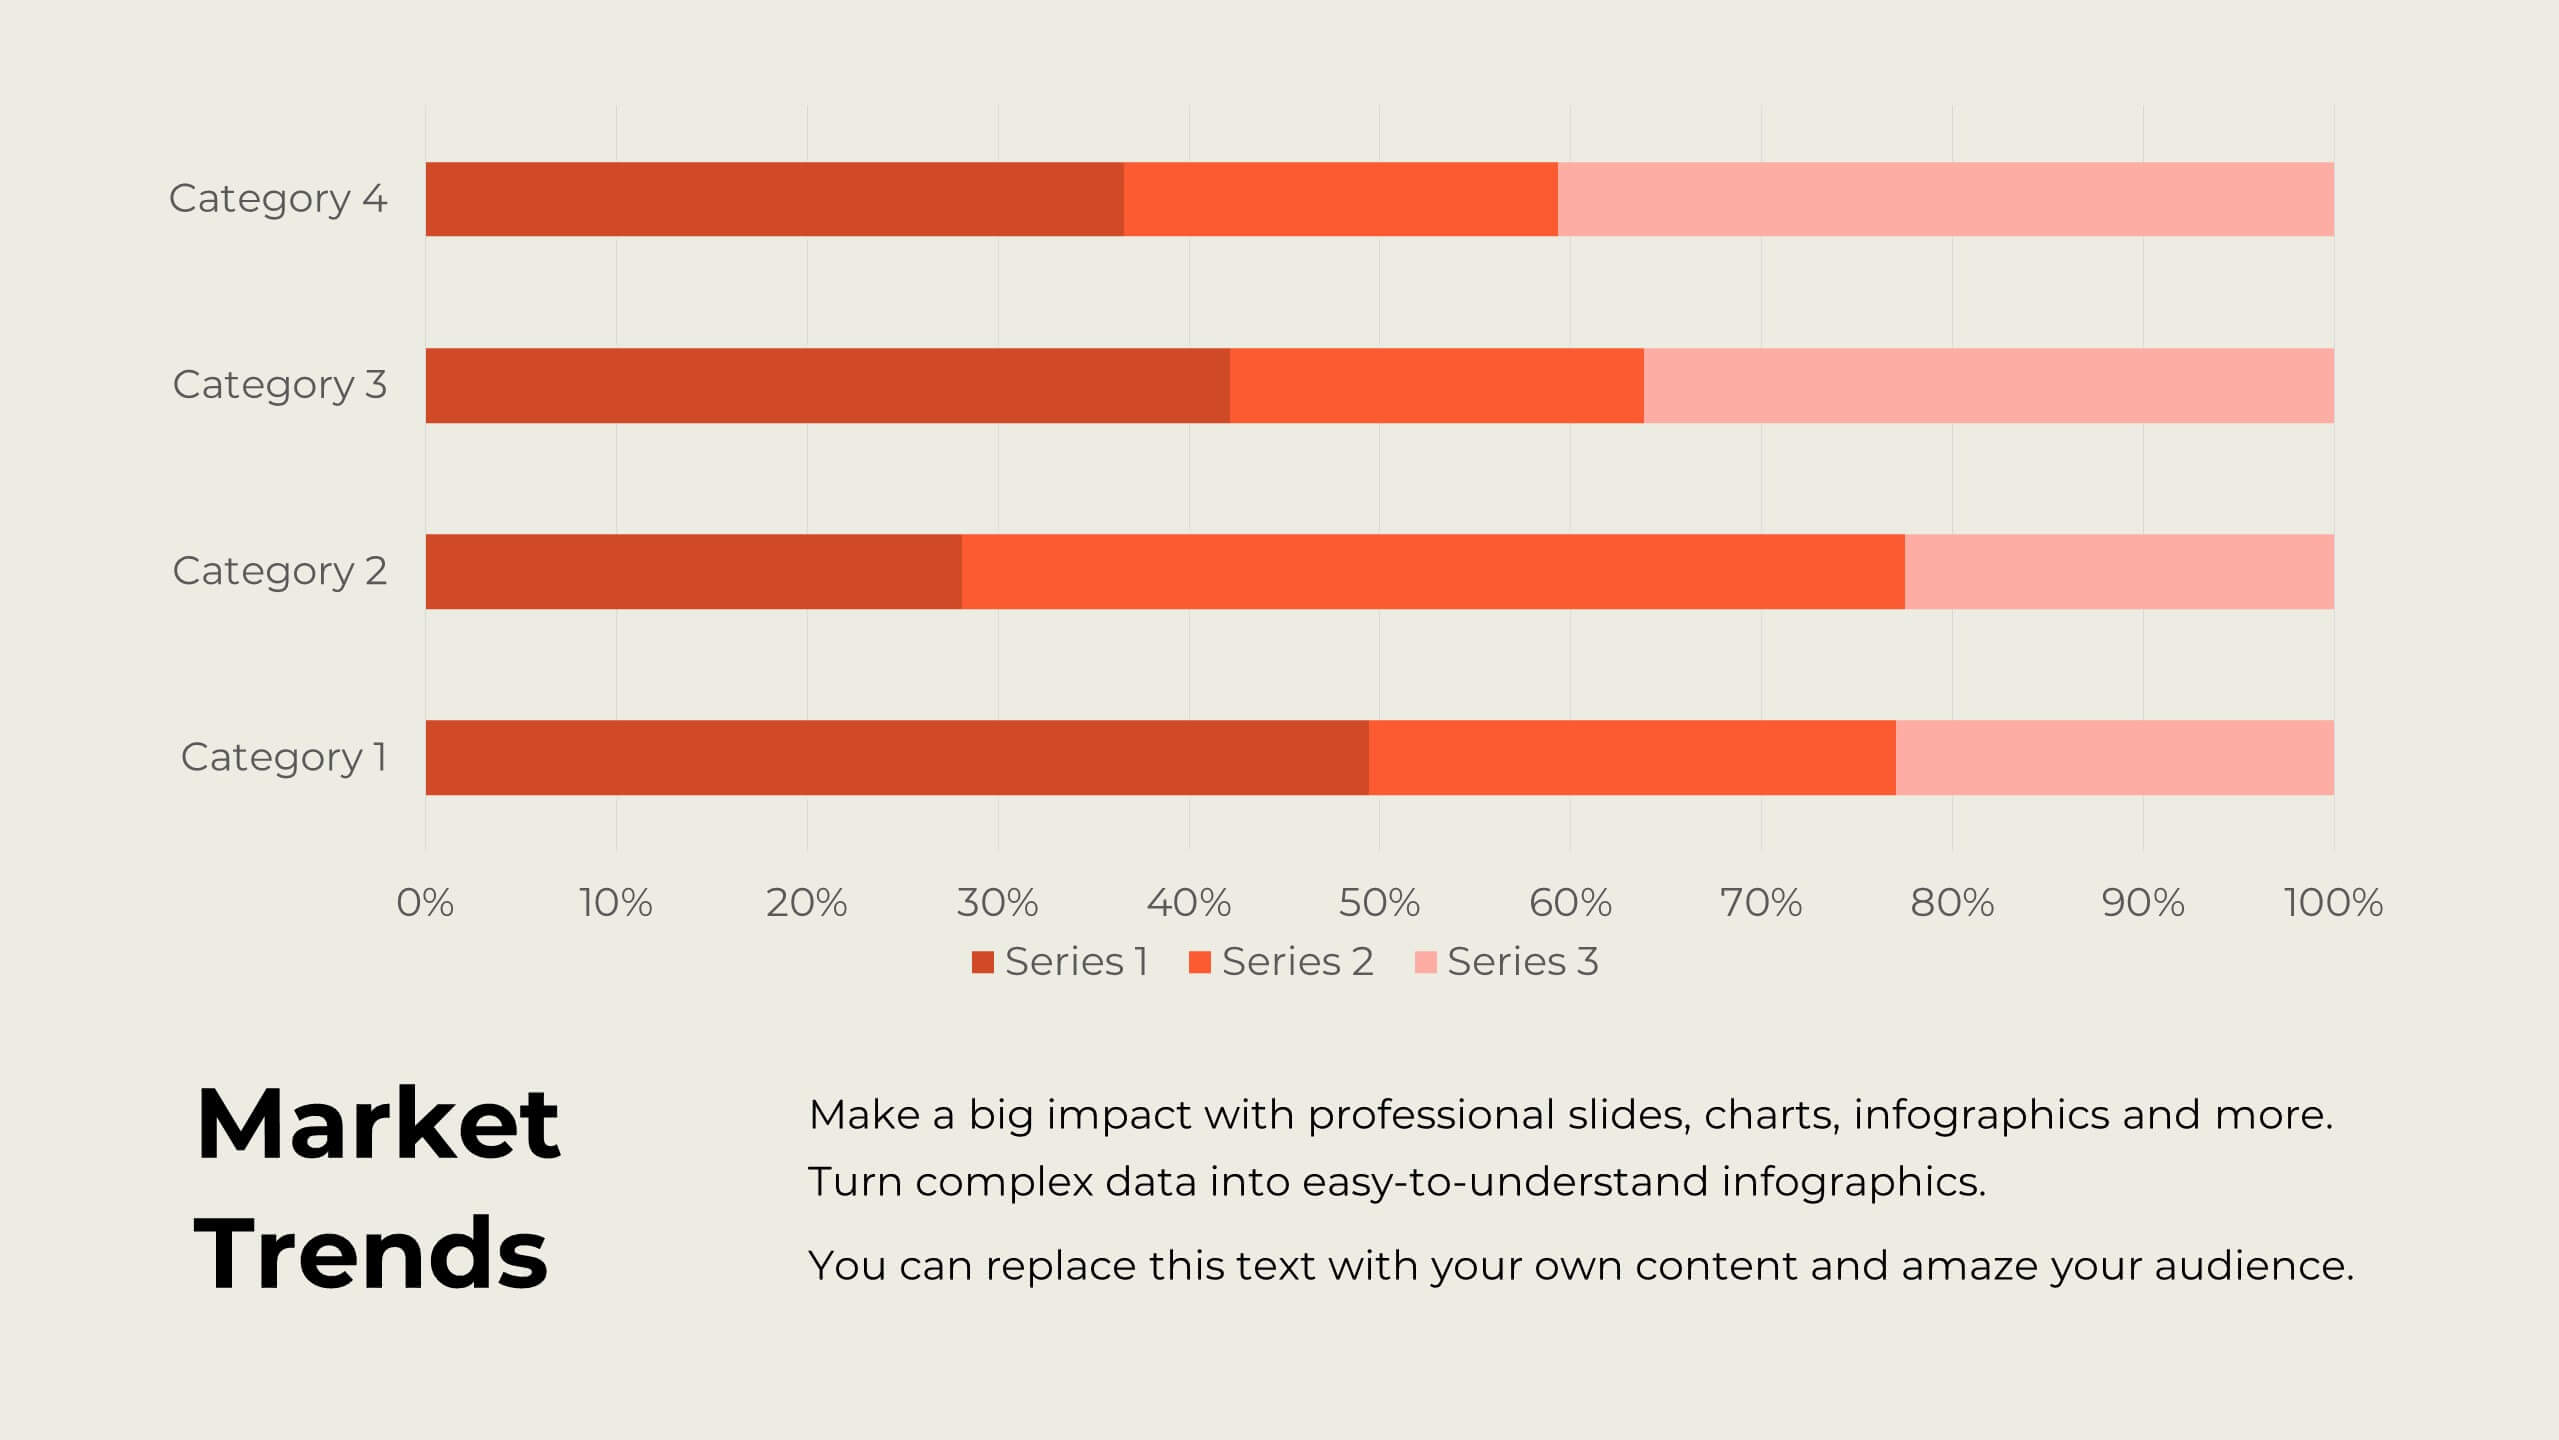
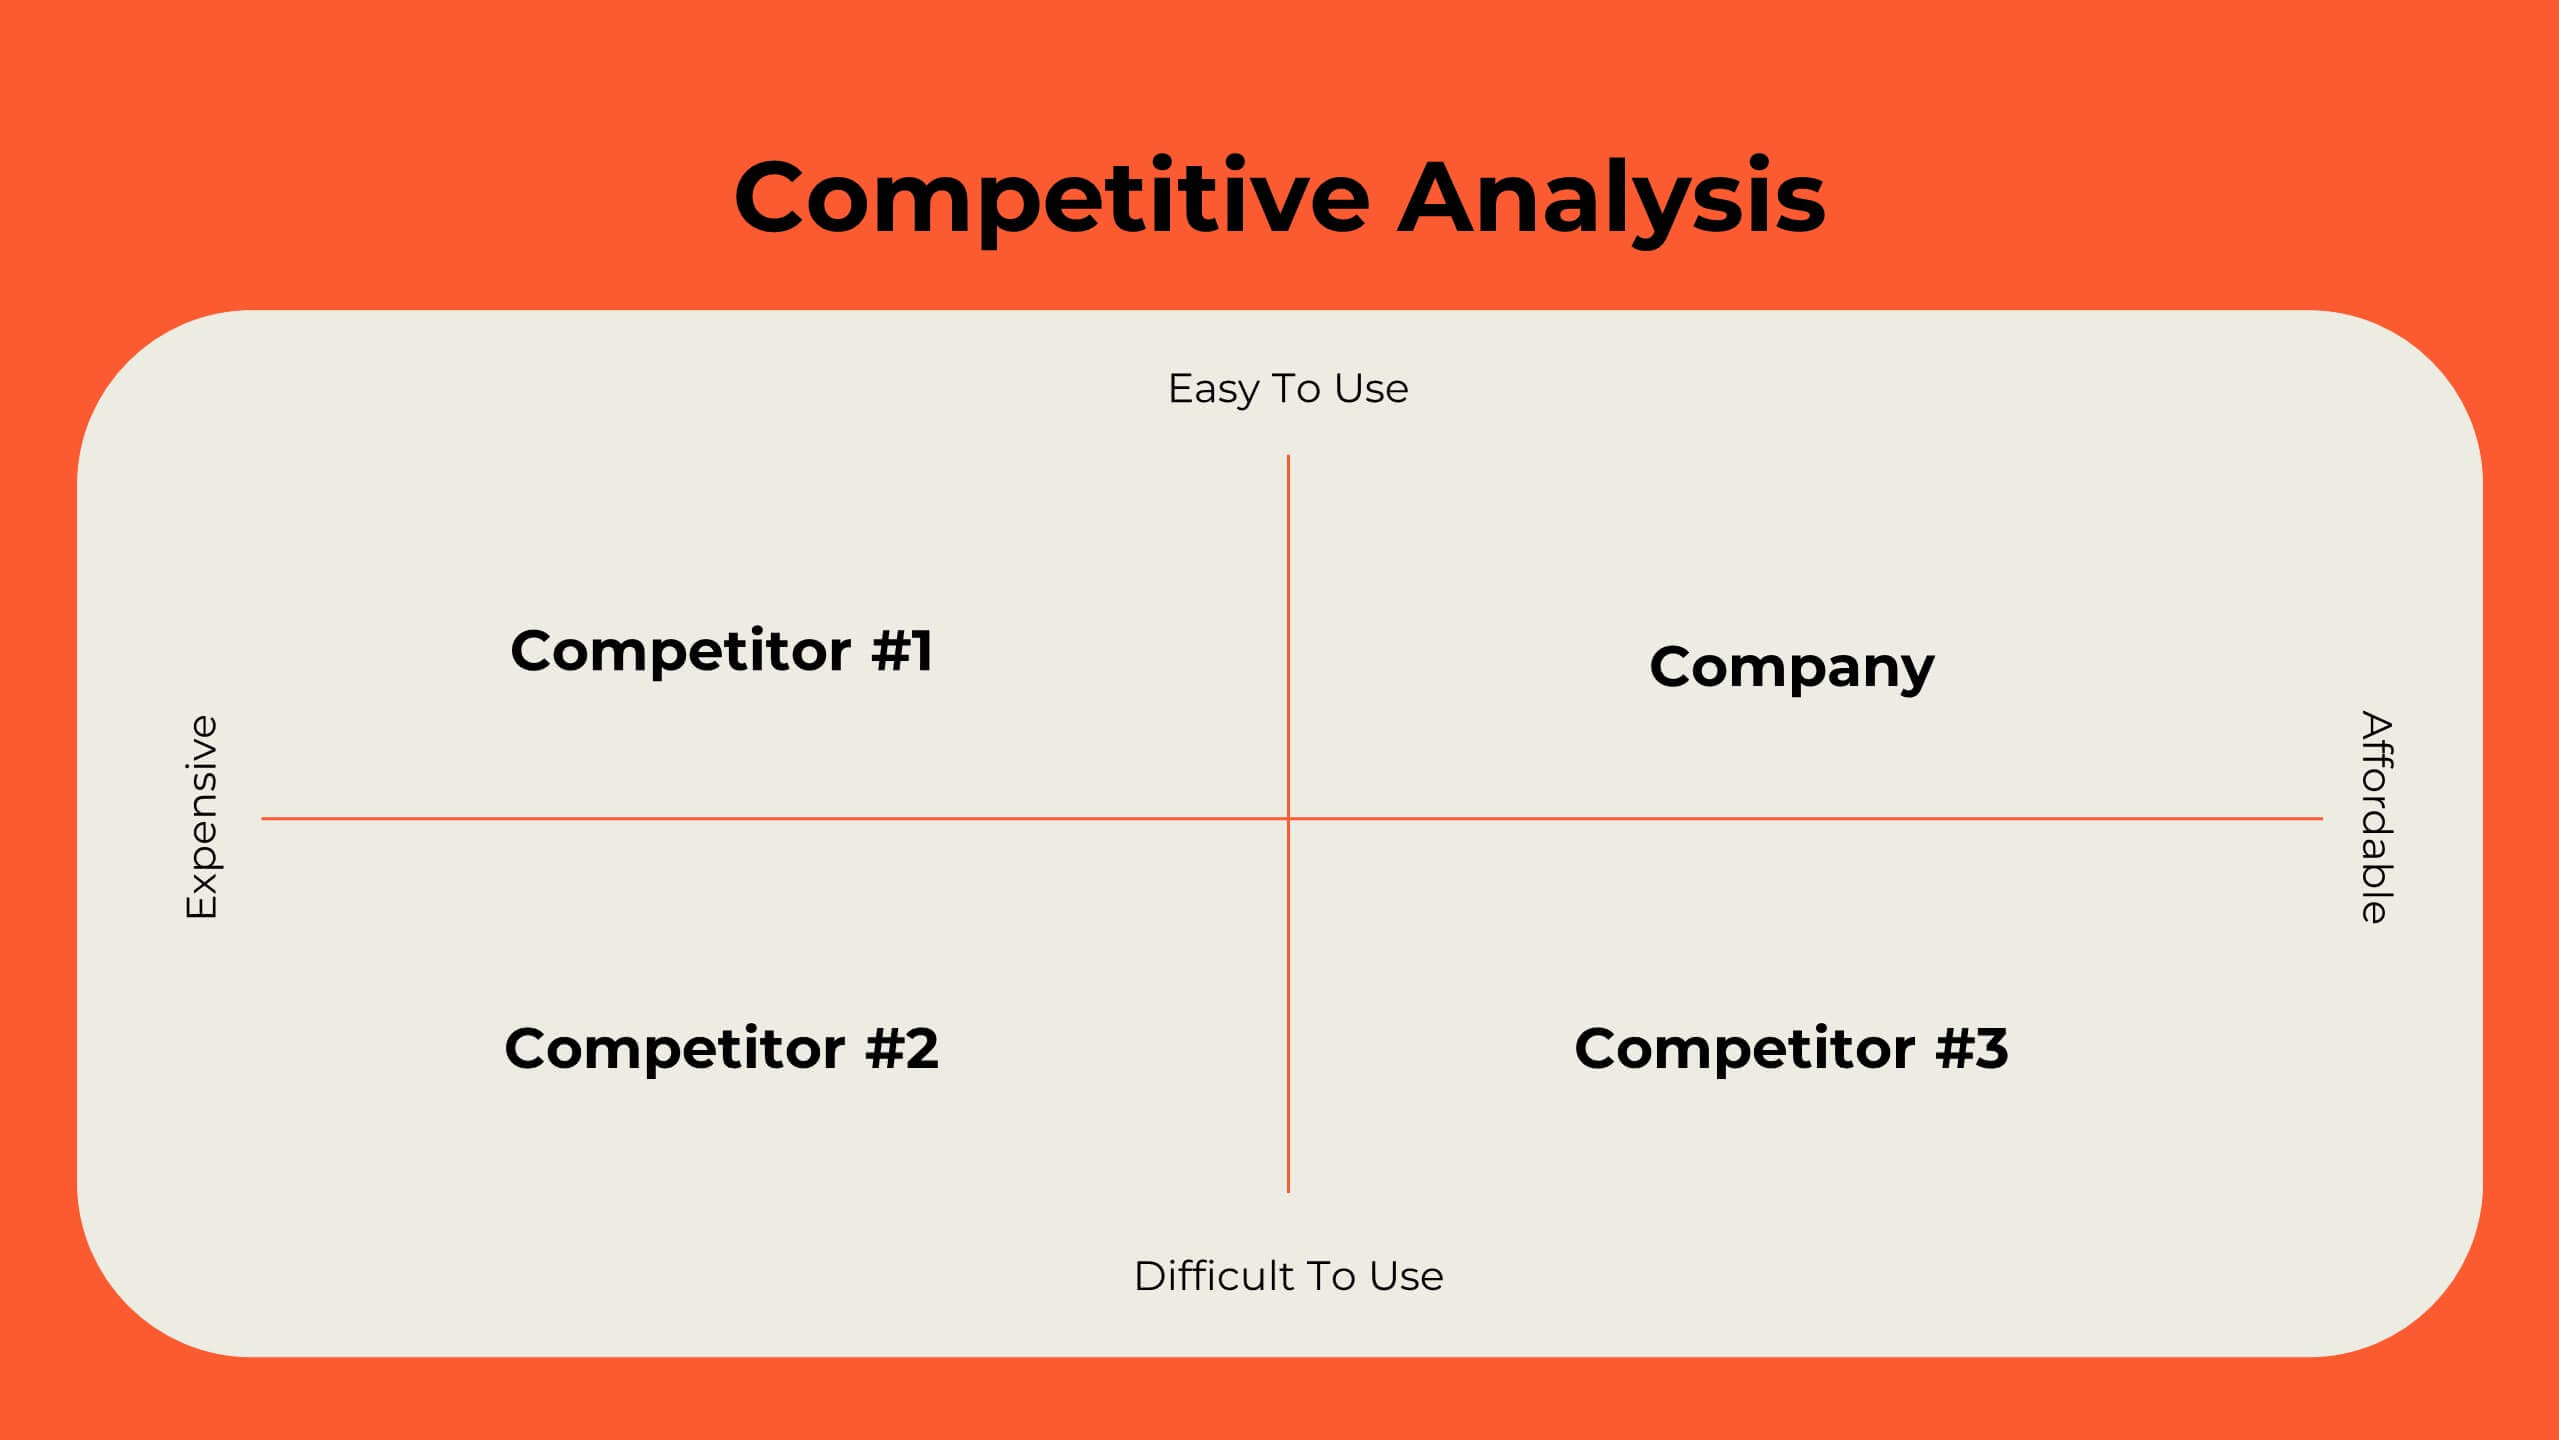
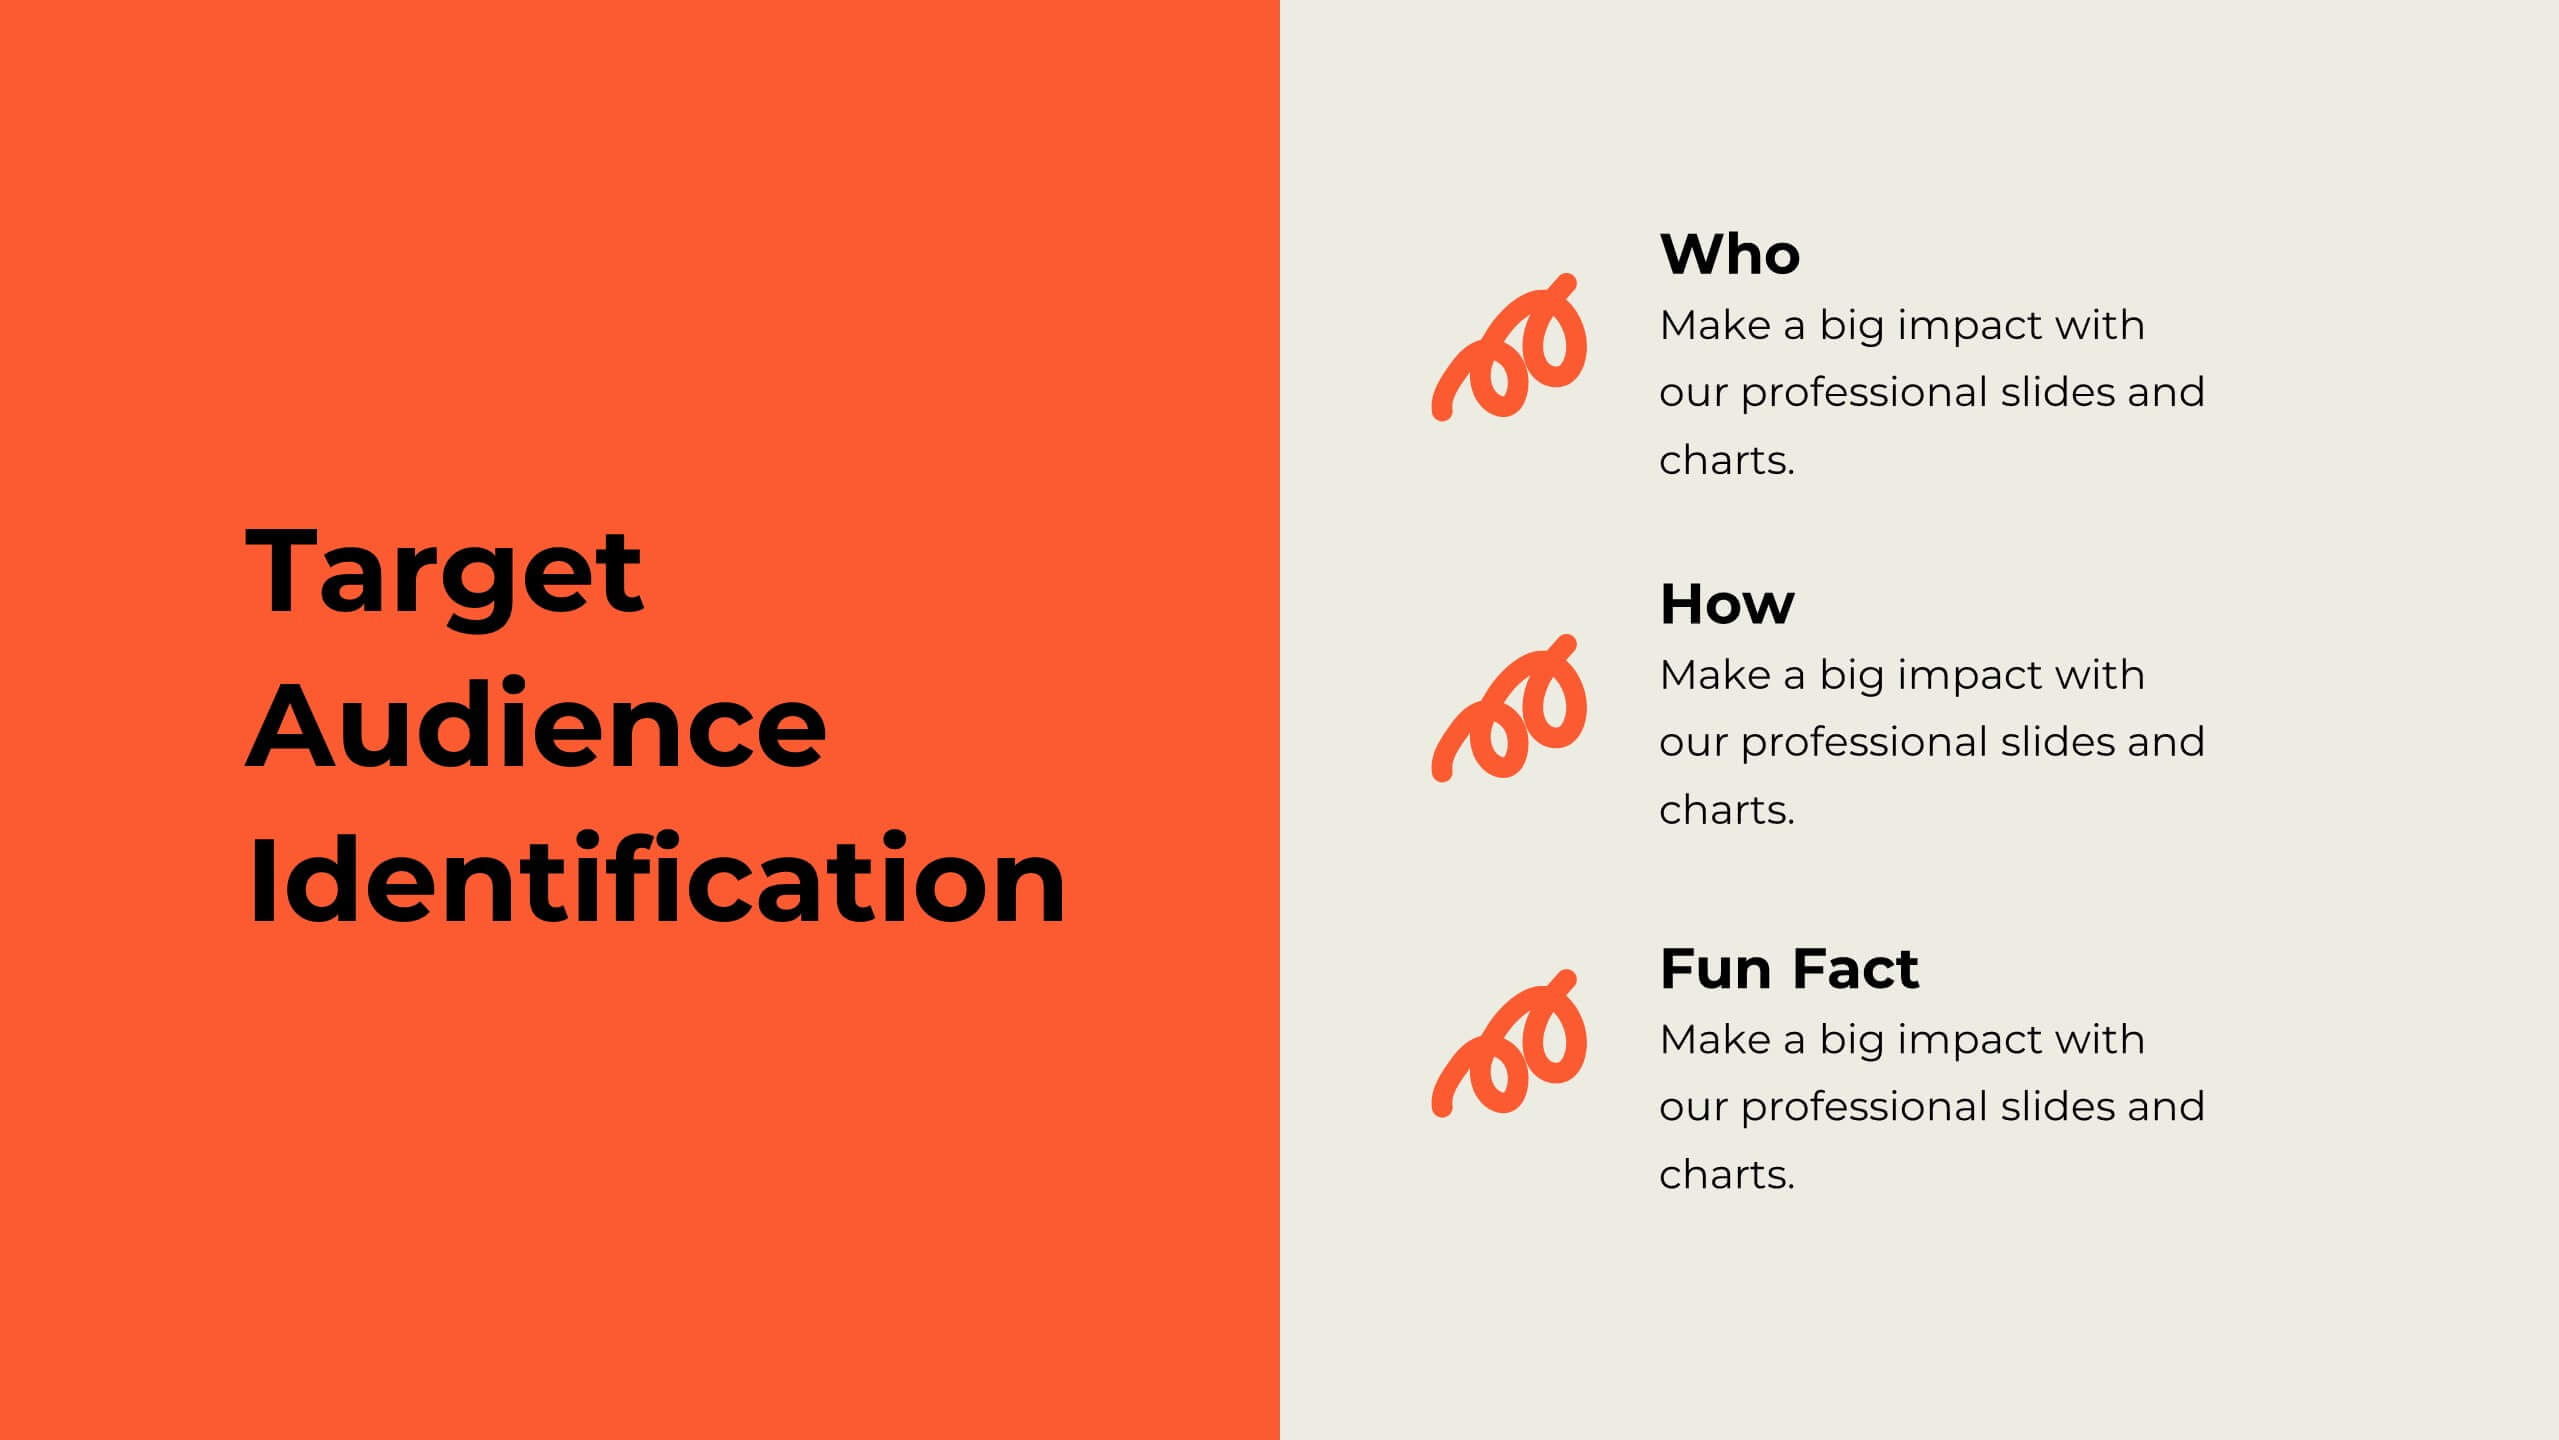
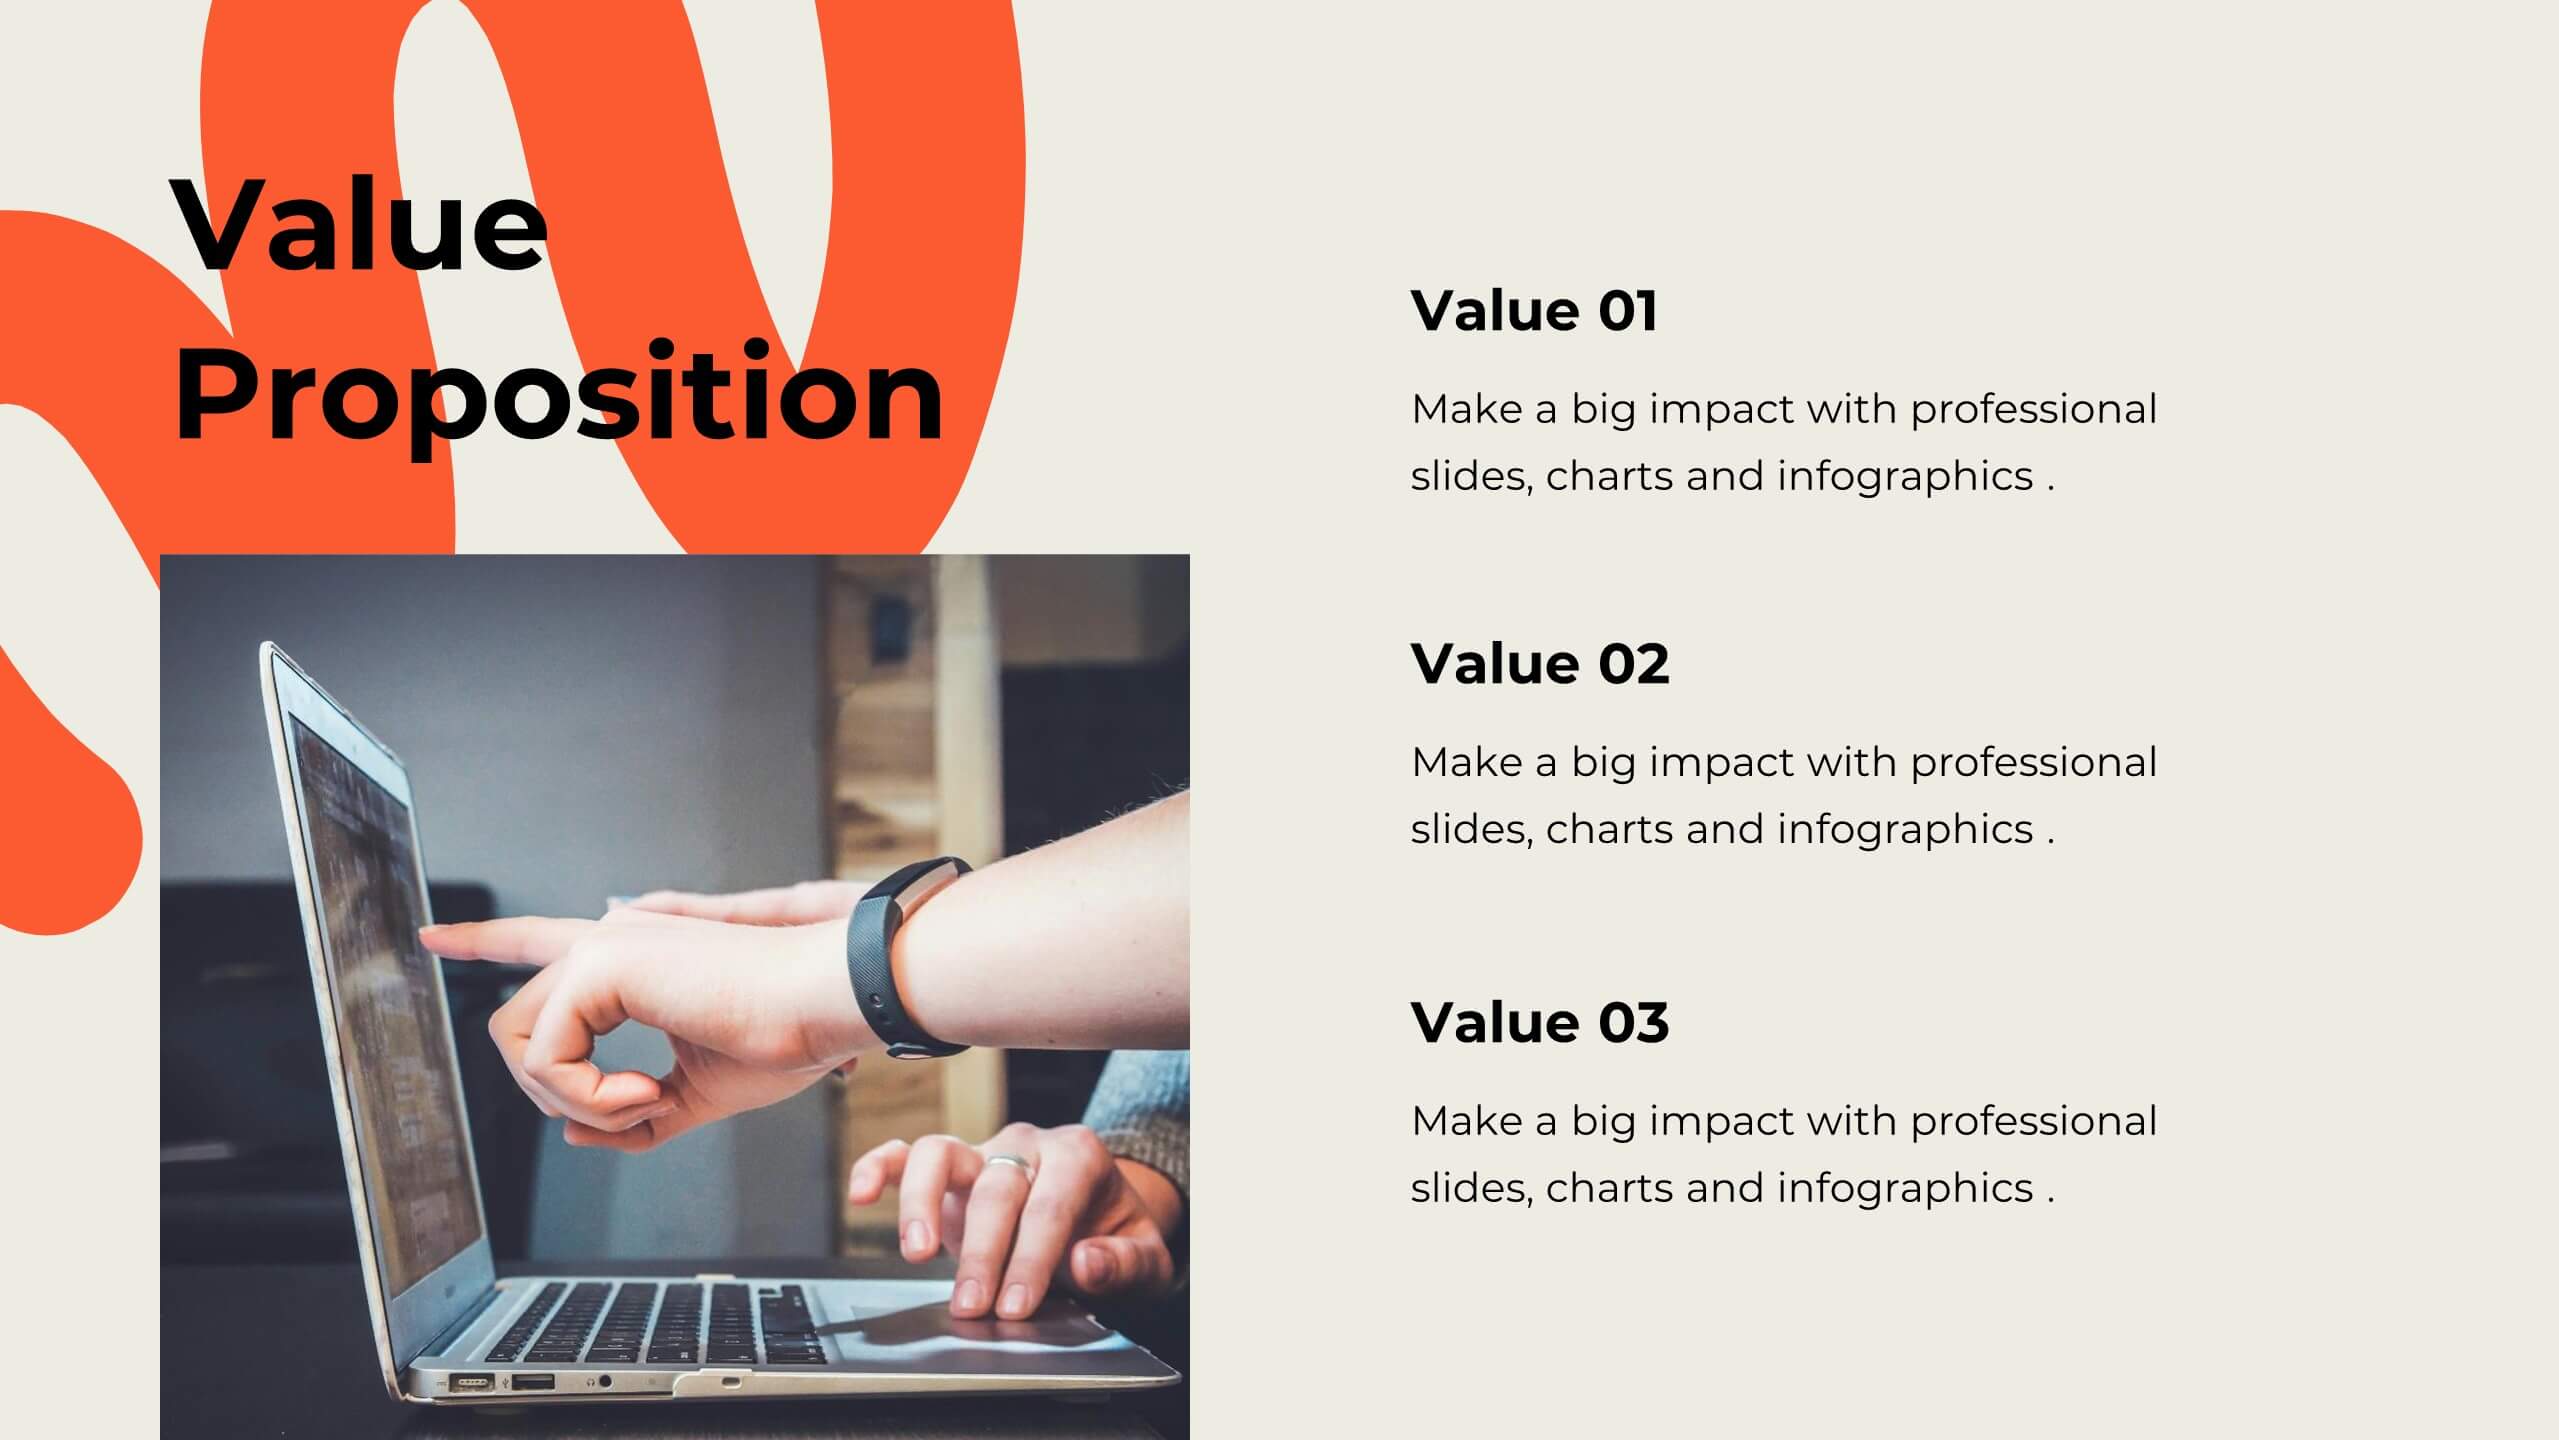
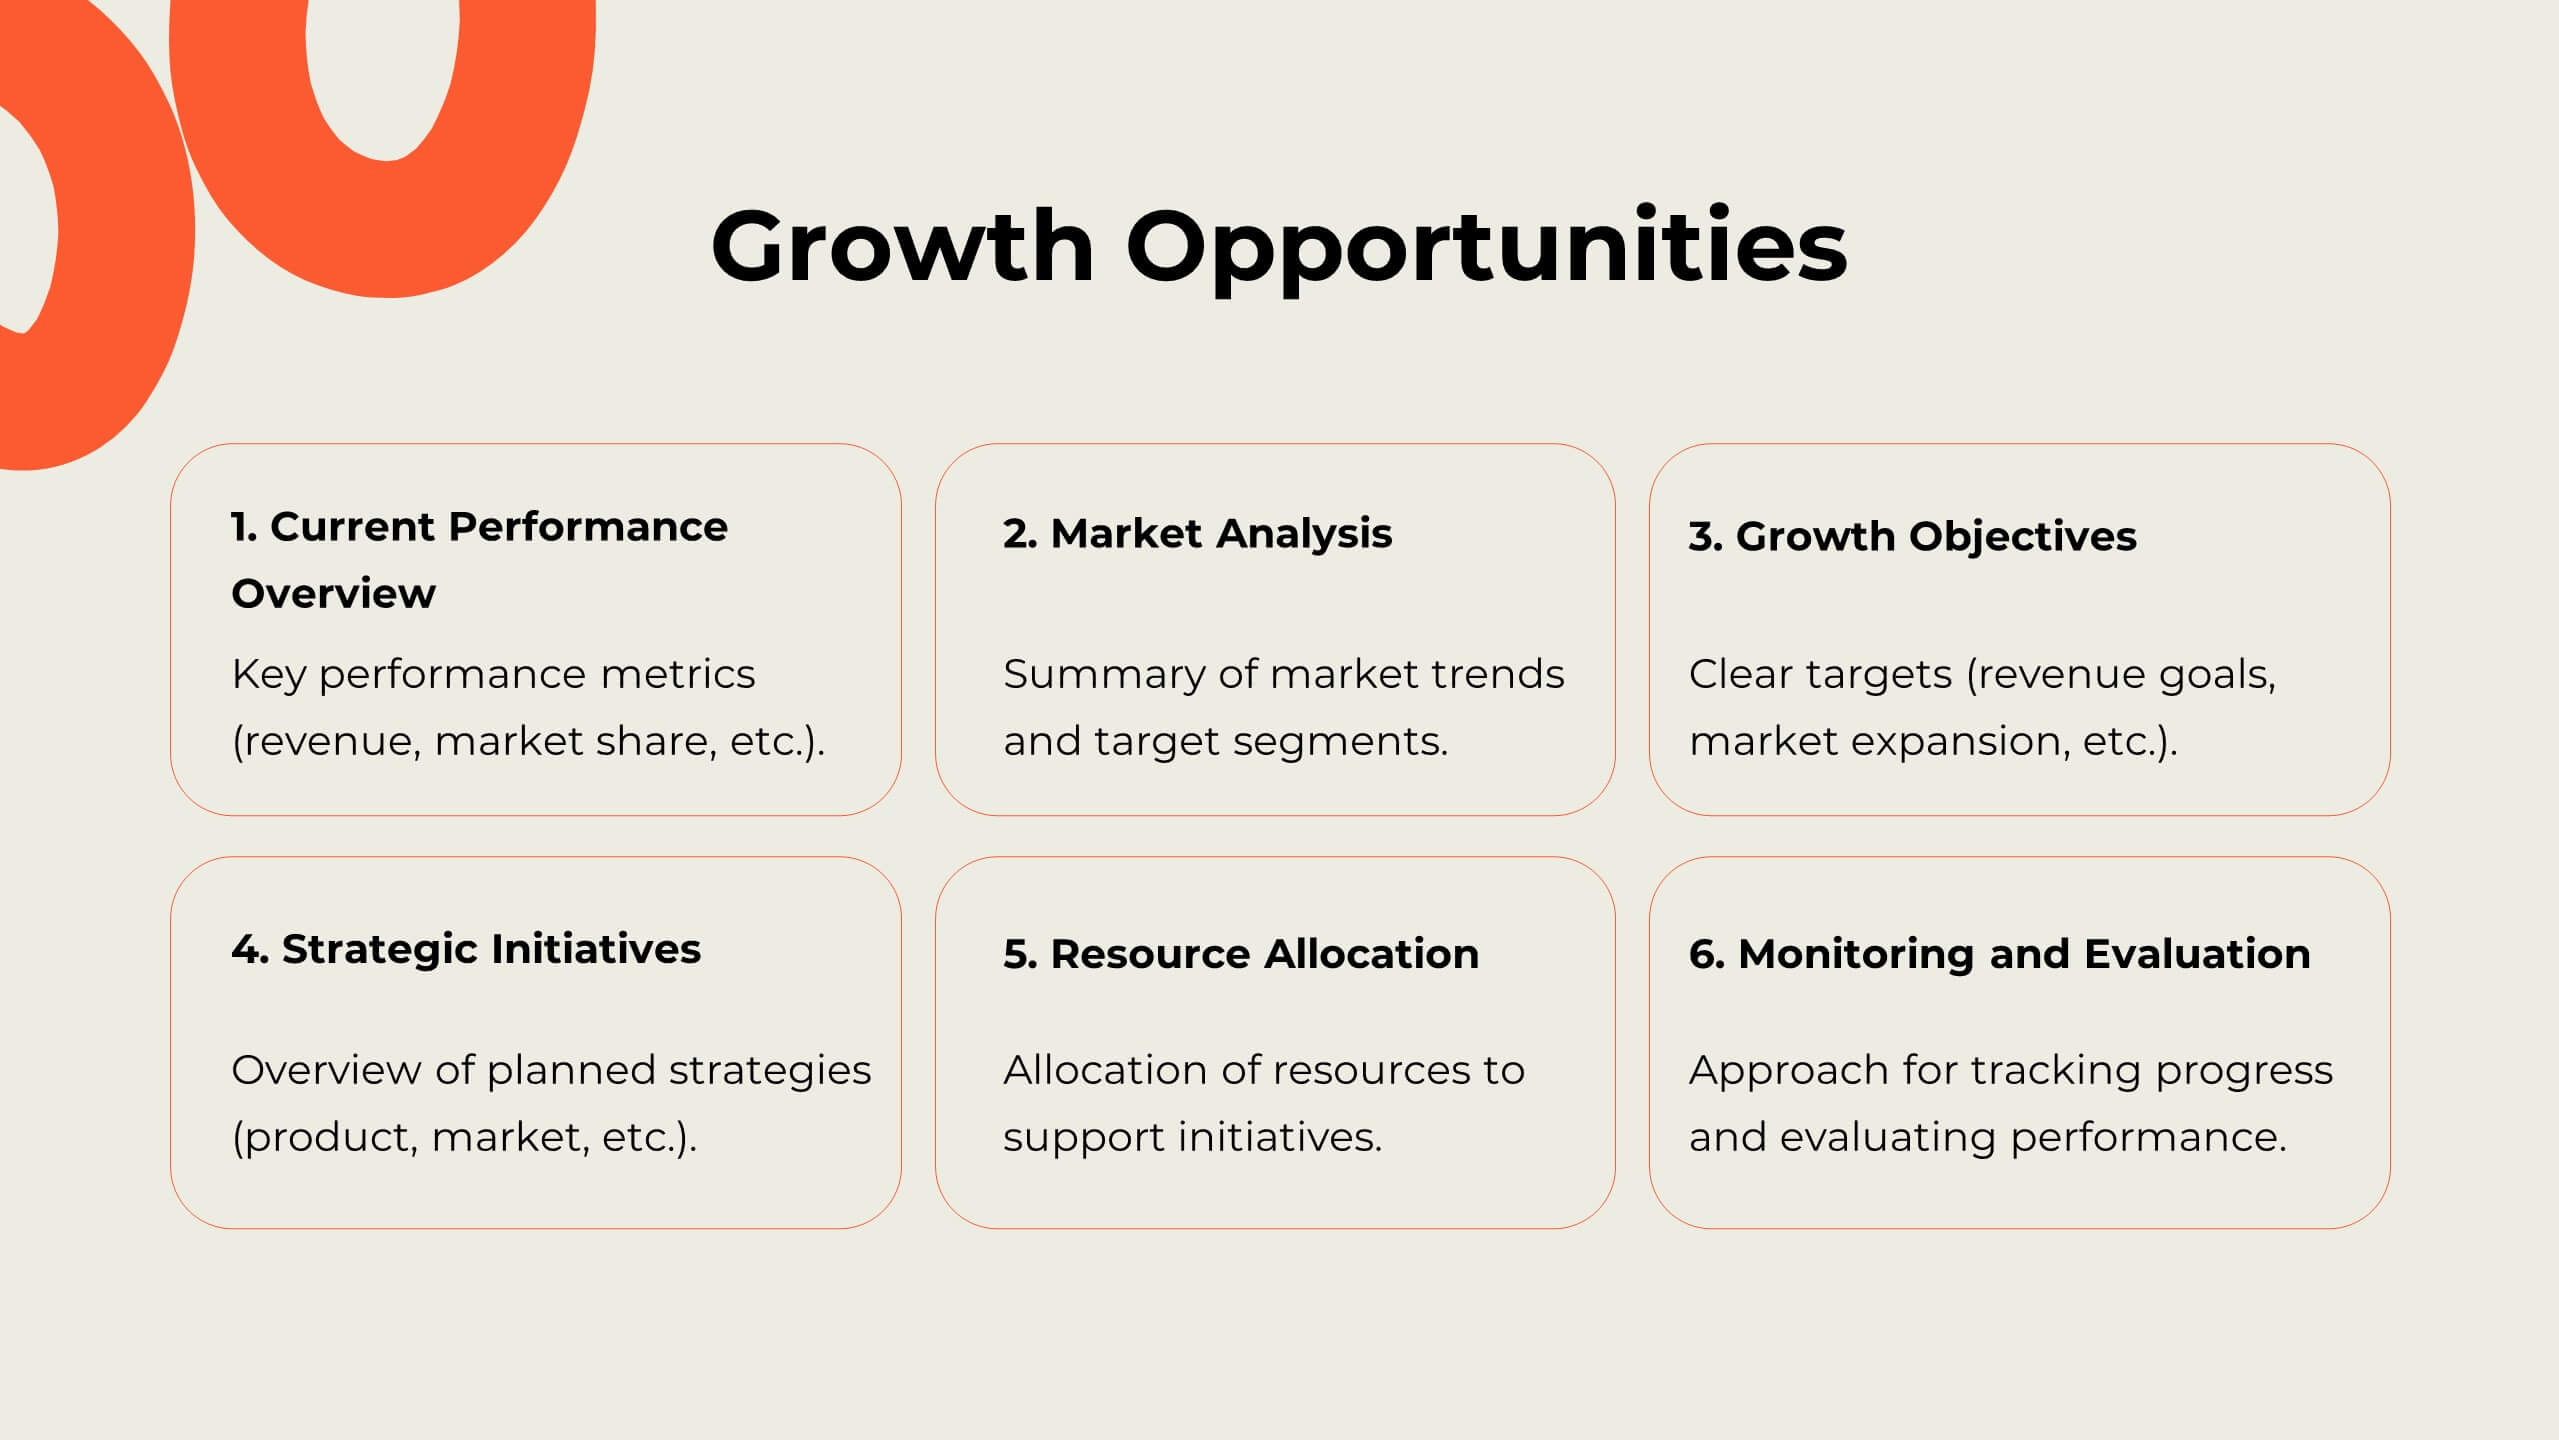
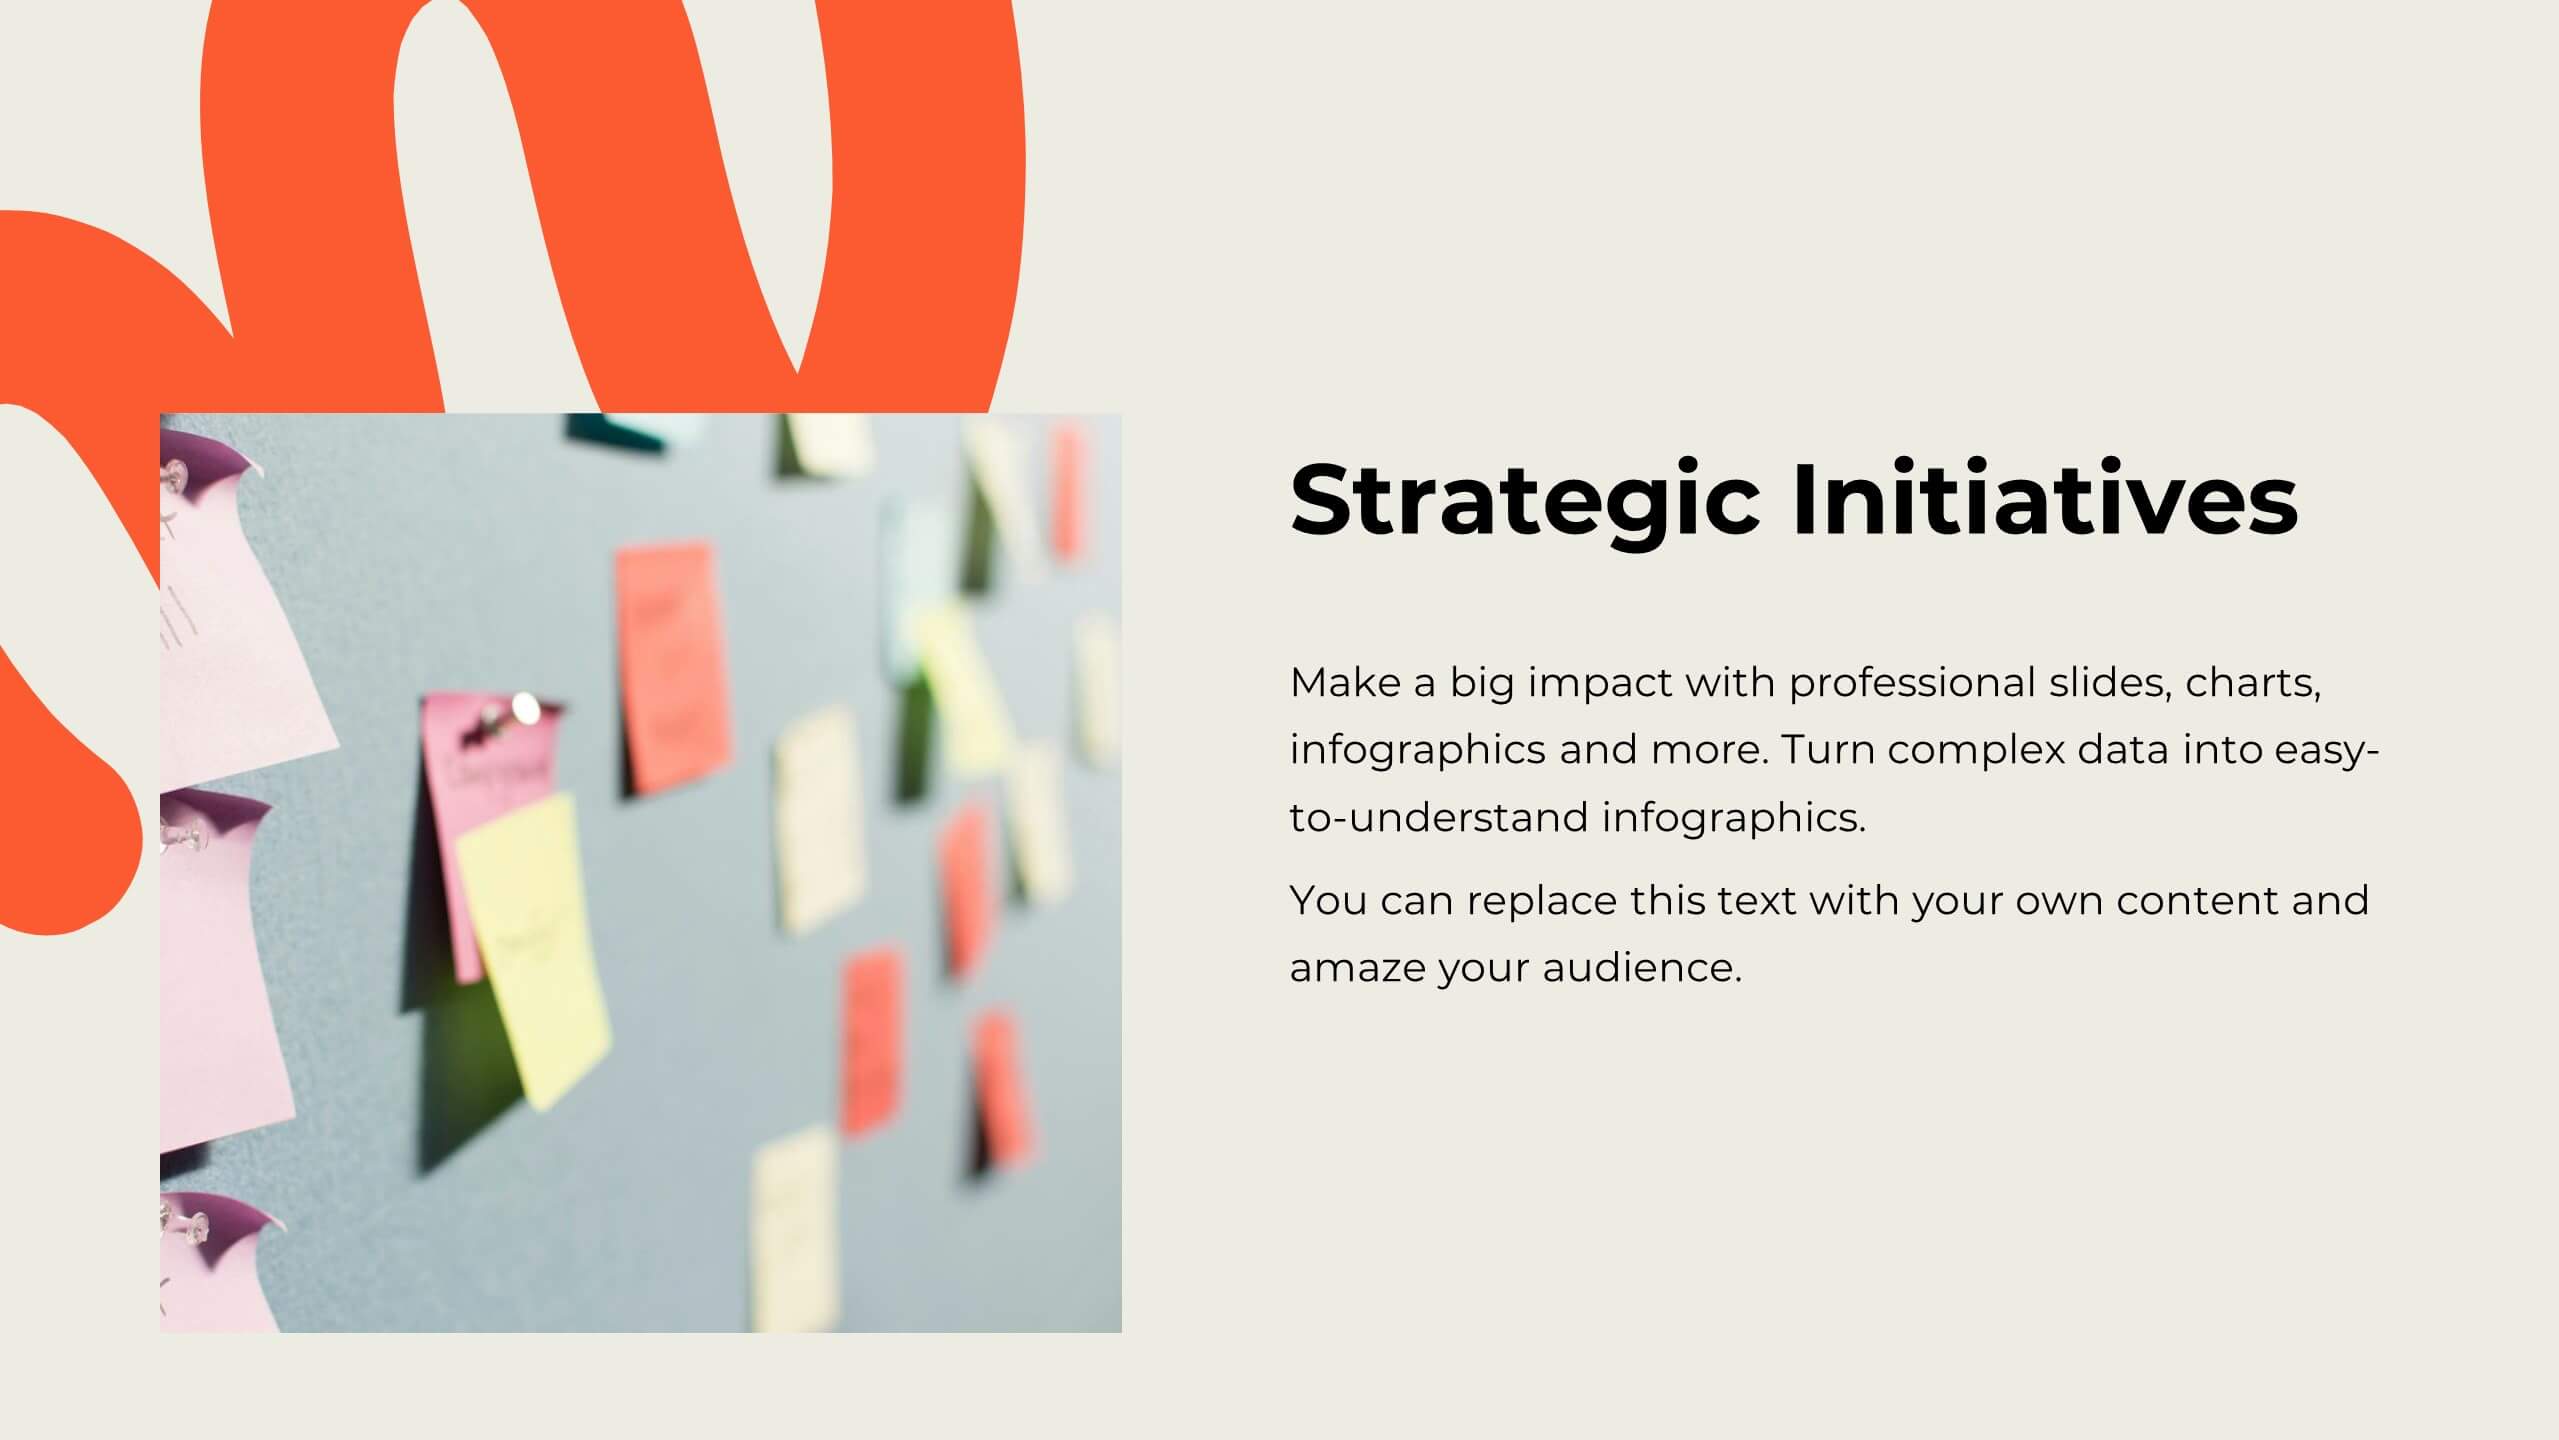
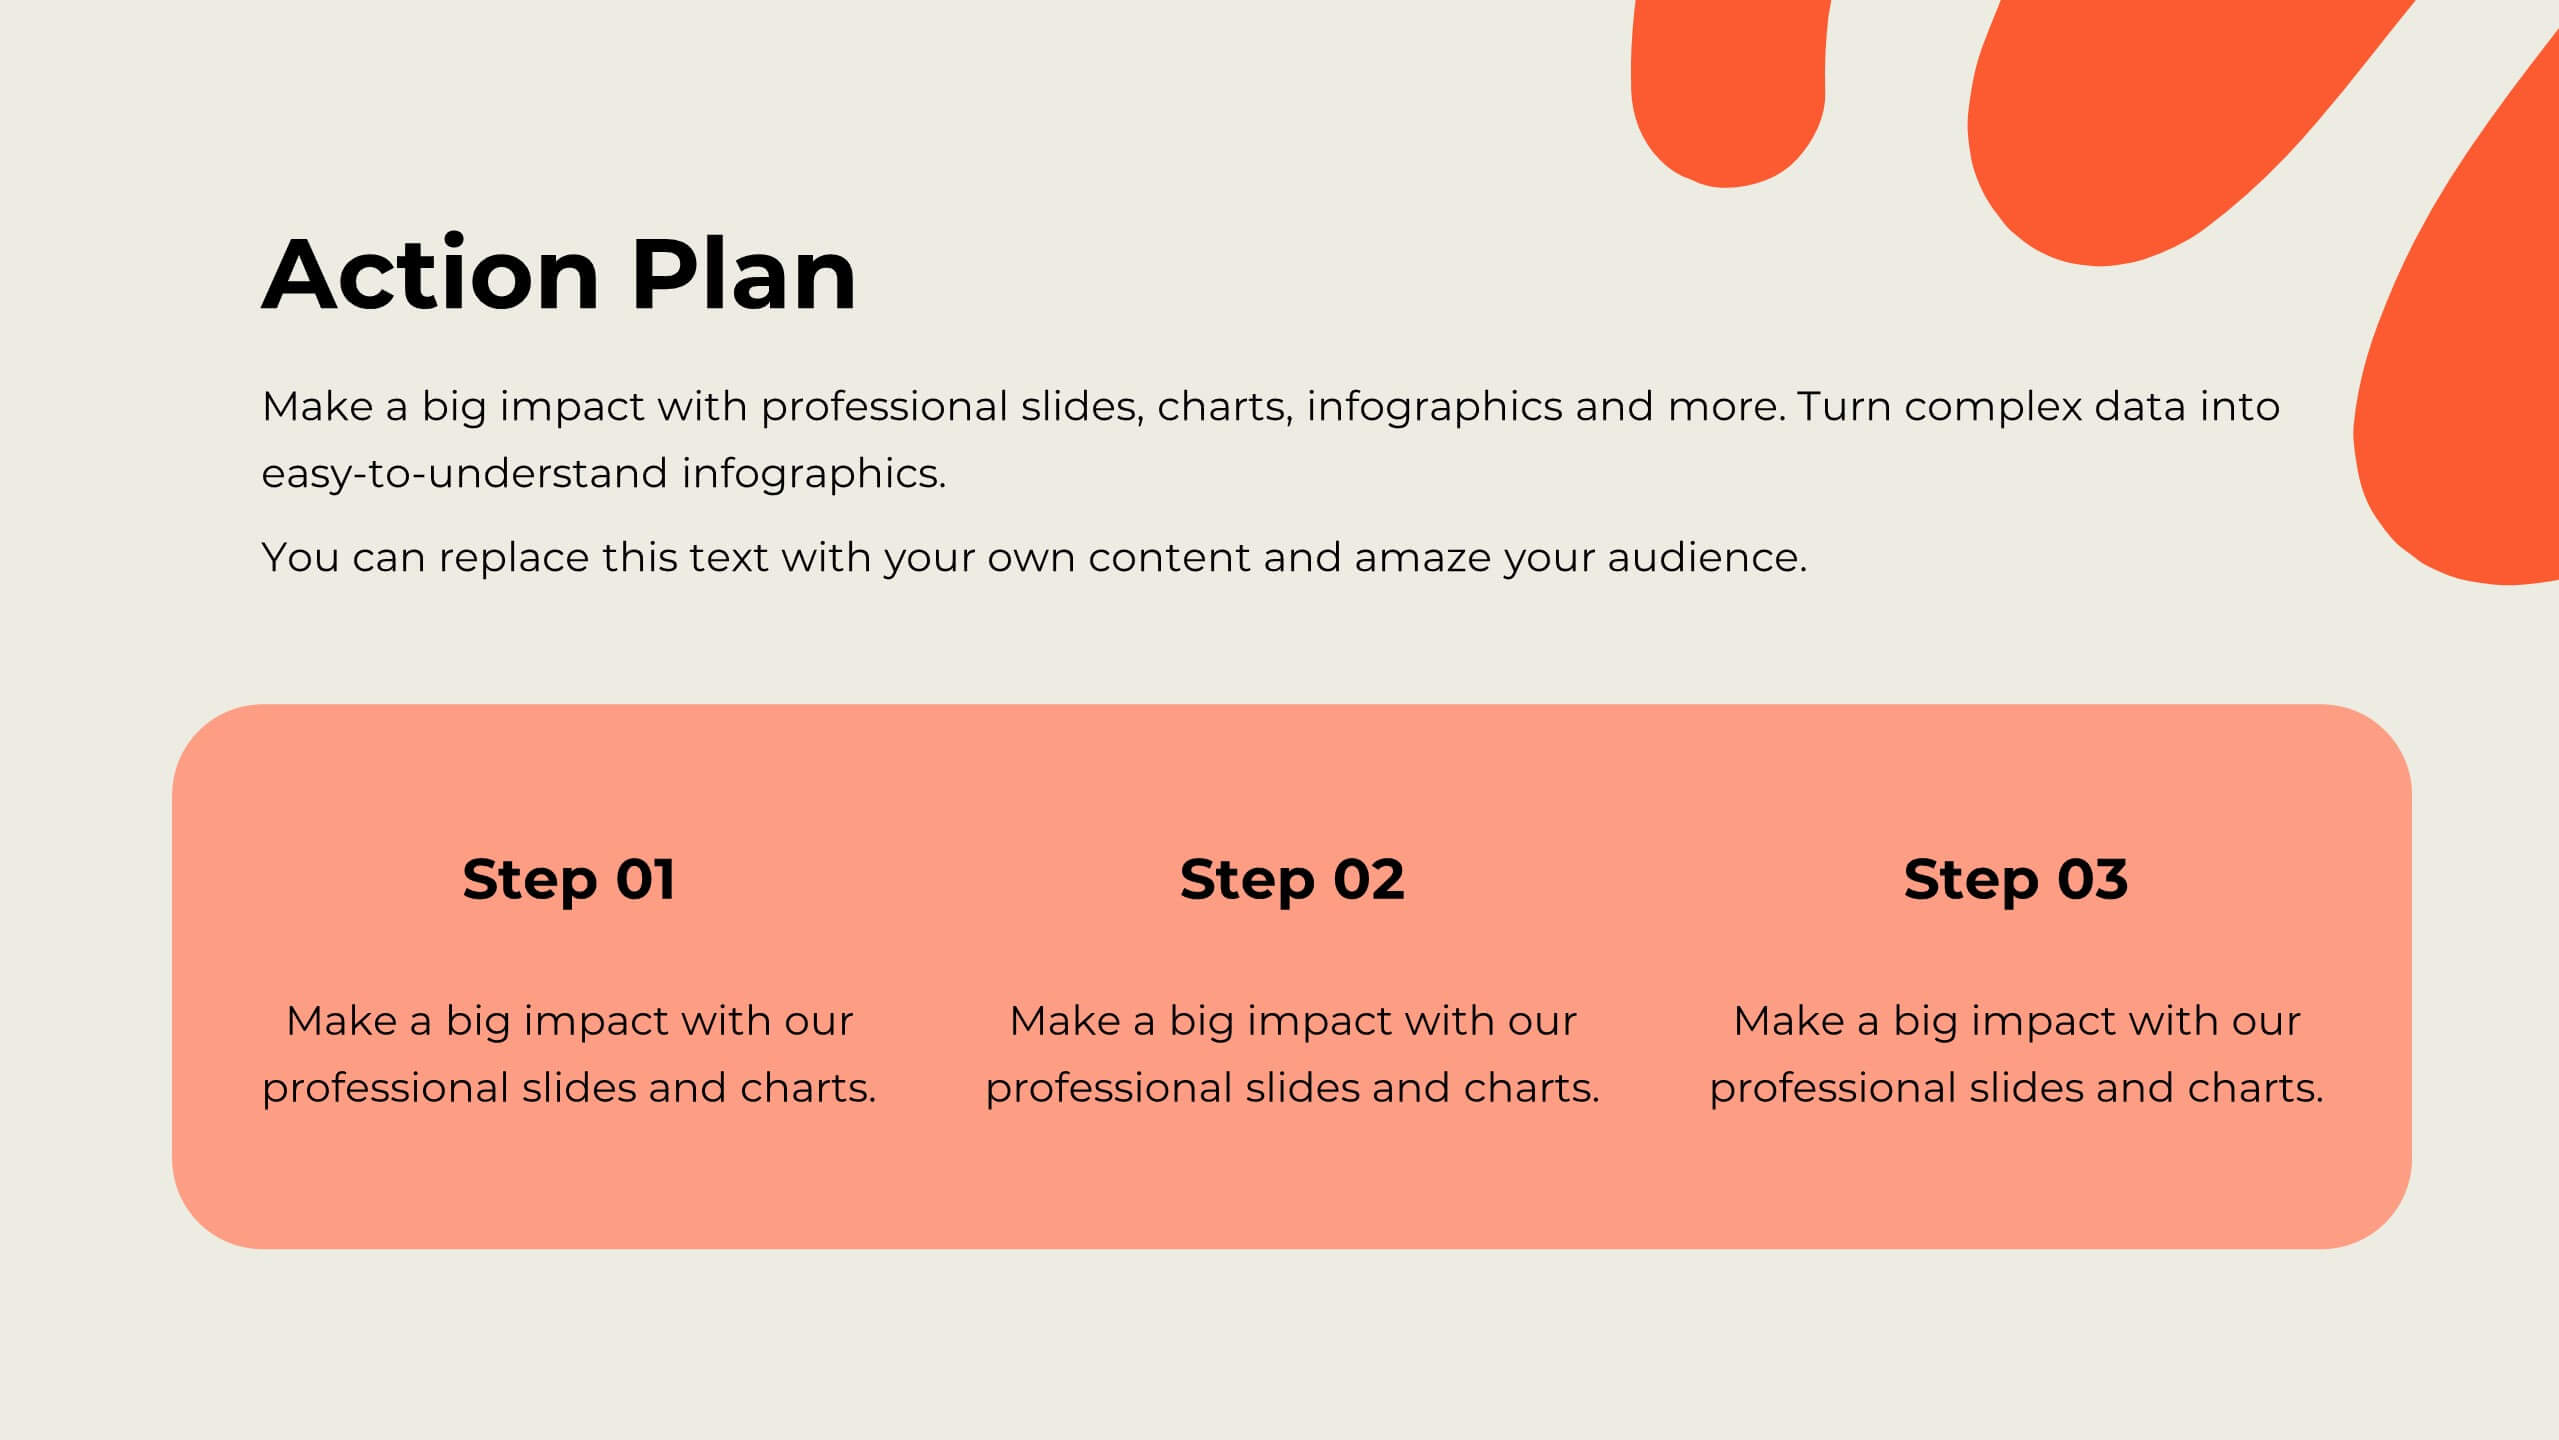
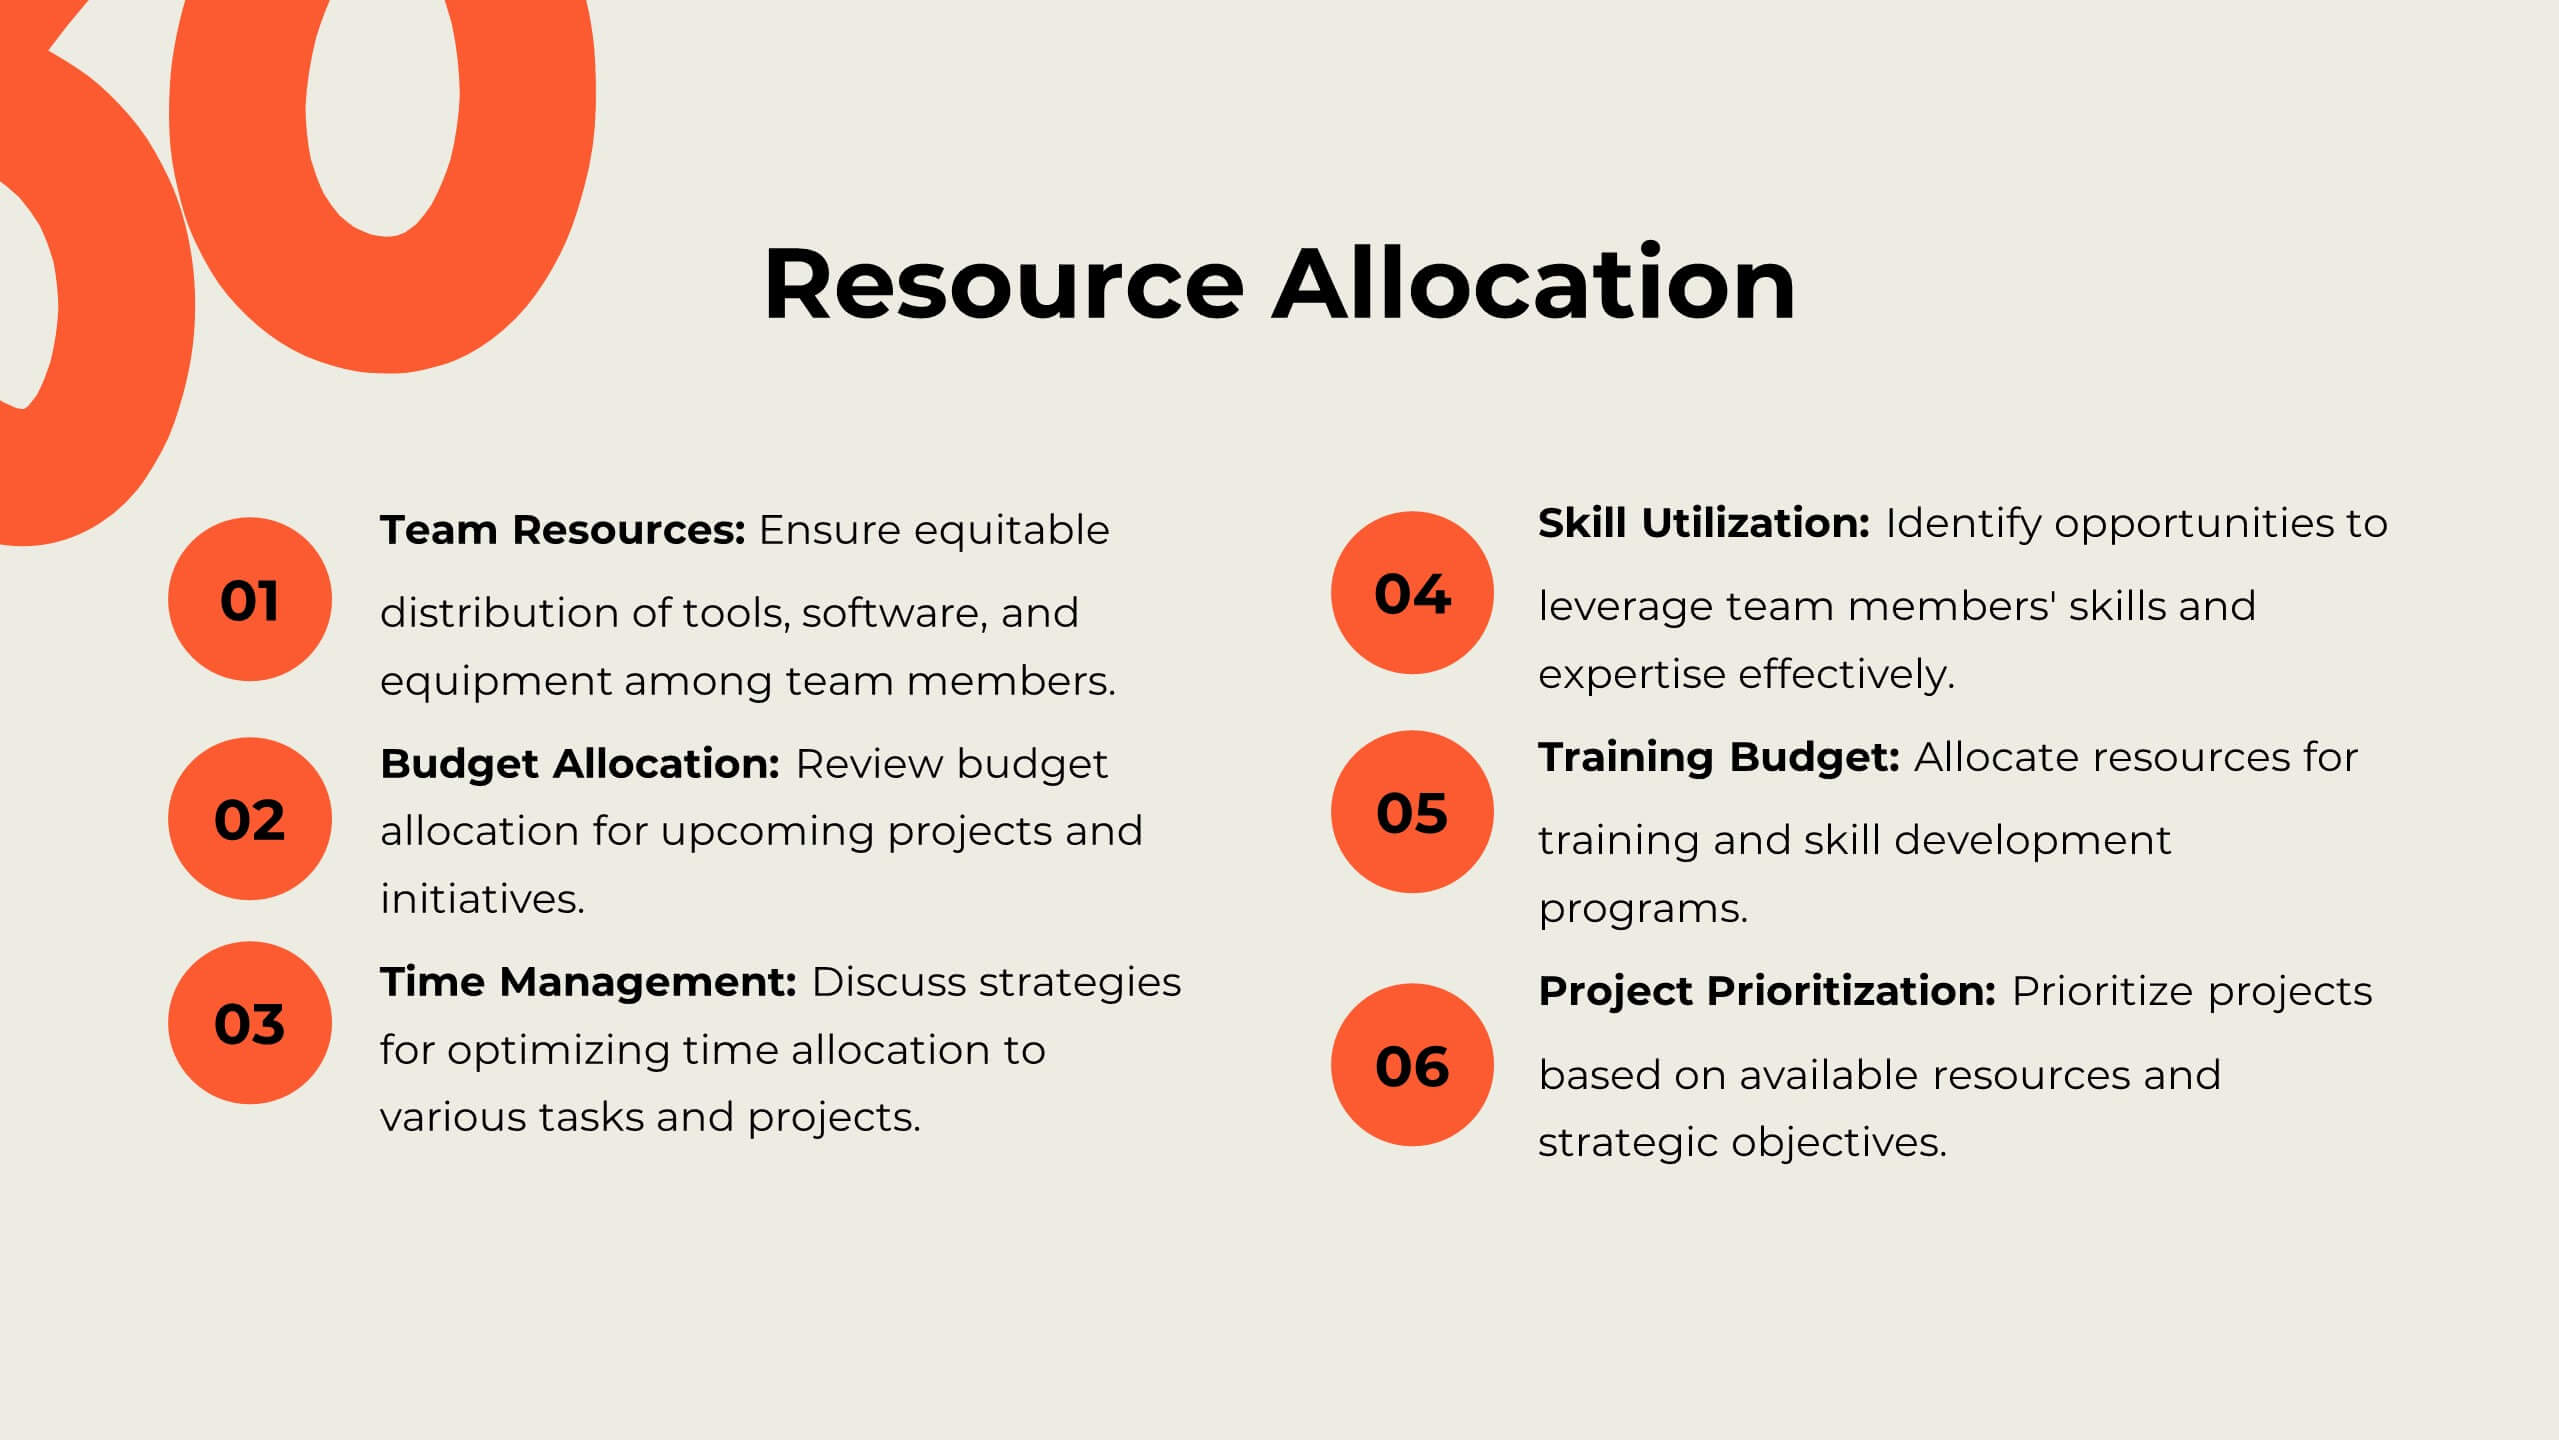
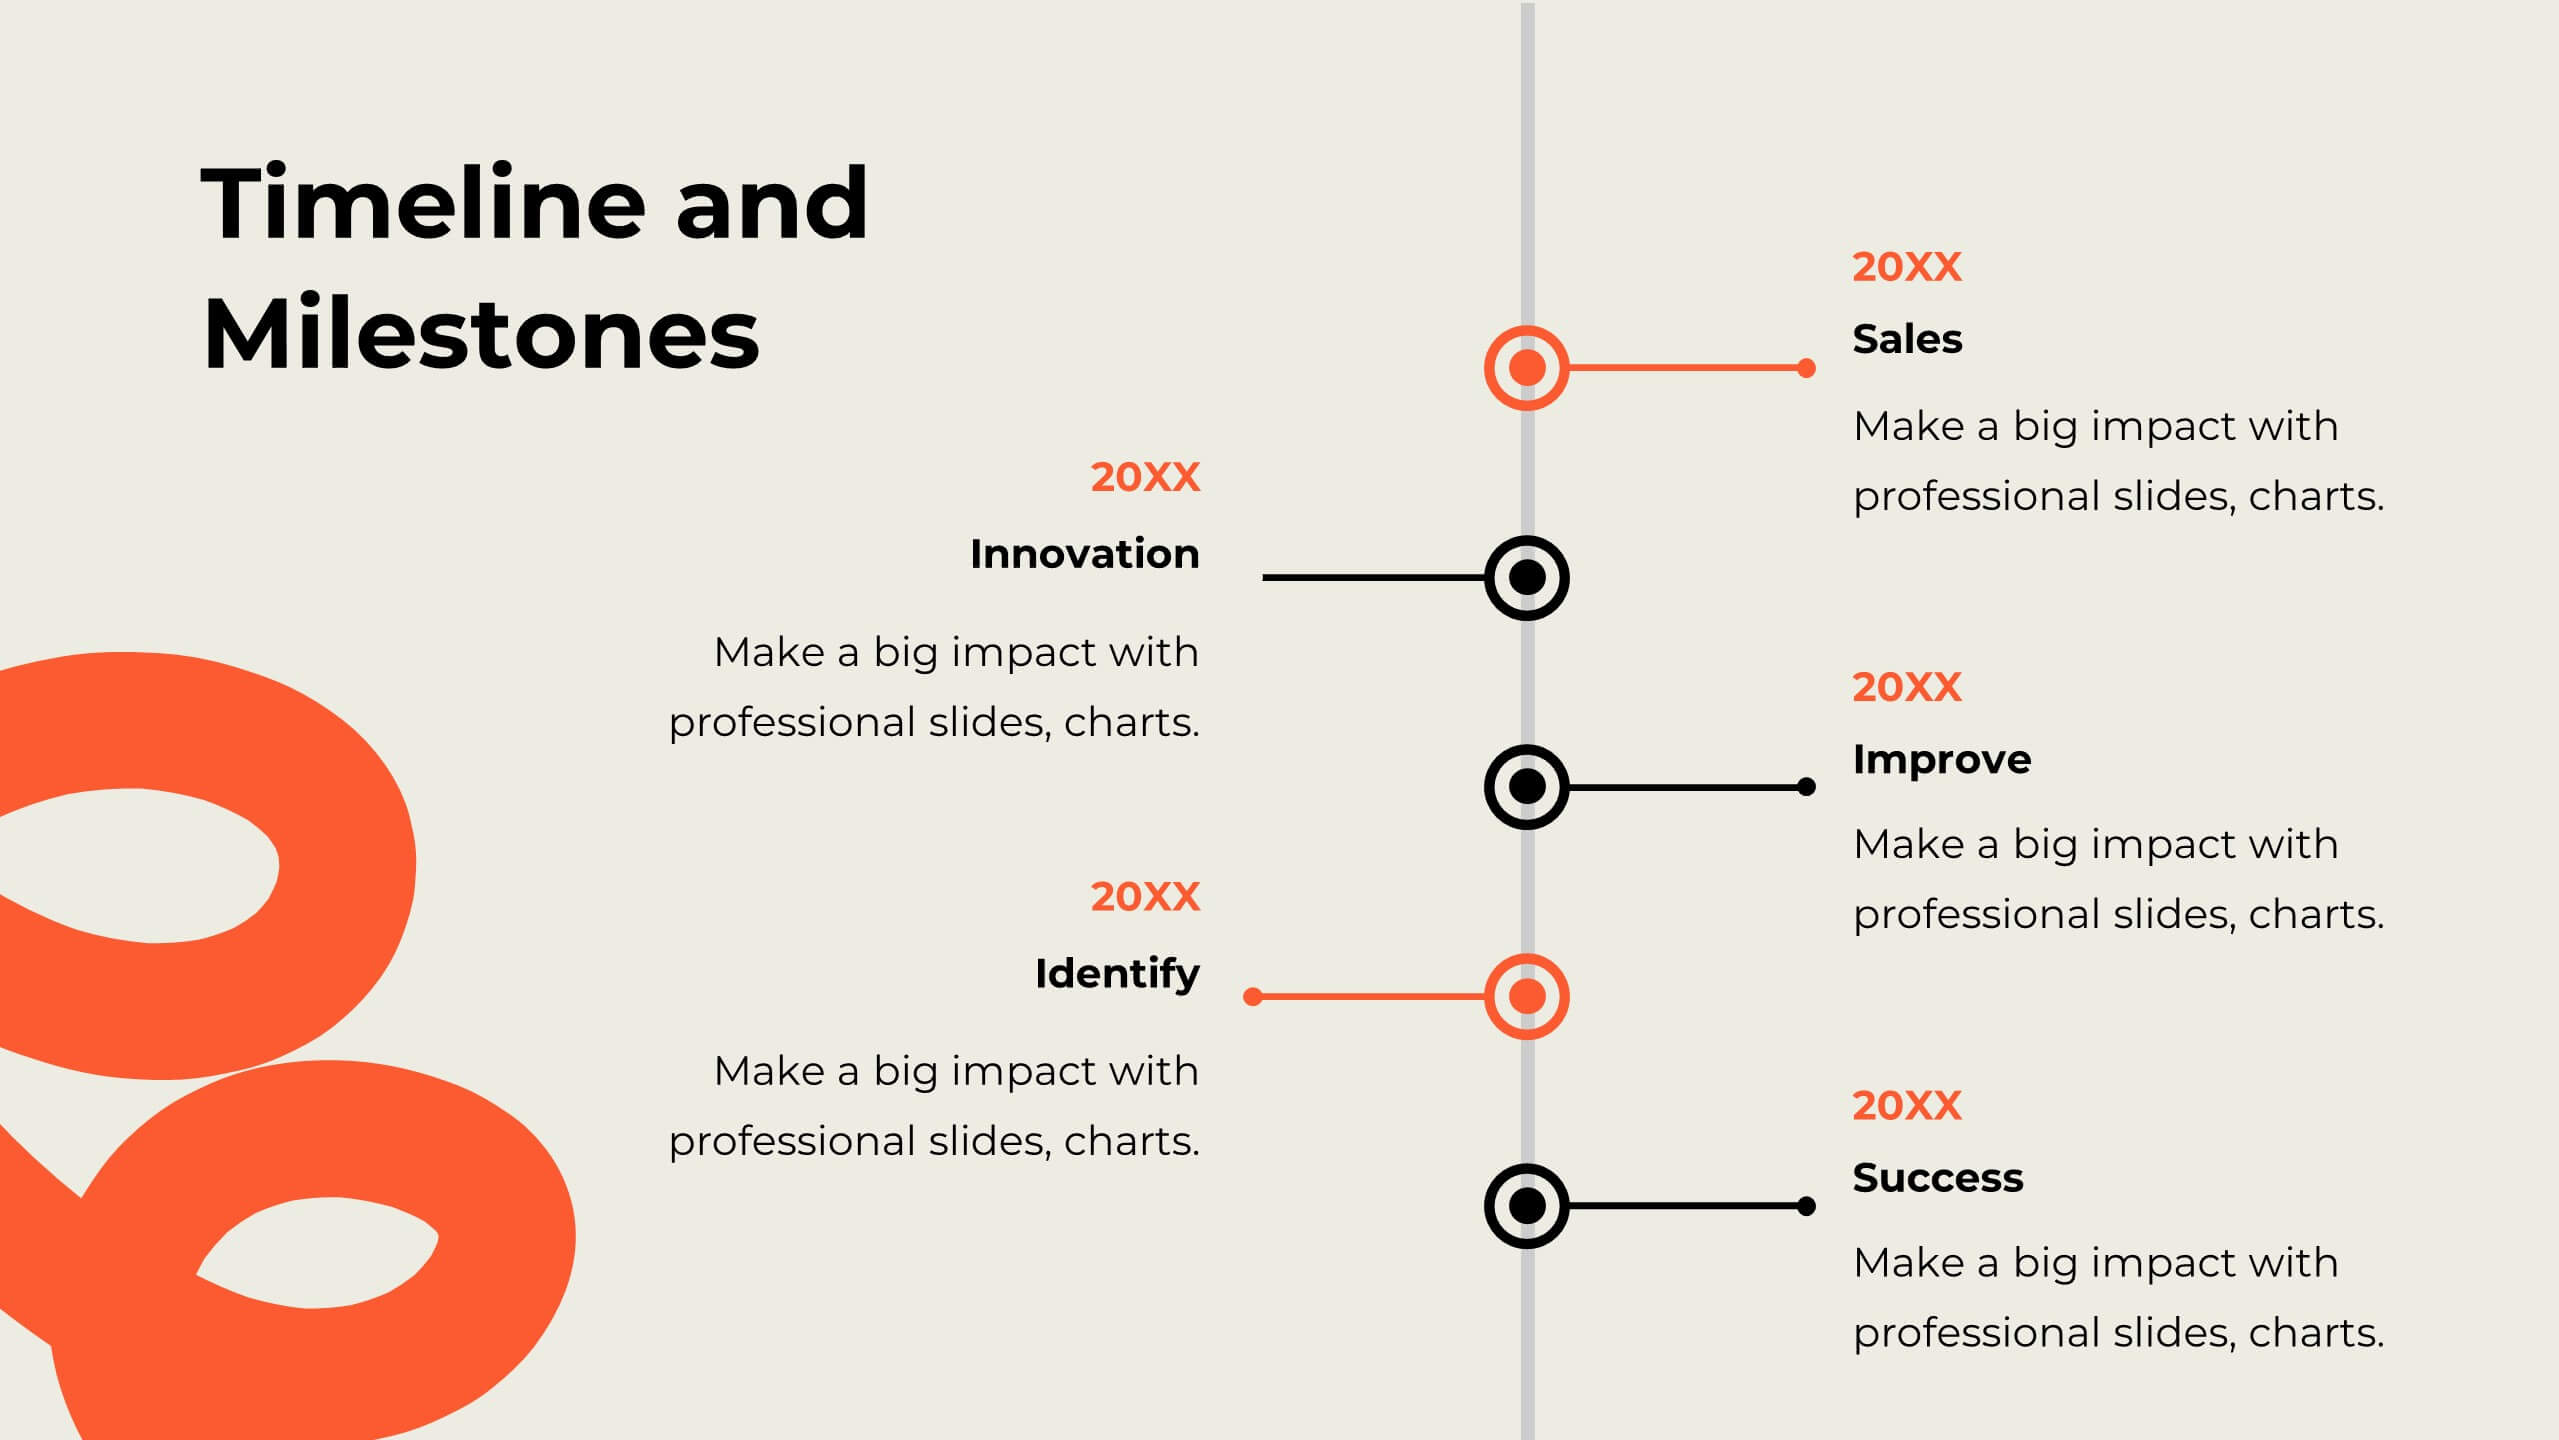
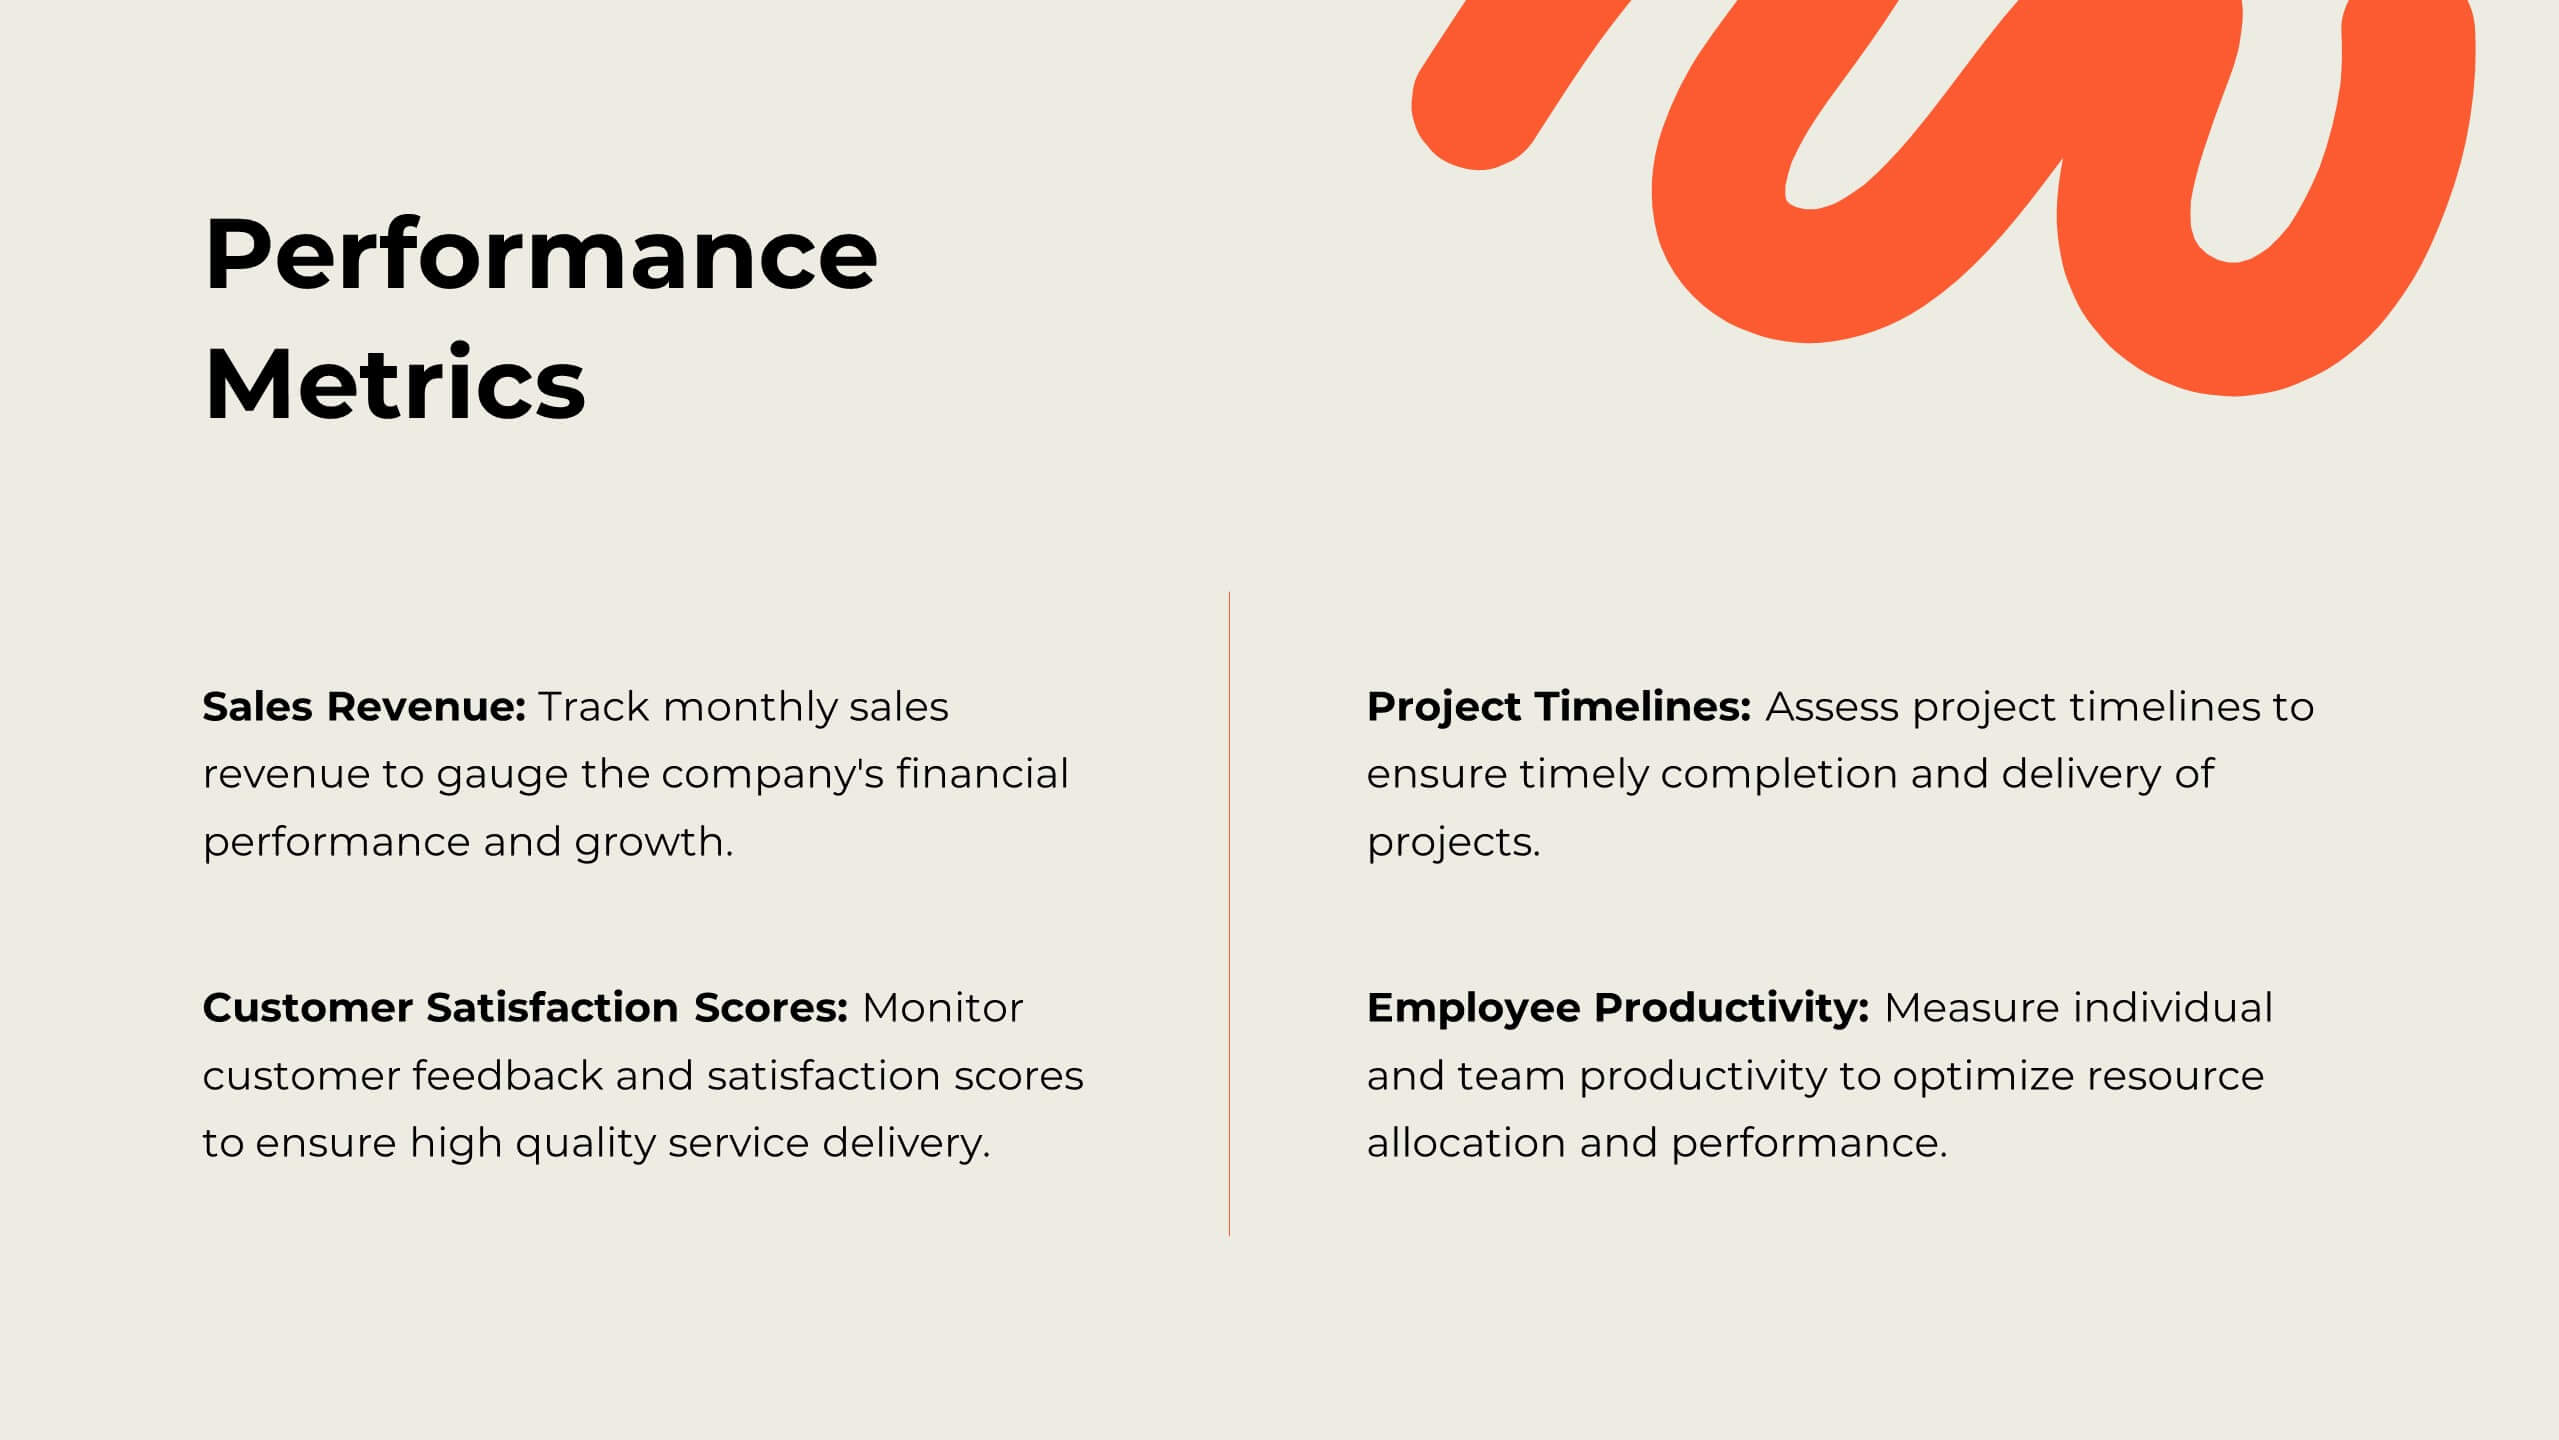
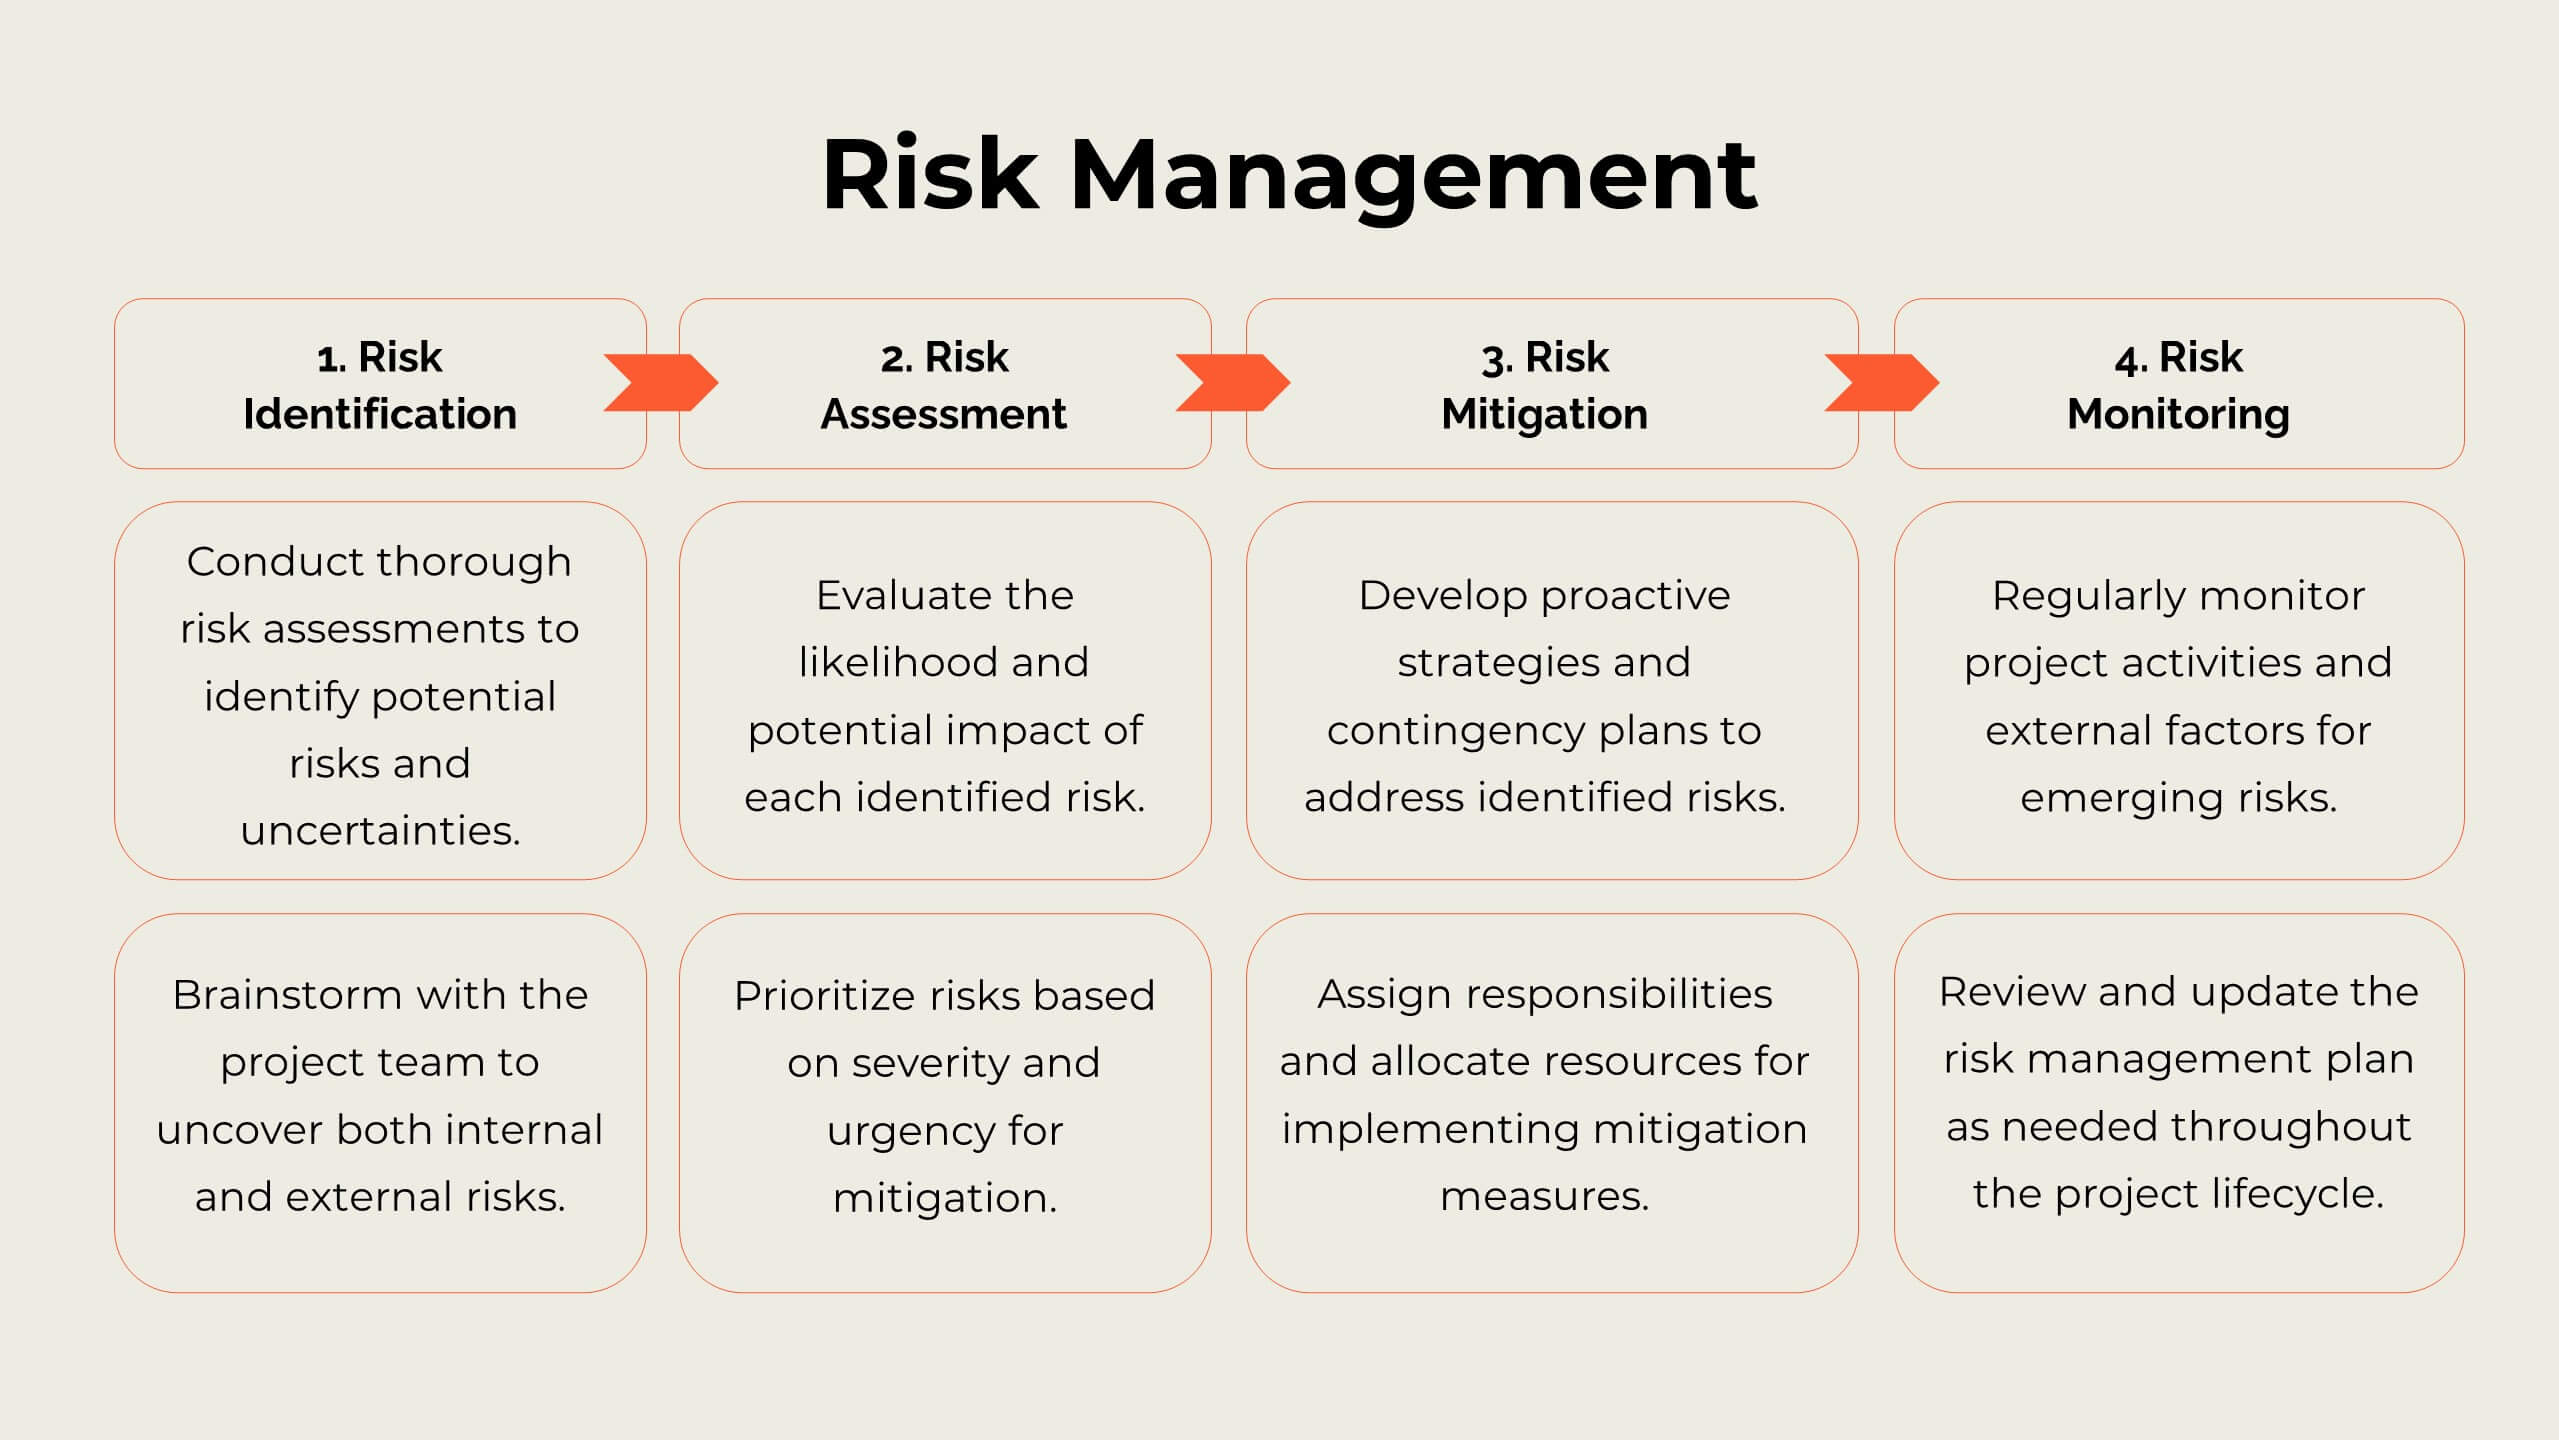
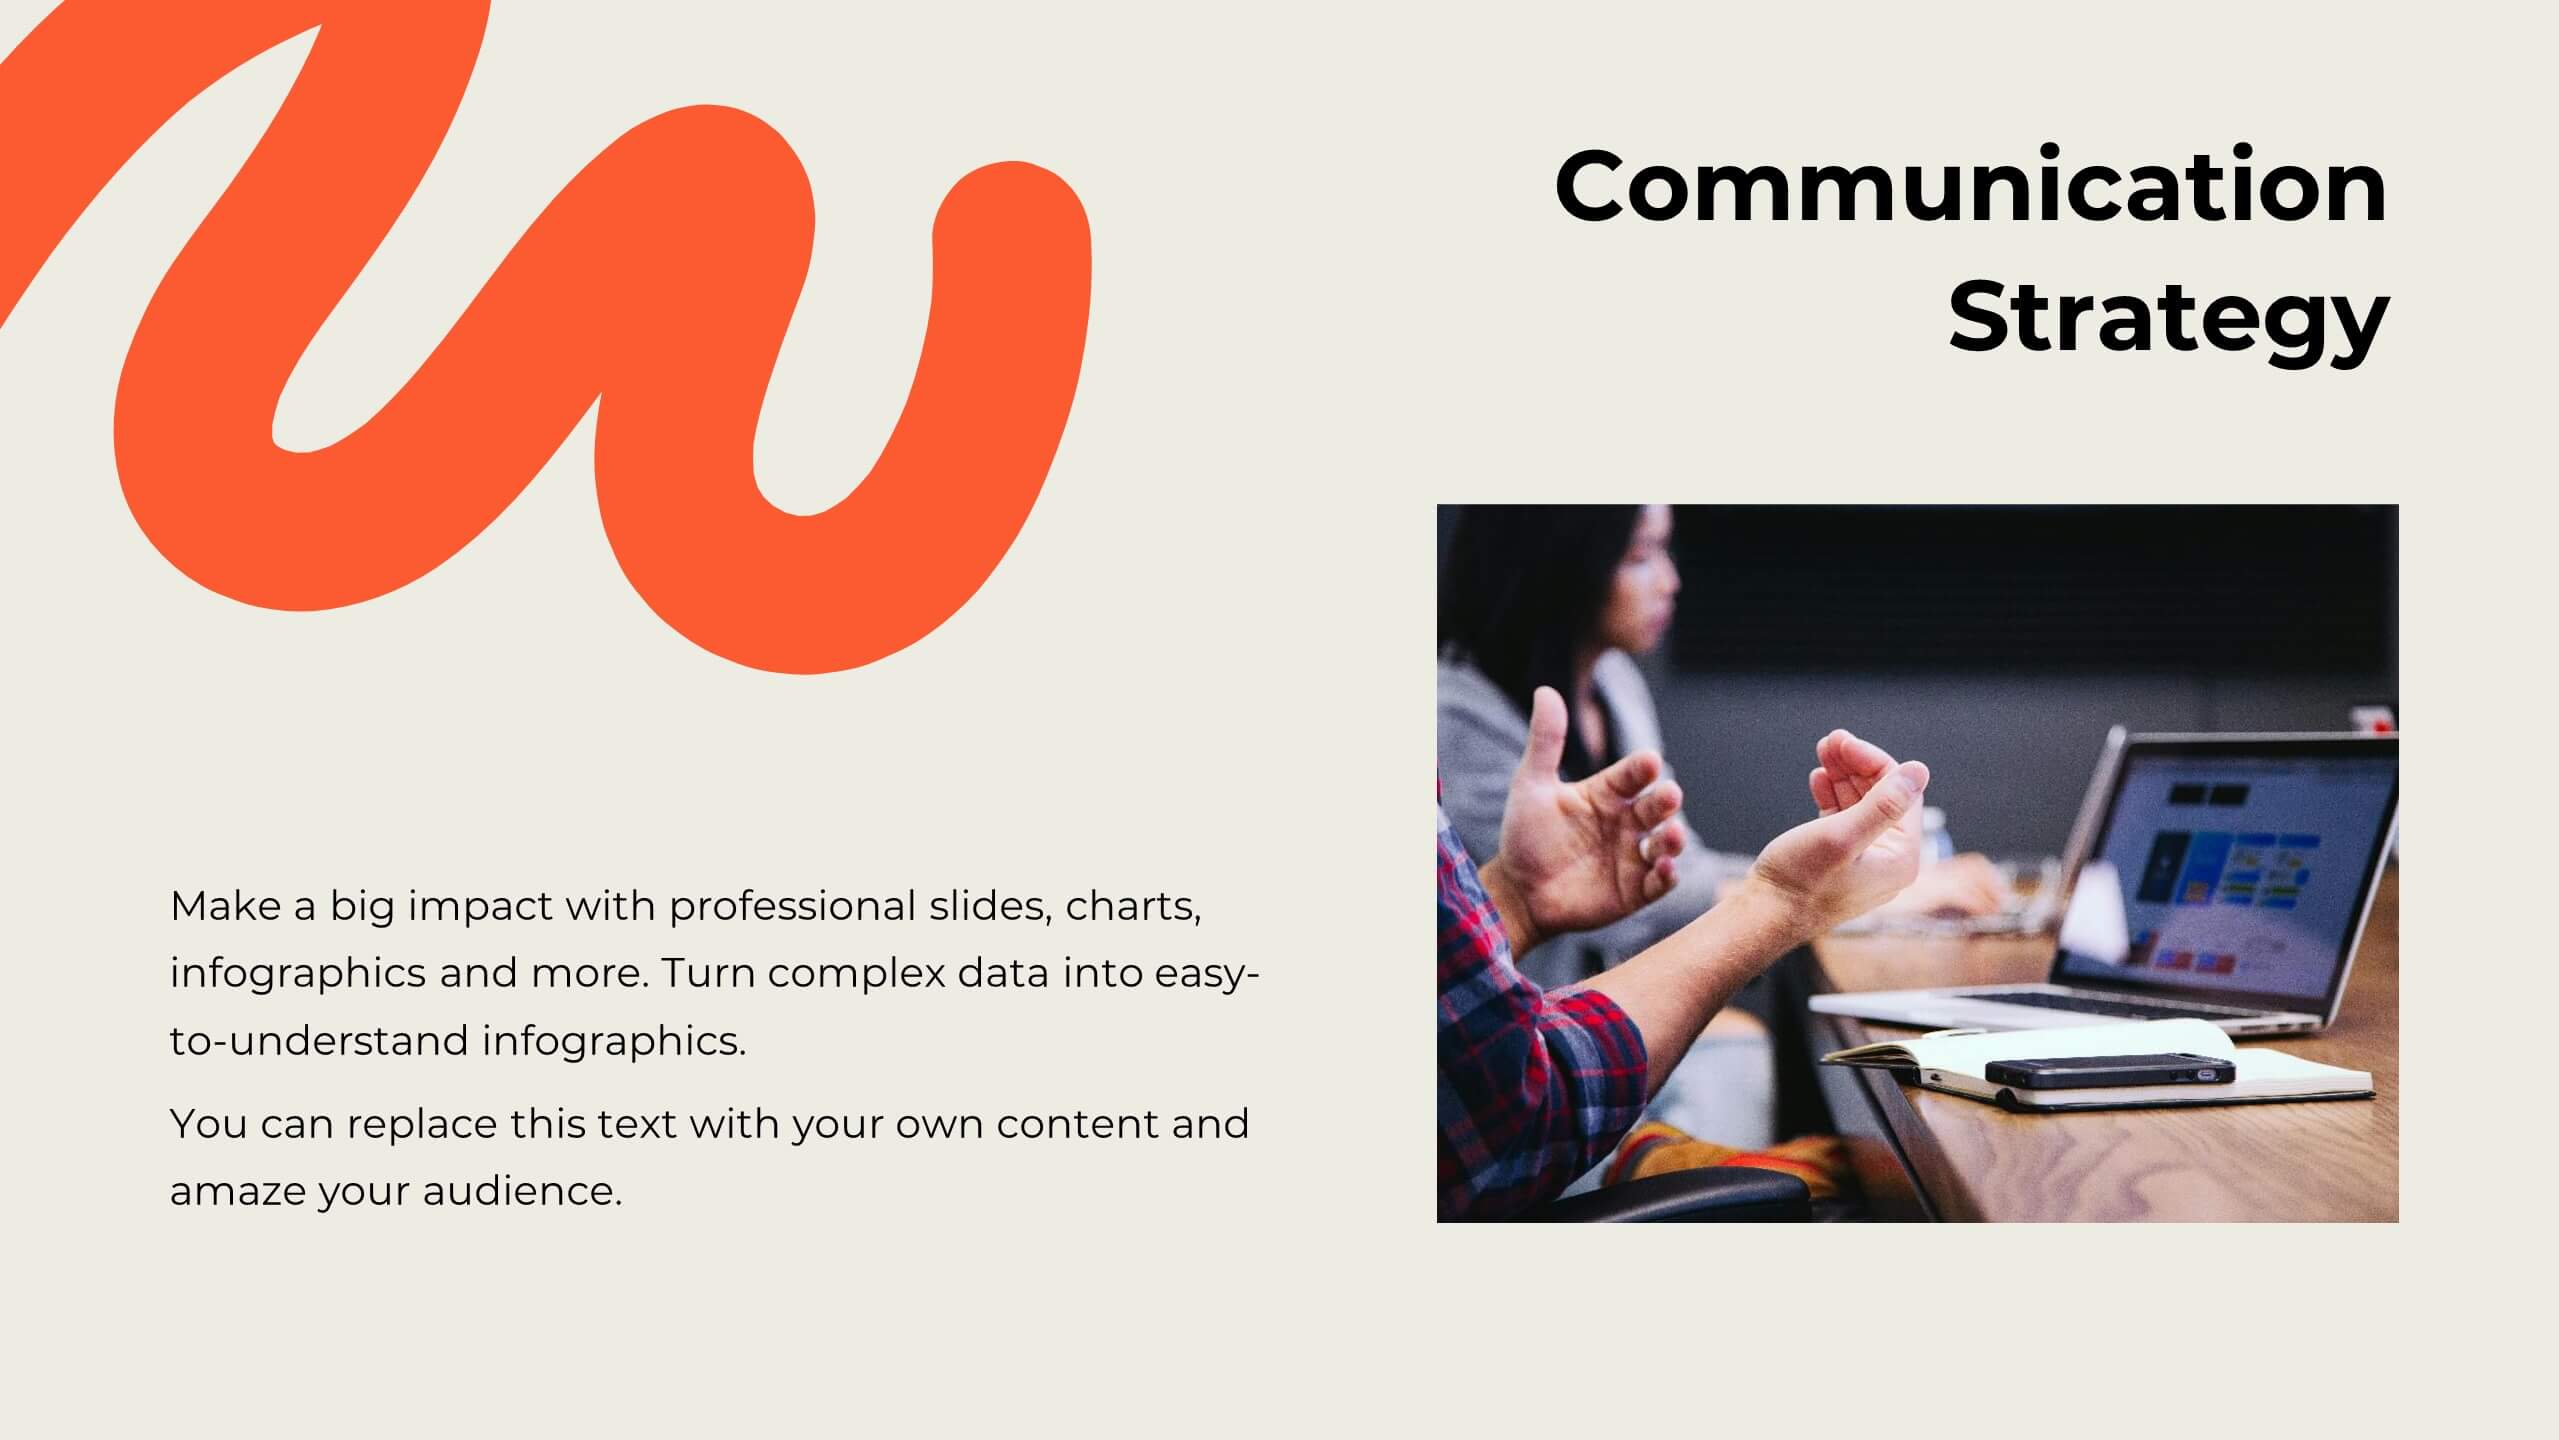
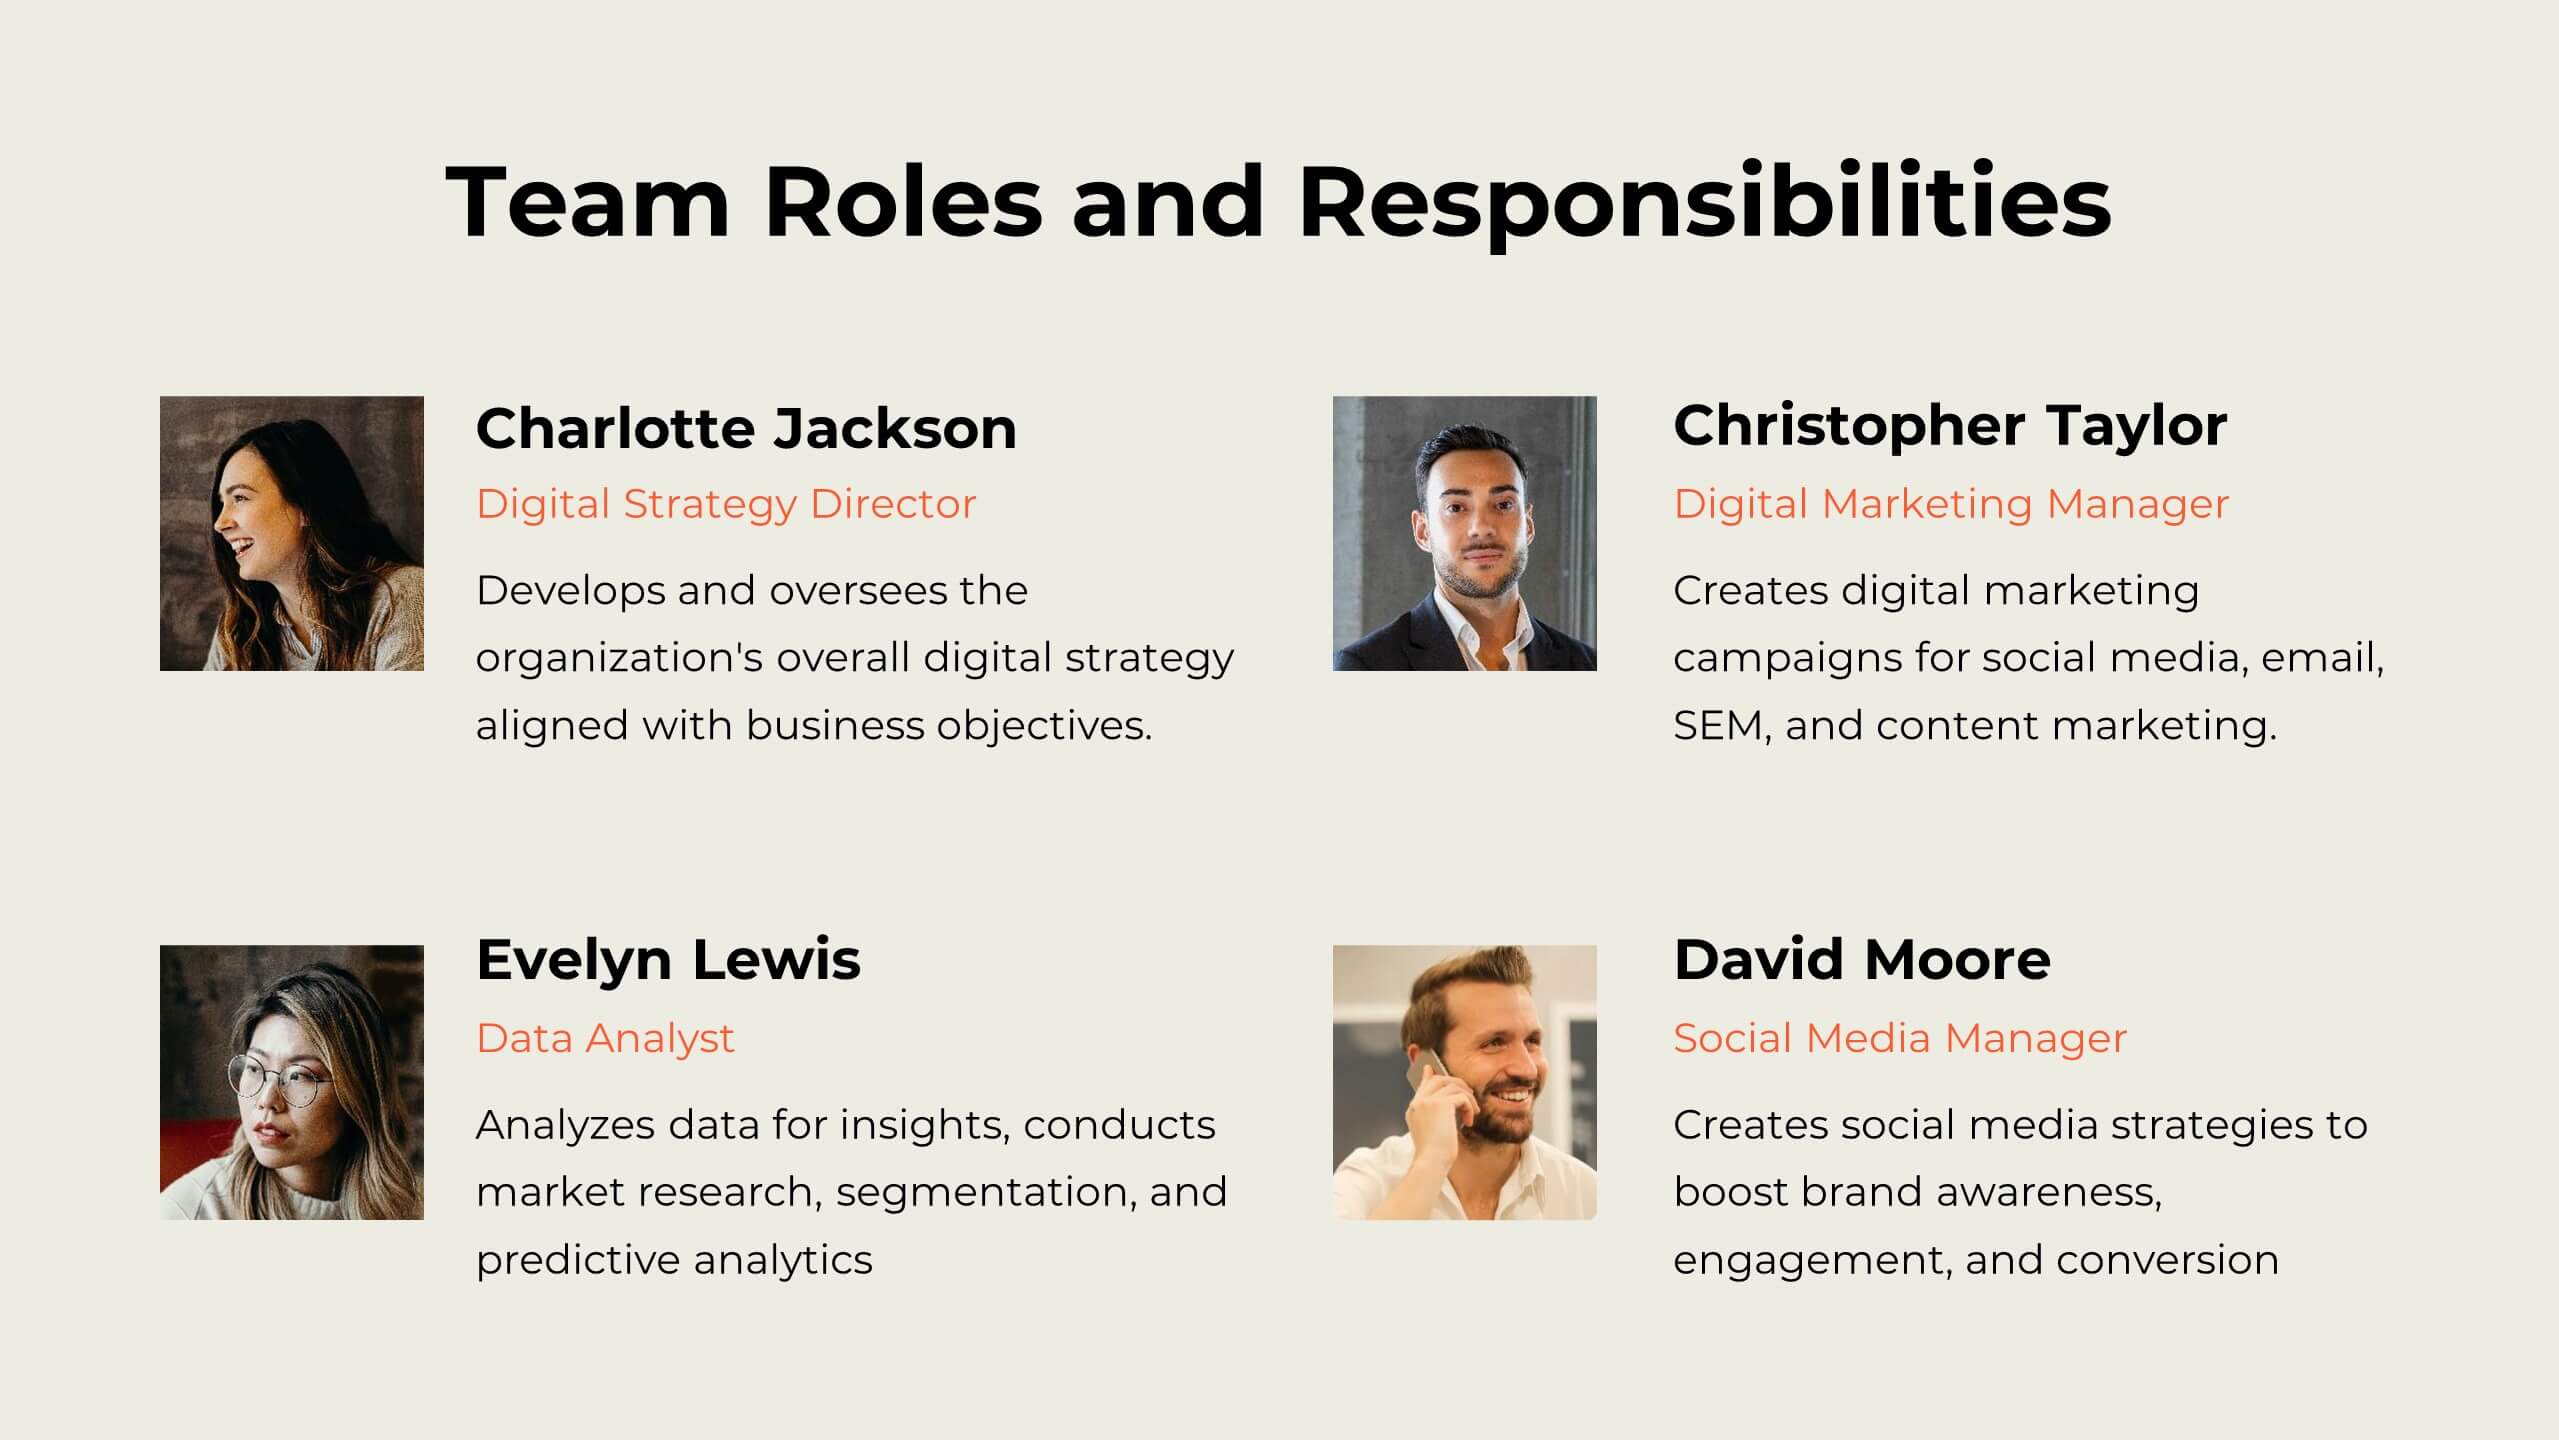
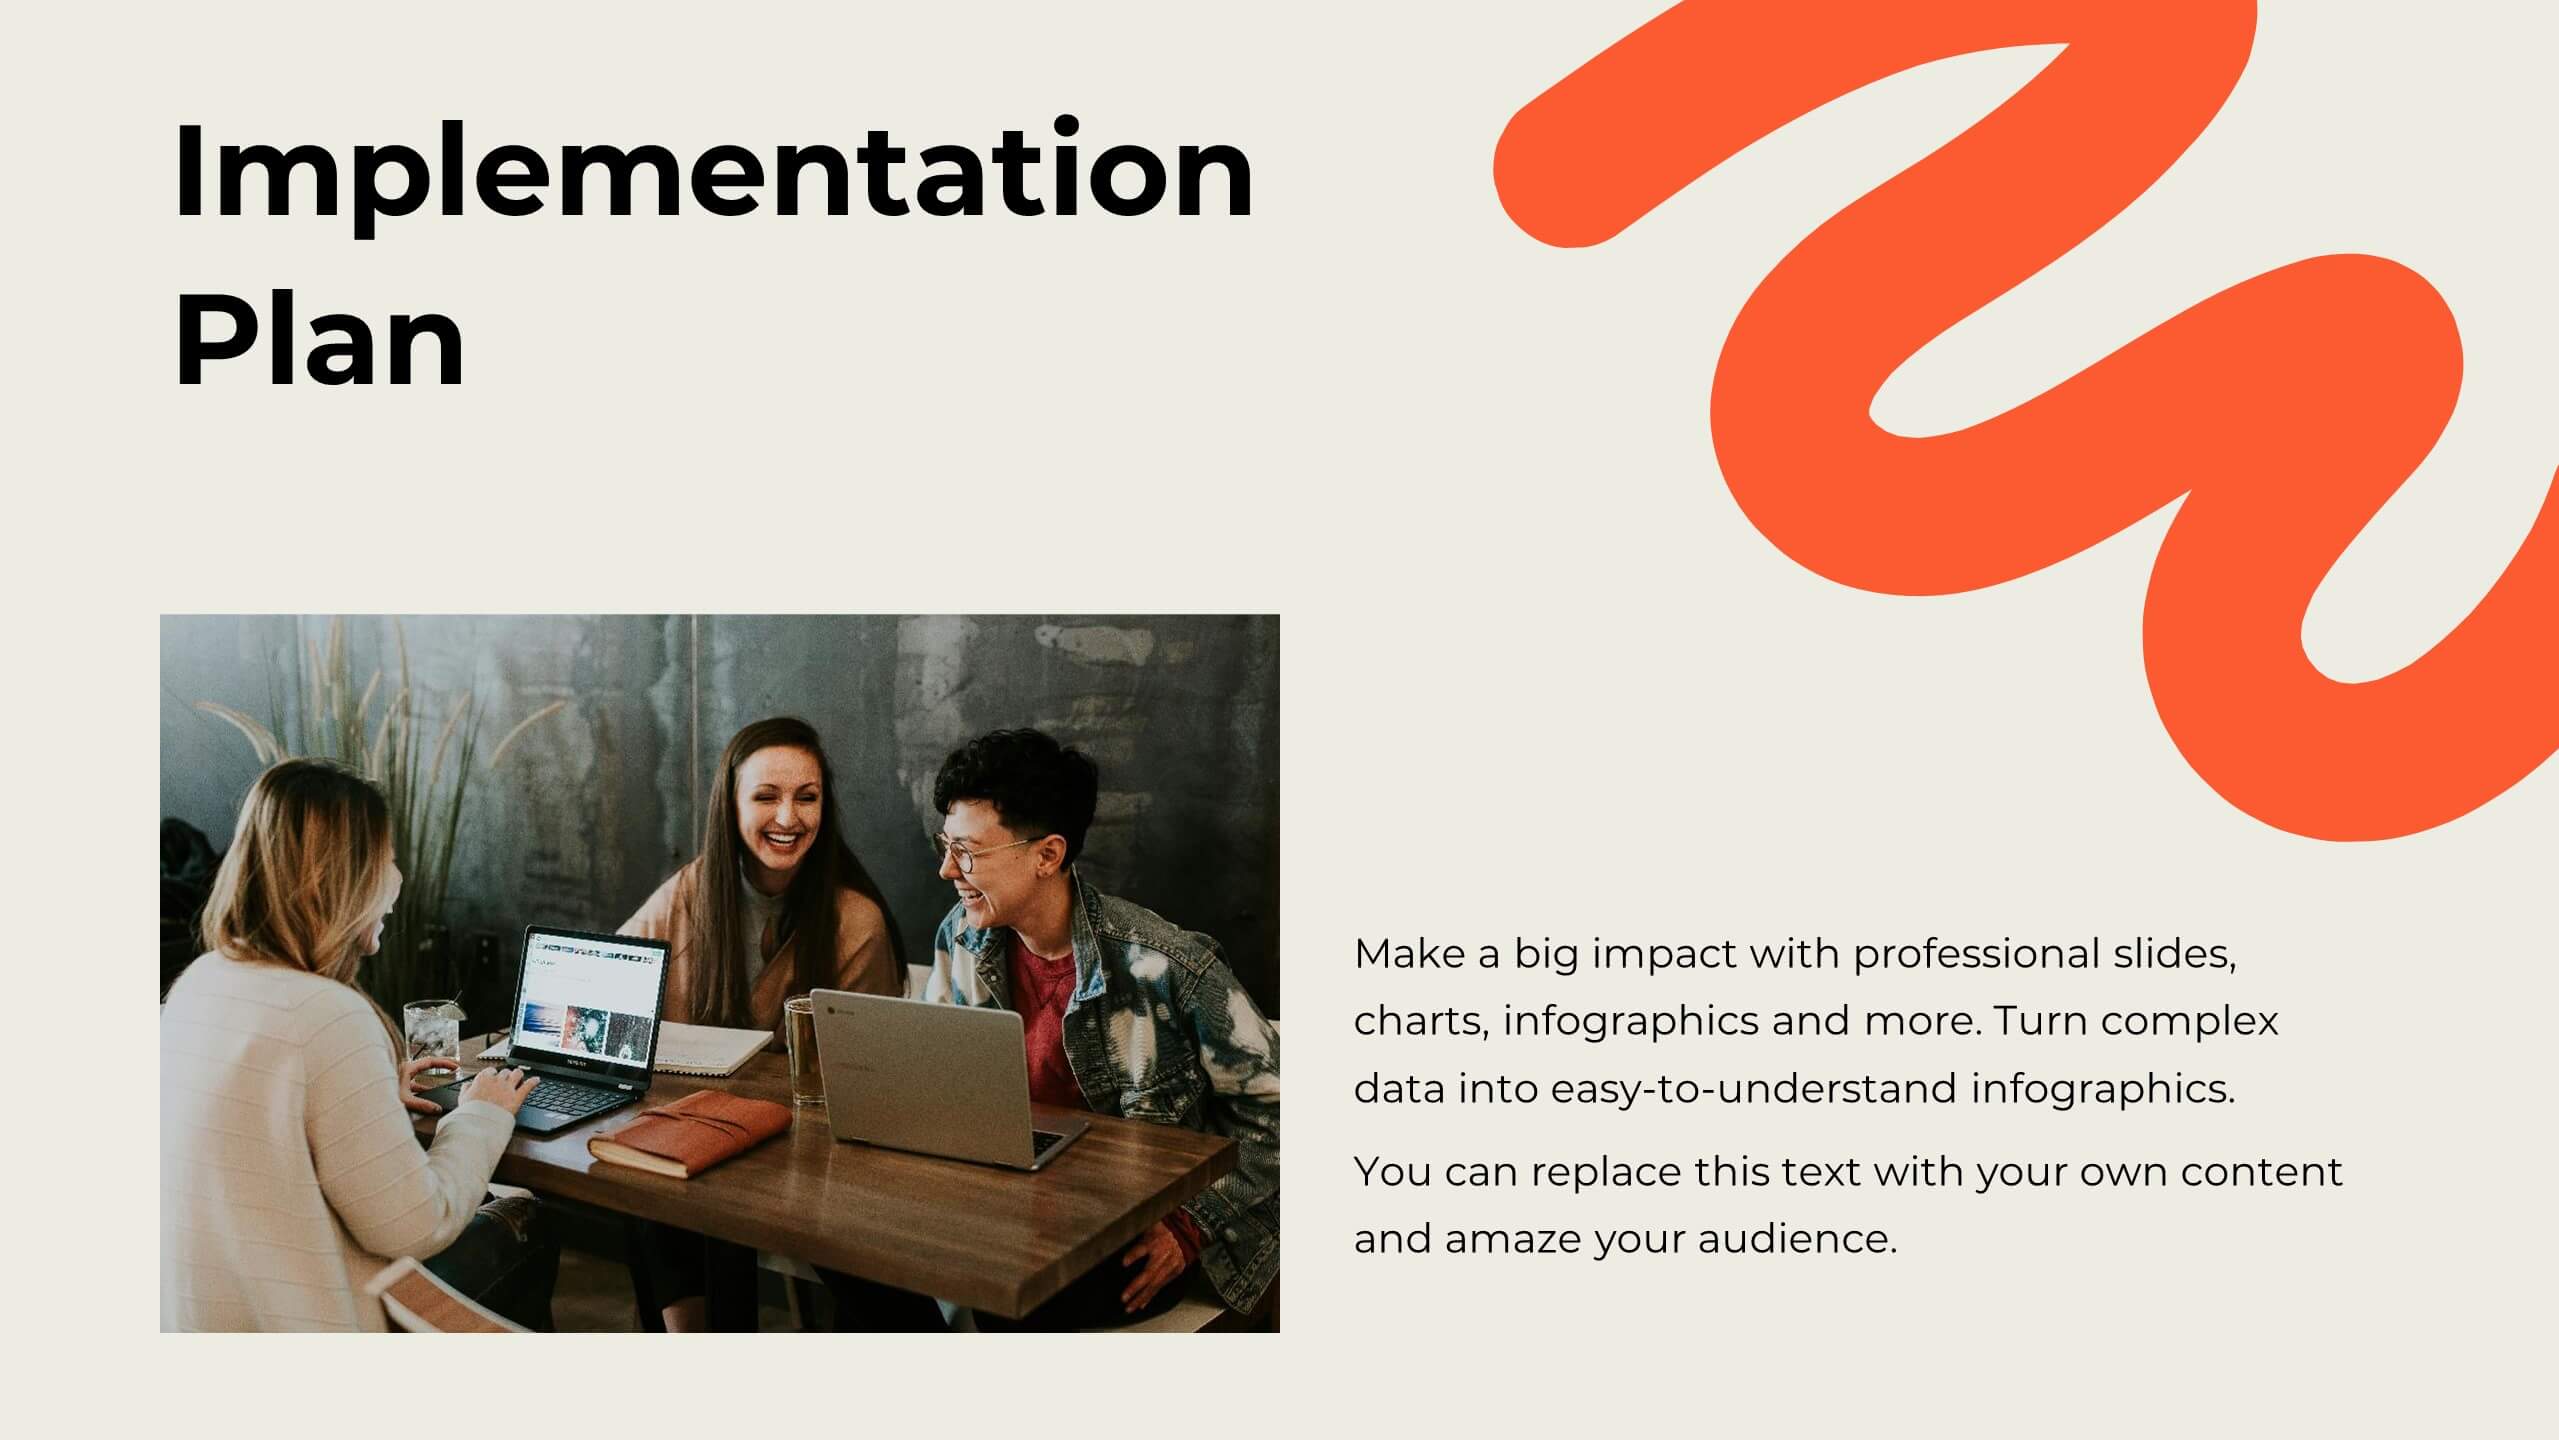
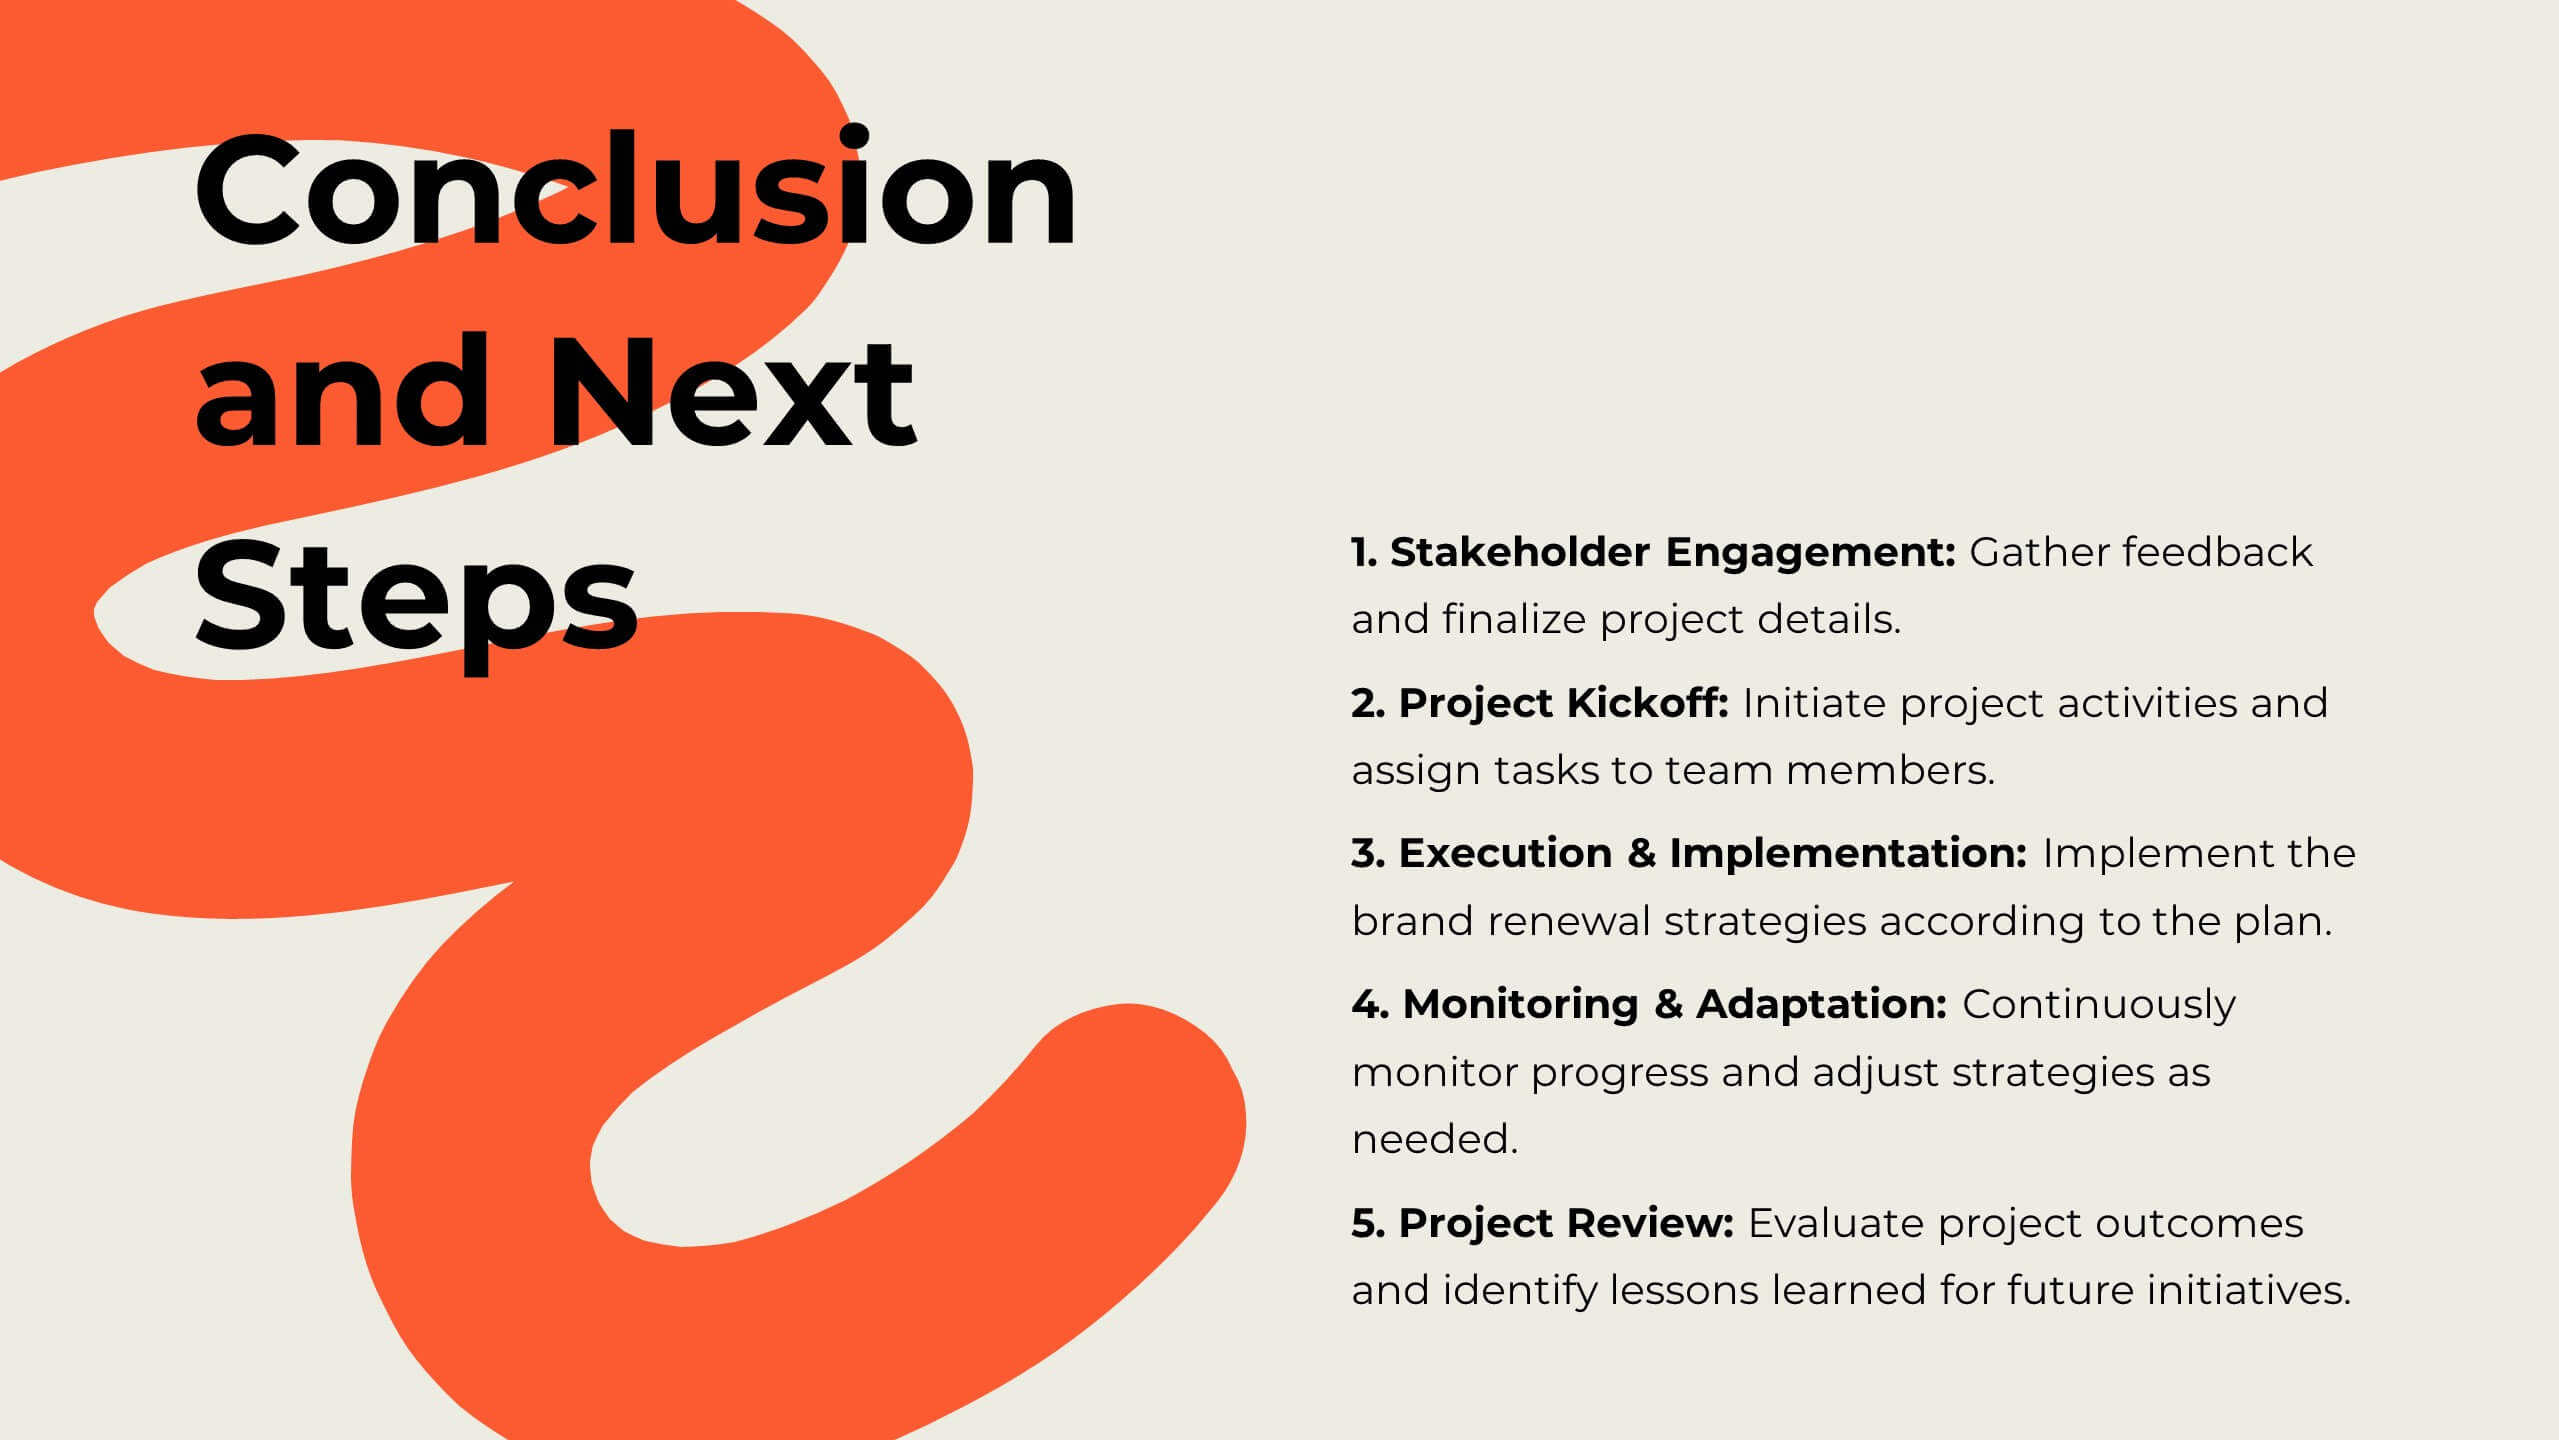
Mirage Digital Strategy Presentation
Revitalize your marketing efforts with this dynamic strategy plan template! Perfect for outlining objectives, competitive analysis, and target audience identification, it includes slides for SWOT analysis, resource allocation, and implementation plans. Engage stakeholders with vibrant visuals and comprehensive content. Compatible with PowerPoint, Keynote, and Google Slides for seamless presentations on any platform.


3 diapositivas
Strategic Planning and Business Model Presentation
Present your business roadmap with clarity using this Strategic Planning and Business Model slide. Featuring a modular grid layout, it allows you to break down initiatives, objectives, and action items into digestible segments. Perfect for business strategy sessions, planning workshops, or executive reports. Fully editable in PowerPoint, Canva, and Google Slides.


10 diapositivas
Hierarchy Tree Structure Slide Presentation
Bring your ideas to life with a dynamic visual flow that connects every stage of your business strategy. Perfect for mapping growth, processes, or team structures, this clean and modern layout keeps your data clear and engaging. Fully compatible with PowerPoint, Keynote, and Google Slides for effortless customization.
4 diapositivas
Team Performance and Progress Tracker Presentation
Track momentum, highlight achievements, and visualize team success with this clean performance tracker layout. Featuring gauge meters and progress bars, this slide makes it easy to present productivity metrics, goal progress, or task completion at a glance. Fully editable and compatible with PowerPoint, Keynote, and Google Slides.


5 diapositivas
Nutrition Facts Infographics
Nutrition facts provide important information about the nutritional content of food and beverages. This helps individuals make informed decisions about their dietary choices and understand the impact of food on their health. These infographic templates are designed to present essential information about nutrition and healthy eating habits. These infographics are suitable for nutritionists, dietitians, health educators, or anyone looking to communicate key facts and guidelines about nutrition in a clear and engaging manner. Compatible with Powerpoint, Keynote, and Google Slides, these are fully customizable.


12 diapositivas
Visual Data Representation Bubble Map Presentation
Present complex data effectively with the Visual Data Representation Bubble Map presentation. This template organizes information into clear, interconnected segments, making it ideal for analytics, business insights, and strategic planning. Compatible with PowerPoint, Keynote, and Google Slides.


5 diapositivas
Data Density Visualization via Heat Mapping Presentation
Turn complex datasets into clear insights with the Data Density Visualization via Heat Mapping Presentation. This layered area chart template is perfect for showcasing data intensity over time—ideal for monthly trends, usage spikes, or multi-variable performance analysis. Fully customizable in Canva, PowerPoint, Keynote, and Google Slides.


6 diapositivas
Eco-Friendly Operations and Compliance
Promote sustainable practices with the Eco-Friendly Operations and Compliance Presentation. This sleek, leaf-themed diagram is perfect for showcasing environmentally responsible workflows, green policies, or ESG initiatives. Designed to visually align with eco-branding, it's easy to customize in PowerPoint, Keynote, or Google Slides. Ideal for internal teams or client presentations.


6 diapositivas
Project Proposal Slide Deck Presentation
Make your next pitch unforgettable with a clean, structured layout that turns complex project ideas into a clear visual story. Ideal for presenting timelines, goals, or performance metrics, it helps you communicate your proposal with confidence and precision. Fully compatible with PowerPoint, Keynote, and Google Slides for effortless editing.


7 diapositivas
SCRUM Master Infographic Presentation
A Scrum infographic provides an overview of all the key components of the Scrum framework and helps teams and individuals understand this powerful agile methodology. This Infographic template is fully editable and can be easily customized to reflect your business, company or organization. It’s a great way to present your ideas in a clear and efficient manner. Full of charts and diagrams, this template creates an impactful visual effect. The blue color scheme will help create a fresh look in your presentations. This template is designed for use in Powerpoint, Google Sheets or Keynote.


26 diapositivas
Wok Presentation Template
Want to learn about popular Chinese dishes? Wok is a fun and colorful template made for you. It includes all the essential elements of a food related template: fresh ingredients and vibrant colors. Wok was developed to meet the needs of those who want to promote their business with a clean and organized design. It has easy editing features making it simple to customize by adding company logos and other relevant details. The template is responsive, which means that it will adapt its layout based on how the user wants it displayed. This makes it easy to access the site from wherever you may be.


5 diapositivas
E-Learning and Digital Education Trends Presentation
Stay ahead in the digital learning space with the E-Learning and Digital Education Trends Presentation template. Designed for educators, trainers, and e-learning professionals, this modern and insightful layout highlights key trends, innovative tools, and strategies in online education. With fully customizable elements, you can tailor the slides to your audience’s needs. Compatible with PowerPoint, Keynote, and Google Slides for a seamless presentation experience.


8 diapositivas
Workforce Engagement Strategy Presentation
Visualize employee engagement plans with the Workforce Engagement Strategy Presentation. This template includes timeline-style layouts to communicate team initiatives, motivation tactics, and HR strategies effectively. Ideal for team leads, HR managers, and consultants. Fully customizable in PowerPoint, Keynote, and Google Slides to suit your brand and communication goals.


7 diapositivas
Performance Summary Infographic
Boost your reporting capabilities with our Infographic Templates, designed to deliver exceptional clarity and impact. This series is perfectly suited for professionals seeking to present performance data compellingly and concisely. With a variety of designs including radial graphs, tiered lists, and comparative bars, these templates allow for an informative and aesthetically pleasing showcase of critical metrics. Each template is customizable, letting you adjust the color schemes and text to fit your corporate style, enhancing both visual appeal and brand consistency. Whether used in PowerPoint, Google Slides, or Keynote, these tools are vital for anyone looking to articulate achievements, assess comparative results, and plan based on solid data insights. They are indispensable for consultants, managers, and team leaders who require clear, persuasive presentation resources to drive decisions and highlight successes.


7 diapositivas
Success Team Work Infographic
Teamwork is the collaborative effort of a group of individuals, each contributing their diverse skills, knowledge, and experiences to achieve a common goal or complete a shared task. Our success teamwork infographic is an inspiring visual tool designed to showcase the art of collaborative achievement. Celebrate the collective triumphs of teamwork and highlight how unity and synergy lead to unparalleled success. Compatible with Powerpoint, Keynote, and Google Slides. This template encourages a culture of collaboration and showcases the magic that happens when individuals unite for a common purpose.


26 diapositivas
Spa and Wellness Company Profile Presentation
Embark on a journey to wellness and relaxation with our serene well spa & wellness company profile presentation. This template will Immerse your audience in a world of calmness, rejuvenation, and health. Present your company's mission and vision for promoting wellness. Compatible with Powerpoint, Keynote, and Google Slides. The soothing shades of pastels and soft hues create a peaceful atmosphere. This template integrates elements of nature like leaves, flowers, or waves to evoke serenity. This presentation is designed to captivate your audience and immerse them in the world of relaxation.