


Características


¿Tienes alguna pregunta?
Recomendar


5 diapositivas
Medical Services Infographics
Navigate the complexities of healthcare information with our medical services infographics. Rendered in a life-affirming palette of blue and red, these infographics elucidate various facets of medical services. The template serves as a lifeline for healthcare professionals, and public health advocates by providing a clear, visual narrative of services, processes, and advancements in the medical field. Compatible with Powerpoint, Keynote, and Google Slides. Its creative yet informative style, enhanced with relevant graphics and icons, ensure that critical information catches the eye, improves understanding, and encourages engagement.


6 diapositivas
Discussion Starter and Inquiry Prompt Presentation
Kick off meaningful conversations with style and clarity. This discussion prompt slide uses a flowing layout and droplet-shaped icons to guide teams through key questions or ideas—ideal for brainstorming sessions, workshops, and meeting agendas. It’s a great way to visually organize dialogue. Fully compatible with PowerPoint, Keynote, and Google Slides.


5 diapositivas
Food Waste in School Infographics
Food Waste in schools is a significant issue that can have economic, environmental, and social impacts. These vertical infographics aim to raise awareness about the magnitude of the problem and provide actionable steps to reduce food waste in schools. These can be used as valuable tools to highlight the issue of food waste in school environments. The visually appealing illustrations, informative content, and color schemes make it effective for raising awareness and promoting sustainable practices in school environments. Compatible with Powerpoint, Keynote, and Google Slides.


3 diapositivas
Remote Work Culture and Guidelines Presentation
Bring remote teamwork to life with visuals that speak your culture. This presentation template simplifies how you communicate expectations, structure, and values for virtual teams. Perfect for onboarding, policy updates, or outlining collaboration tools, it’s designed to keep your message clear and consistent. Fully compatible with PowerPoint, Keynote, and Google Slides.


5 diapositivas
Responsibility Assignment Matrix Slide
Make project accountability crystal clear with this smart and structured matrix designed for assigning responsibilities across roles. Ideal for outlining who's doing what in multi-team environments, this slide keeps everyone on the same page using the classic RACI method. Fully compatible with PowerPoint, Keynote, and Google Slides.


5 diapositivas
Long-Term Business Strategy Framework
Outline your roadmap to sustainable growth with the Long-Term Business Strategy Framework Presentation. This slide features a bold, horizontal arrow layout divided into four segments—each representing a core phase of your strategic plan. It includes icons and space for key insights under each step, making it perfect for visualizing vision alignment, operational planning, or organizational milestones. Fully customizable in PowerPoint, Keynote, and Google Slides.


7 diapositivas
Business Strategy with 7S Model
Clearly map out your organizational alignment using this Business Strategy with 7S Model template. Perfect for strategy consultants, leadership teams, and business educators, it illustrates the interconnectedness of structure, strategy, systems, style, staff, skills, and shared values. Fully customizable in PowerPoint, Keynote, and Google Slides.


5 diapositivas
Market Growth Strategy
Break down your strategic growth roadmap with this layered Market Growth Strategy template. Each stack represents a phase in your market expansion journey—ideal for illustrating plans, KPIs, or product scaling. Fully editable and compatible with PowerPoint, Keynote, and Google Slides for seamless use across platforms.


7 diapositivas
Investment Group Infographic
An investment group, is a collective of individuals or entities that pool their financial resources to invest in various financial instruments or assets. This infographic template is a high-octane journey through the dynamic world of investments, designed to empower and energize your financial understanding. Prepare to take you audience through a thrilling ride through the investment cosmos, where your money takes center stage and financial growth is the ultimate goal. This Investment Infographic isn't just about numbers and charts, it's a thrilling expedition through the realms of finance.


4 diapositivas
Business Report Conclusion Slide Presentation
Summarize findings with impact using the Business Report Conclusion Slide Presentation. This template provides a structured, four-step layout that helps you clearly present key takeaways, data highlights, or action points. Clean design with icon integration makes it easy to follow. Fully editable and compatible with PowerPoint, Keynote, and Google Slides.


4 diapositivas
Corporate Role Hierarchy Structure Presentation
Visualize your company’s reporting structure with this modern corporate role hierarchy diagram. Perfect for team overviews, leadership charts, or onboarding sessions. Each role node is clearly connected for easy understanding. Fully editable in Canva, PowerPoint, or Google Slides—ideal for HR teams, managers, or organizational planning presentations.


6 diapositivas
Logistics and Procurement Supply Chain Presentation
Optimize your supply chain strategy with the Logistics and Procurement Supply Chain template. Designed to illustrate key logistics processes, procurement flows, and operational efficiency, this structured layout helps you present crucial data with clarity. Fully customizable and compatible with PowerPoint, Keynote, and Google Slides for seamless business integration.


6 diapositivas
Scalable Data Systems and Analytics Presentation
Break down your cloud data architecture with clarity and flow using this visual diagram template. It helps illustrate how your scalable data systems interact—from ingestion to processing and analytics. Perfect for IT teams and tech presentations. Easily editable and compatible with PowerPoint, Keynote, and Google Slides.


12 diapositivas
5 Step Process Diagram Presentation
Step up your presentation game with our sleek "5 Step Process Diagram Presentation" template! Ideal for depicting interconnected processes or workflows, this infographic uses a central hexagonal design to connect five key steps, ensuring clarity and ease of understanding. Whether for academic, business, or personal projects, this template’s intuitive layout and customizable color schemes make it a versatile choice for any presentation. Compatible with PowerPoint, Keynote, and Google Slides, it’s designed to enhance the way you visualize complex information.


6 diapositivas
Role-Based Responsibility Matrix Presentation
Clarify team roles and accountability with this structured responsibility matrix. Perfect for RACI models and project task alignment, this template features customizable categories, color-coded rows, and editable role labels. Ideal for project managers and team leads. Fully compatible with PowerPoint, Google Slides, and Keynote for easy customization and collaboration.


7 diapositivas
Clinical Psychology Infographic
Clinical psychology is a field of psychology that focuses on diagnosing and treating mental, emotional, and behavioral disorders in individuals. This infographic template is designed to provide a deep understanding of clinical psychology, mental health disorders, treatment methods, and the vital role psychologists play in guiding individuals toward wellness. Compatible with Powerpoint, Keynote, and Google Slides. Discuss the importance of societal understanding and support for mental health, aiming to reduce stigma and foster a supportive environment. Empower yourself with knowledge and understanding through our infographic.


21 diapositivas
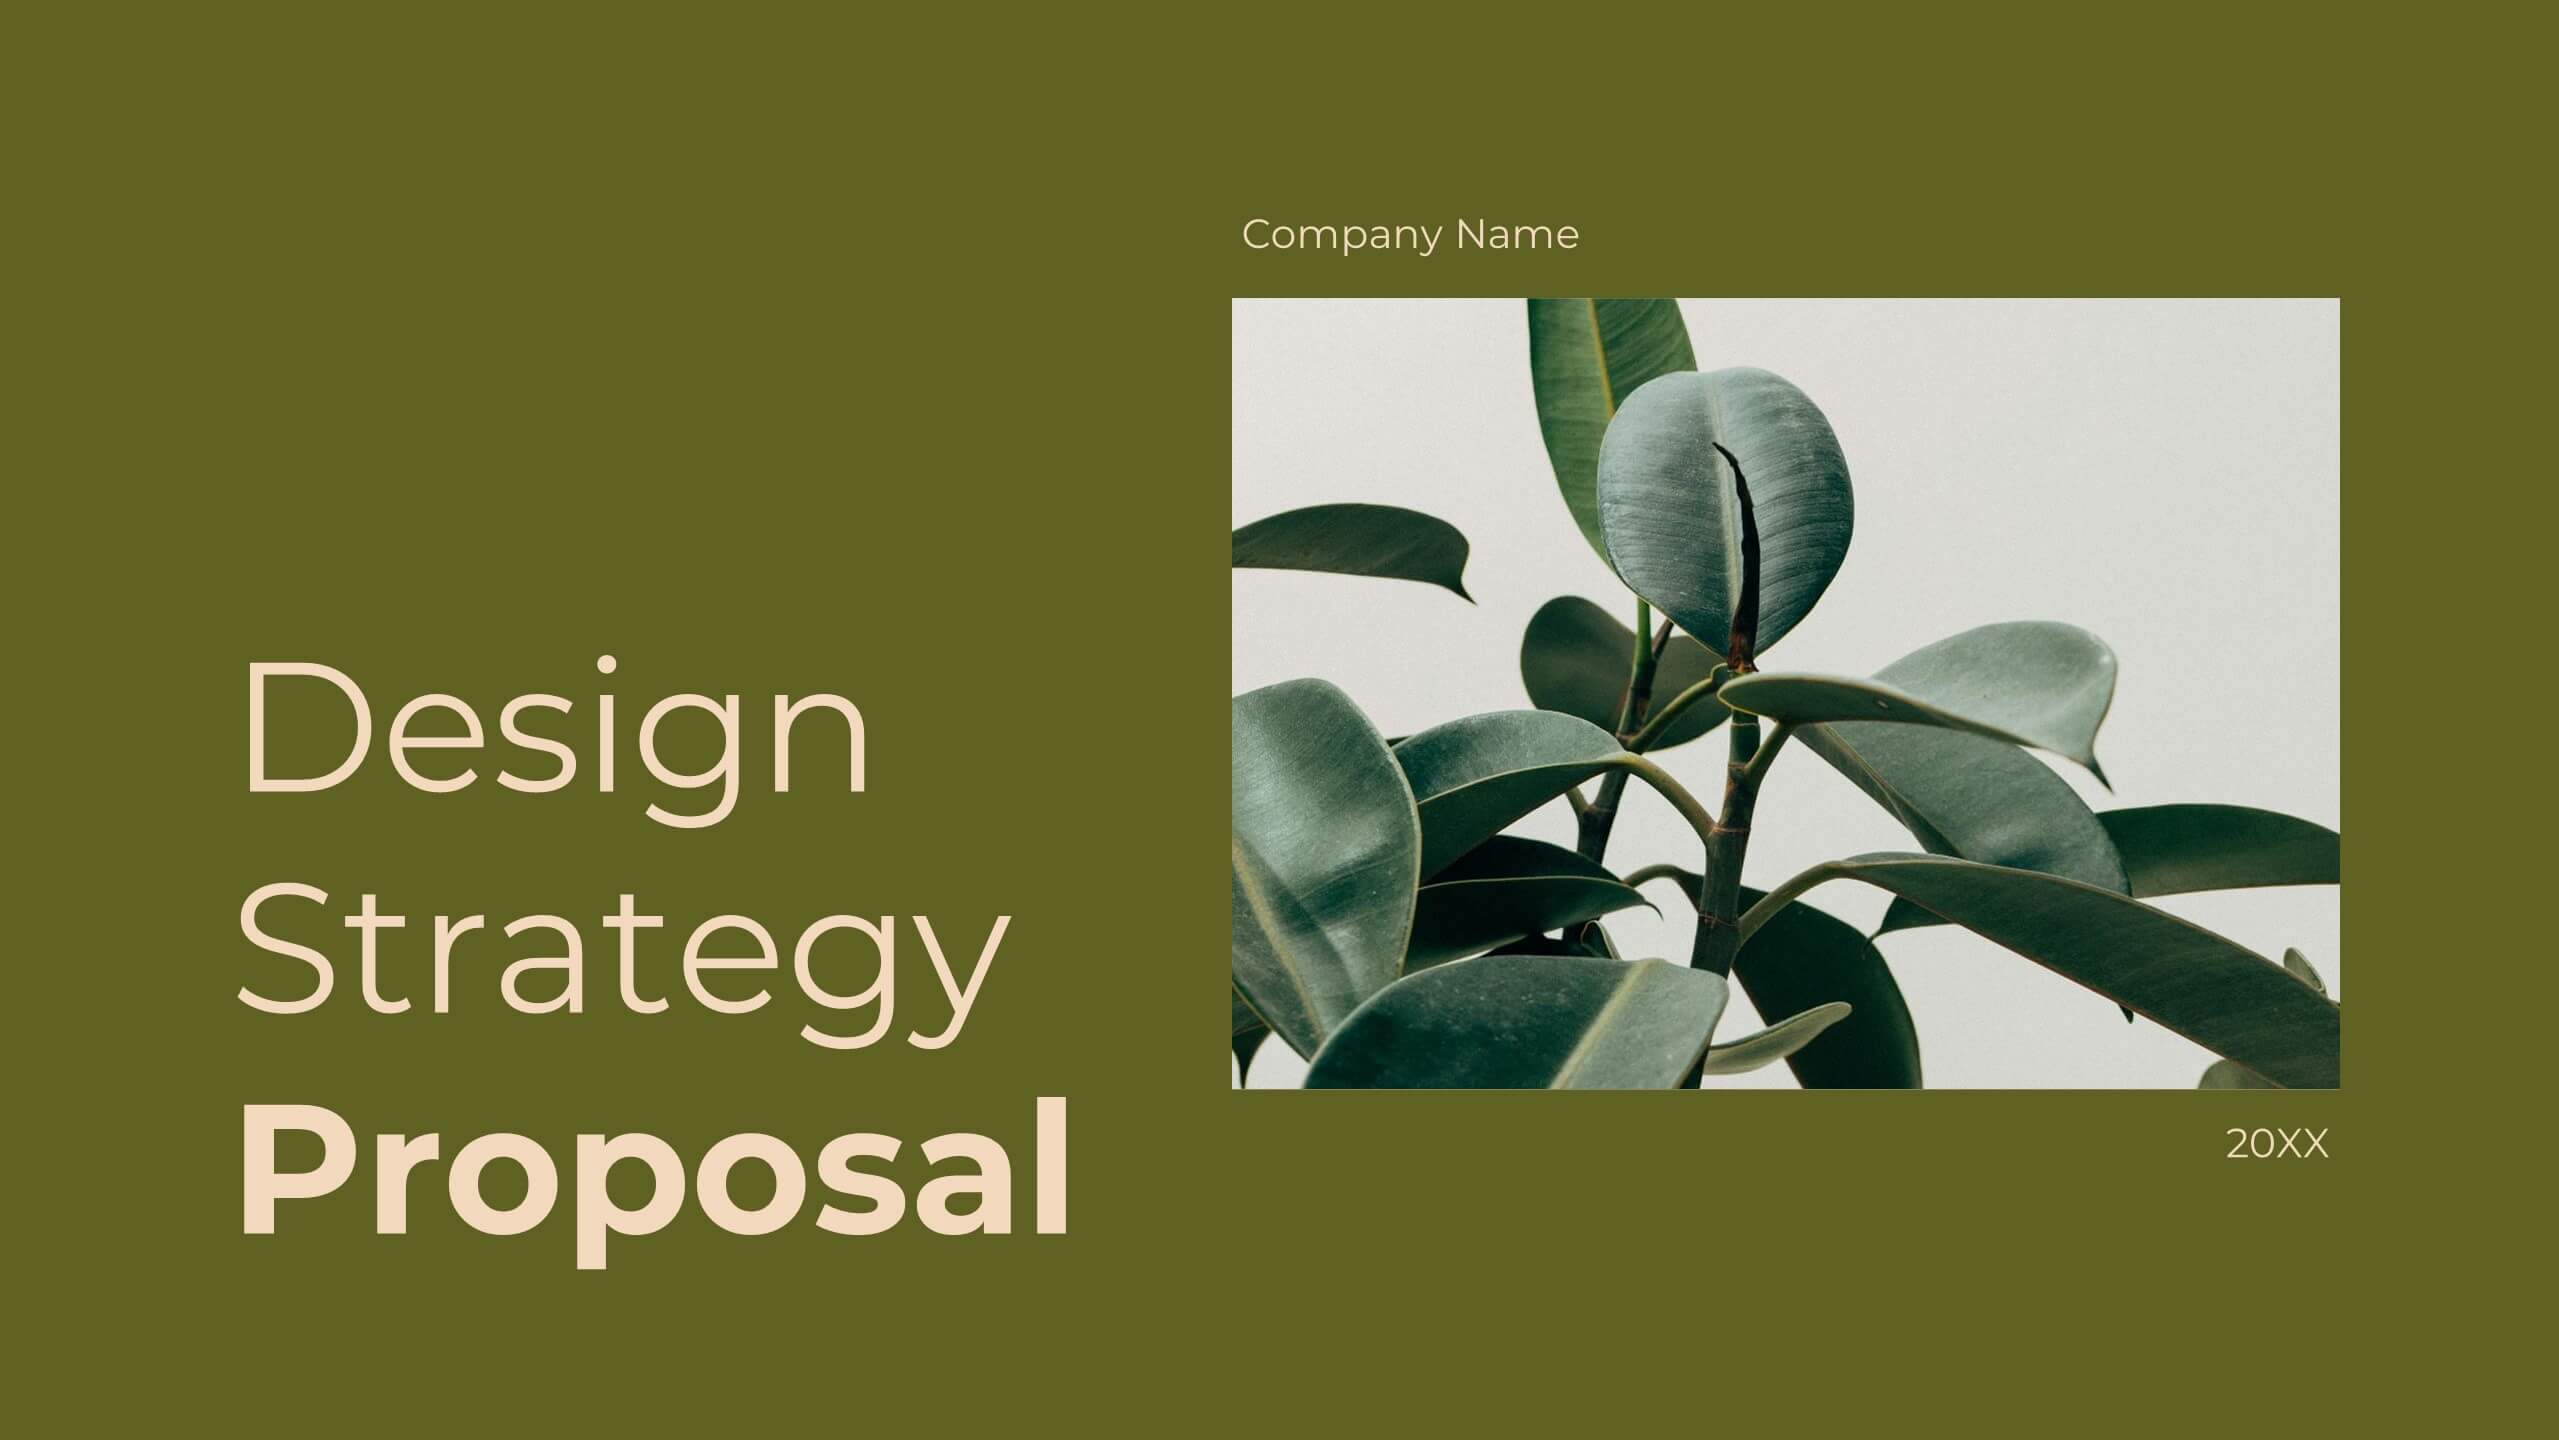
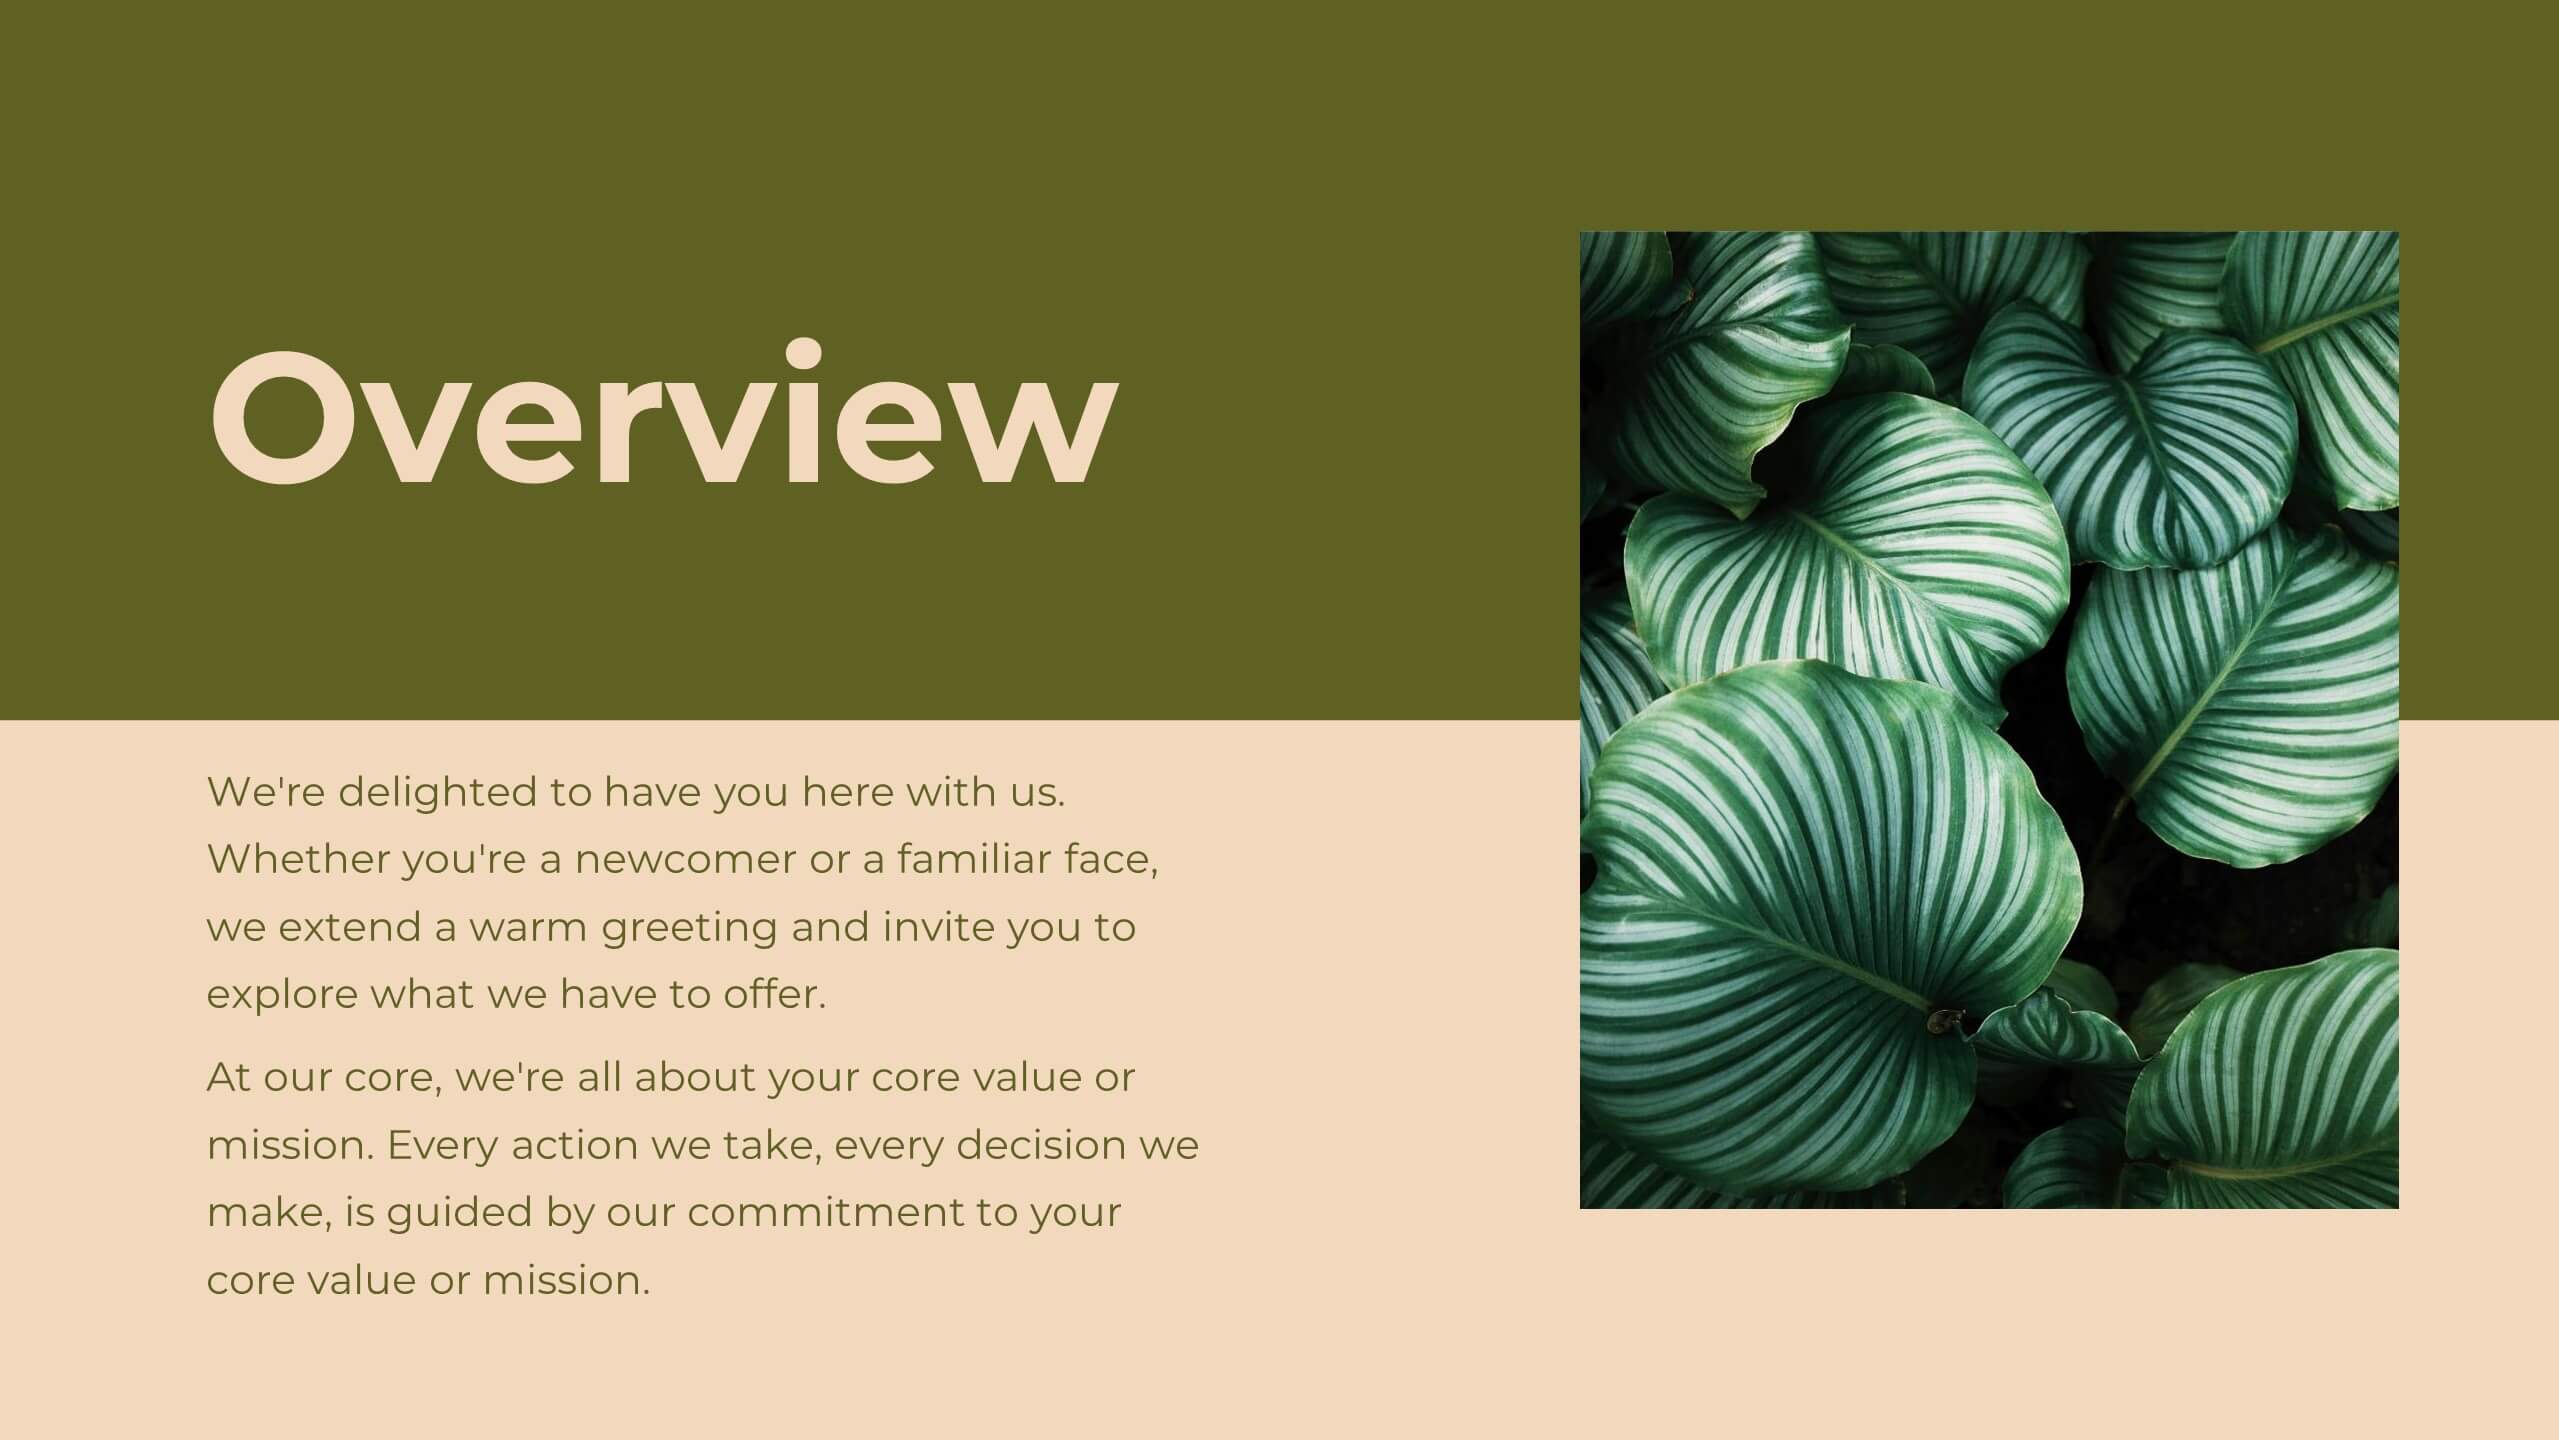
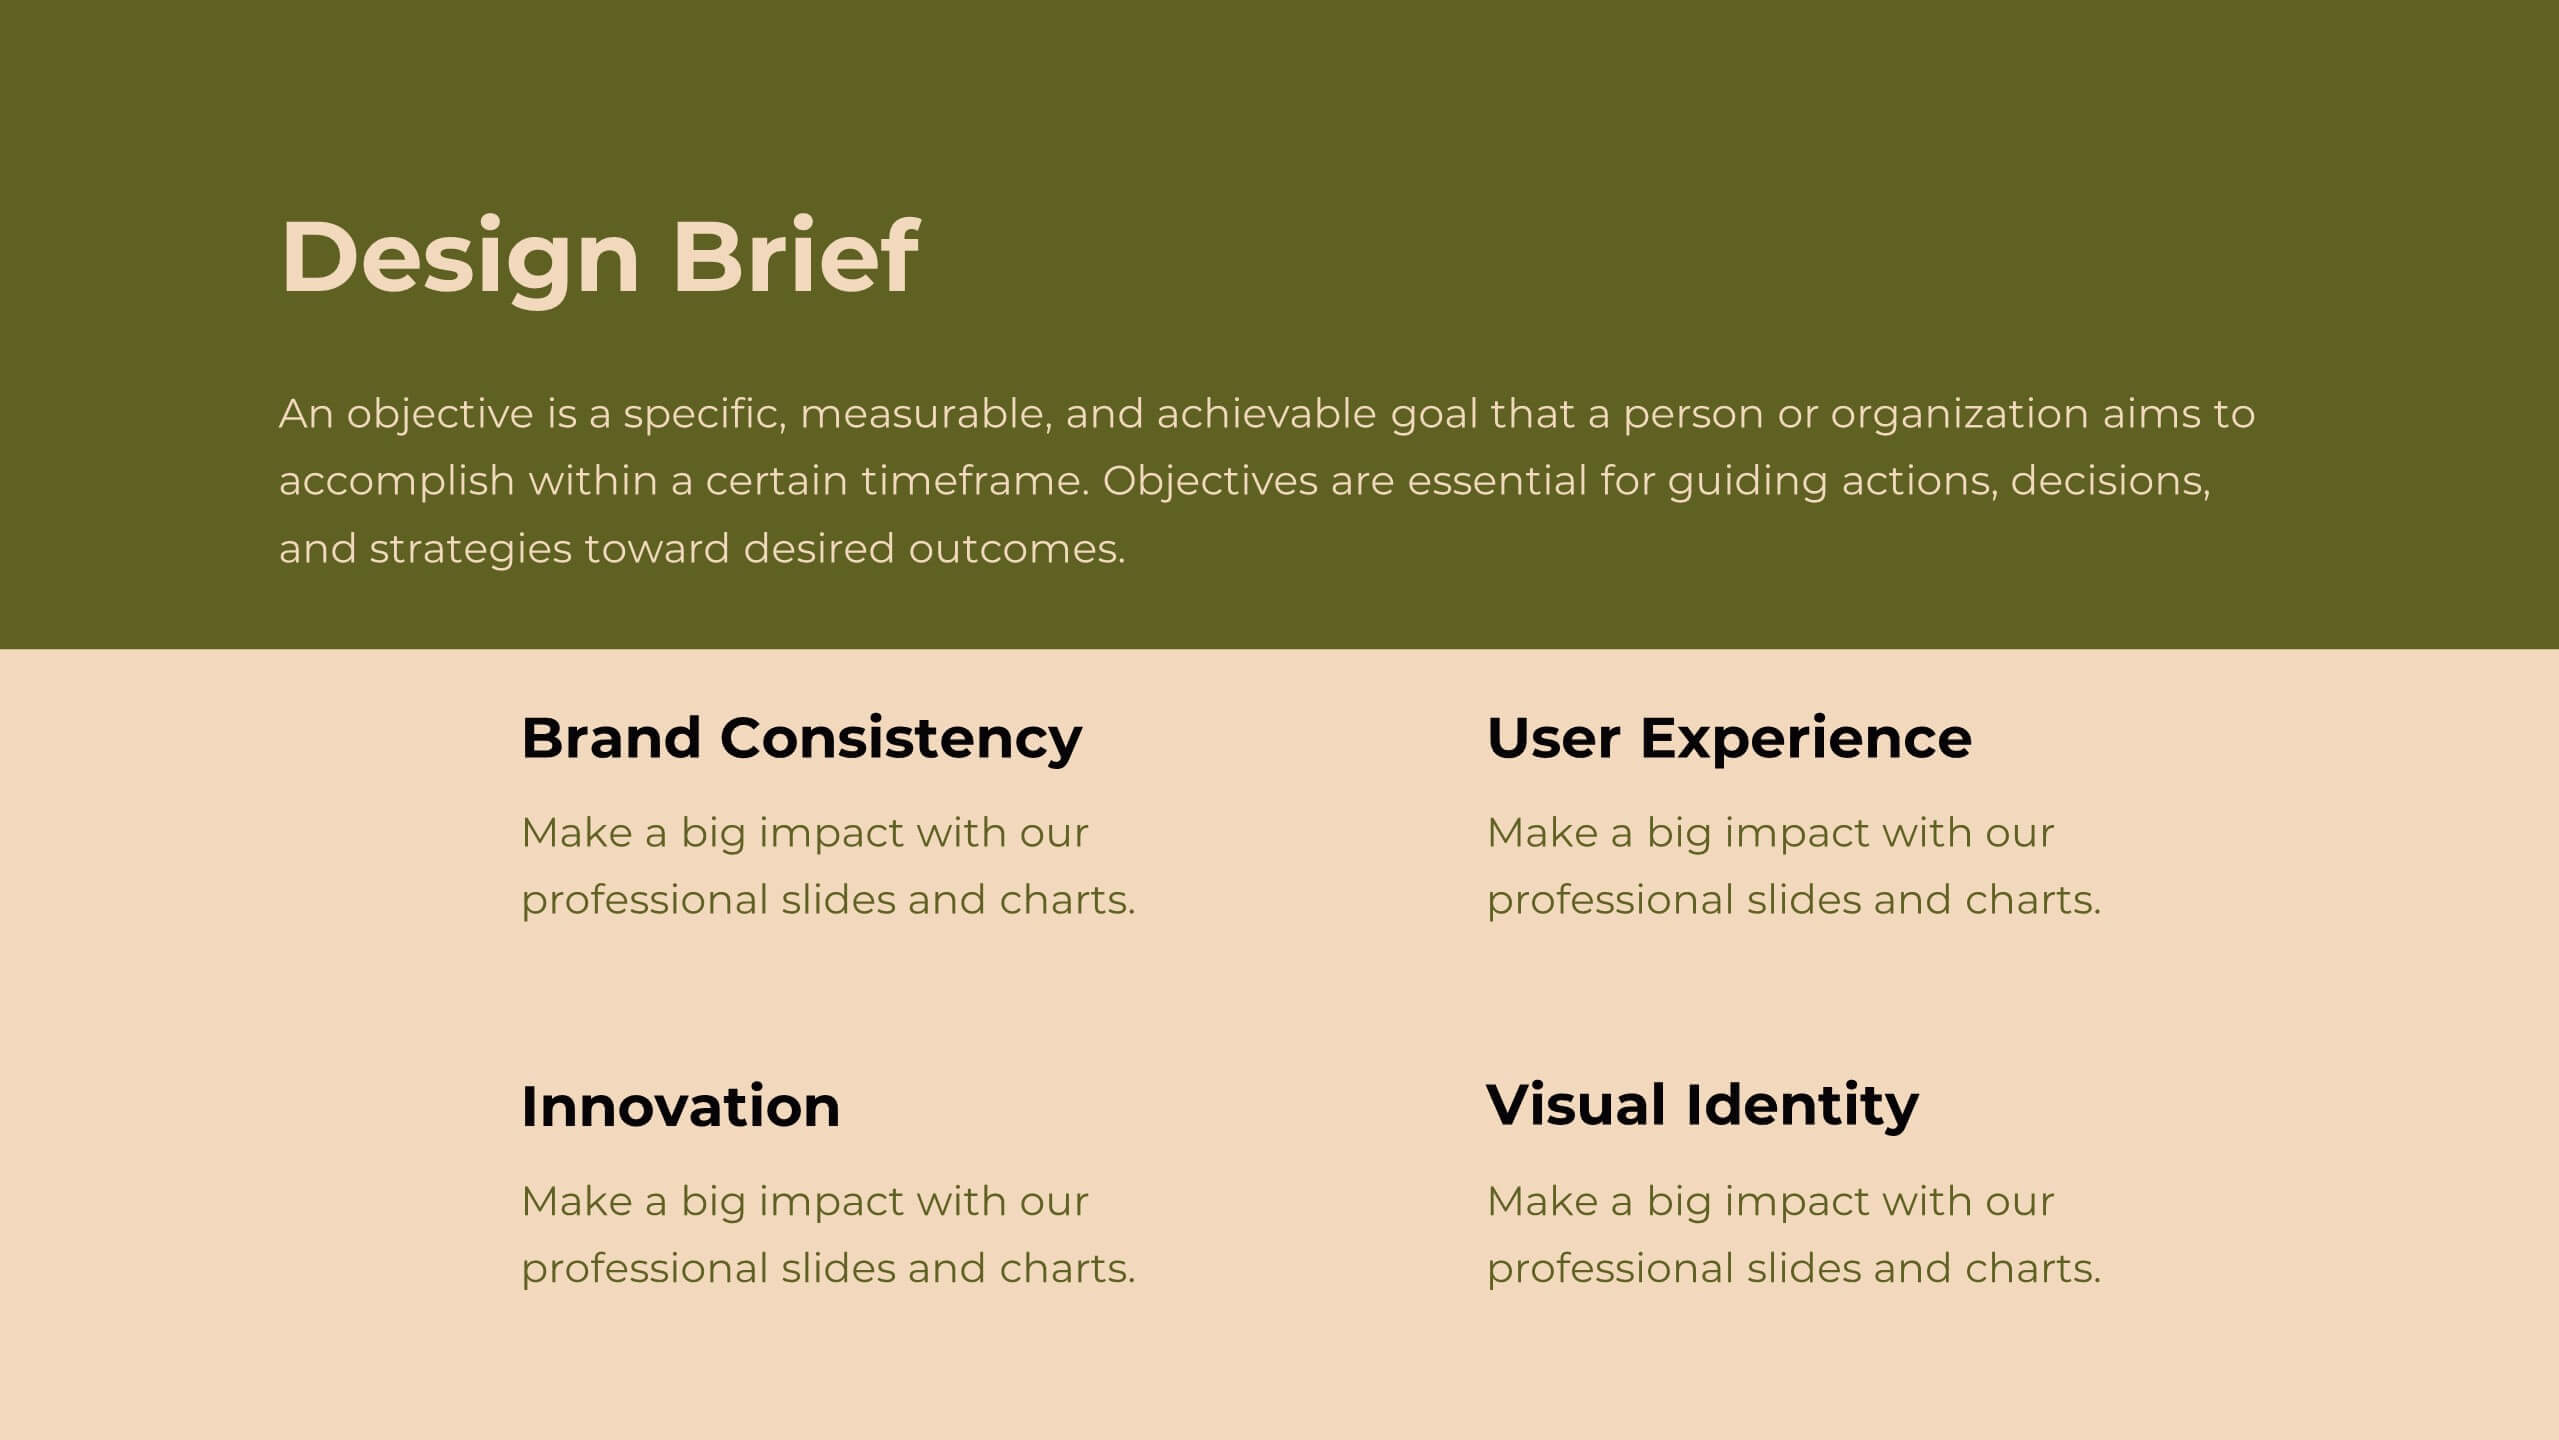
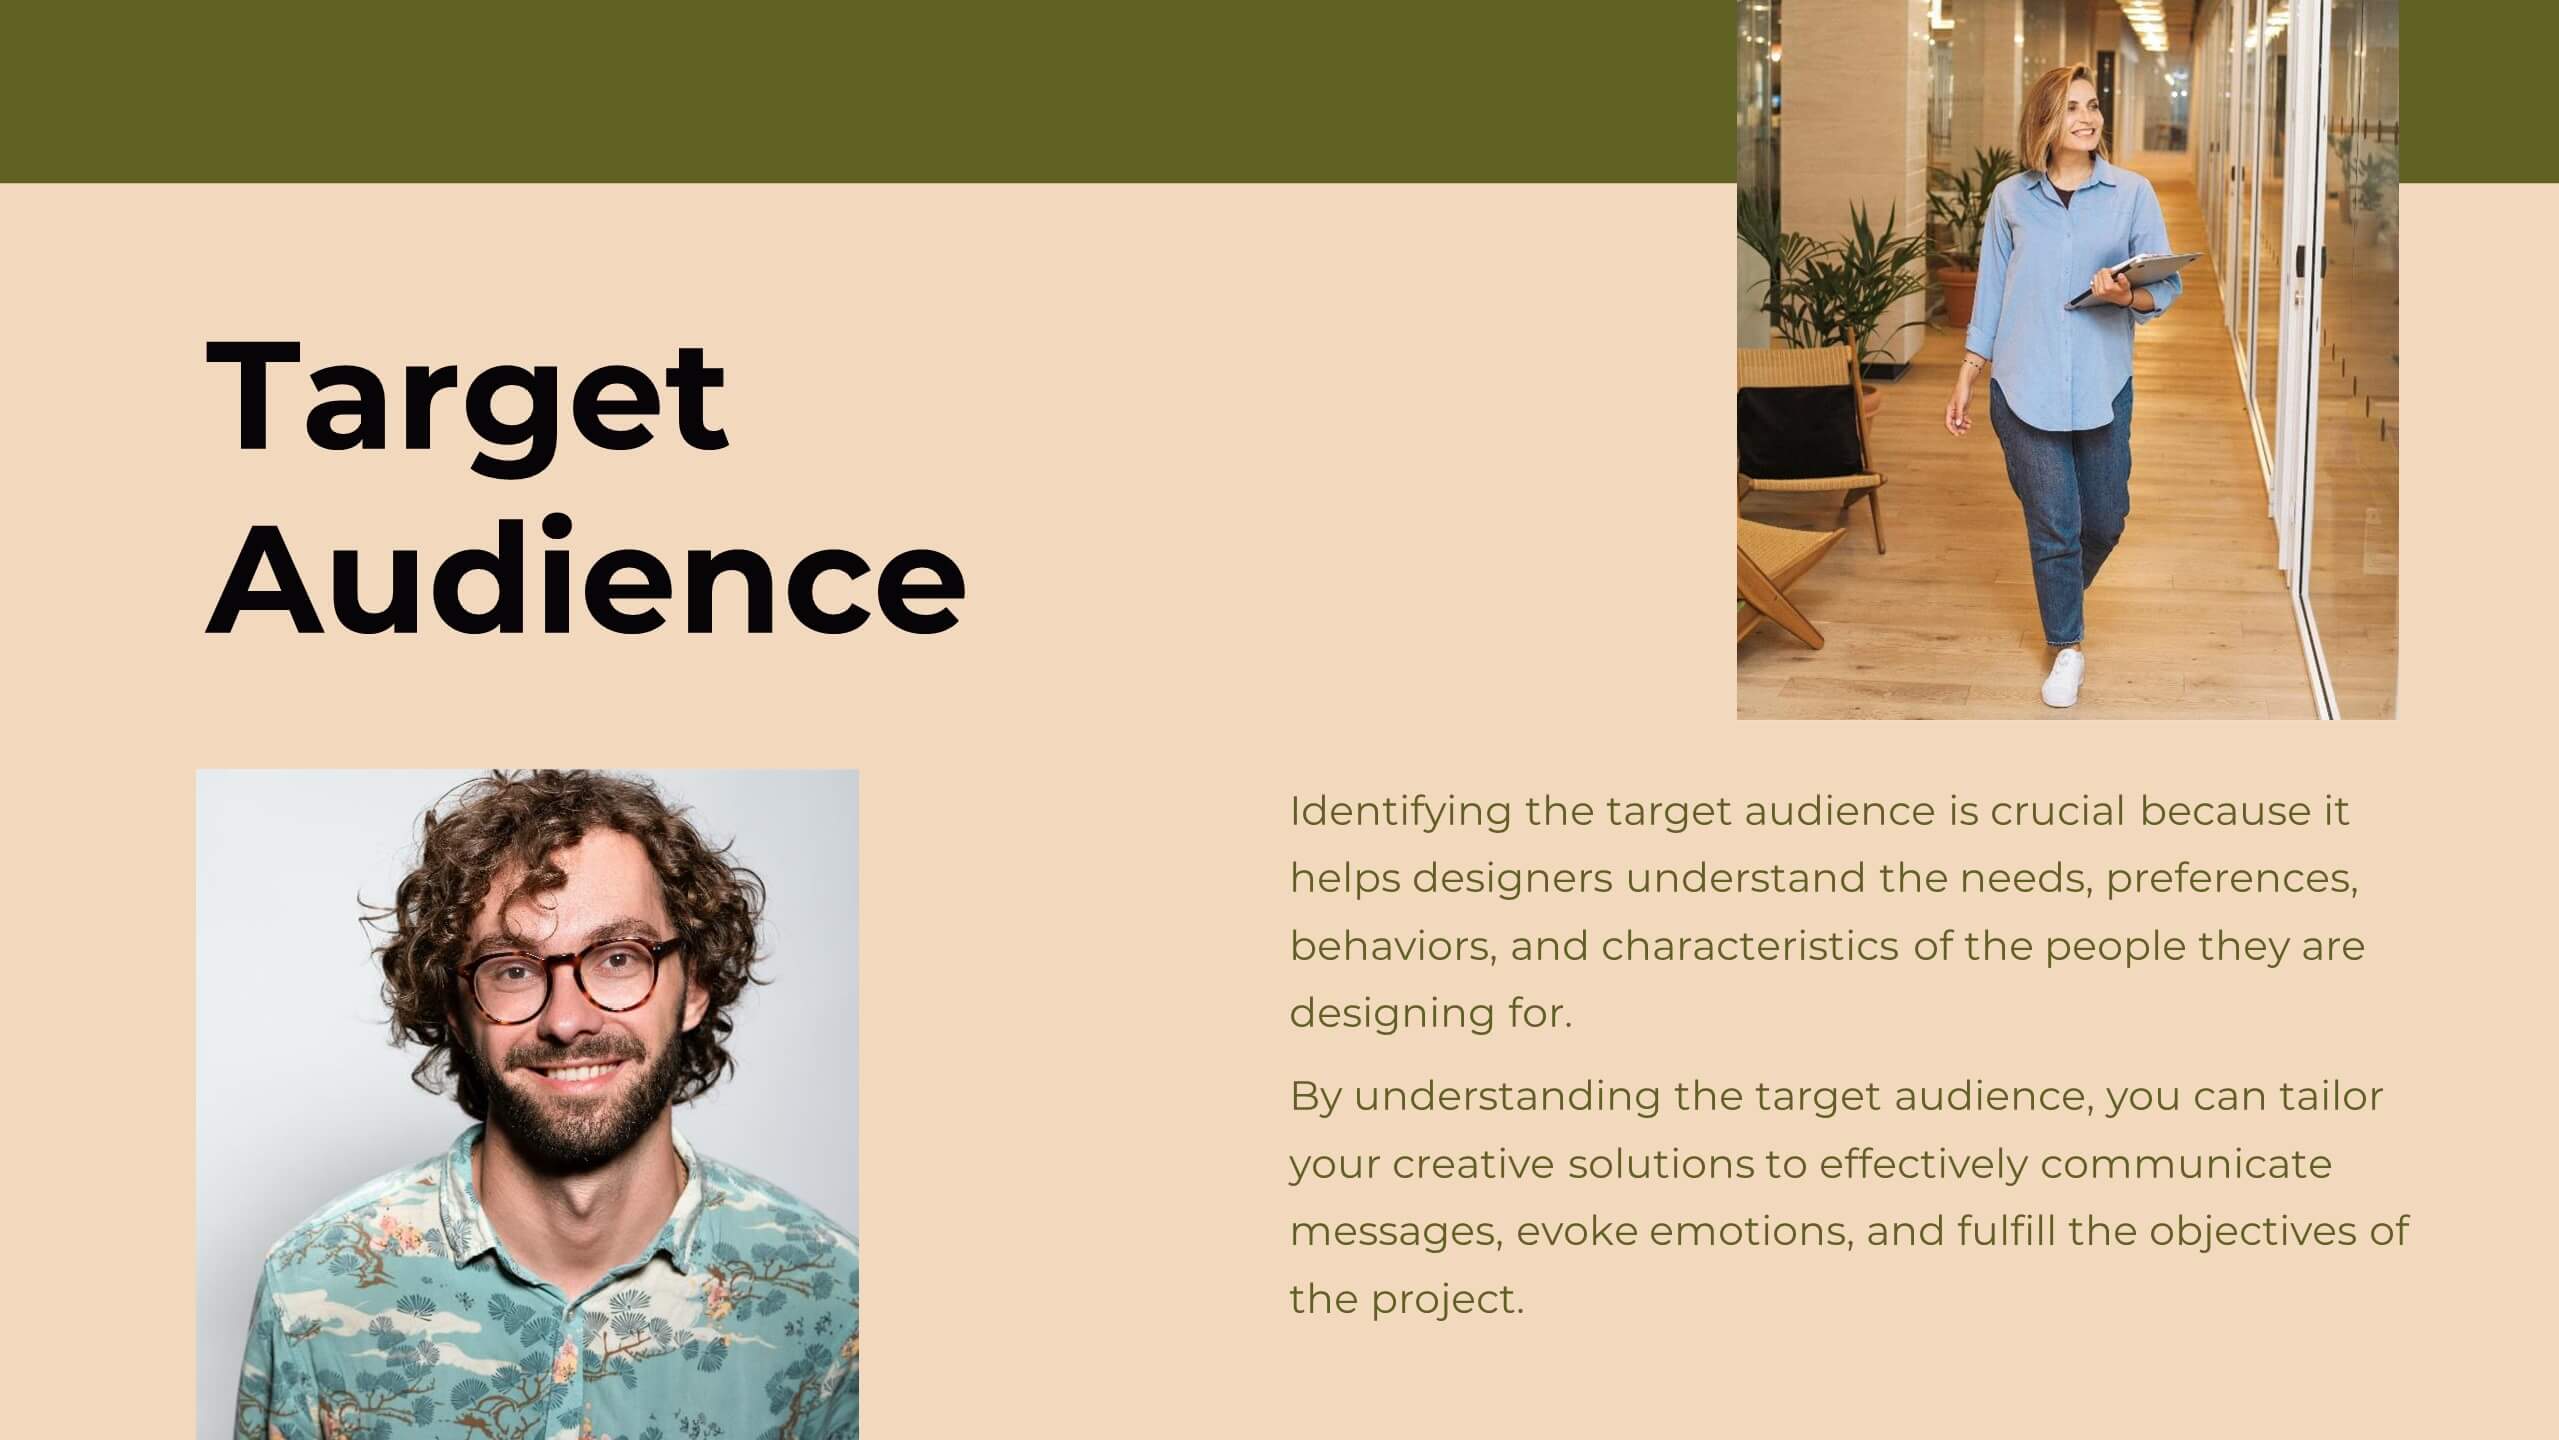
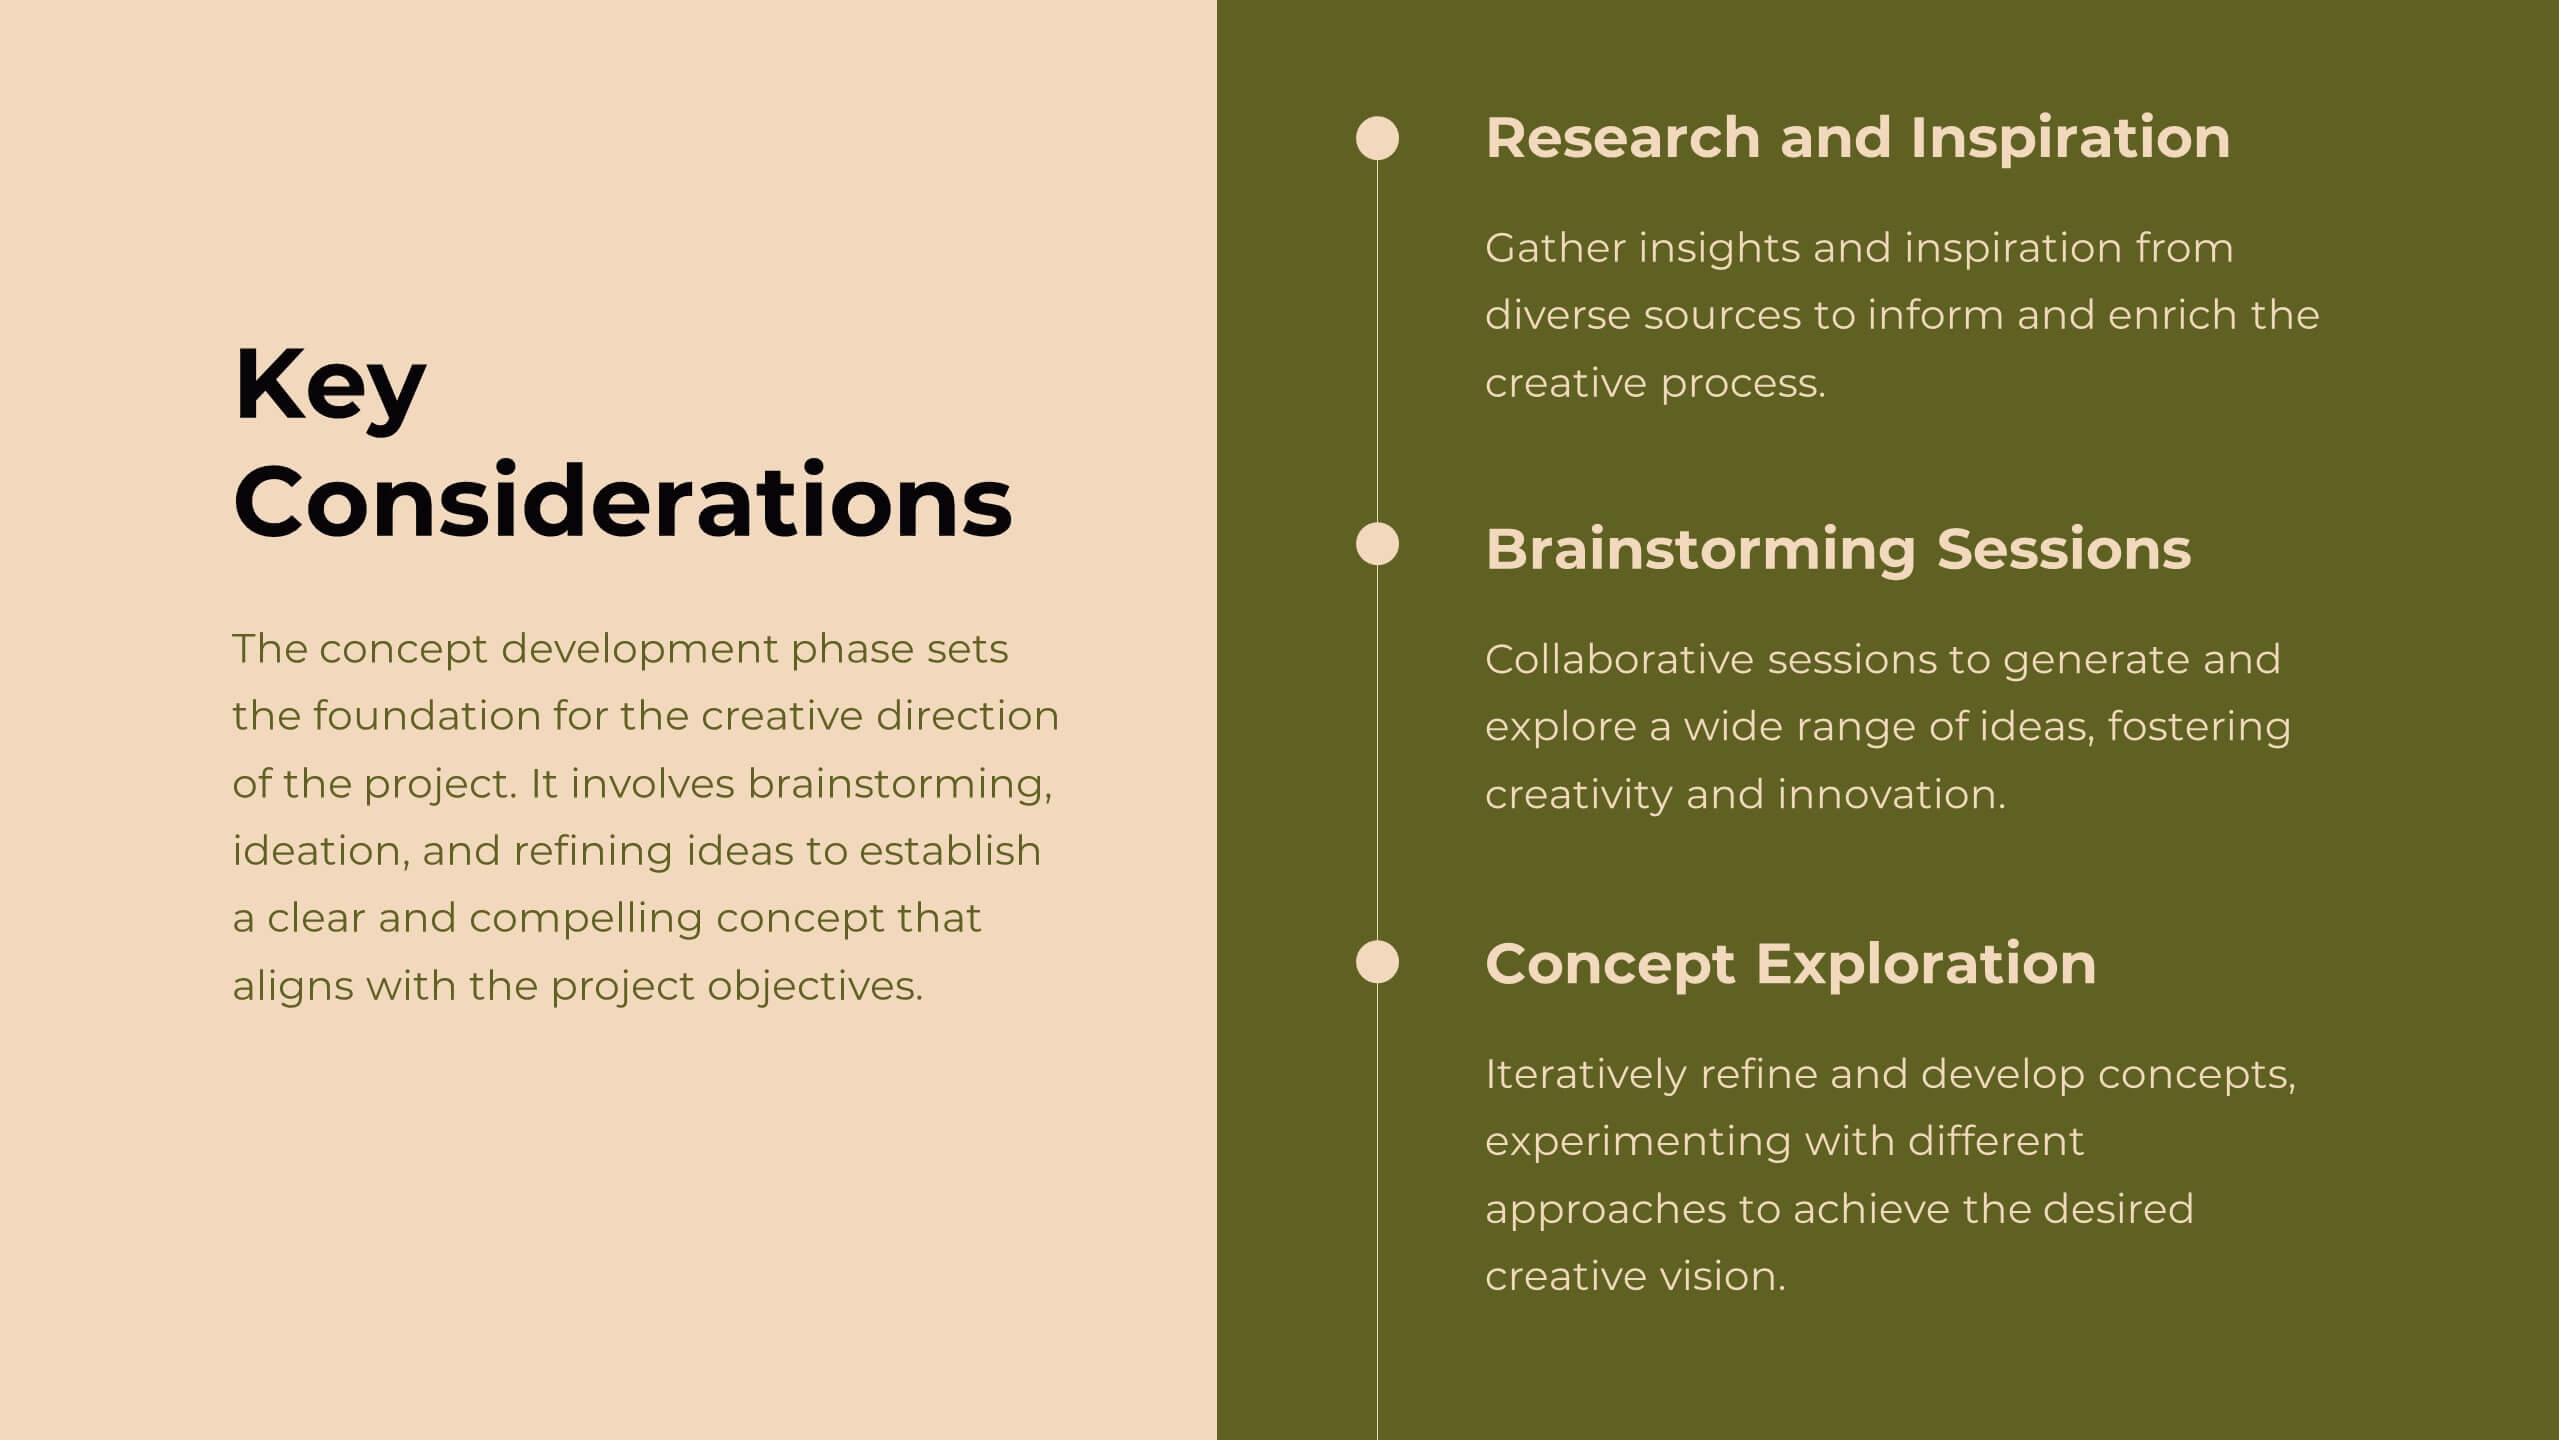
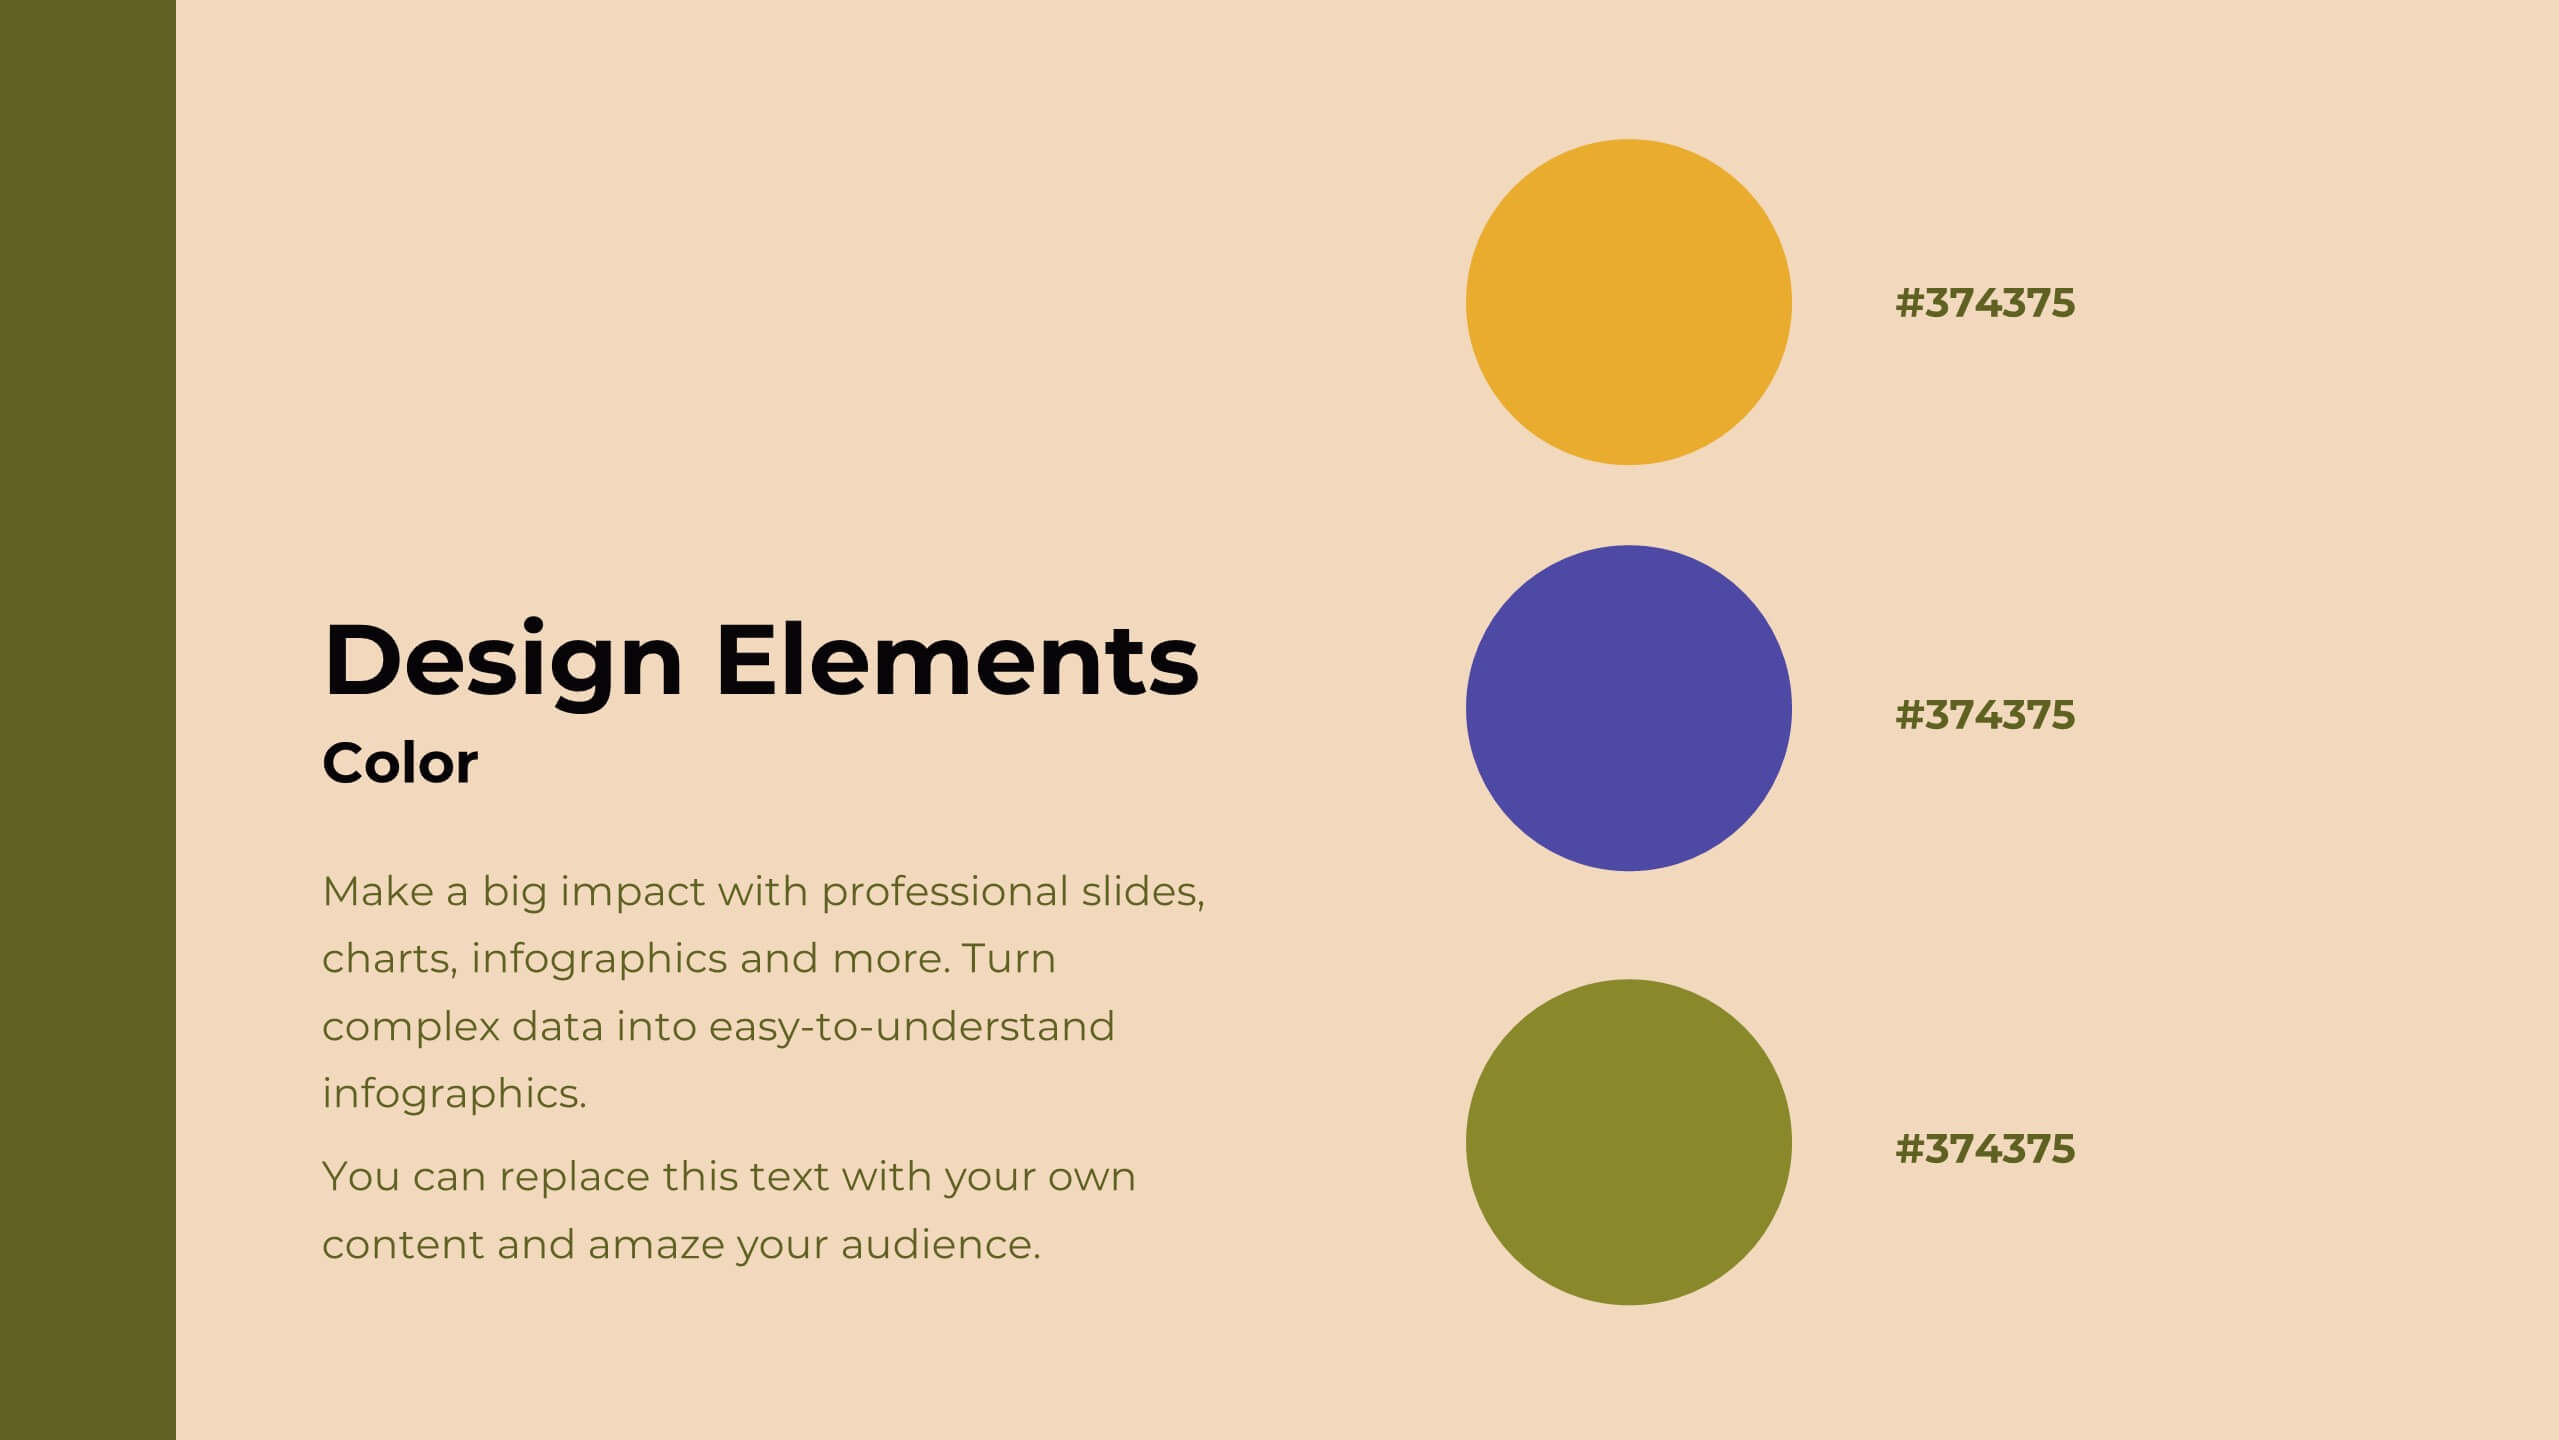
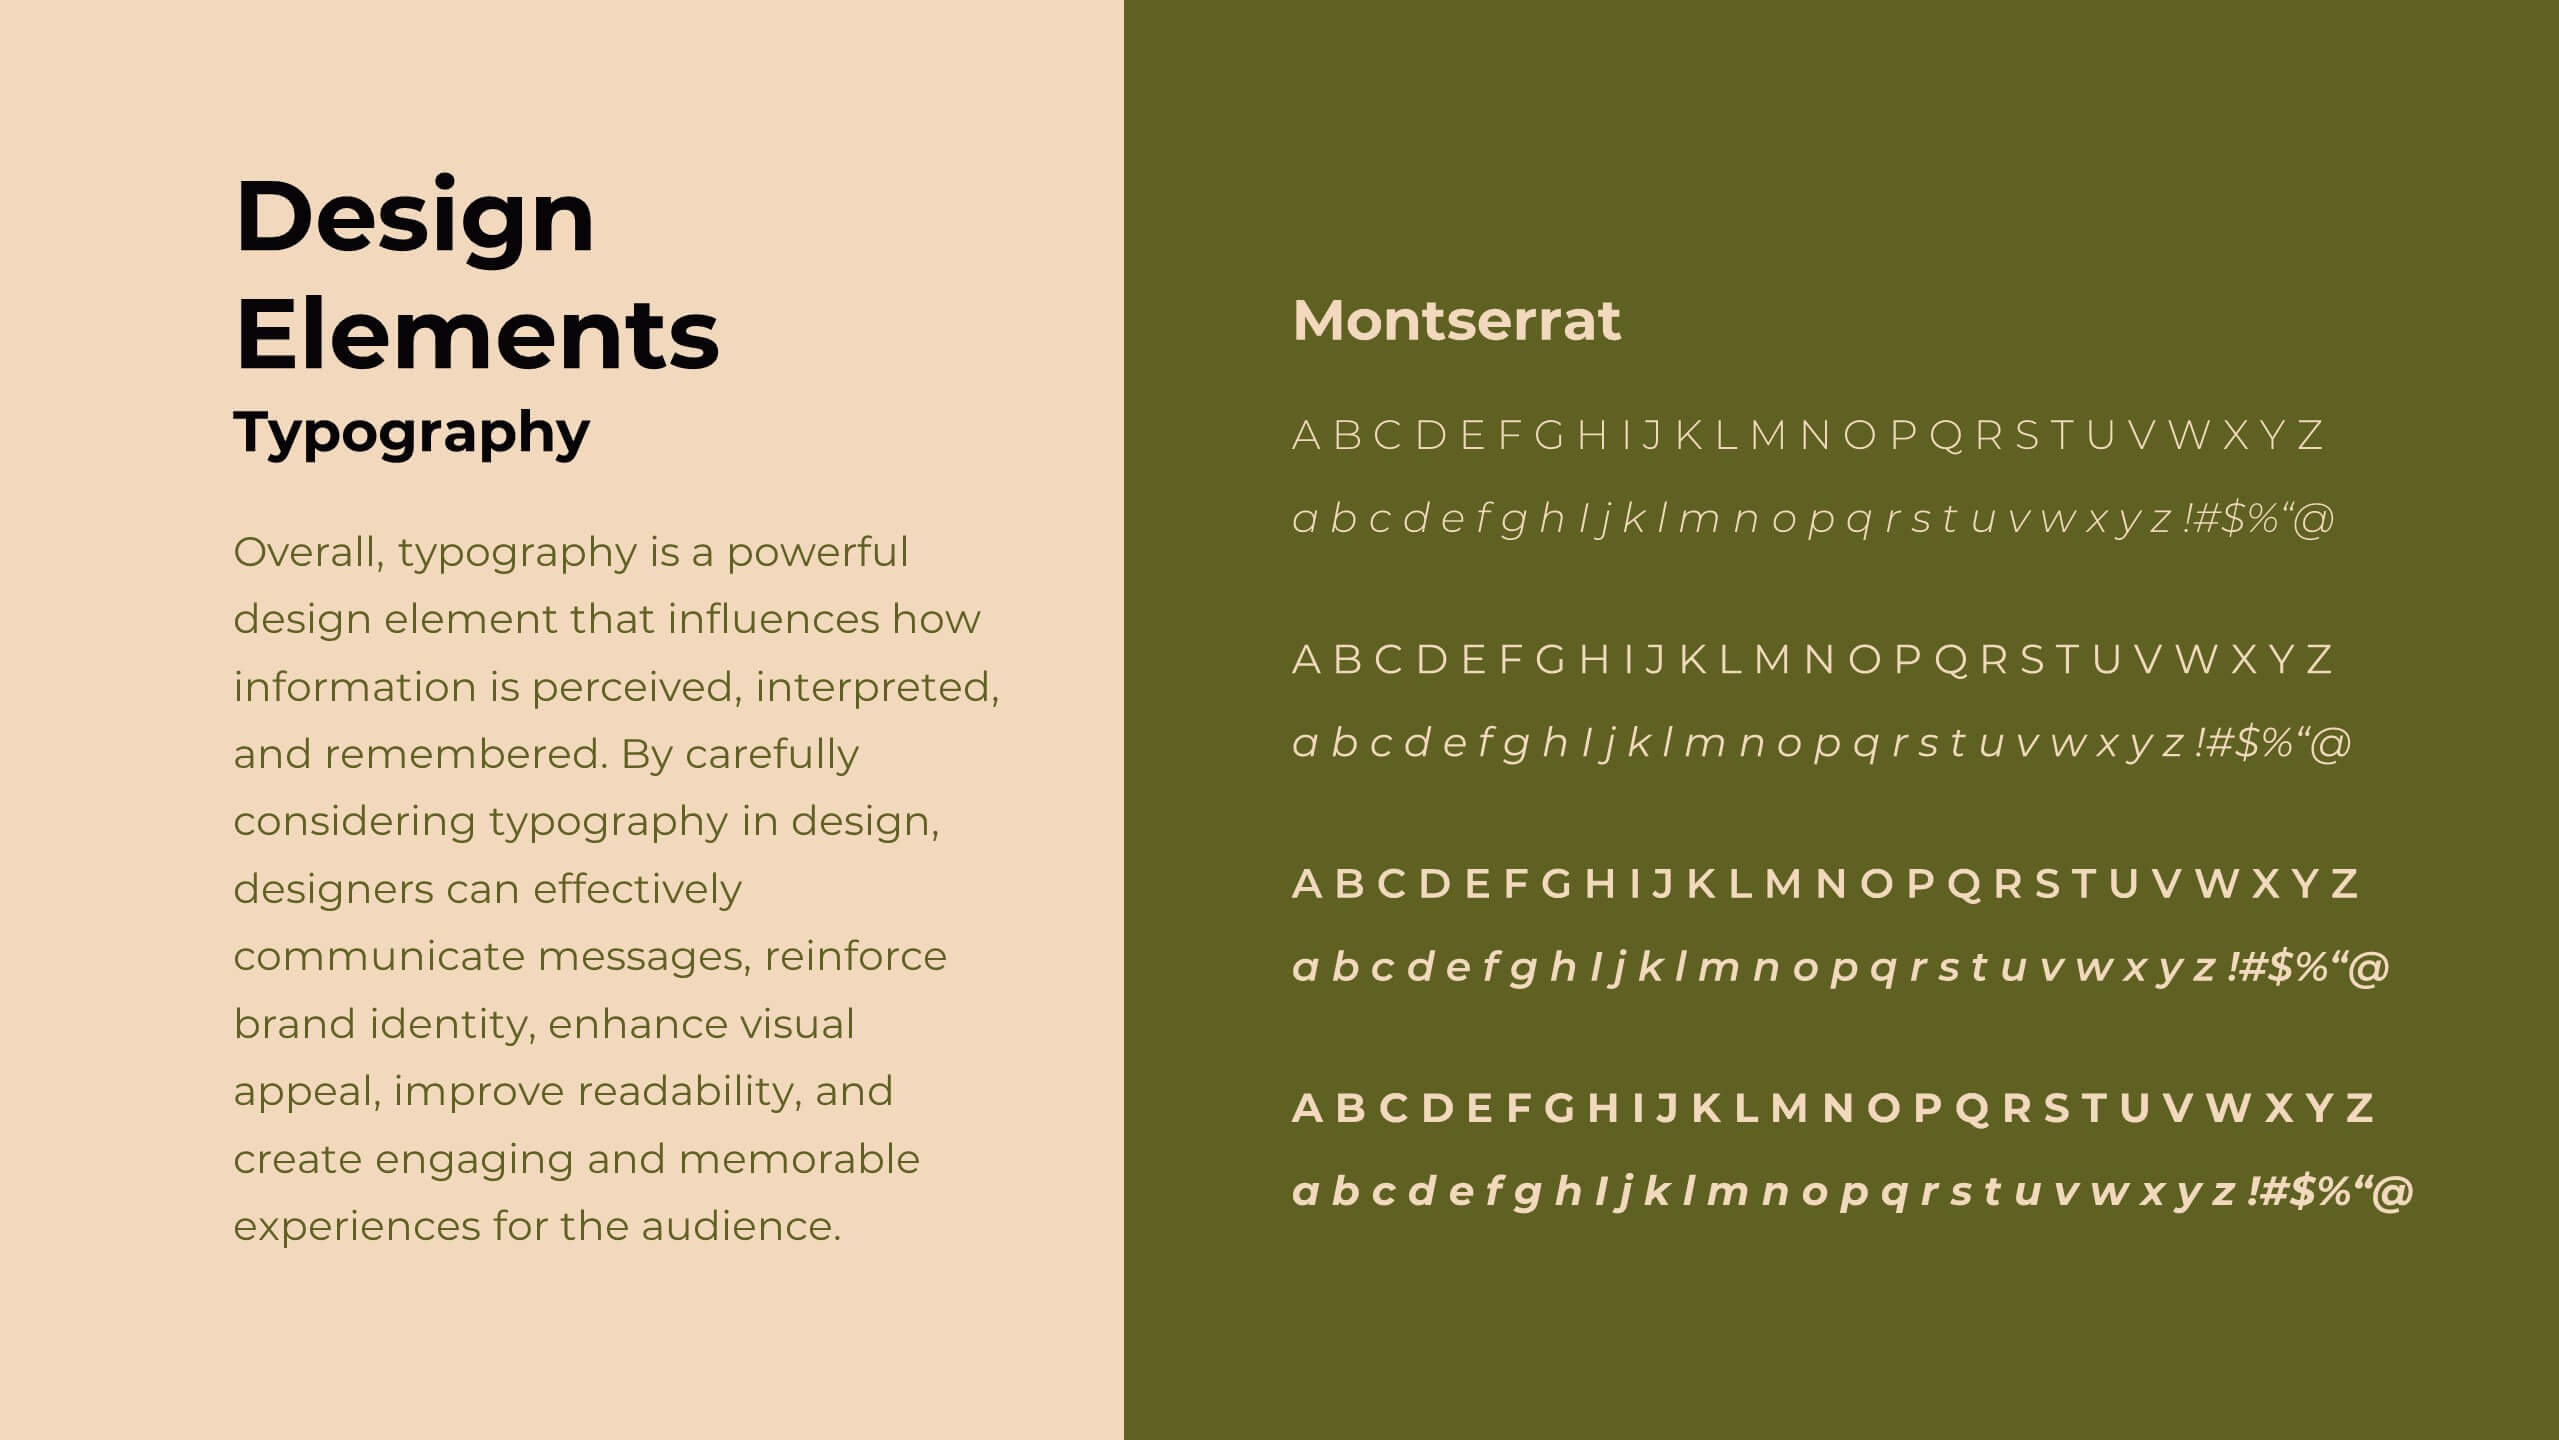
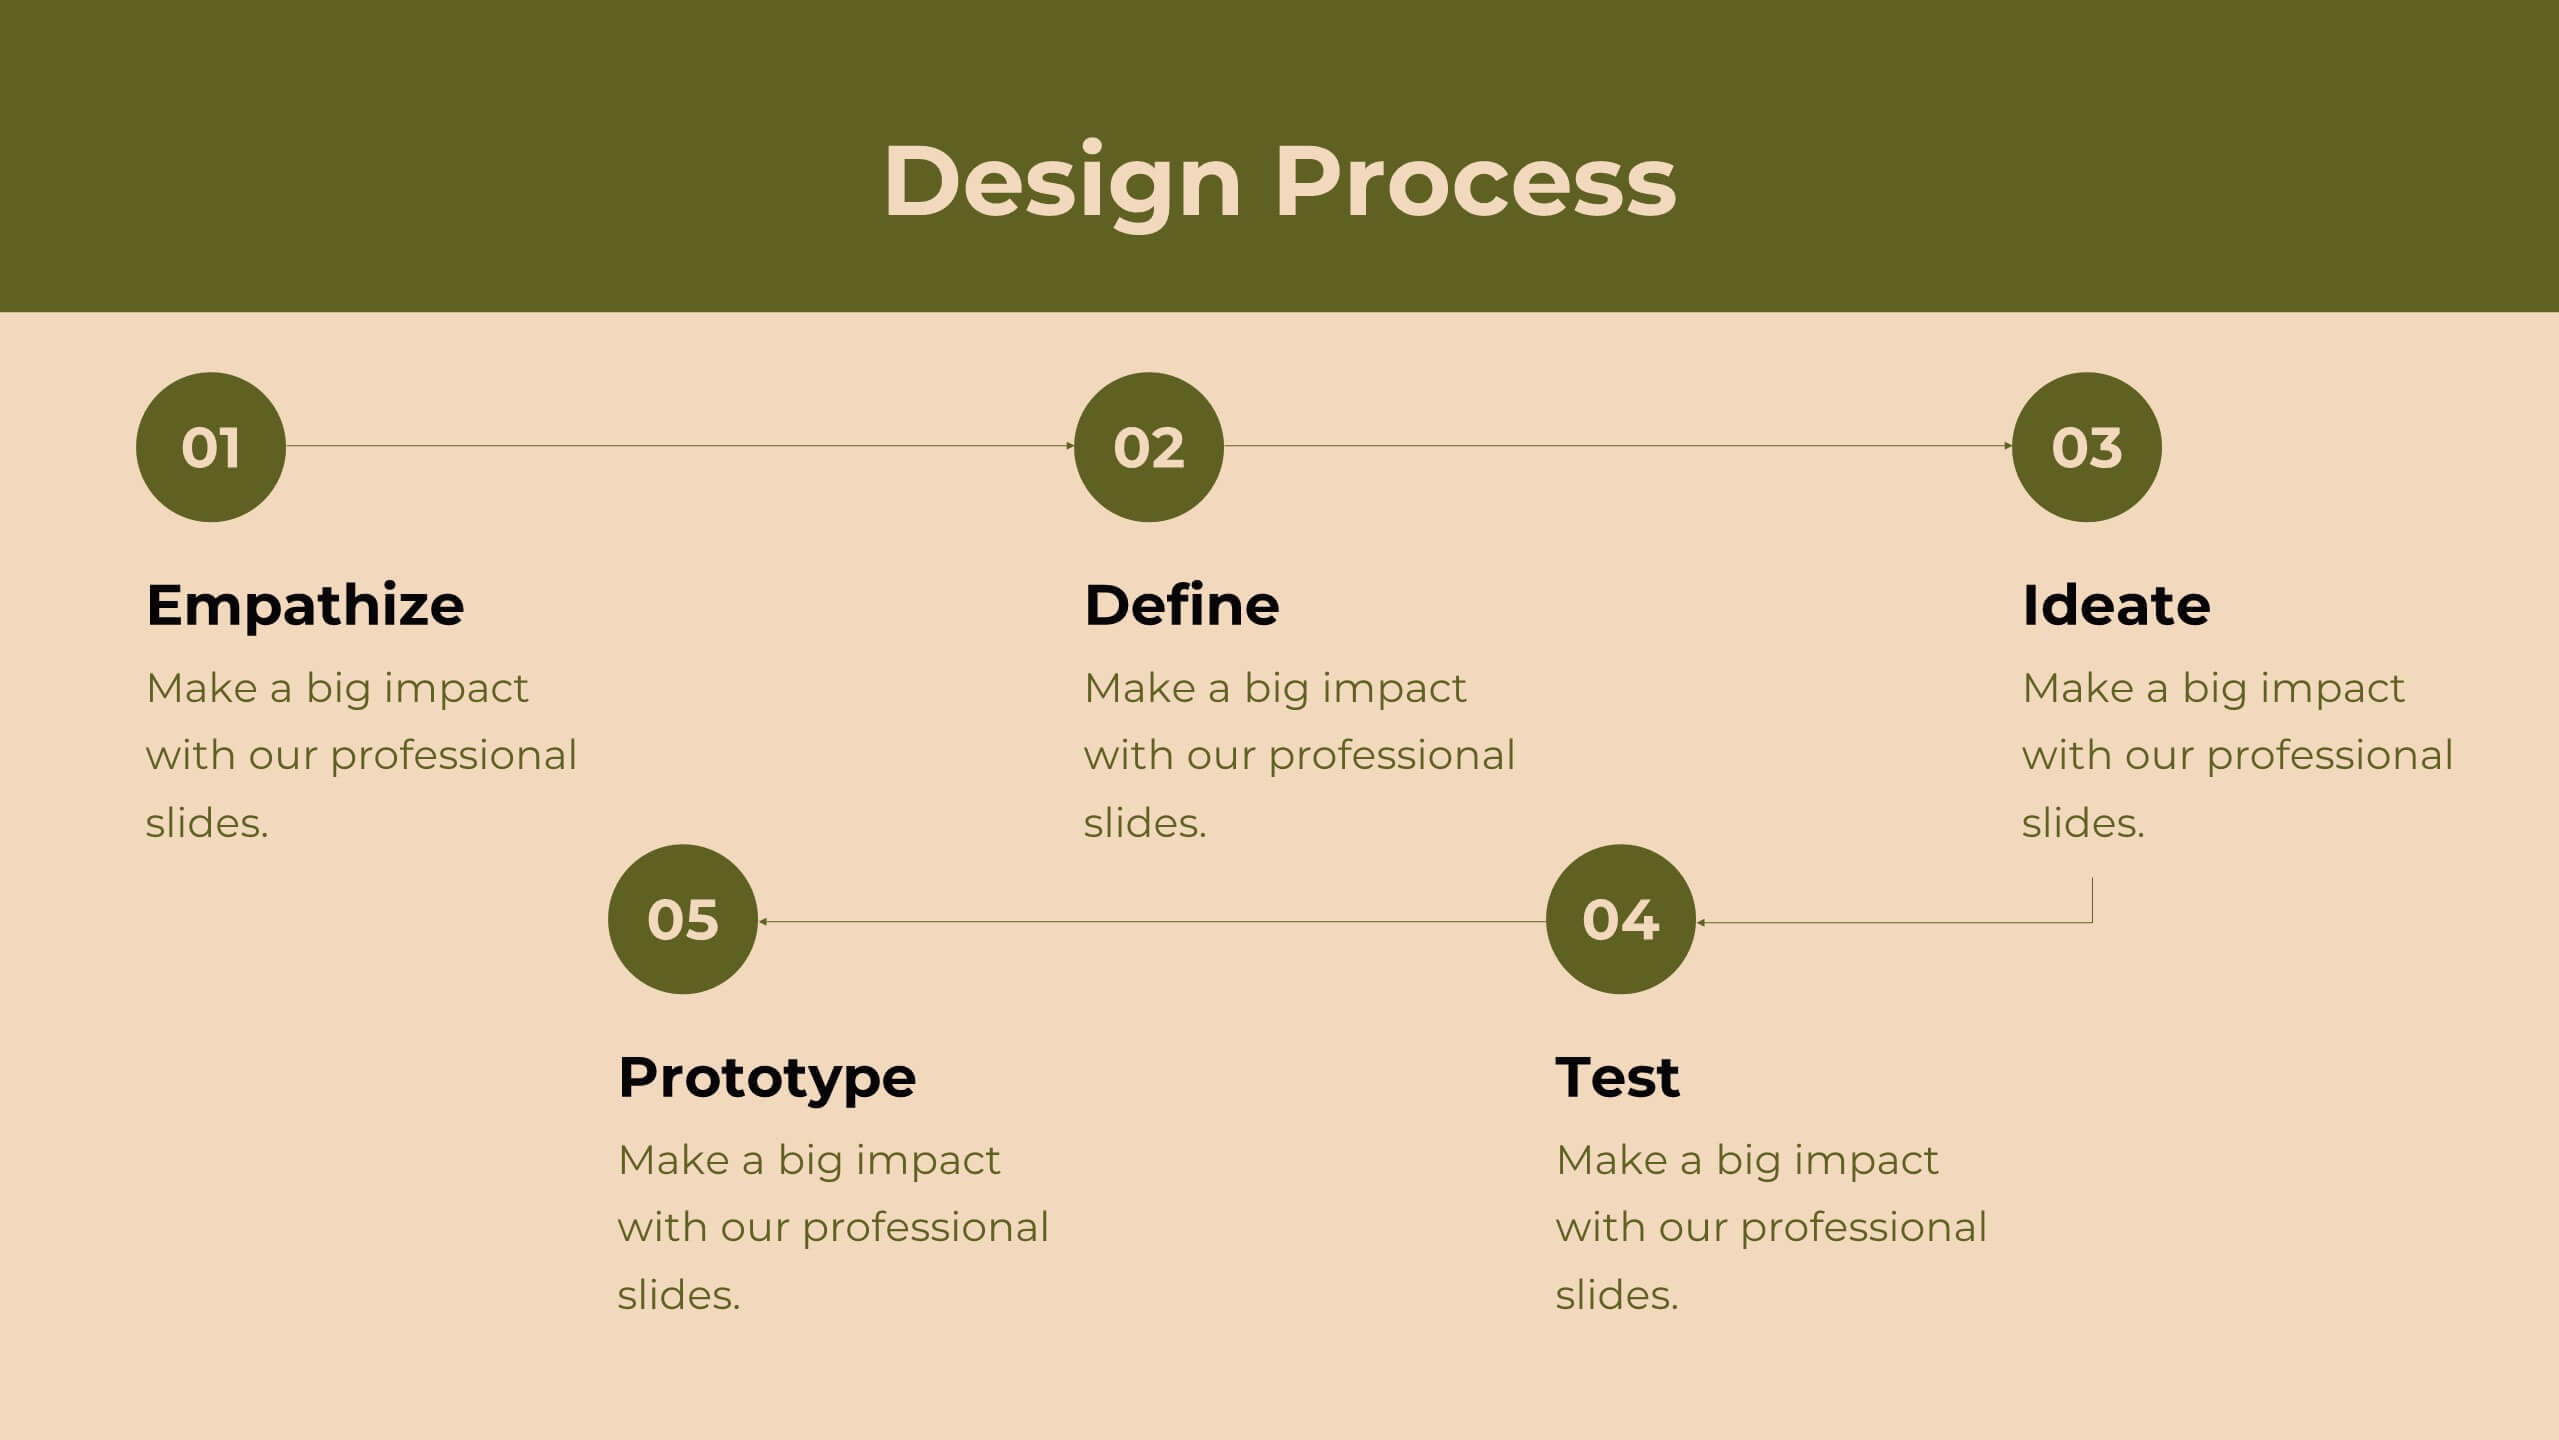
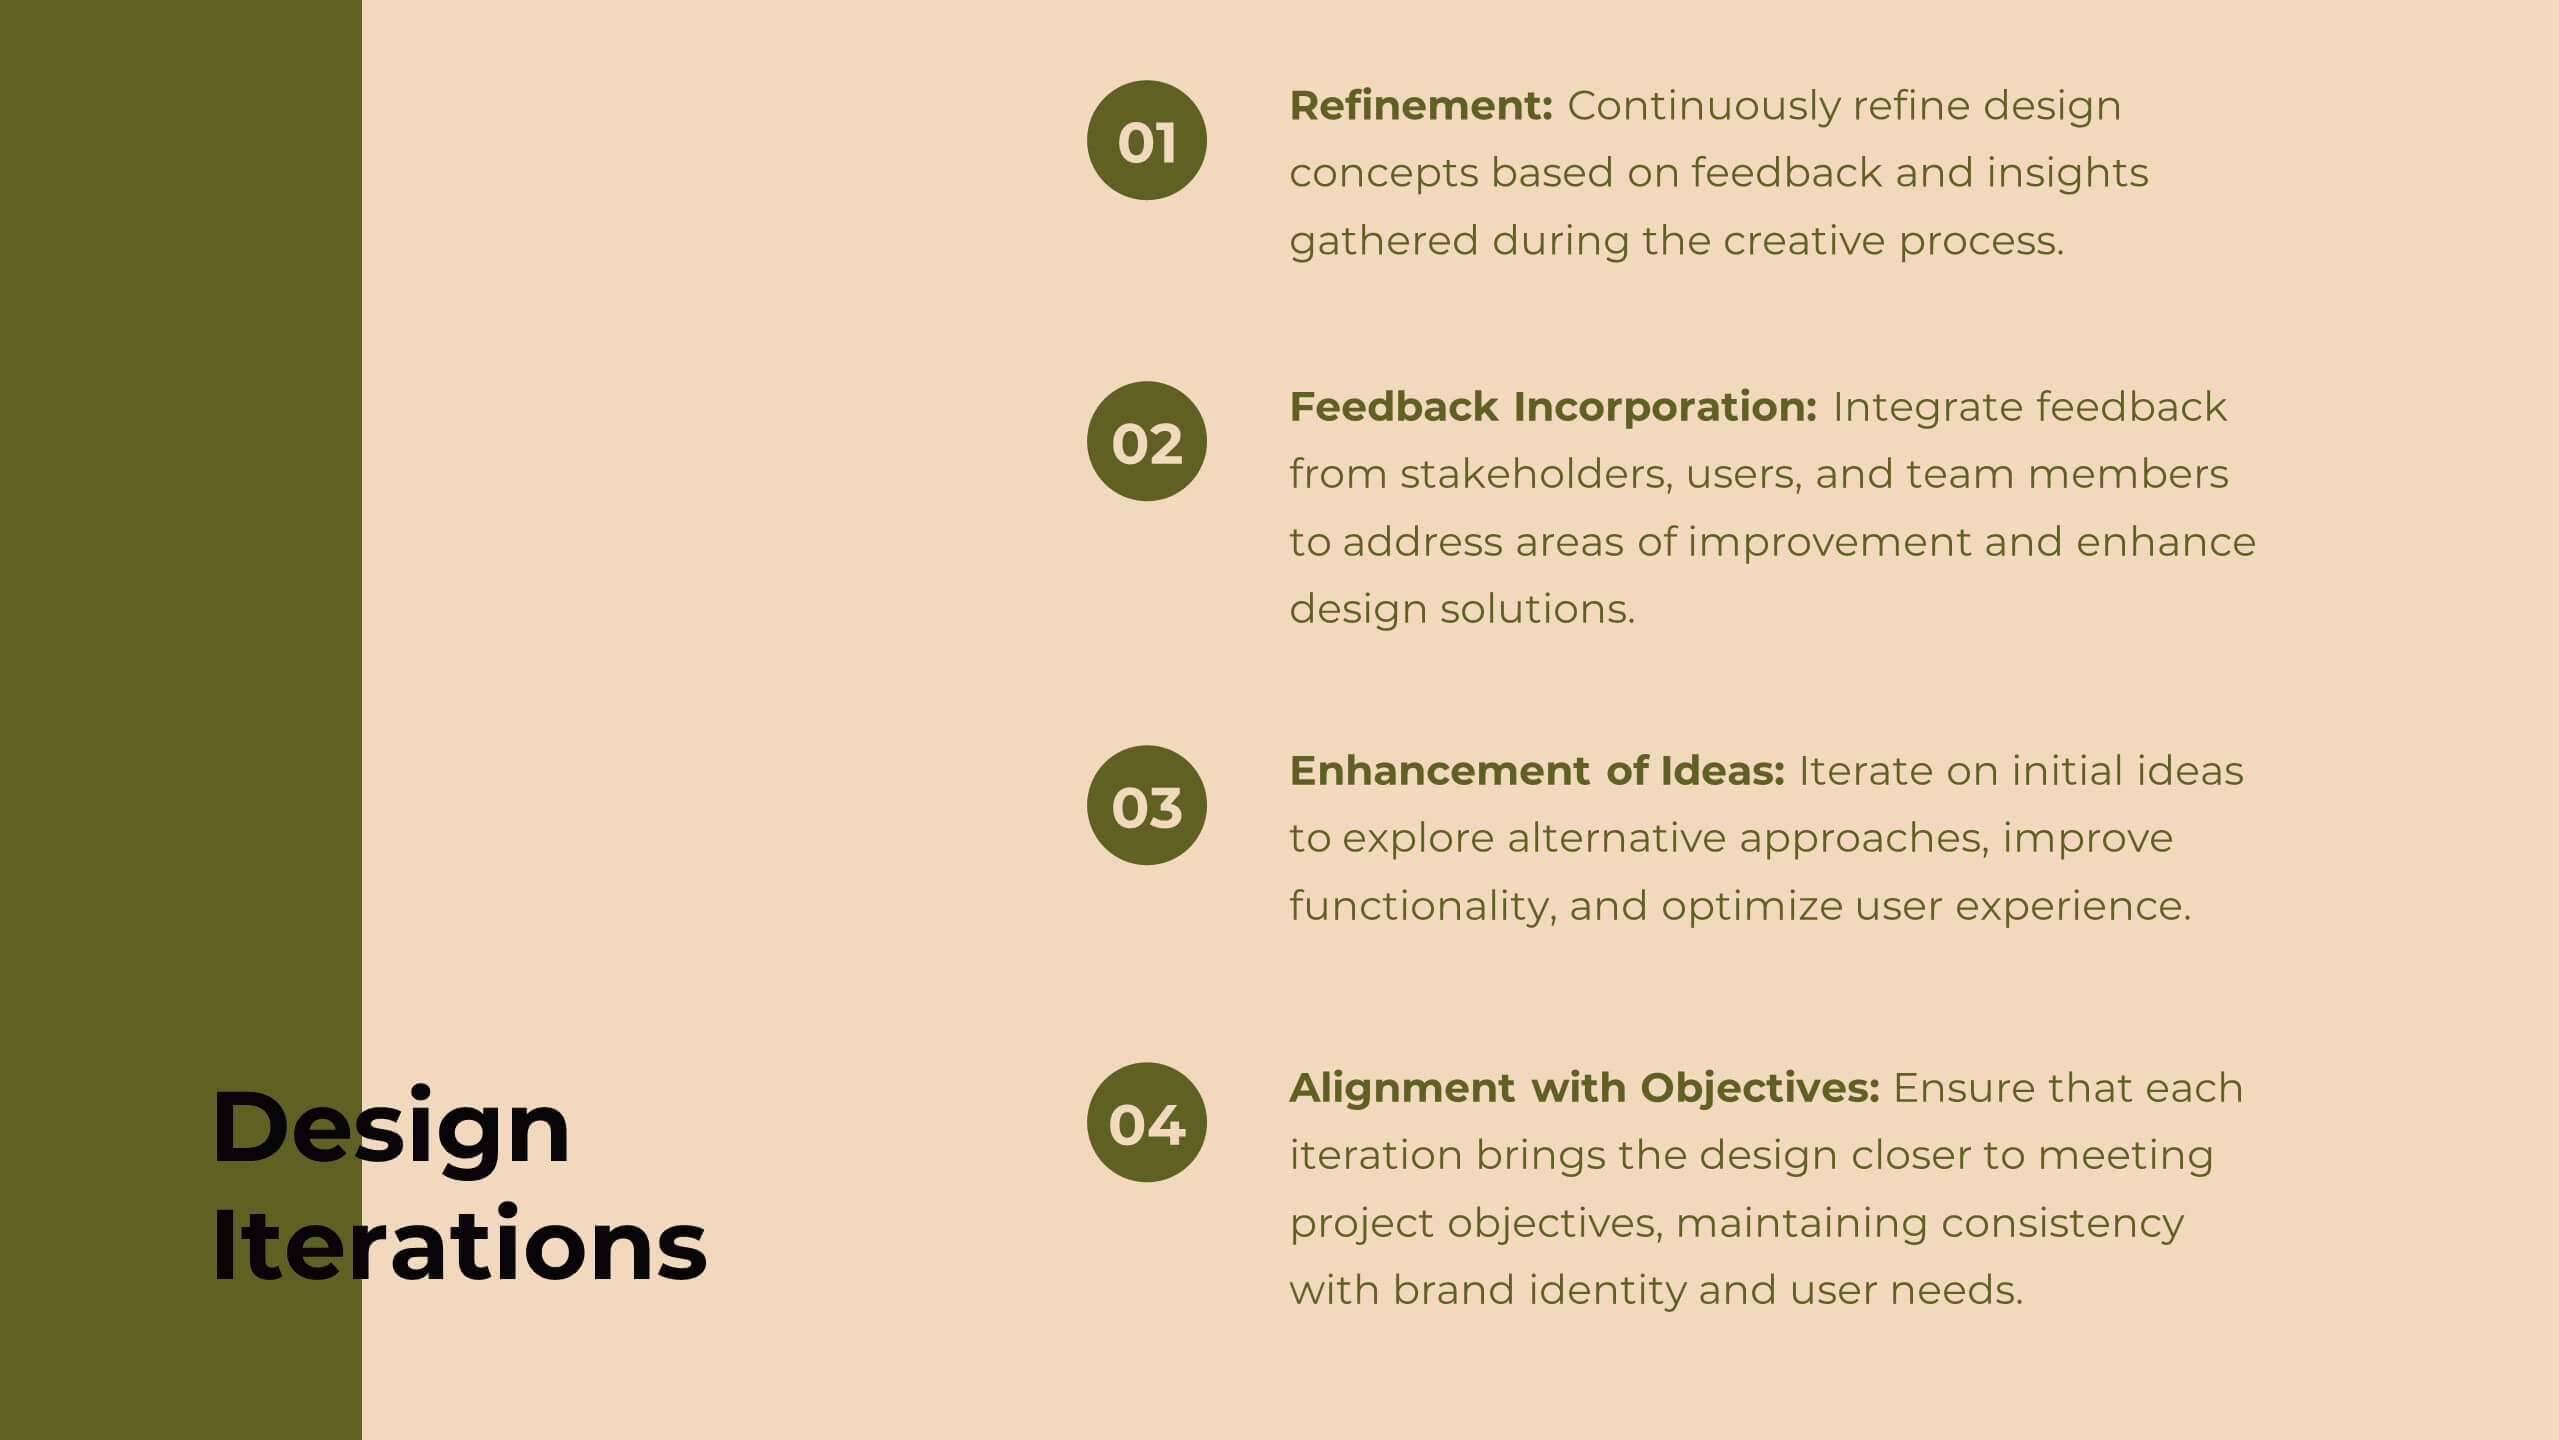
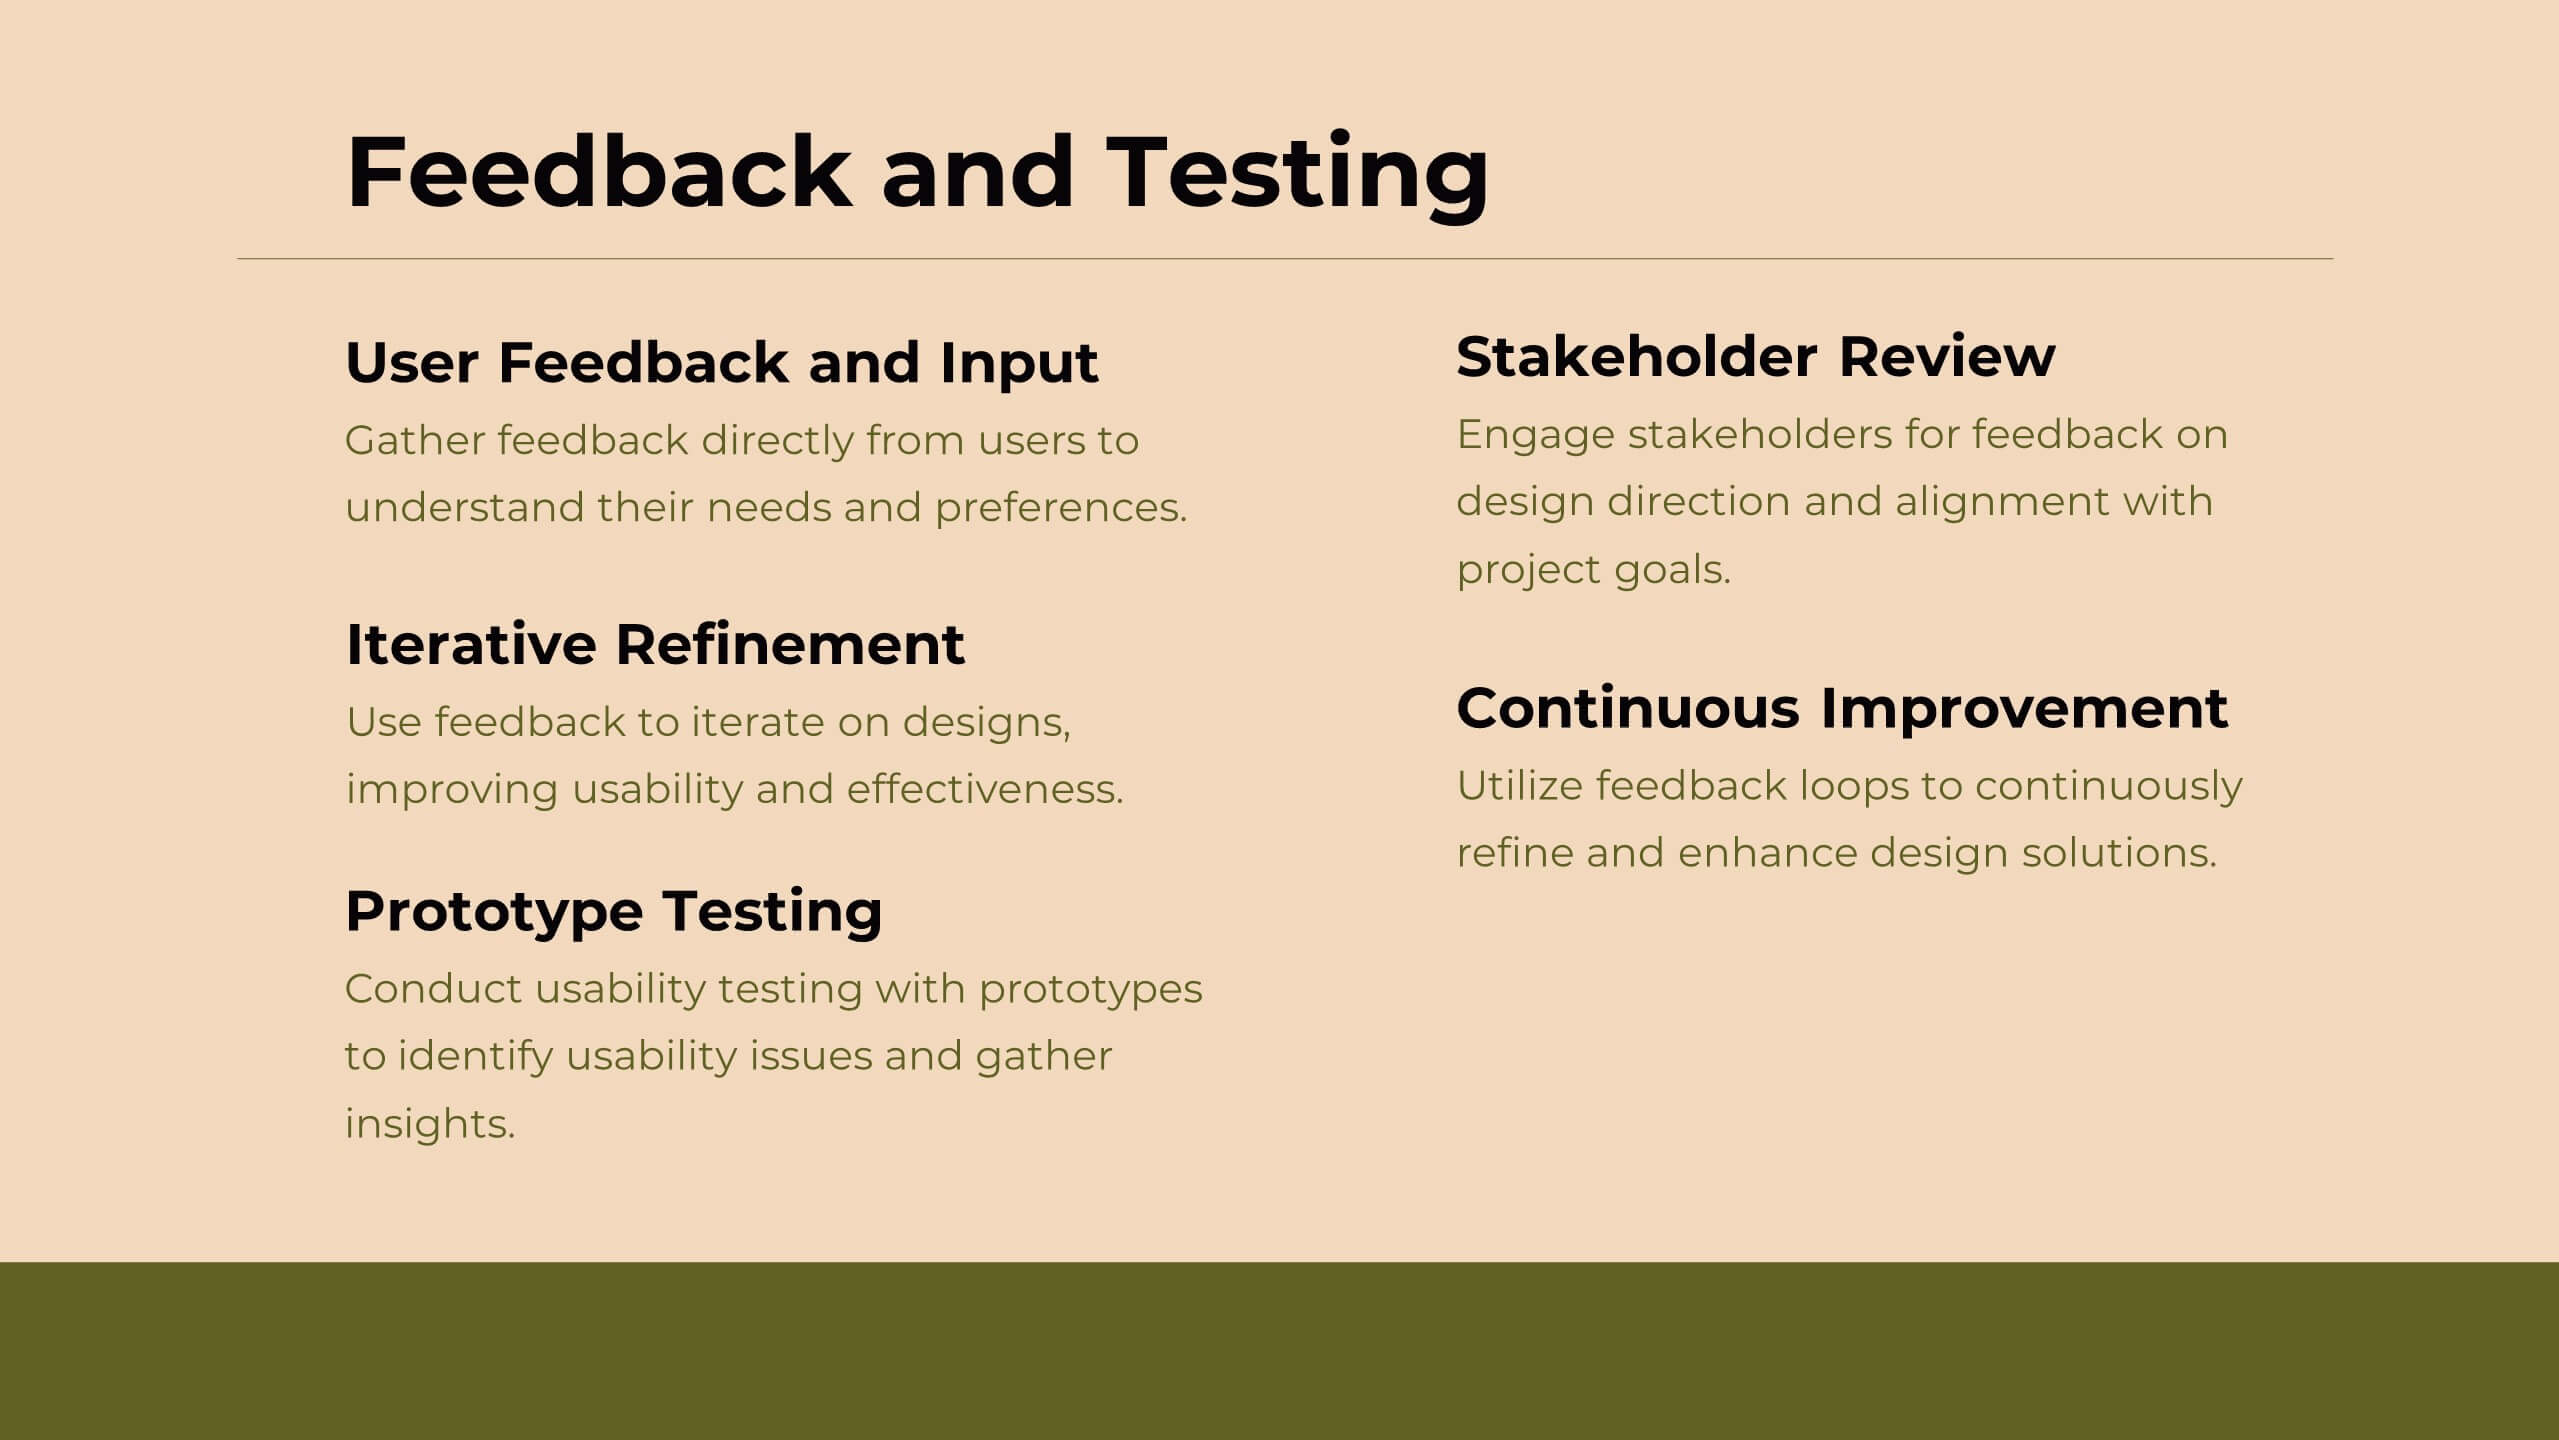
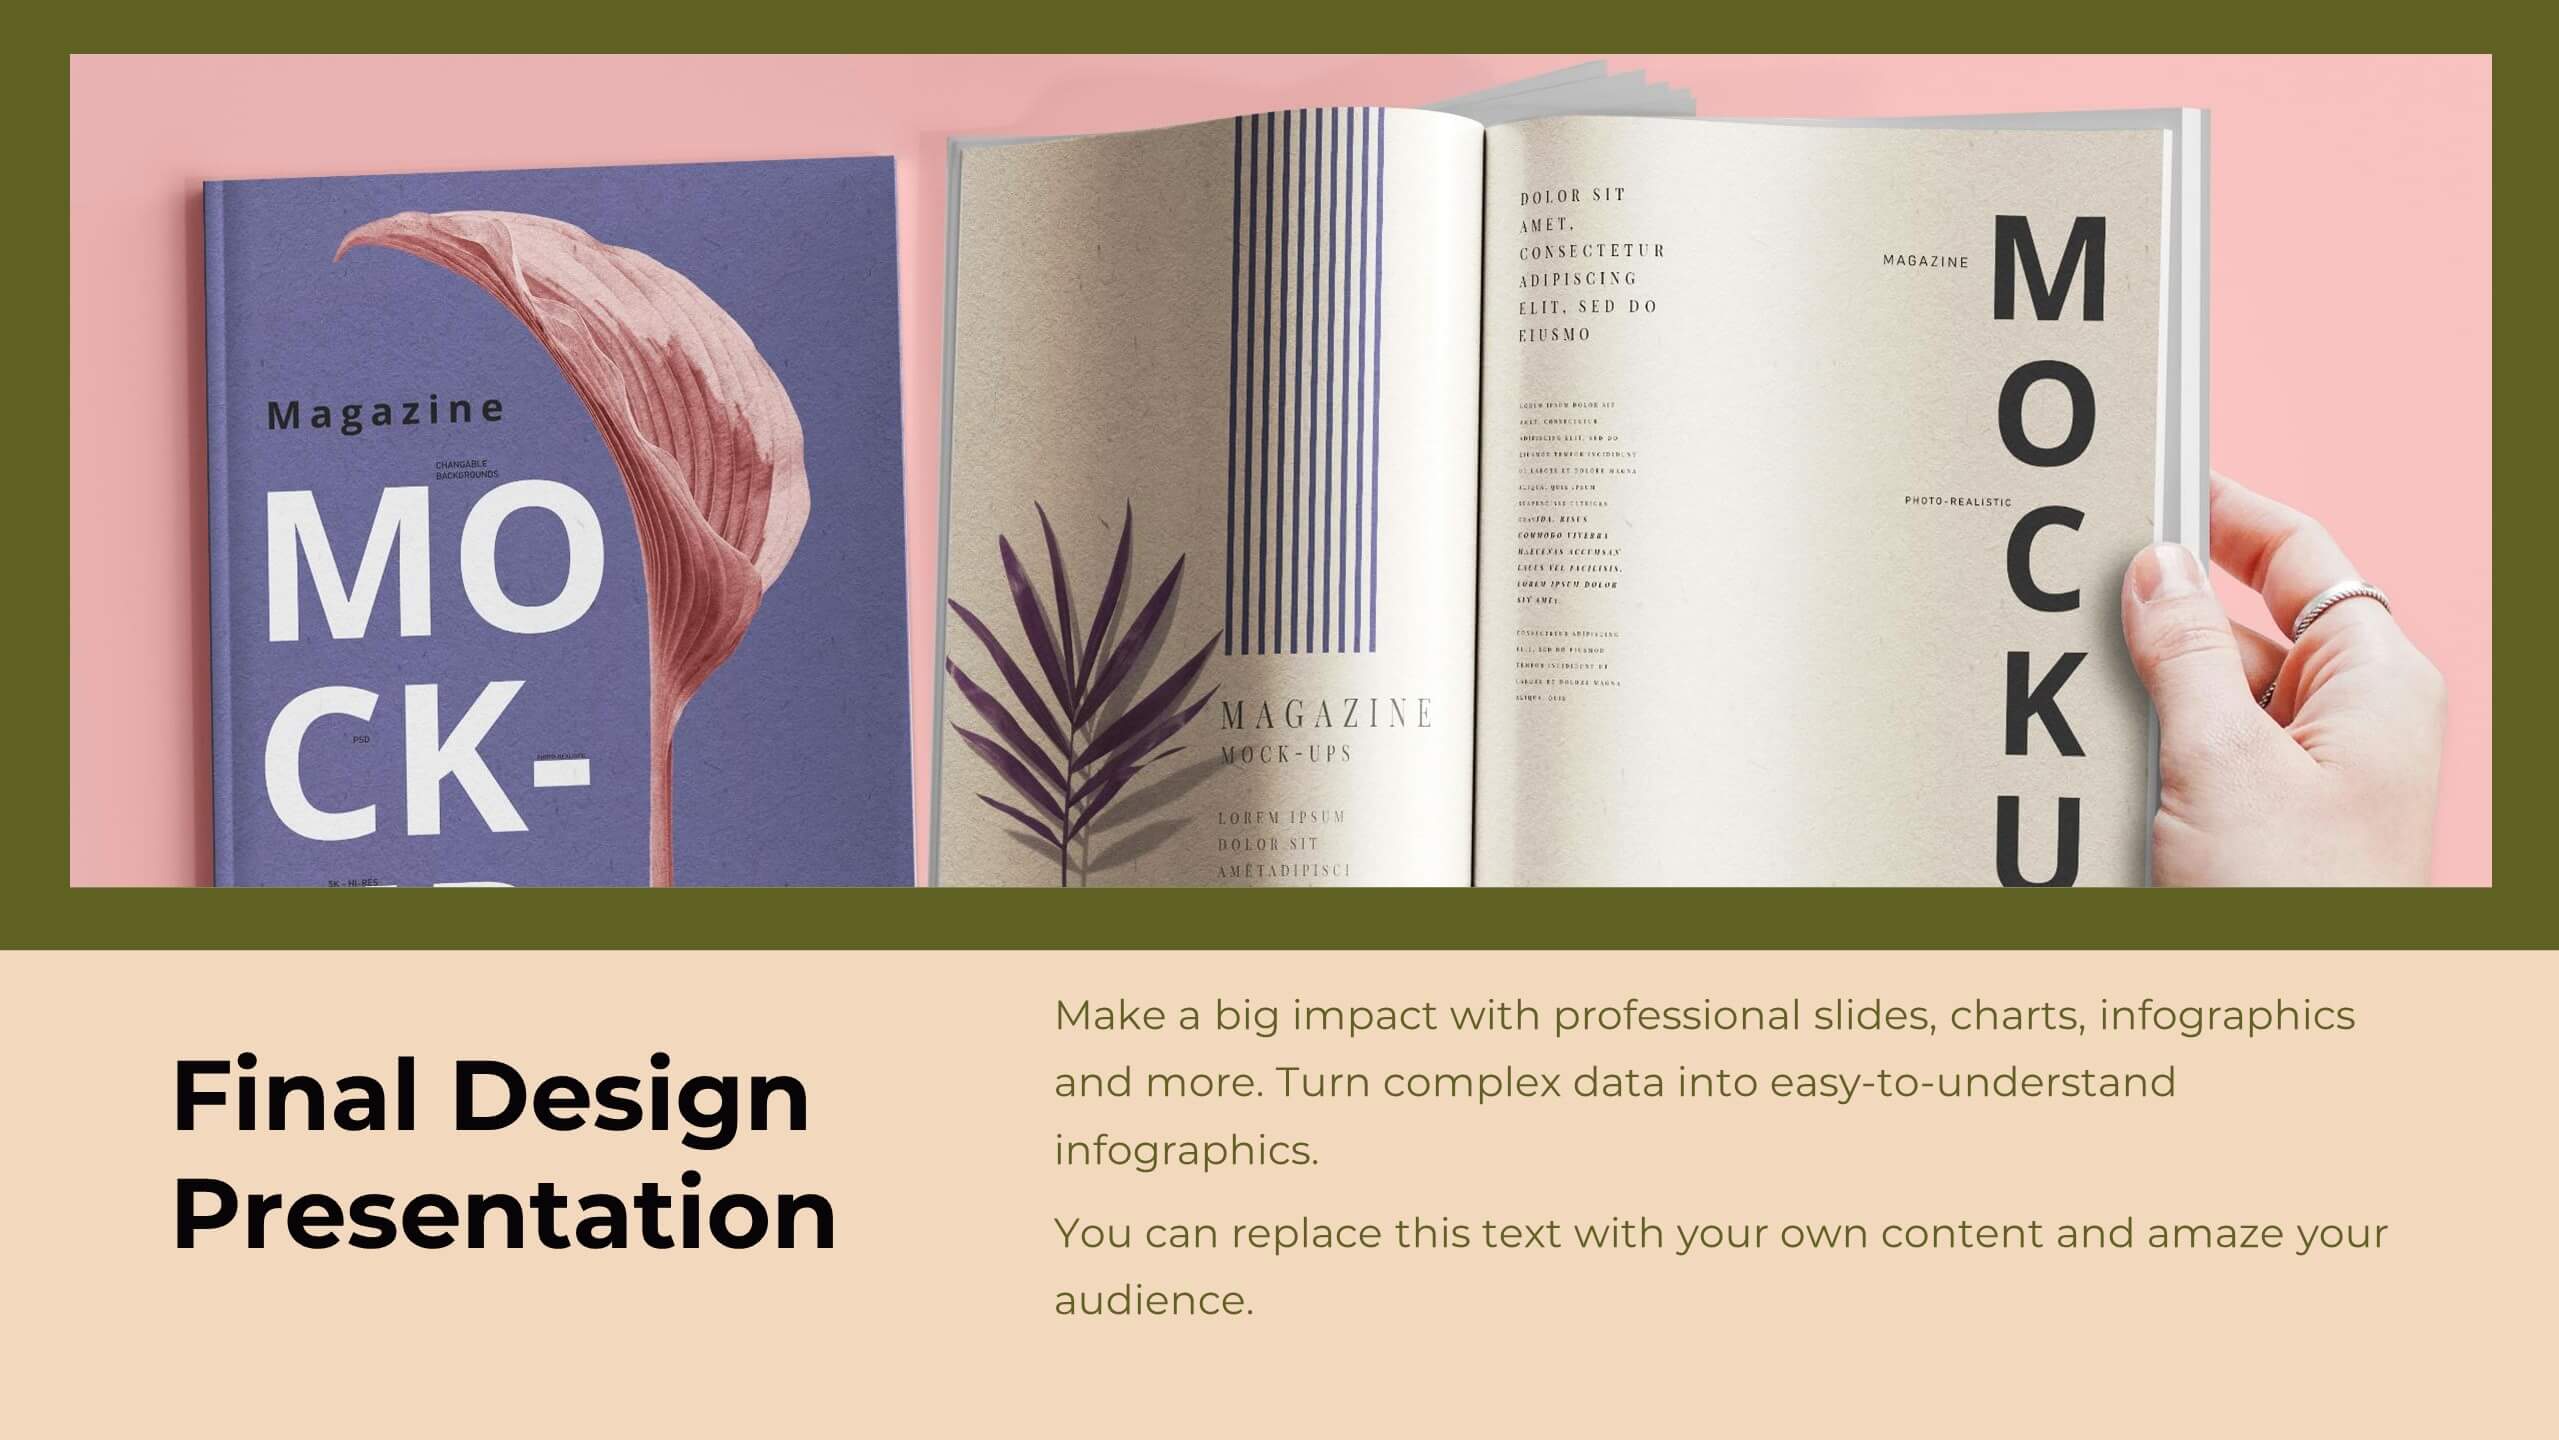
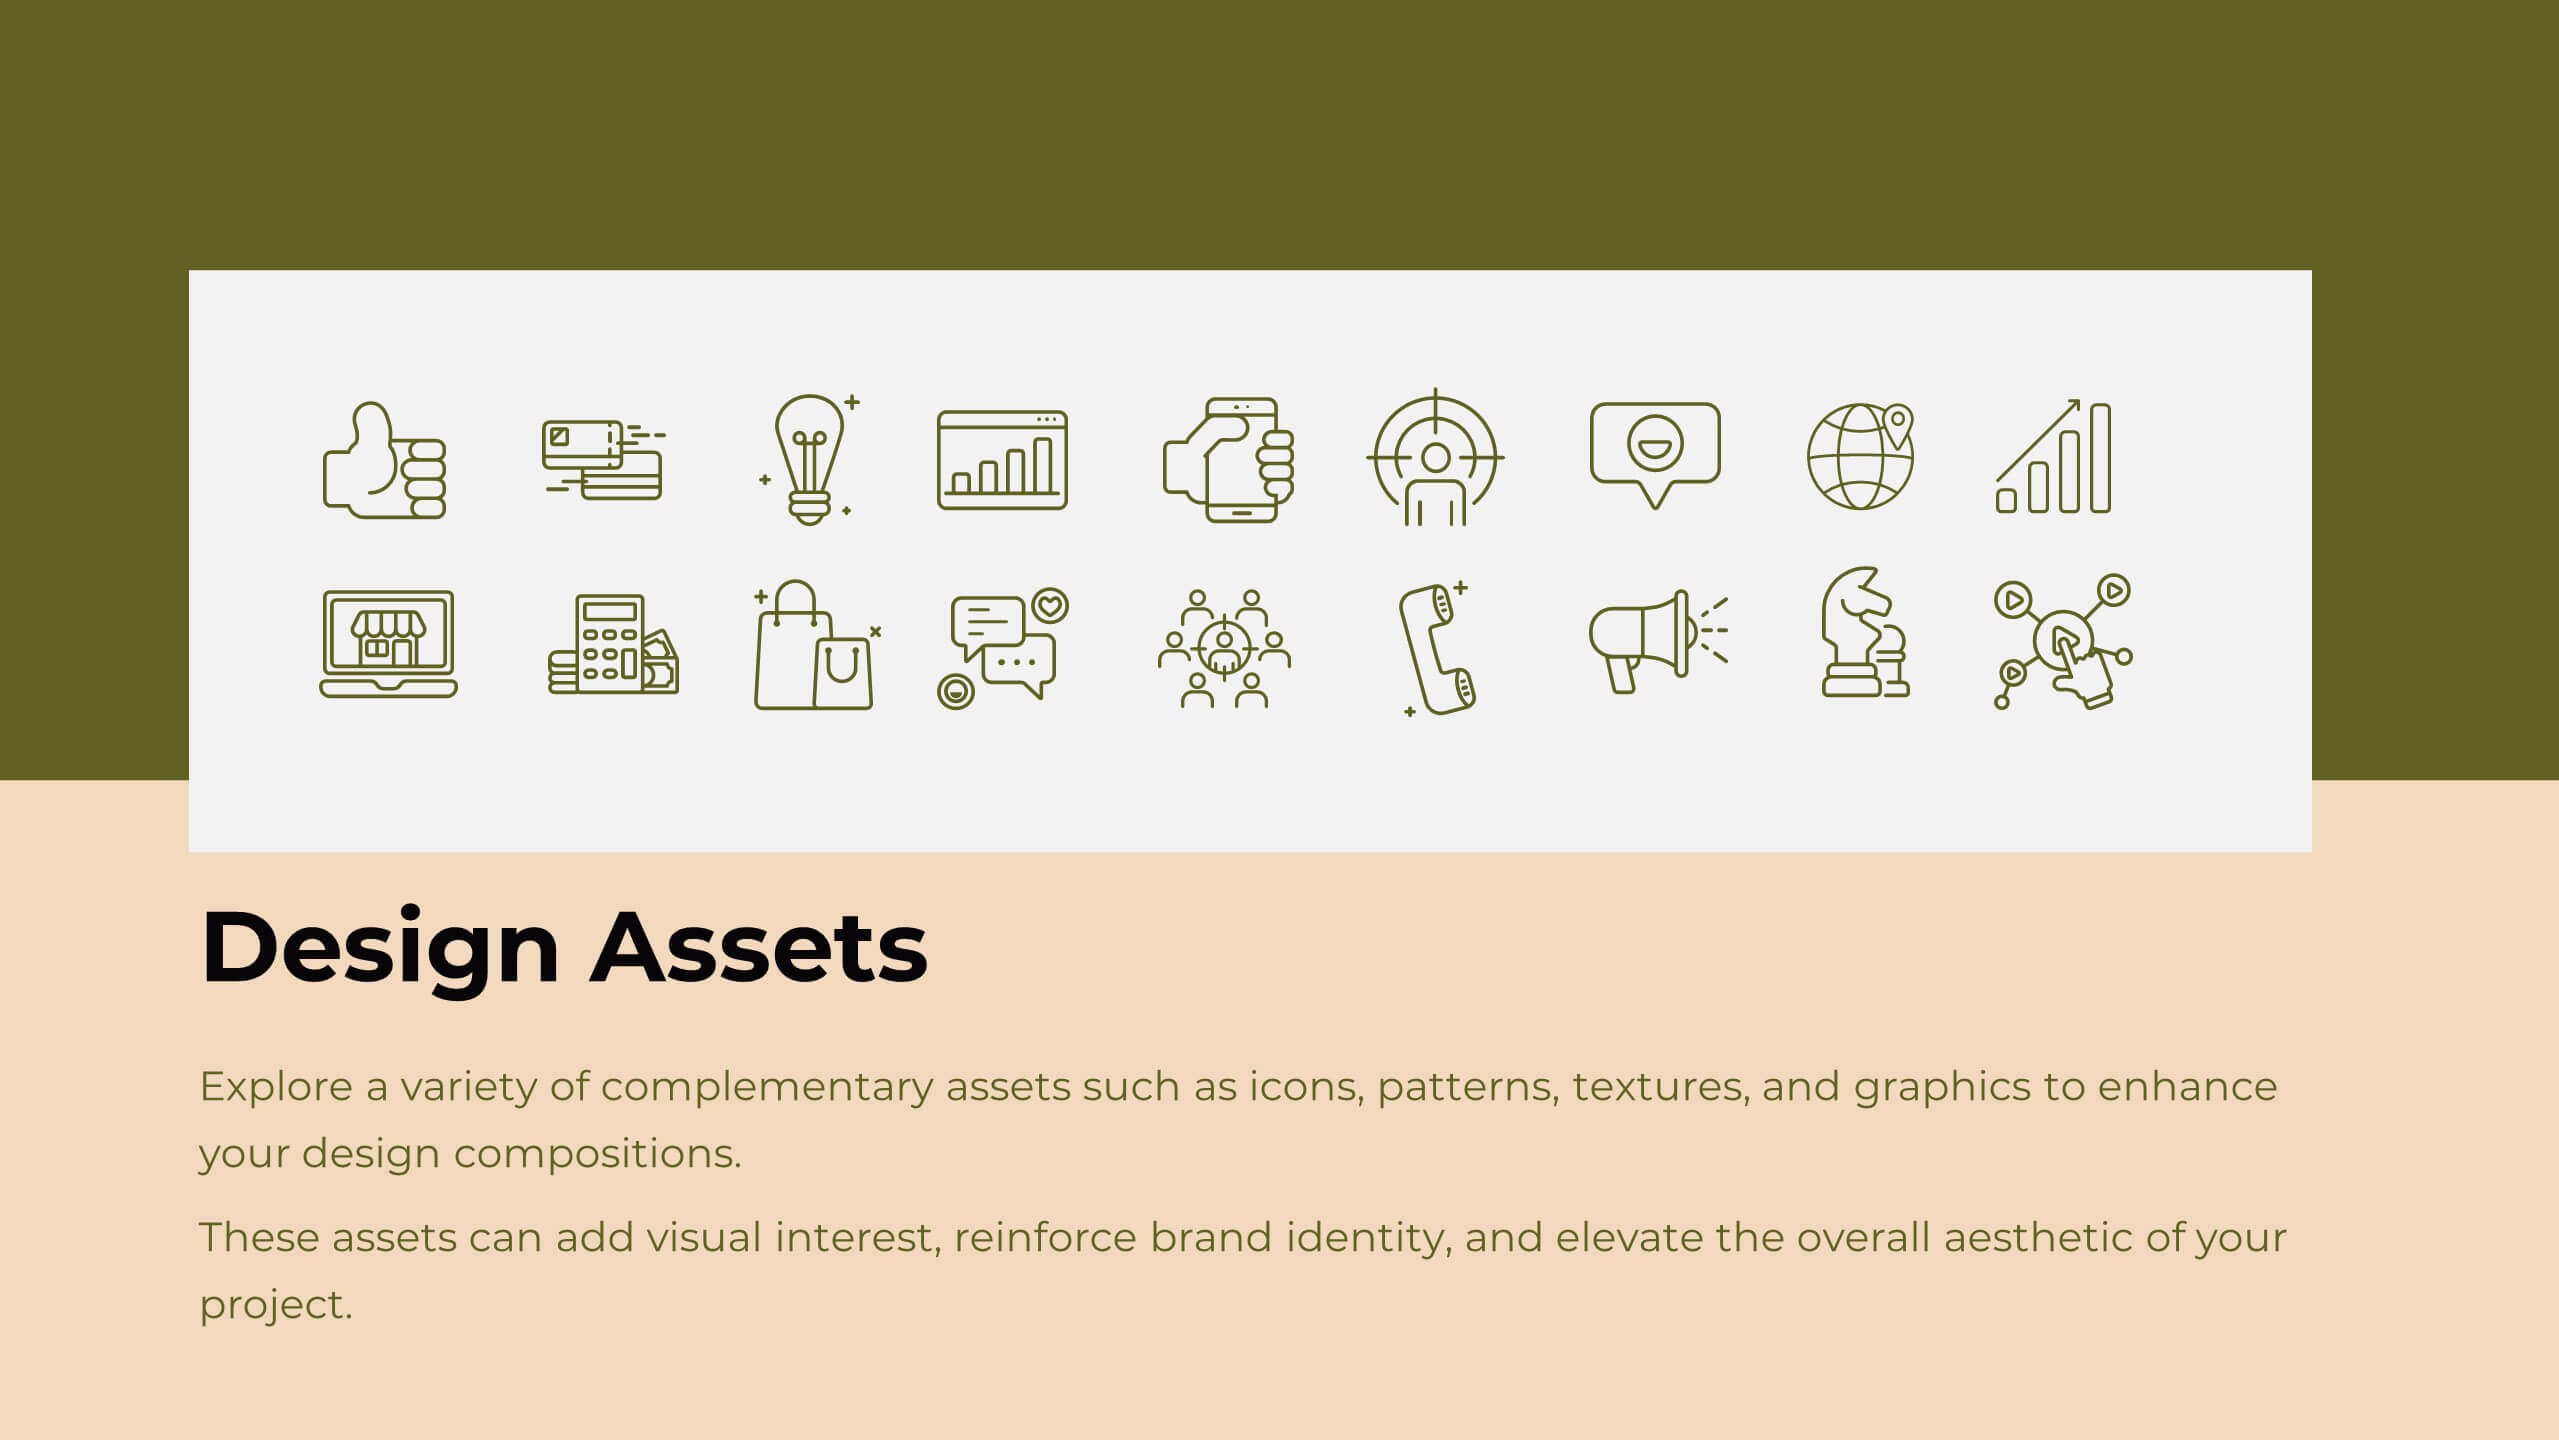
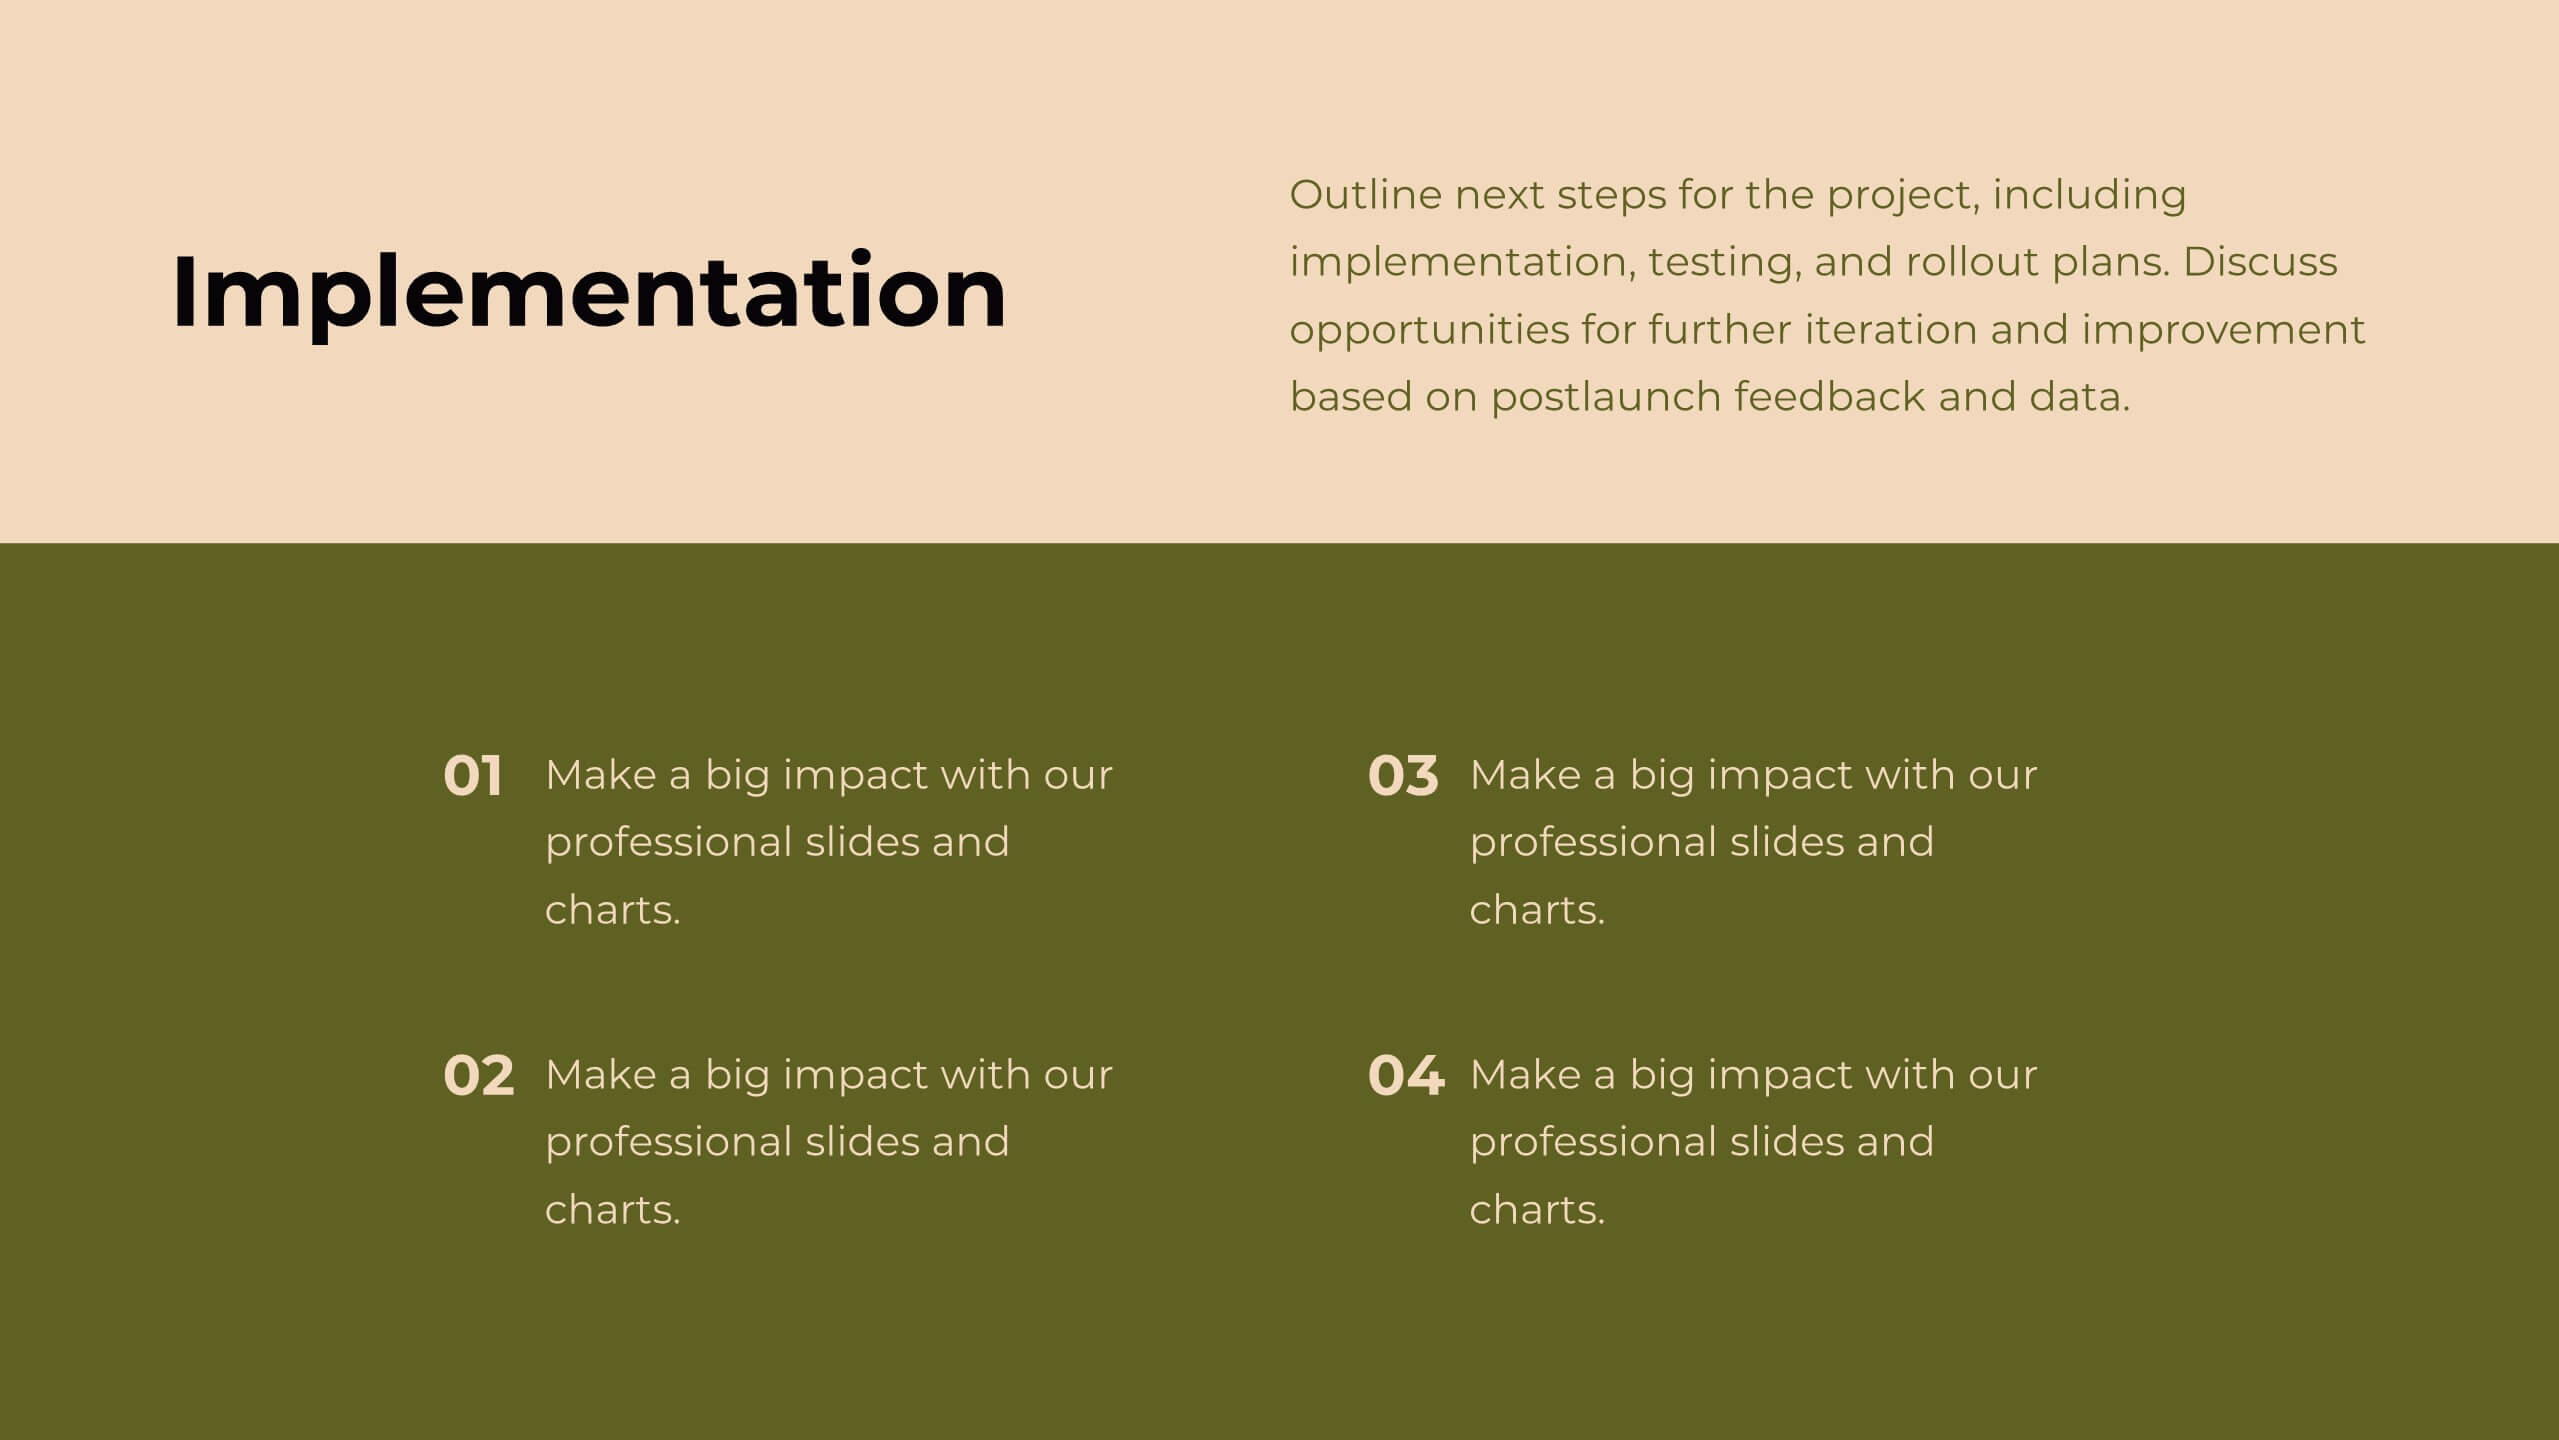
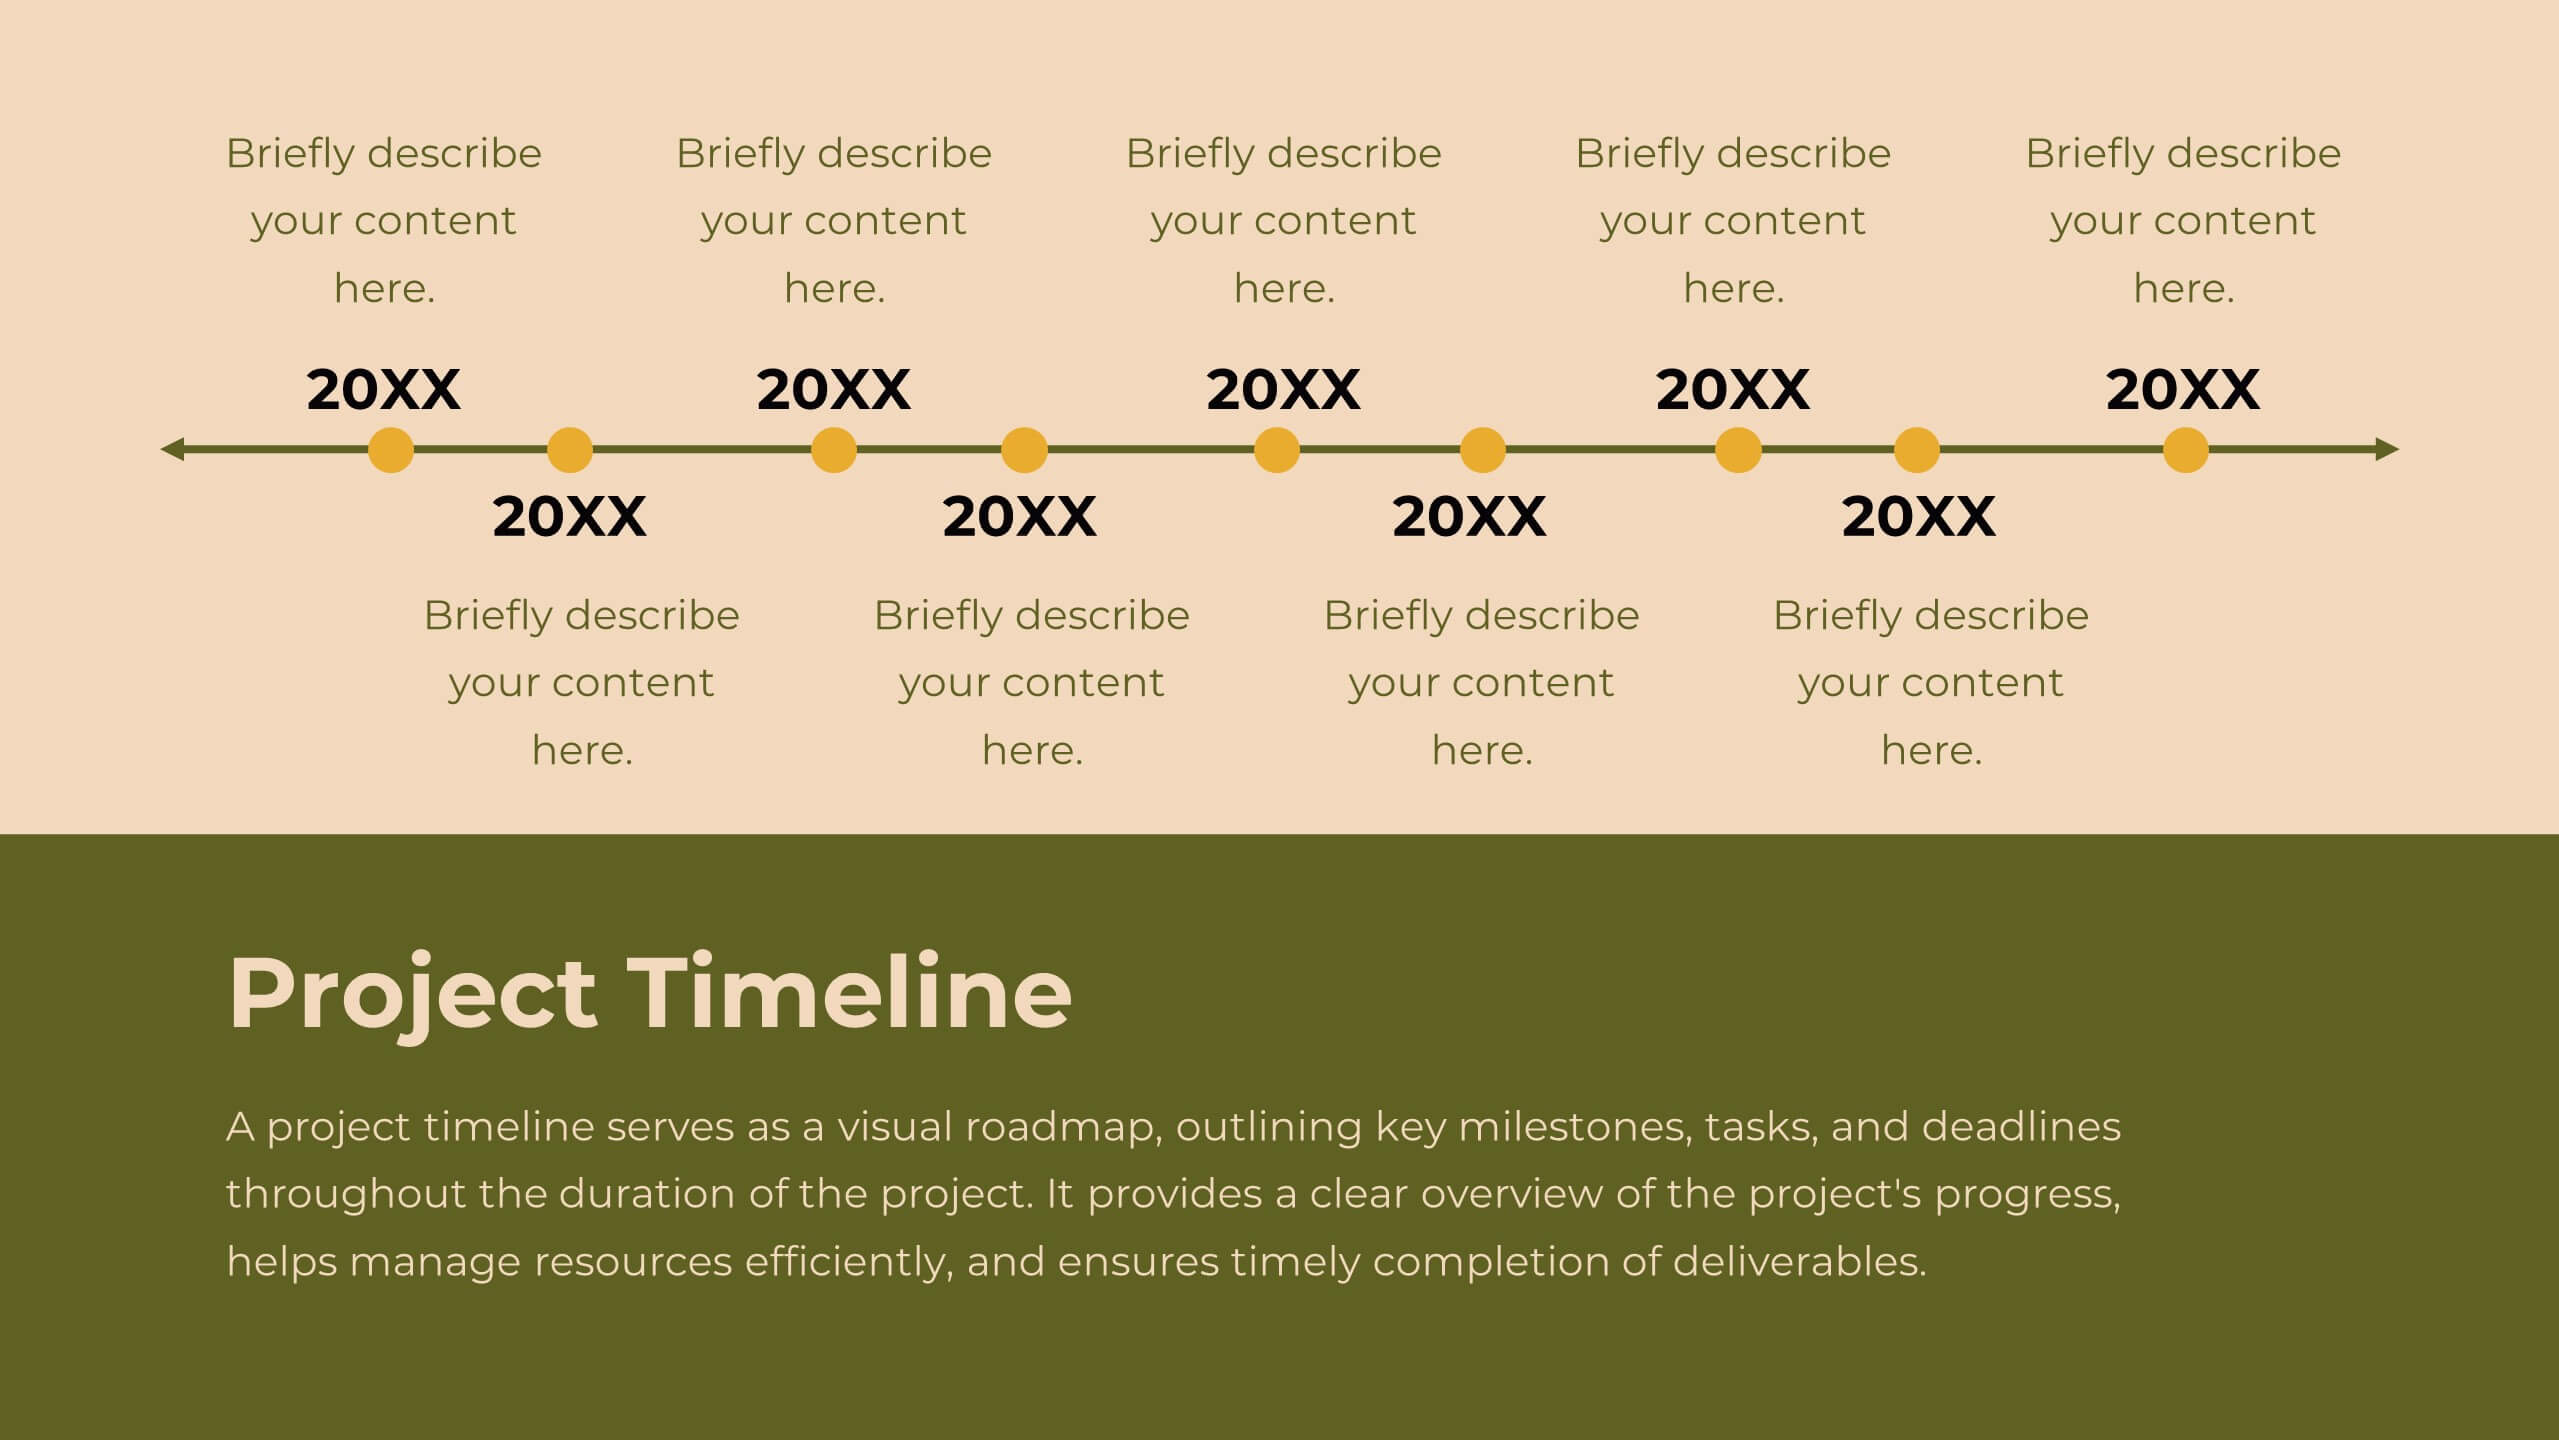
Delta Design Strategy Proposal Presentation
Transform your design strategy with this elegant proposal template! Perfect for presenting design briefs, target audience insights, and concept development. Ideal for designers and creative teams aiming to align vision and execution. Compatible with PowerPoint, Keynote, and Google Slides, this template ensures your design strategy is clear, professional, and compelling. Elevate your projects today!