


Características


¿Tienes alguna pregunta?
Recomendar


4 diapositivas
Green Initiative Report Deck Presentation
Show your sustainability story with a modern, eco-inspired presentation built to highlight green initiatives, progress reports, and environmental goals. Its clean layout makes data and insights easy to follow while maintaining a professional tone. Fully customizable and compatible with PowerPoint, Keynote, and Google Slides for effortless presentation design.


21 diapositivas
Duskflare Corporate Strategy Proposal Presentation
Present your corporate strategy effectively with this comprehensive template, featuring sections on market trends, SWOT analysis, strategic initiatives, and risk management. Designed for clarity and impact, it’s ideal for outlining high-level goals and action plans. Compatible with PowerPoint, Keynote, and Google Slides for seamless presentations.


5 diapositivas
Step-by-Step Planning Roadmap Presentation
Clarify each phase of your strategy with the Step-by-Step Planning Roadmap Presentation. This engaging slide design uses a staircase-style layout with labeled checkpoints (A–E) and matching text boxes to clearly communicate sequential goals or stages. Great for project roadmaps, implementation plans, or business timelines. Fully customizable in PowerPoint, Keynote, and Google Slides.


4 diapositivas
Lead Nurturing Funnel Breakdown Presentation
Guide leads through every stage with the Lead Nurturing Funnel Breakdown Presentation. This slide visualizes the customer journey from awareness to conversion, helping you present marketing automation, CRM strategies, or content funnels. Fully customizable in PowerPoint, Google Slides, and Canva for seamless integration.
22 diapositivas
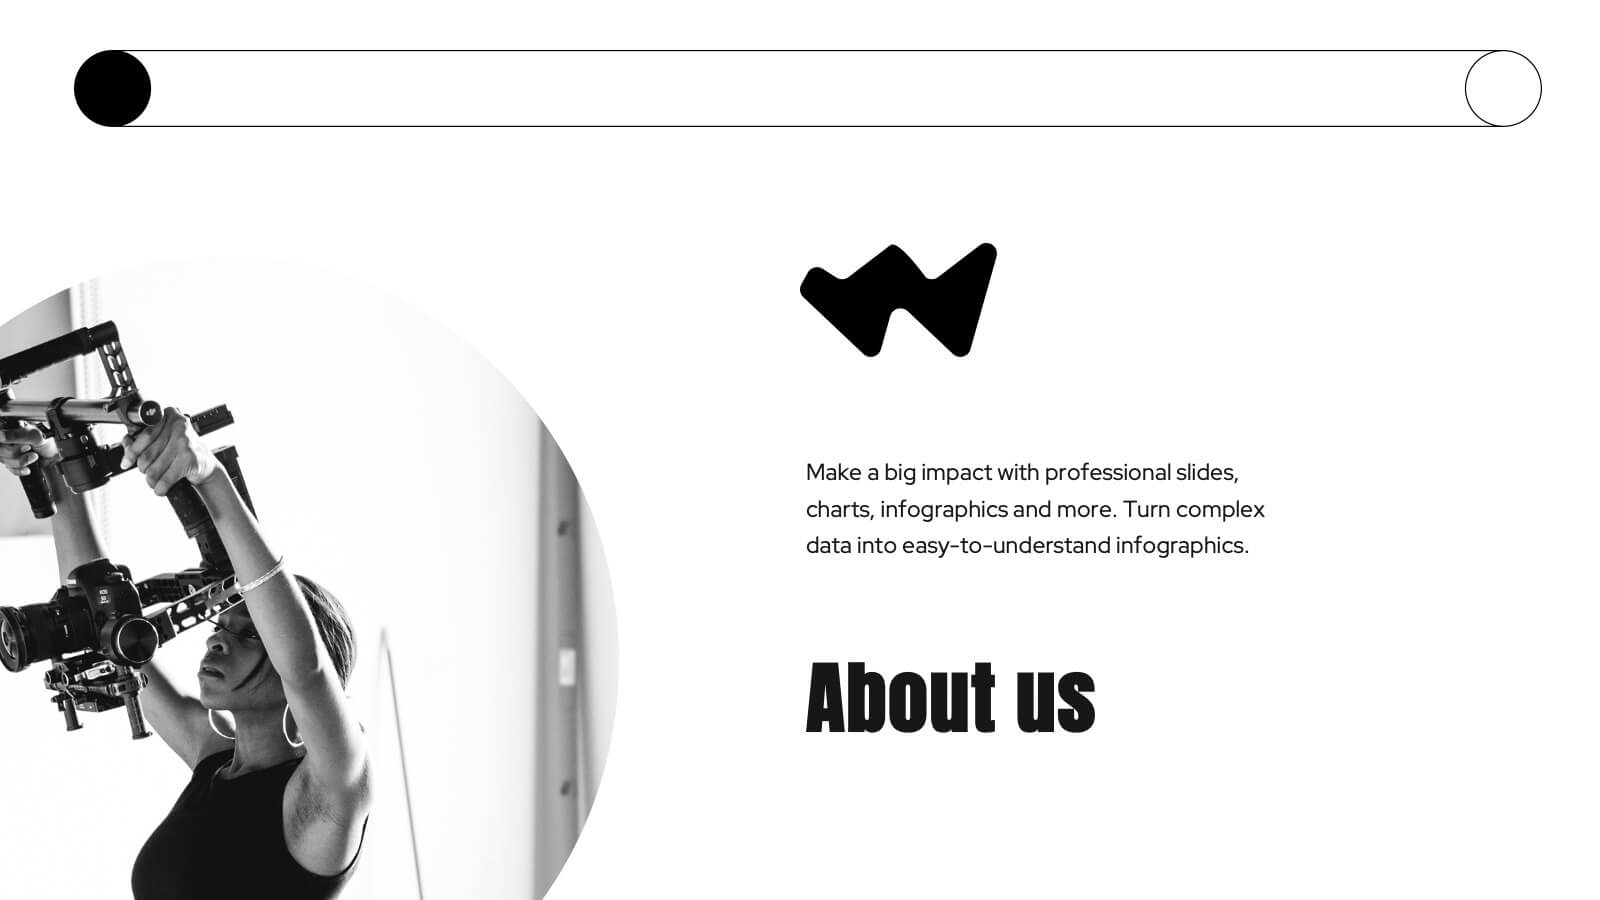
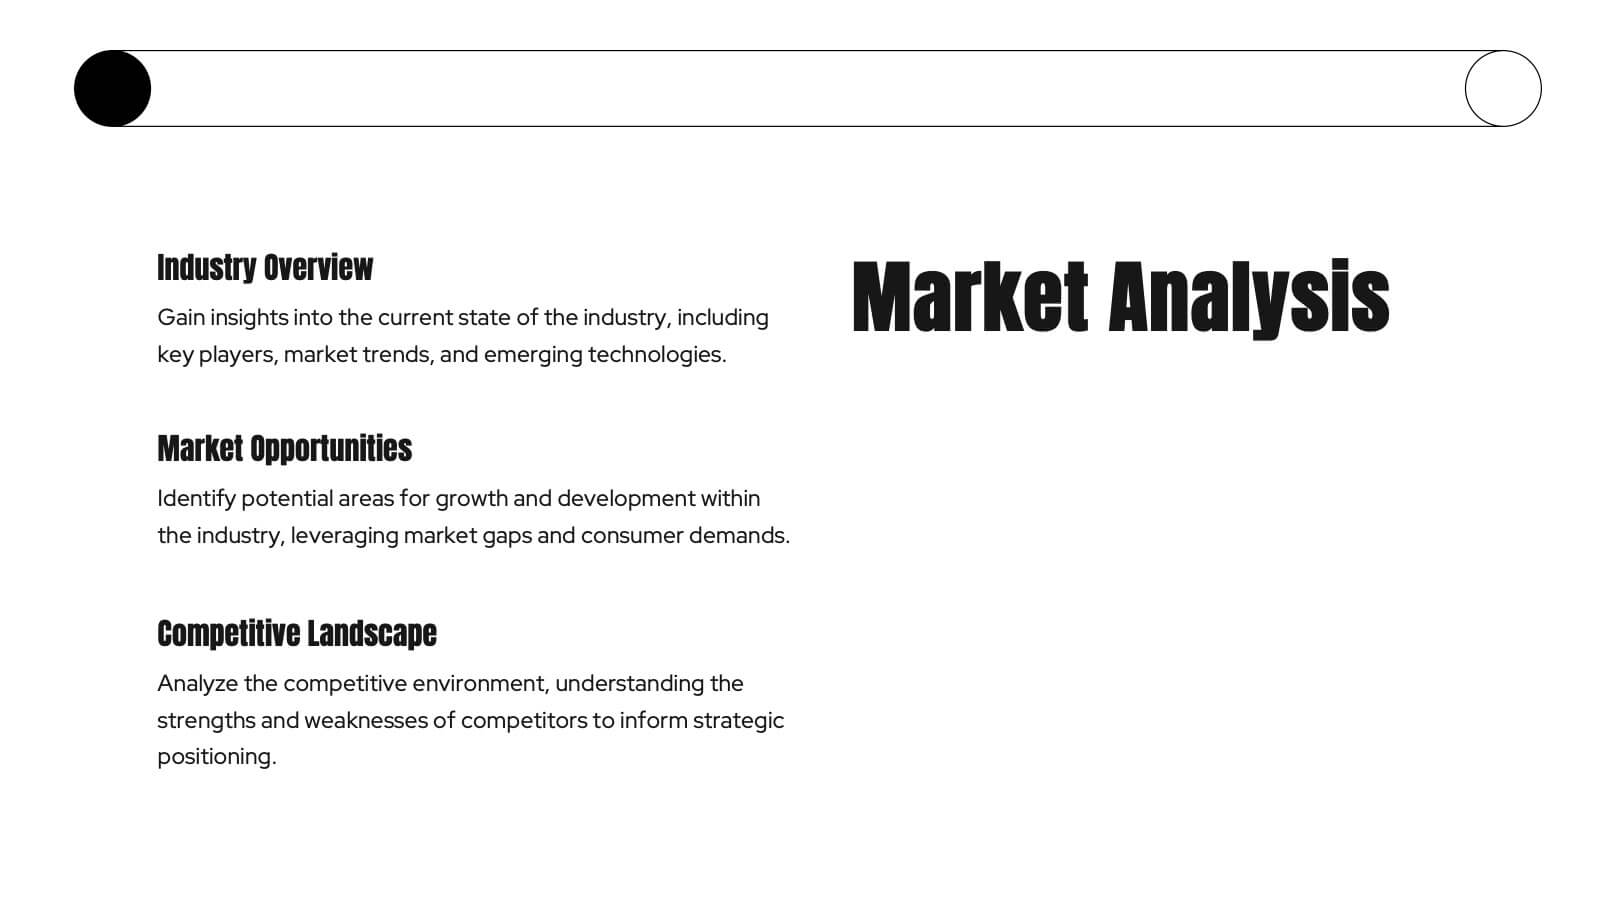
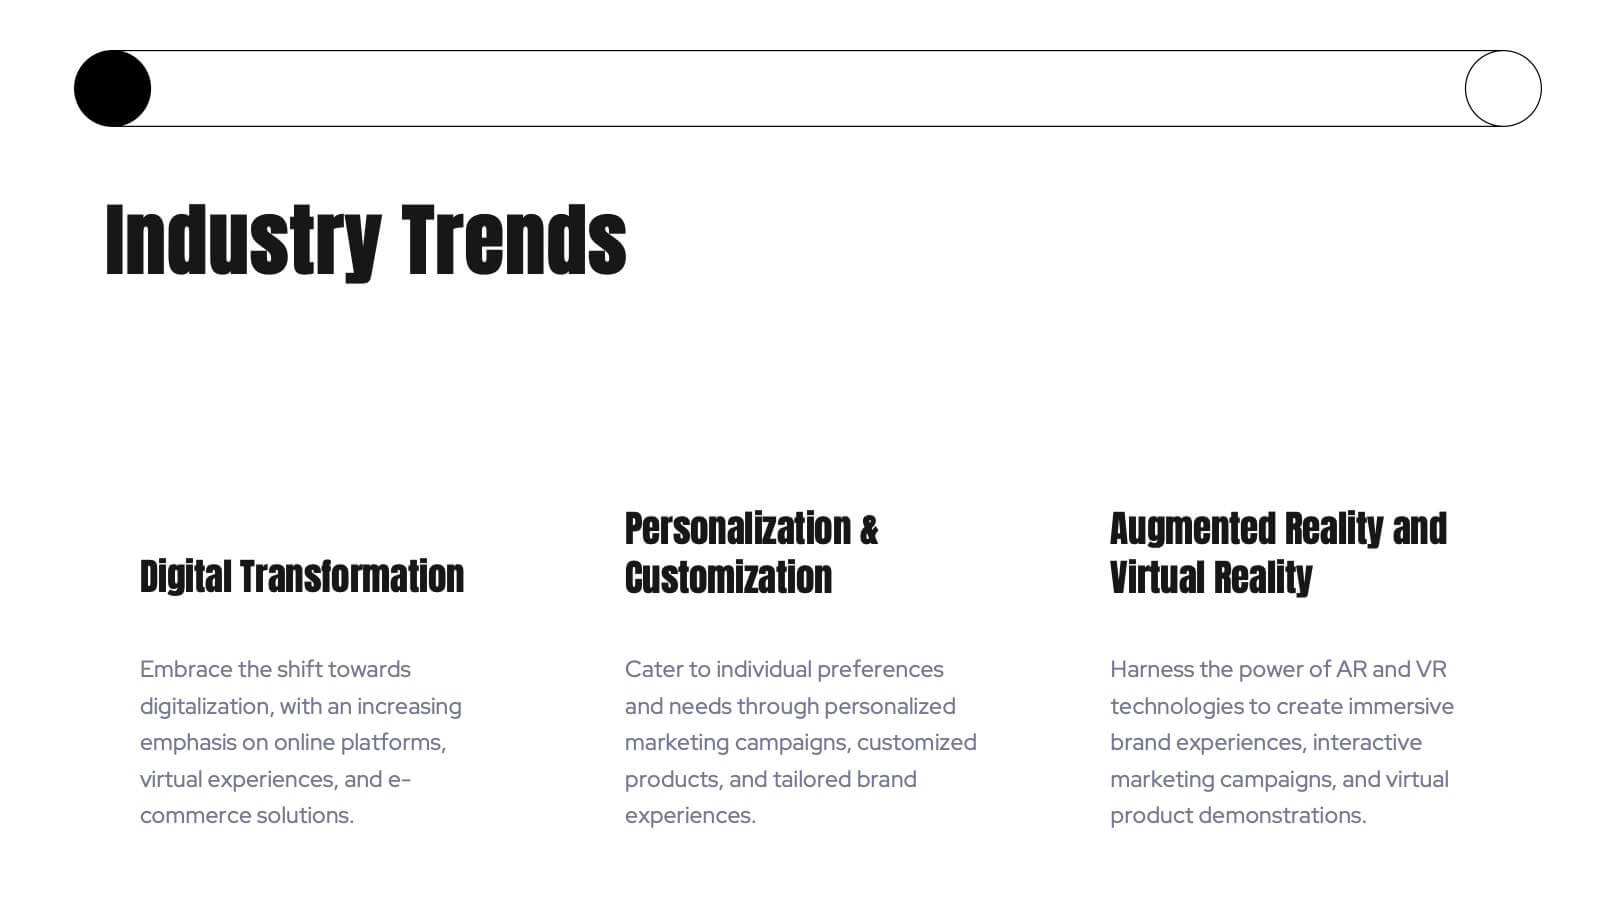
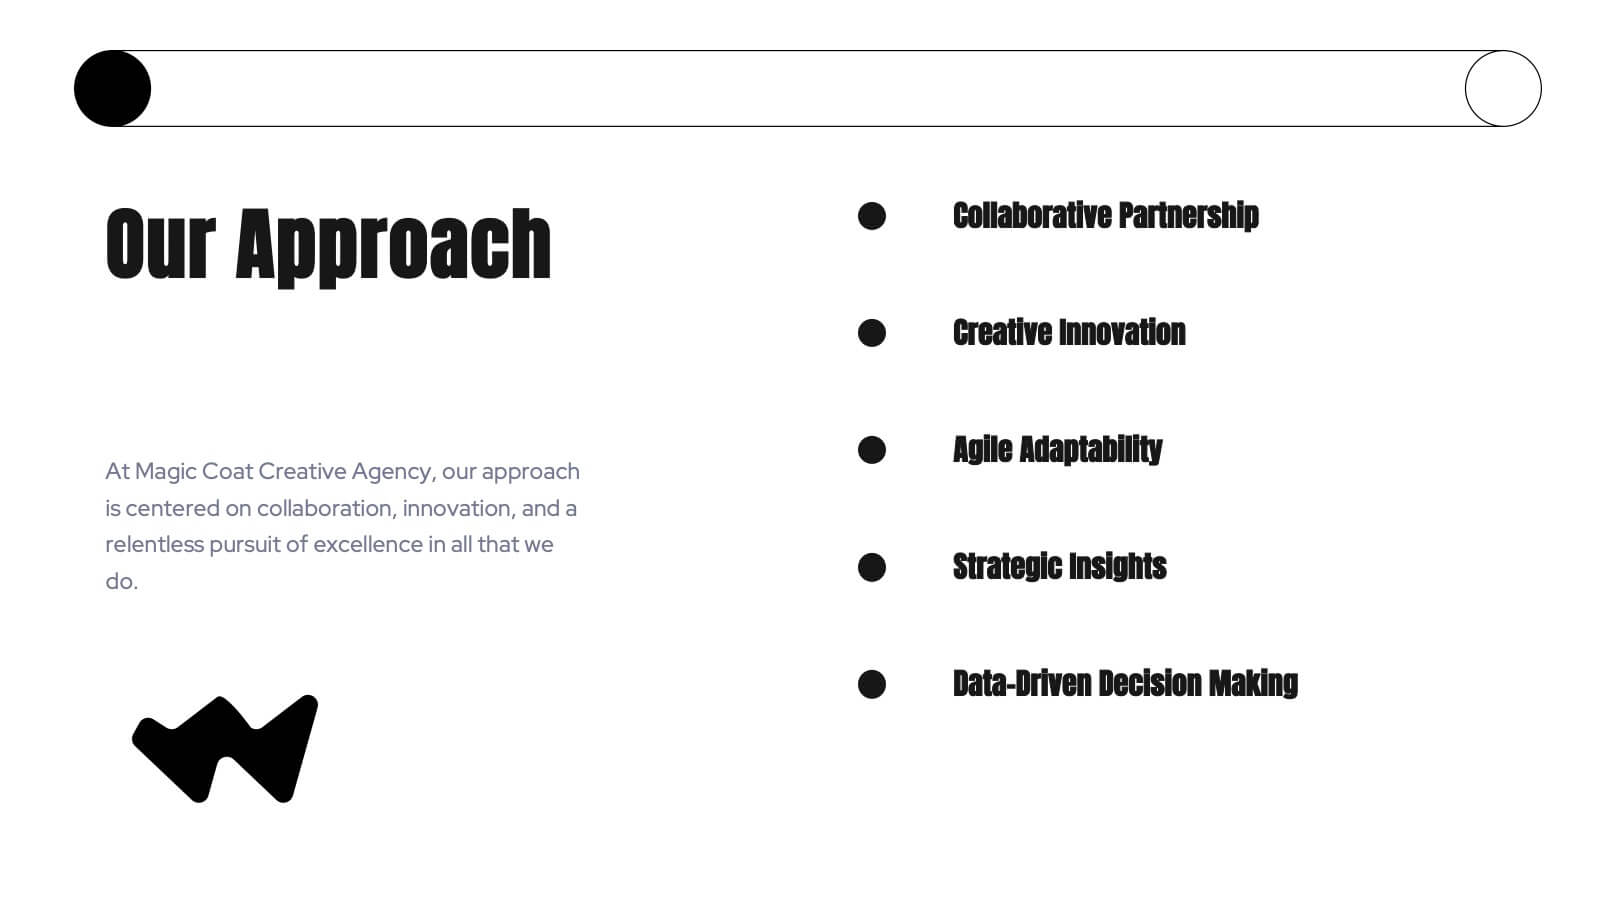
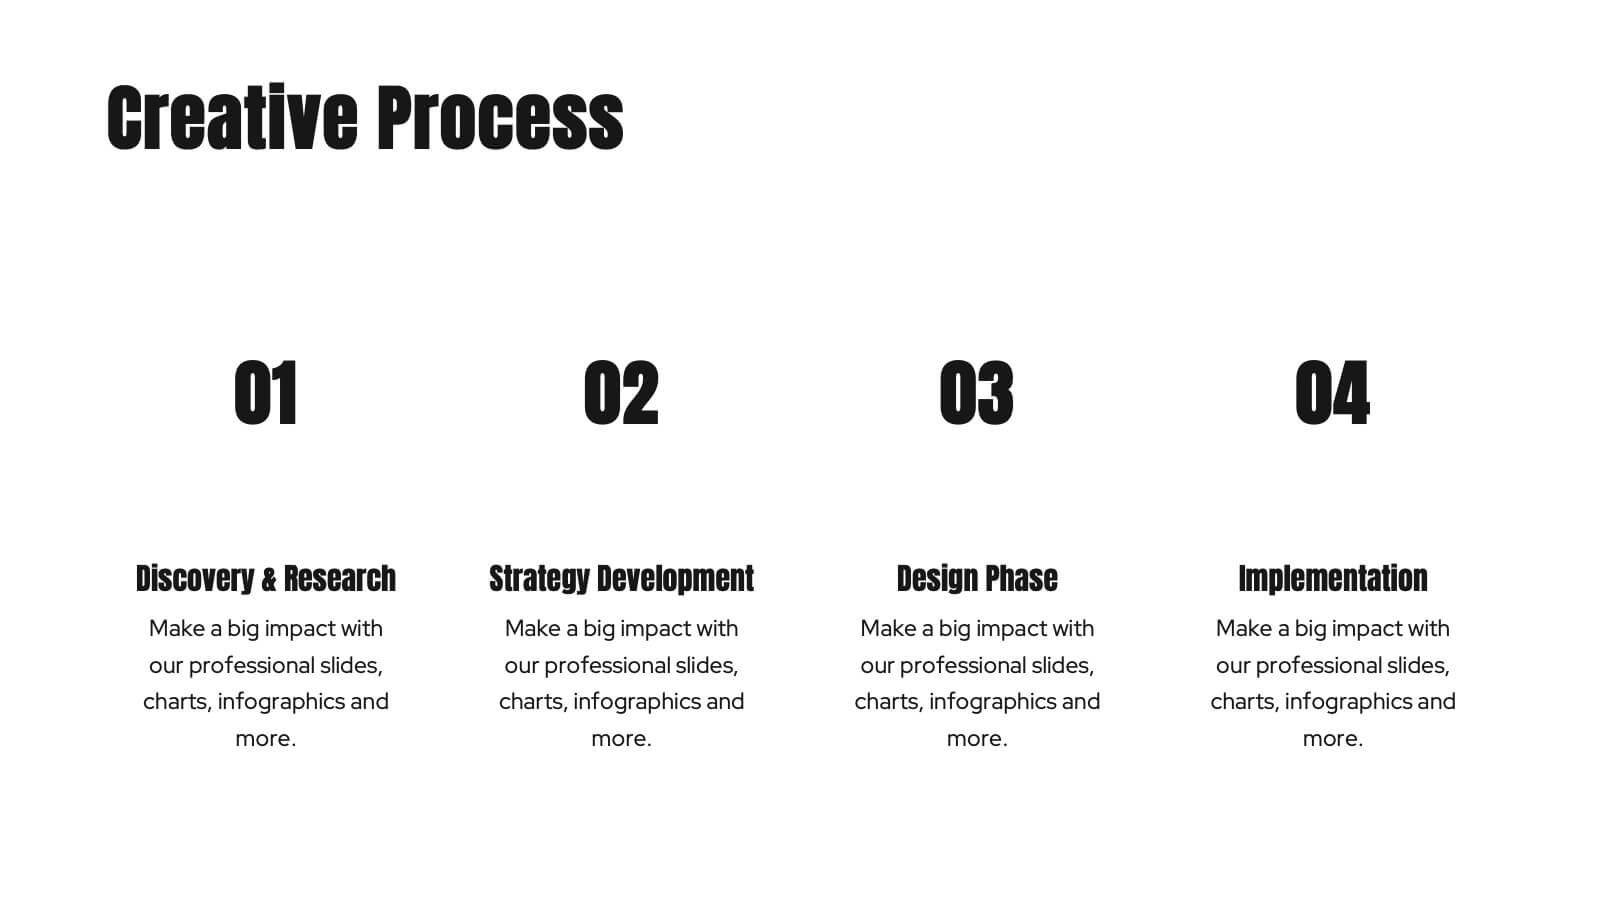
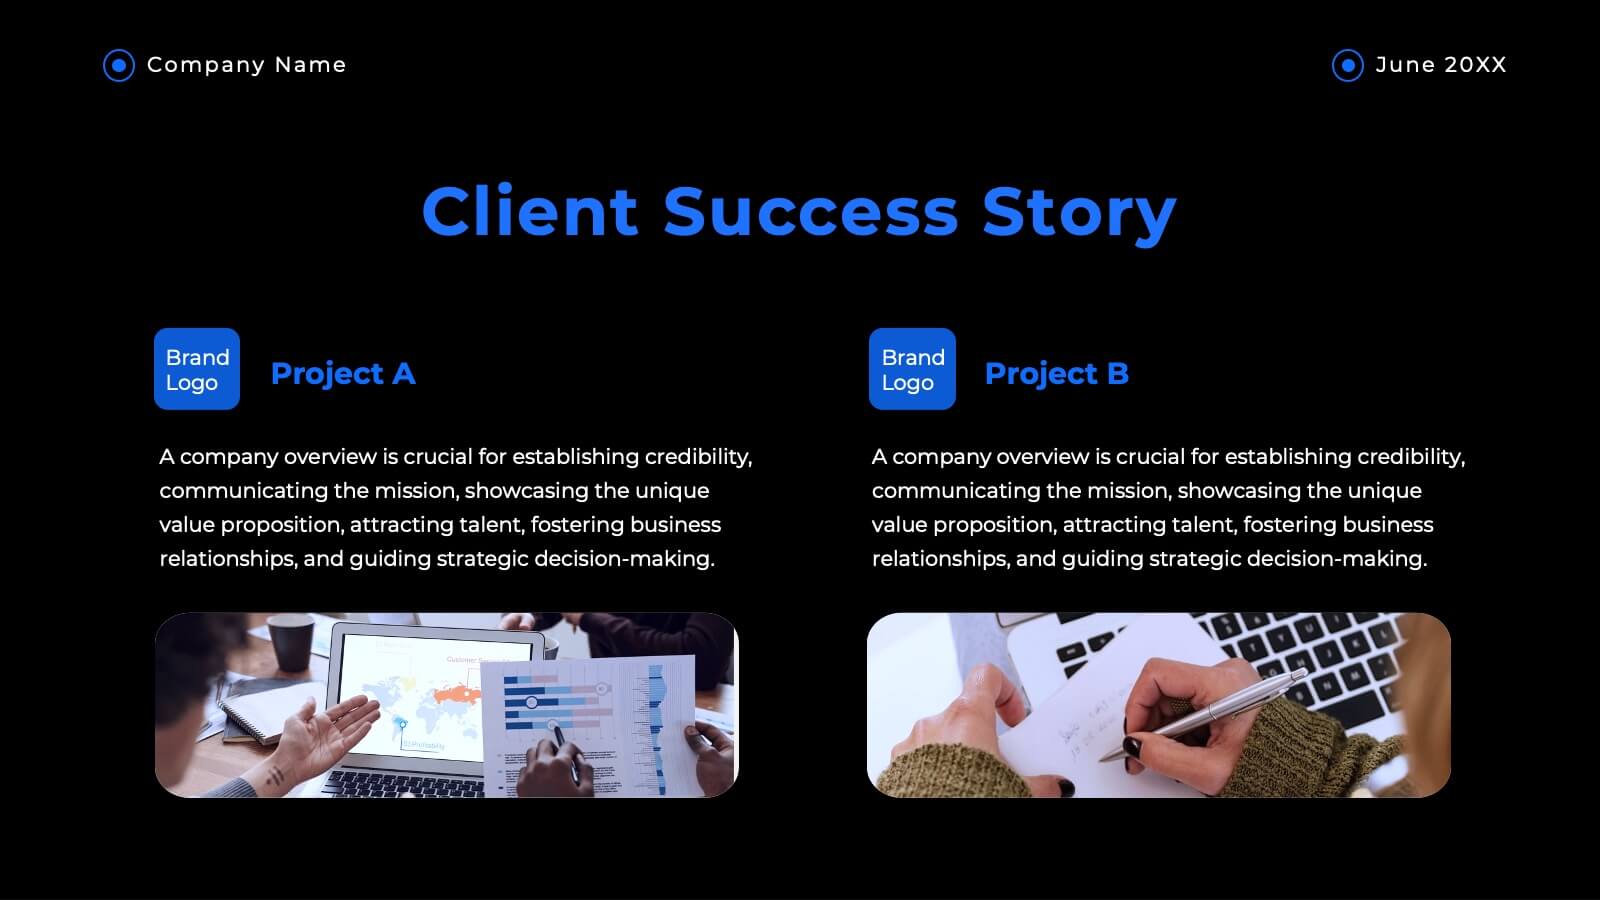
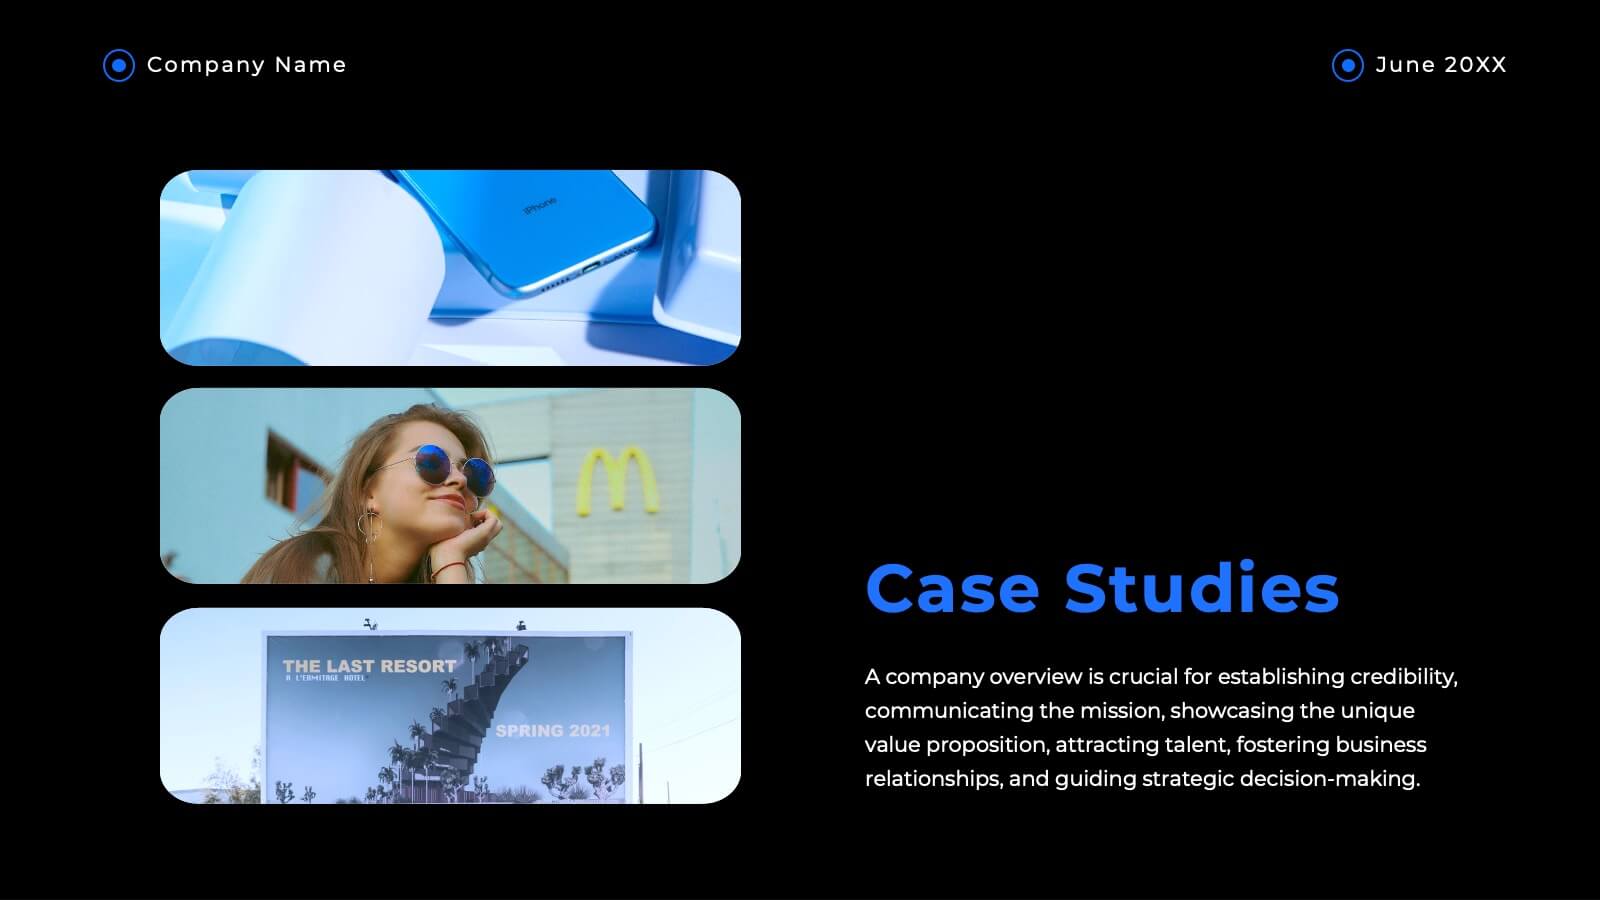
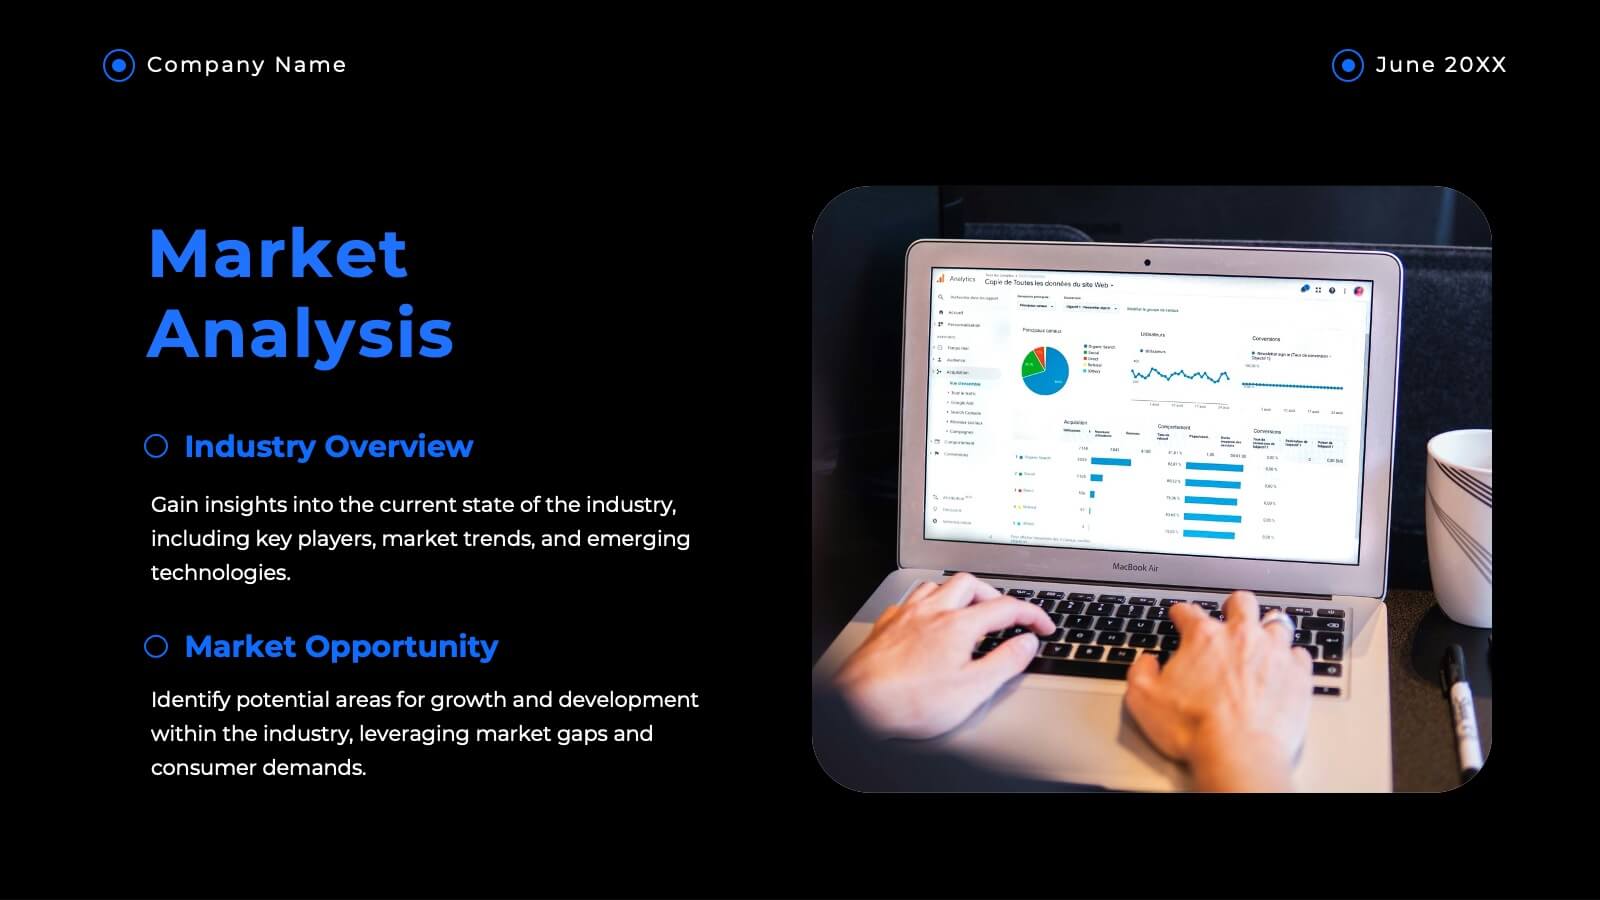
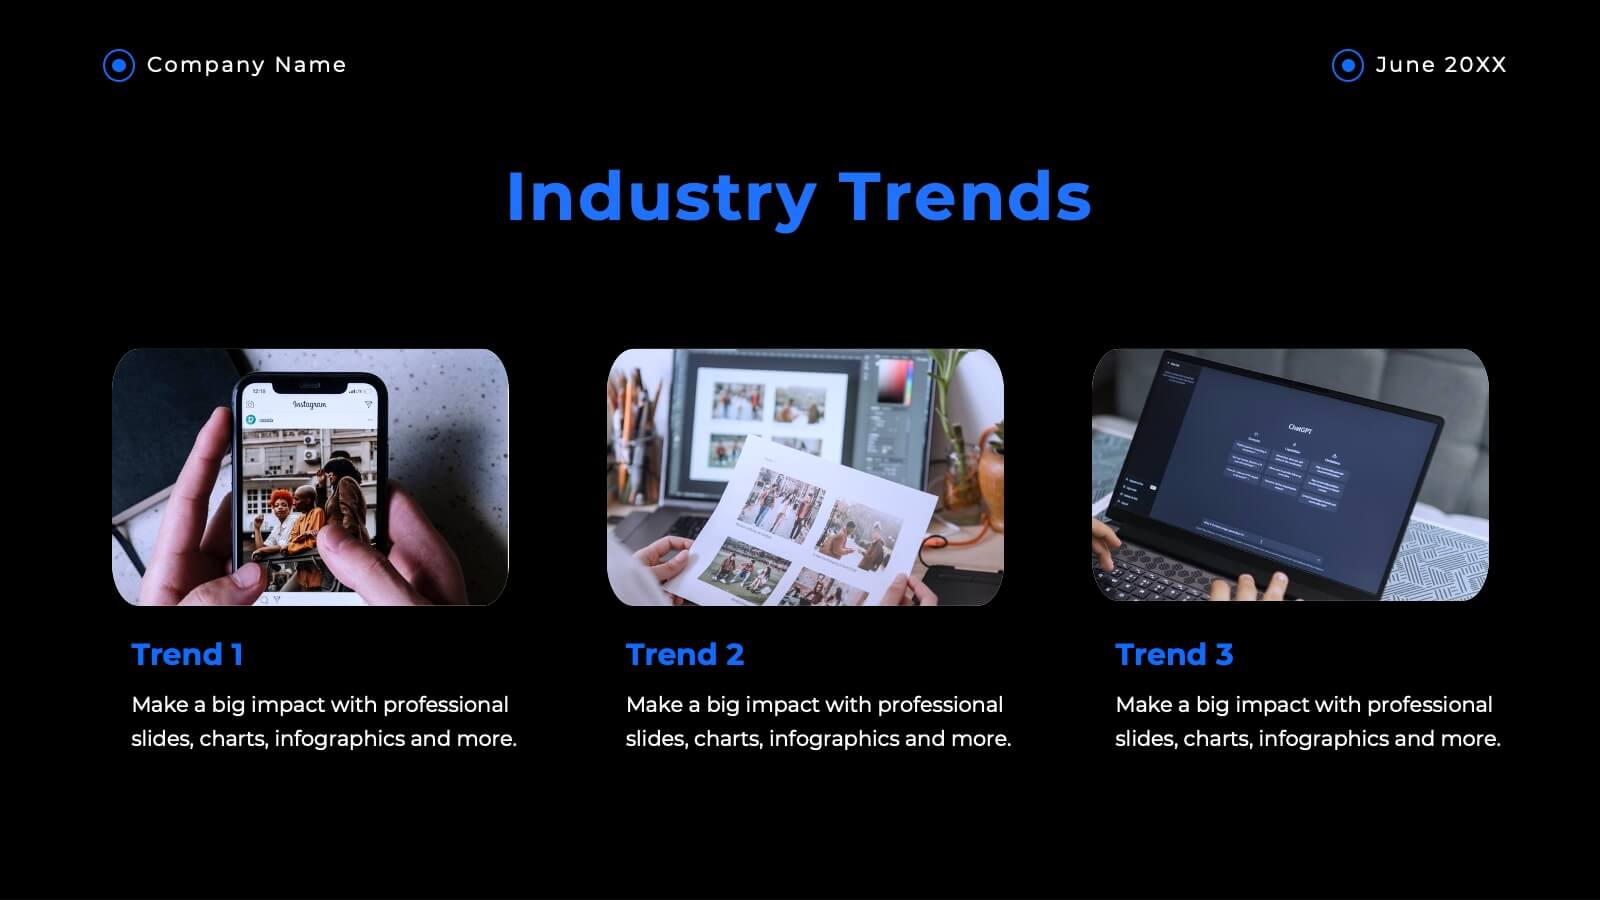
Kraken Agency Portfolio Presentation
This agency portfolio template showcases your agency's work and expertise with a sleek, modern design. It features slides for client success stories, case studies, services, market analysis, and creative process. Perfect for demonstrating your team’s skills and approach. Compatible with PowerPoint, Keynote, and Google Slides for easy customization and presentation.


6 diapositivas
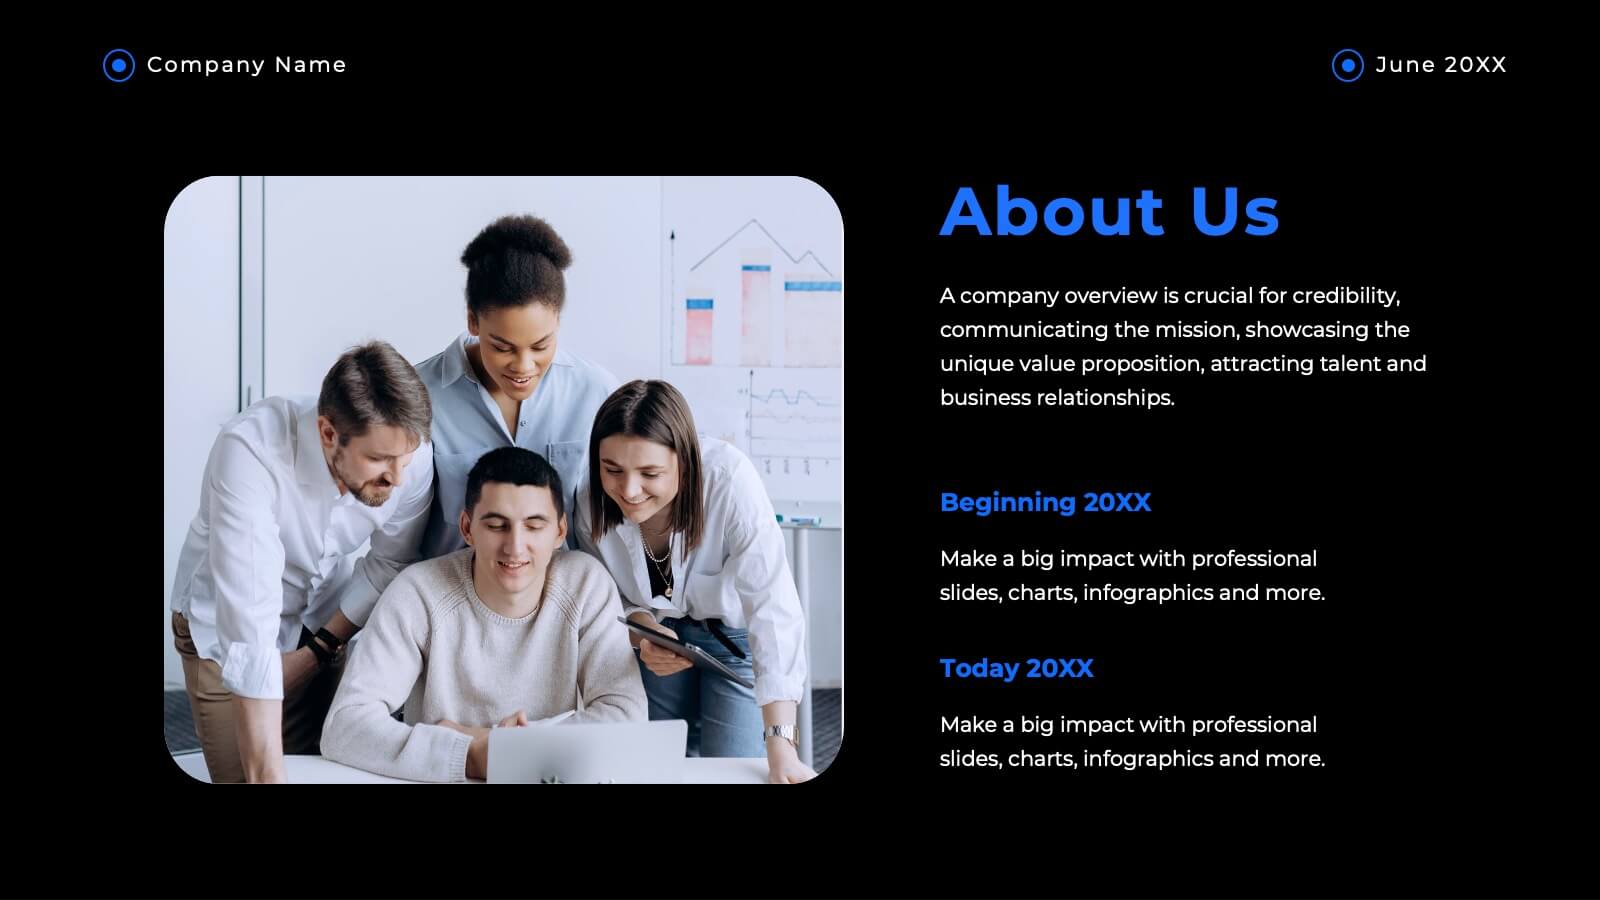
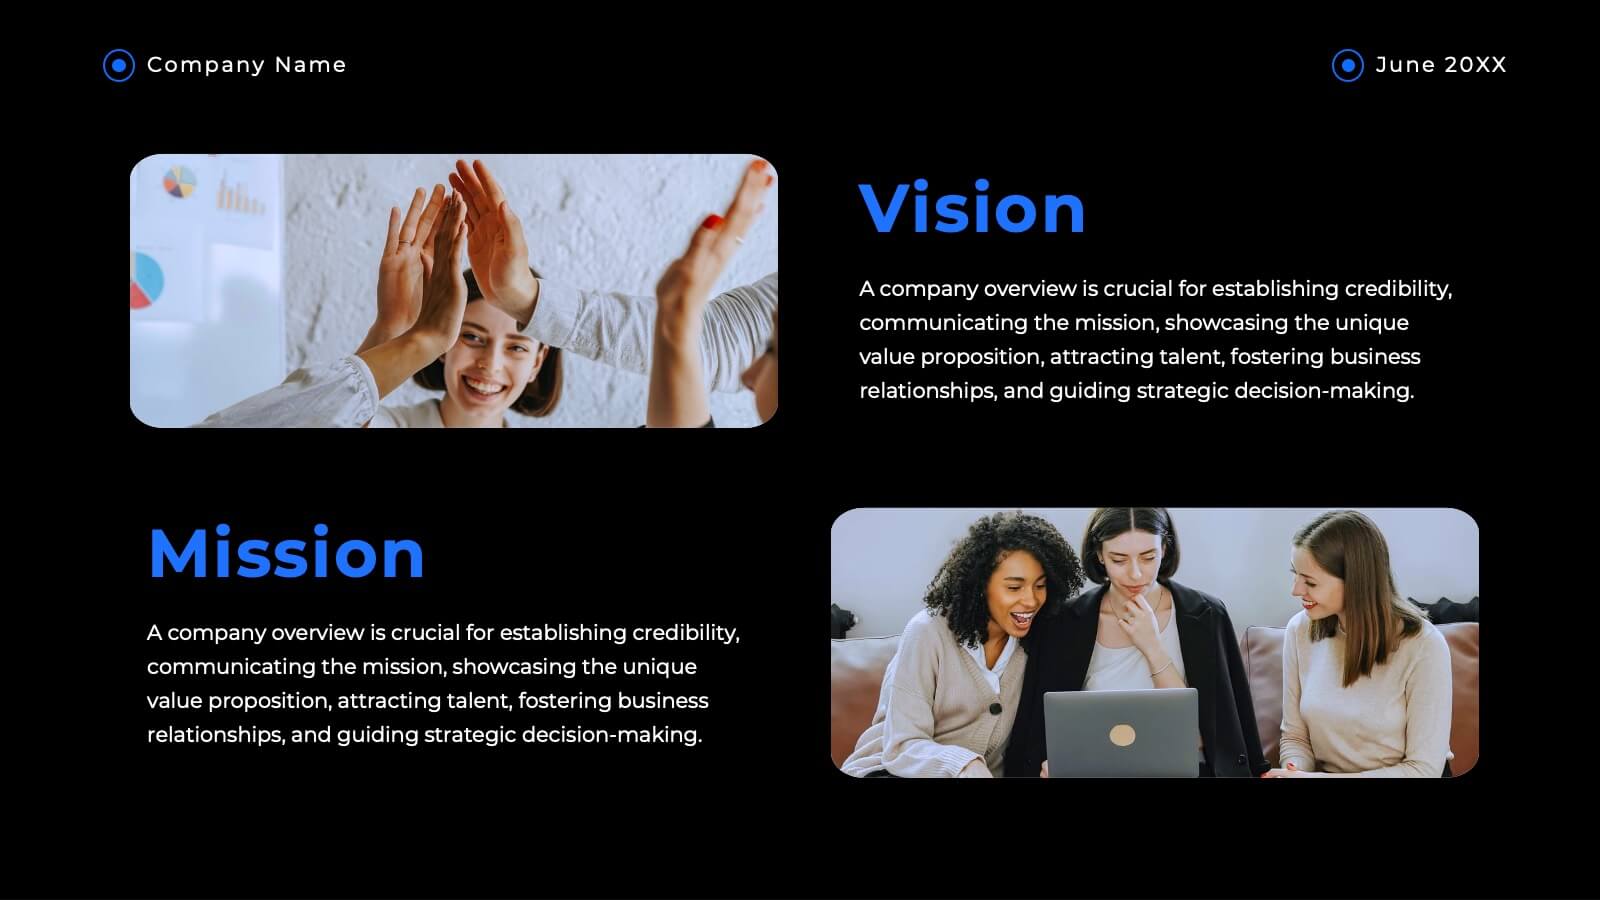
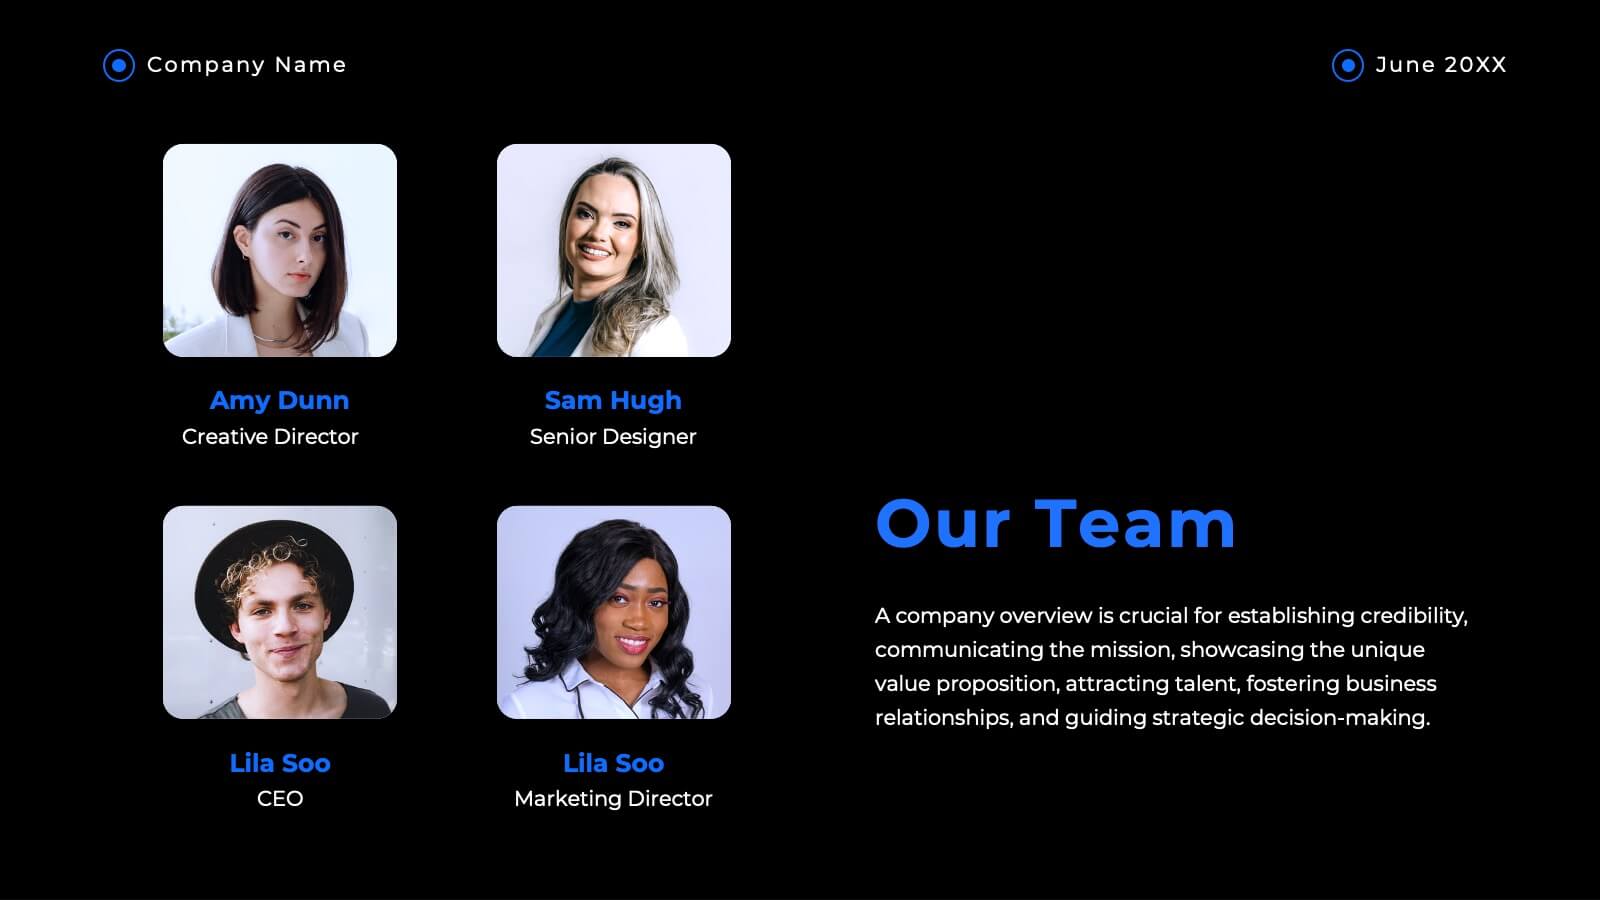
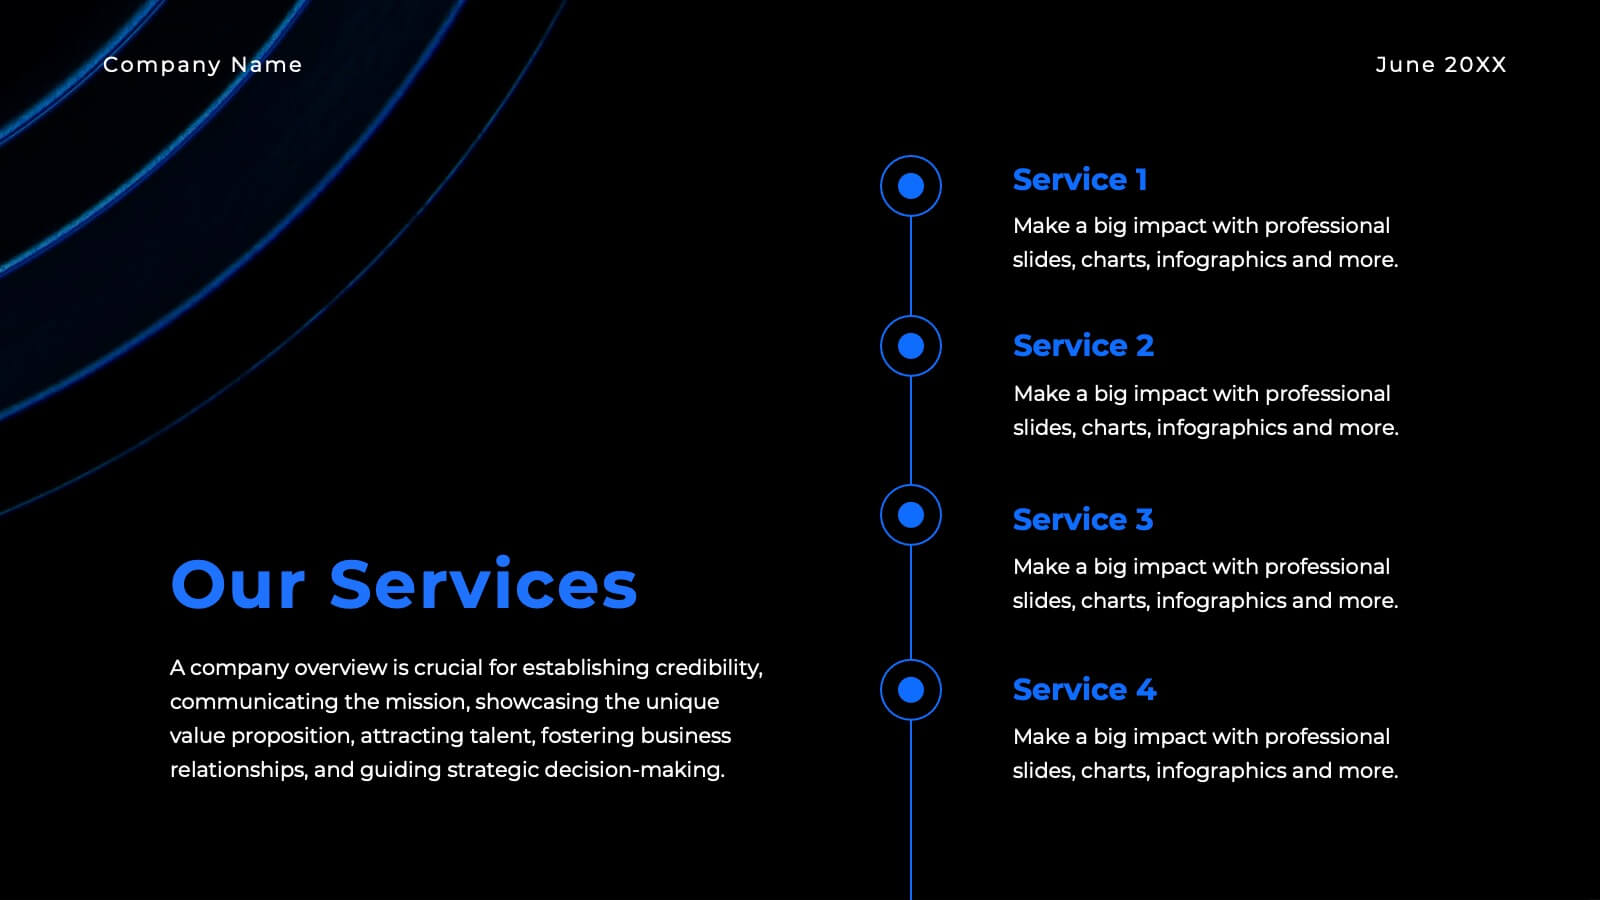
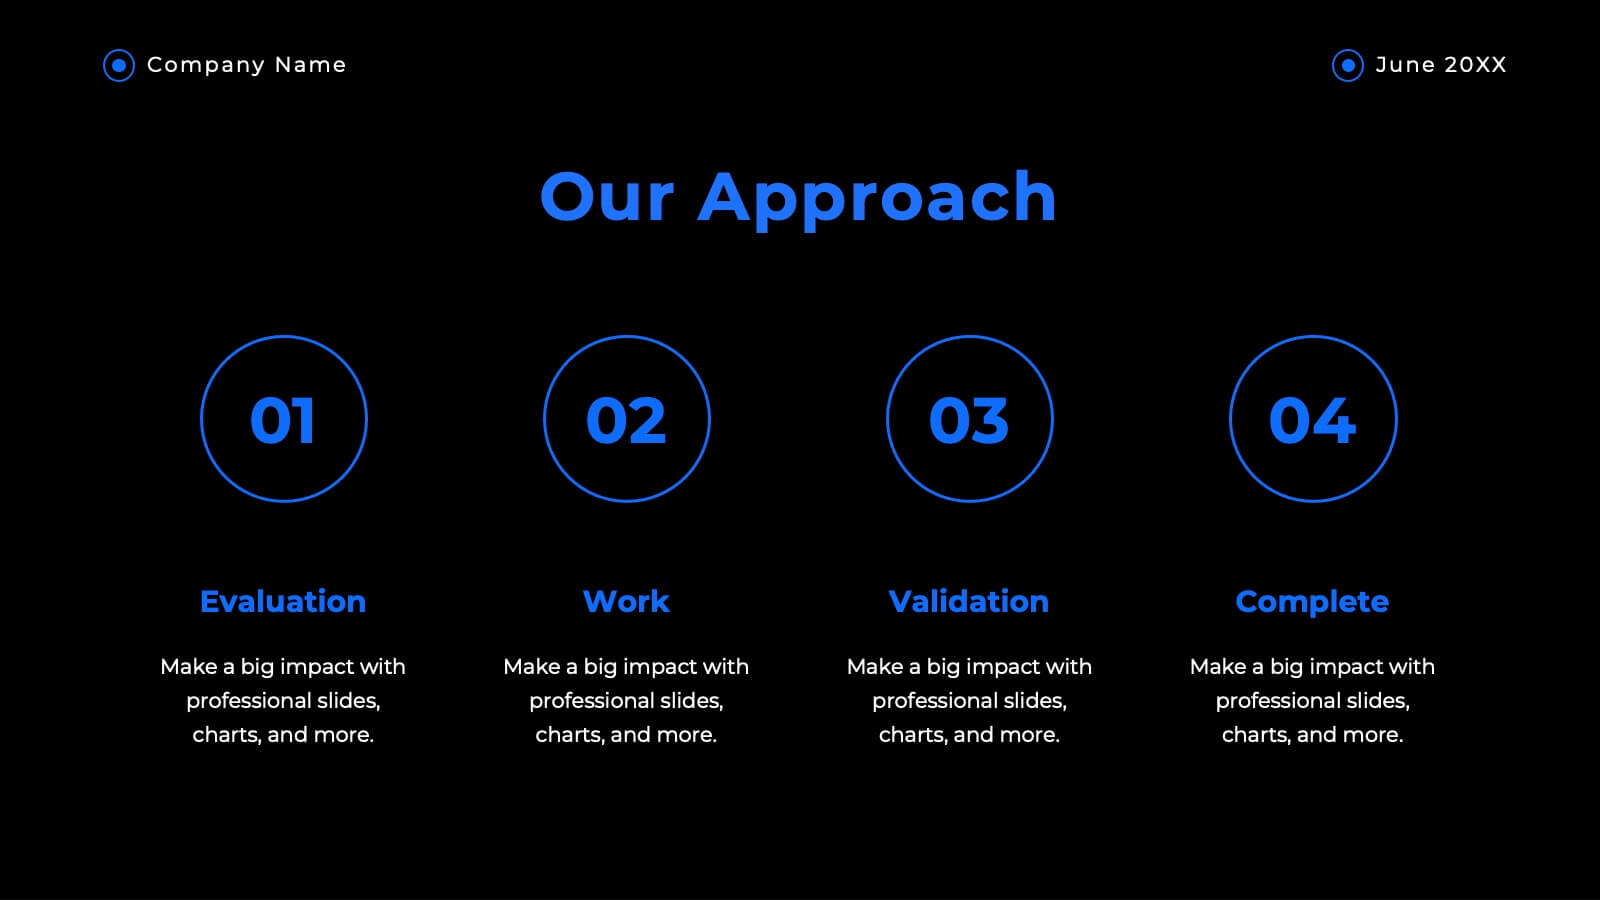
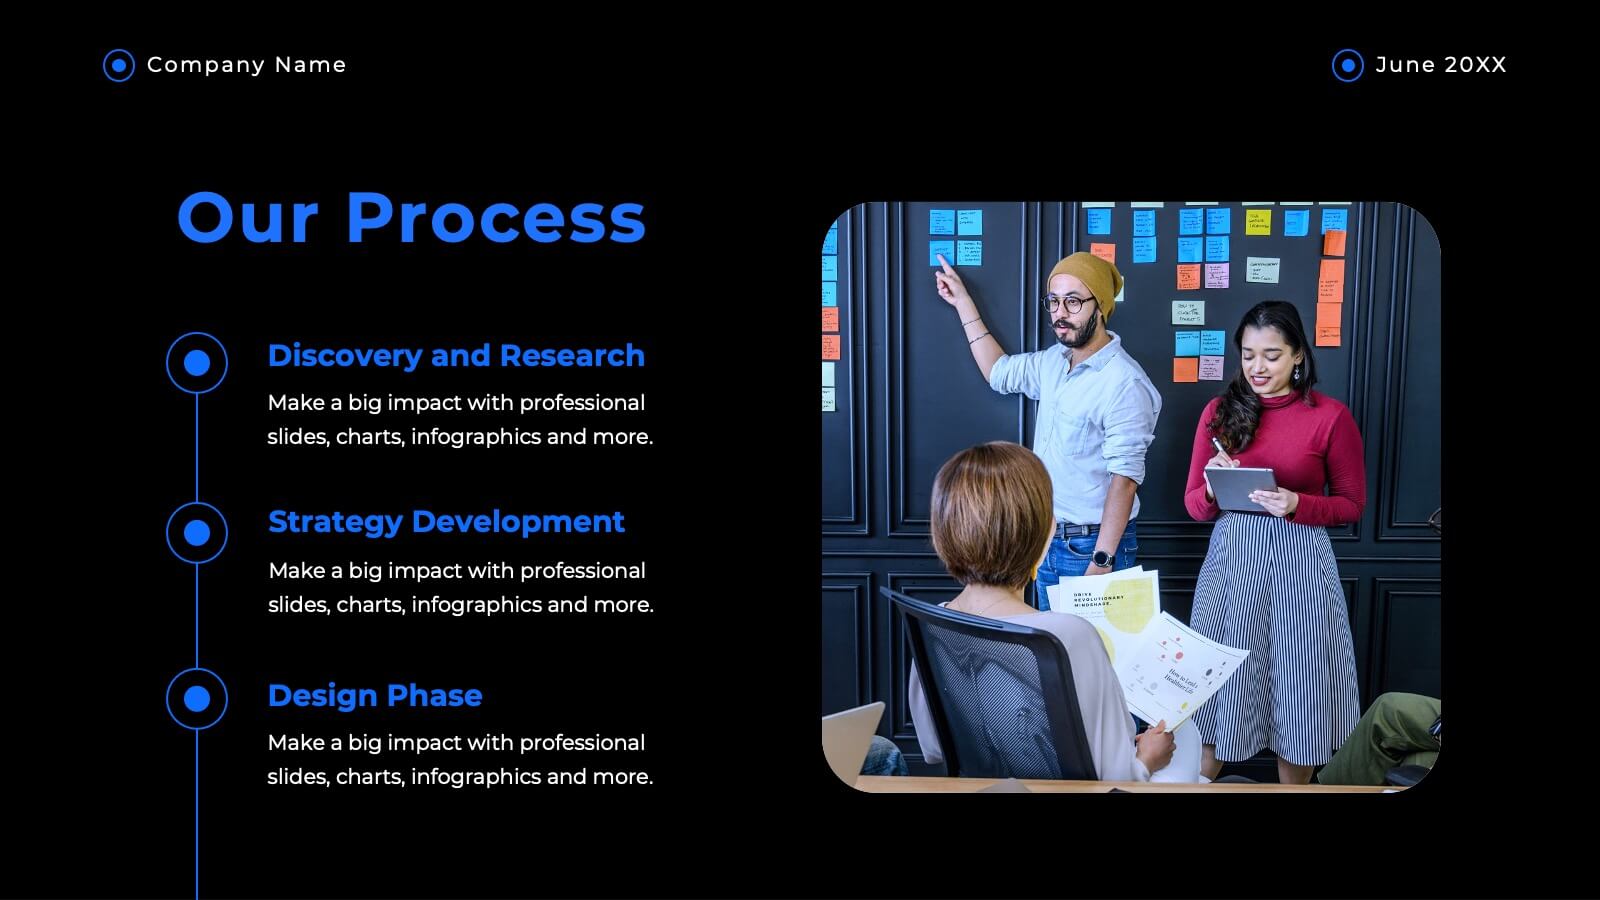
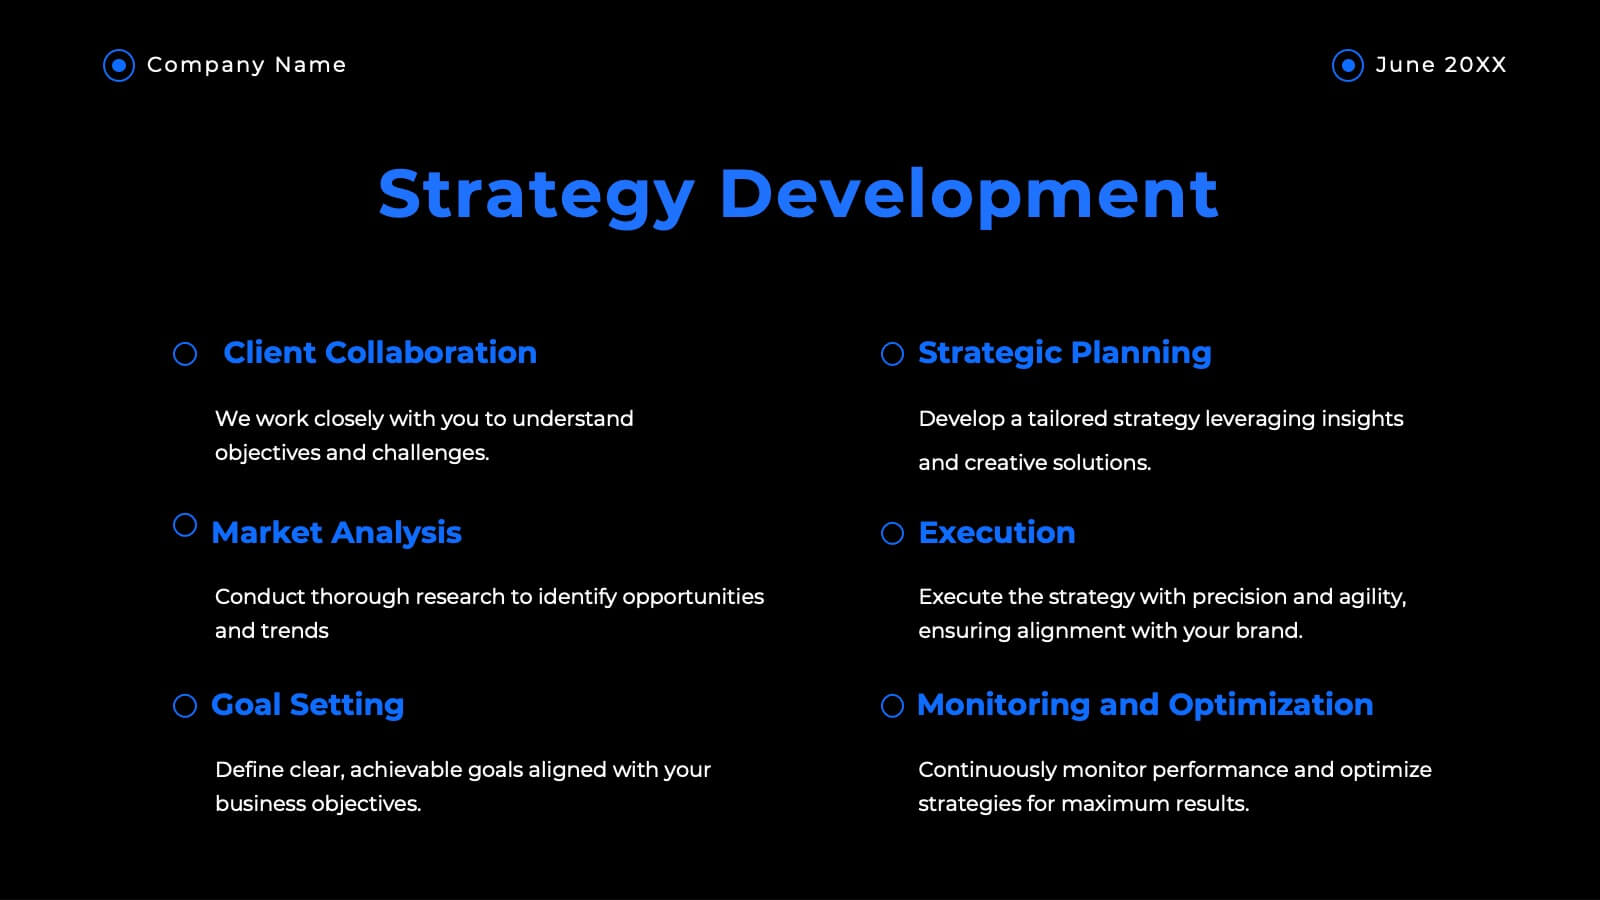
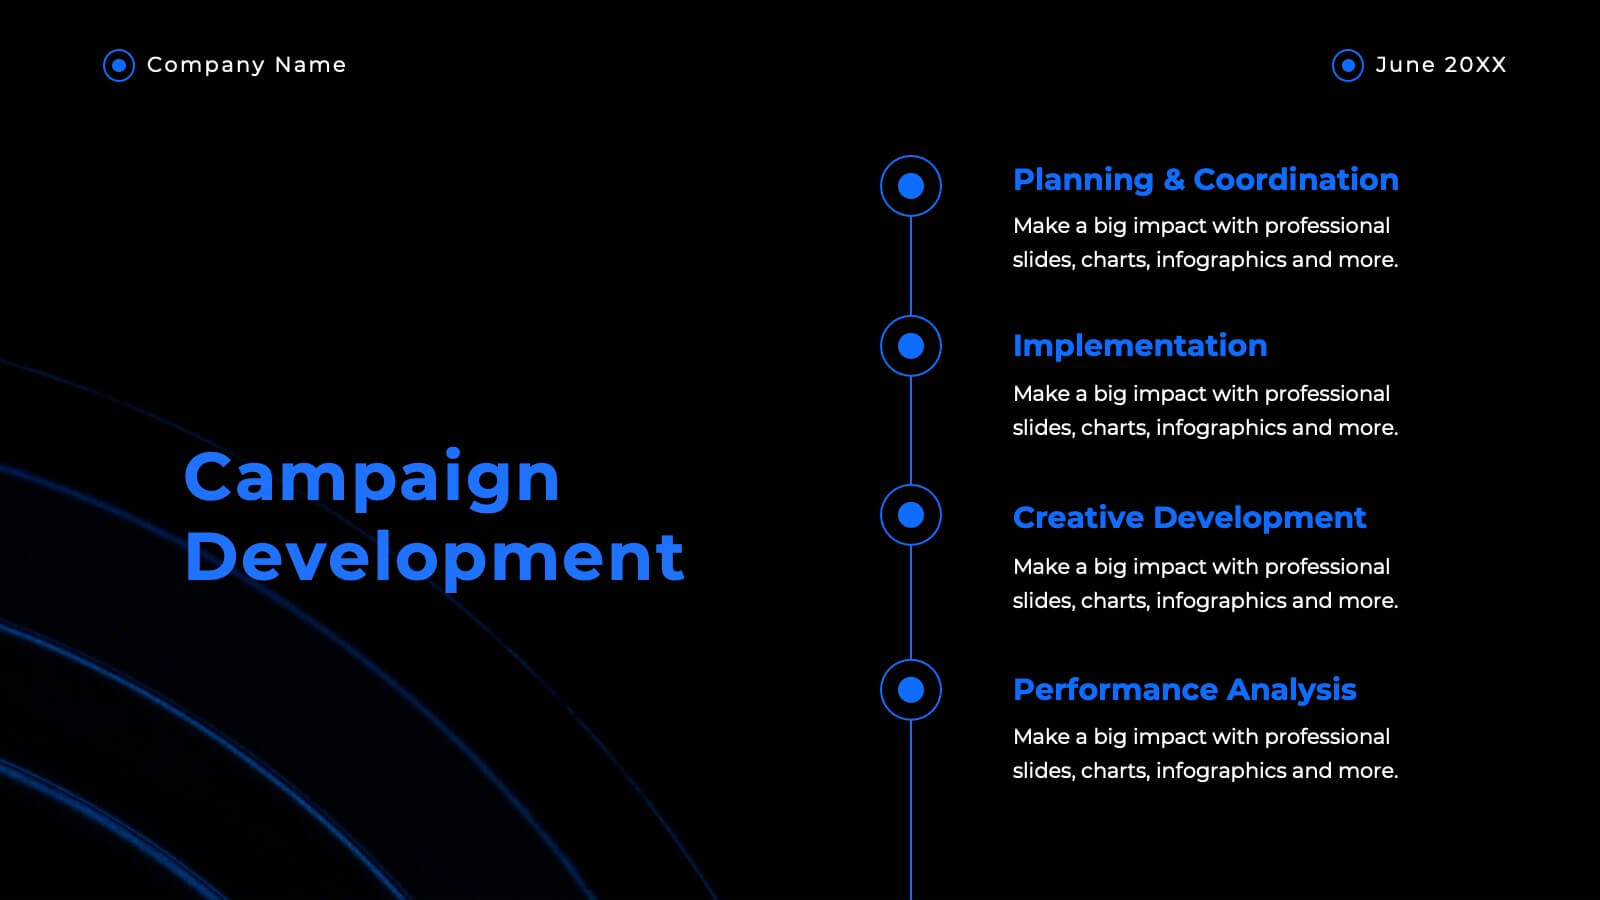
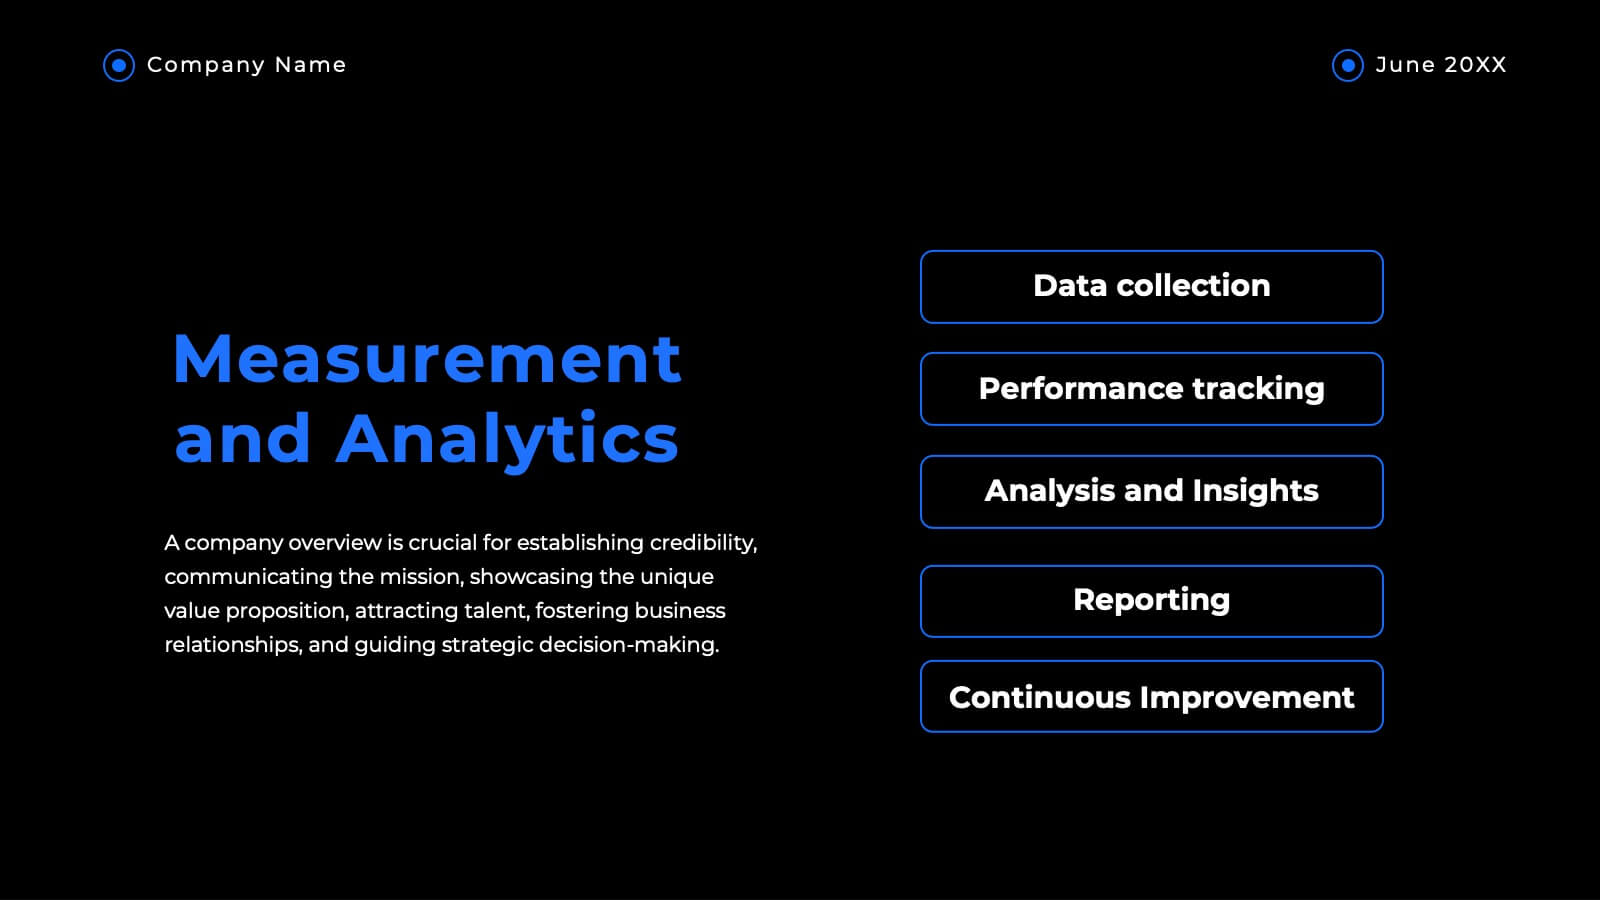
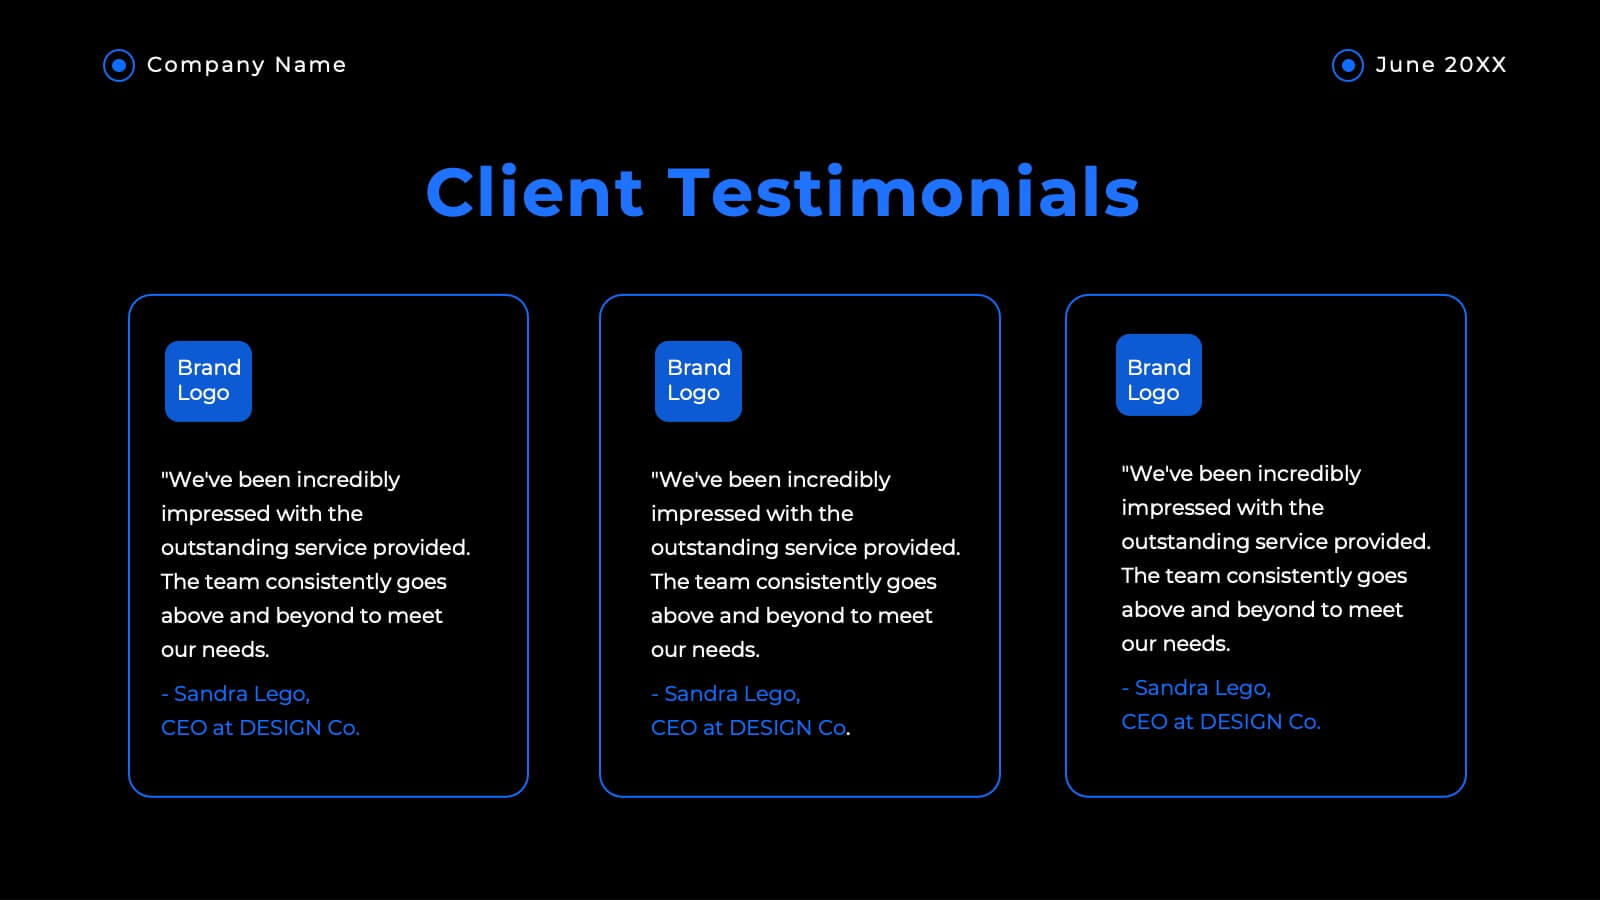
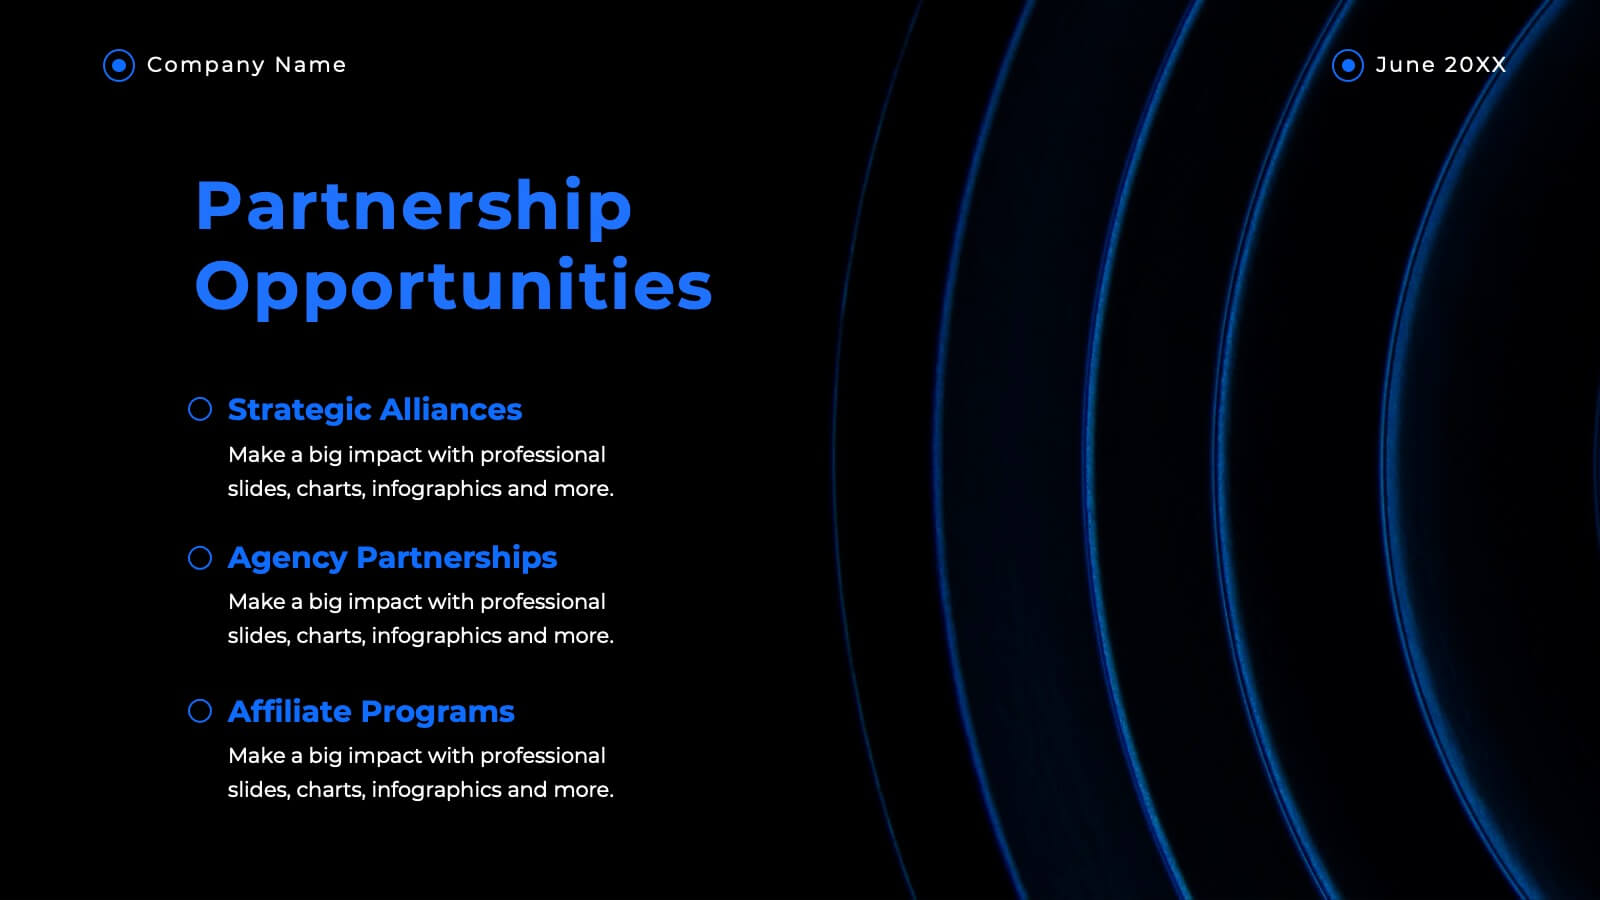
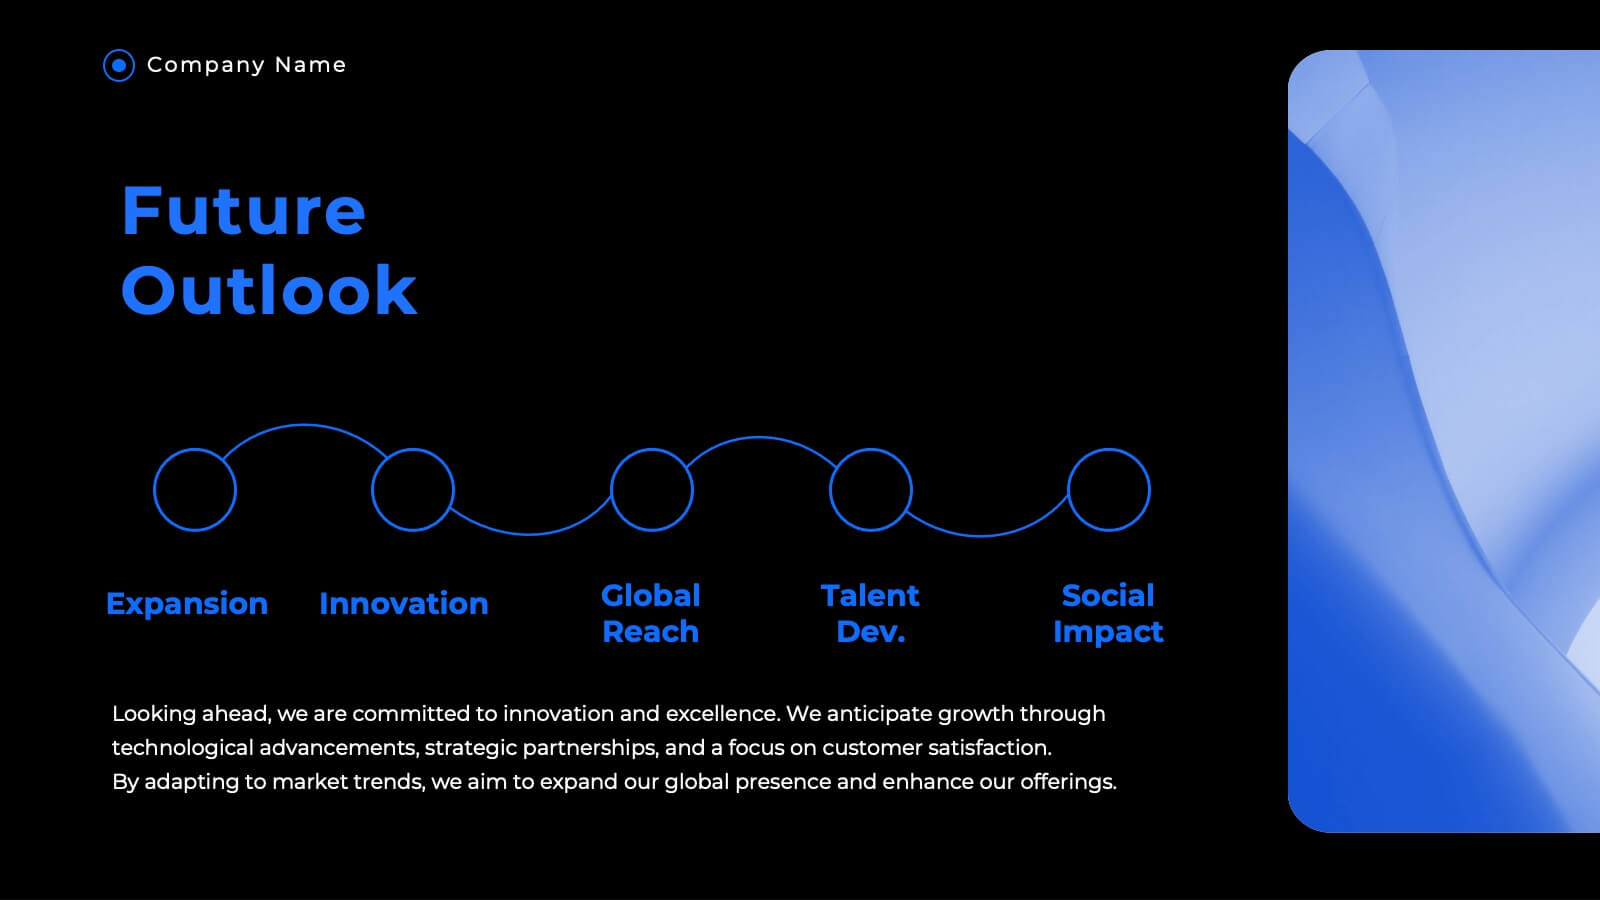
Modern Business Strategy Presentation
Bring your ideas to life with a sleek, forward-thinking presentation designed to communicate business growth and strategic planning. Ideal for outlining goals, performance steps, and innovation roadmaps, this clean and modern layout ensures every concept stands out. Fully compatible with PowerPoint, Keynote, and Google Slides for easy customization.


21 diapositivas
Ionforge Startup Pitch Deck Presentation
Impress investors and showcase your startup's potential with this structured pitch deck! It covers key areas like market analysis, business model, value proposition, and financial overview, ensuring a complete story of your growth plan. Perfect for startup presentations and funding pitches, this template is fully compatible with PowerPoint, Keynote, and Google Slides.


6 diapositivas
Phased Implementation Timeline Presentation
Visualize your project rollout in clear, progressive stages using this curved, multi-phase timeline. Perfect for strategic plans, implementation roadmaps, or development cycles. Includes 6 customizable points with labels, icons, and years. Ideal for business teams and consultants. Fully editable in PowerPoint, Keynote, and Google Slides. Clean, modern, and easy to adapt.


6 diapositivas
Defining Project Scope
Visualize your project's key components with this sleek hexagonal layout, perfect for outlining milestones, deliverables, and priorities. This six-part diagram helps teams align goals and clarify scope early in the process. Ideal for PMs, strategists, and consultants. Fully editable in PowerPoint, Keynote, and Google Slides.


2 diapositivas
Professional Proposal for Project Approval Presentation
Impress stakeholders and decision-makers with the Professional Proposal for Project Approval Presentation. Designed to guide your audience through key objectives and visual justifications, this clean, image-rich layout is ideal for startups, teams, and consultants. Fully customizable in PowerPoint, Keynote, and Google Slides.


5 diapositivas
Key Business Question Breakdown Presentation
Present critical insights with this keyhole-themed layout, perfect for outlining strategic business questions or core decision points. The six-segment format allows you to break down complex topics into clear, actionable areas. Fully customizable in Canva, PowerPoint, or Google Slides—ideal for planning, workshops, or stakeholder presentations.


23 diapositivas
Artarix Business Development Proposal Presentation
Streamline your growth strategy with this modern and professional presentation template. Covering key elements such as collaboration opportunities, performance metrics, process improvement, and resource allocation, it provides a structured approach to business expansion. Fully customizable and compatible with PowerPoint, Keynote, and Google Slides for seamless editing.


8 diapositivas
Geographic Data for Europe Slide Presentation
Visualize key regional data clearly with the Geographic Data for Europe Slide Presentation. This editable map layout highlights specific European countries alongside icon-based text boxes, perfect for presenting statistics, demographics, or business metrics. Use color-coded markers to tell a geographic story with visual clarity. Compatible with PowerPoint, Keynote, Google Slides, and Canva.
22 diapositivas
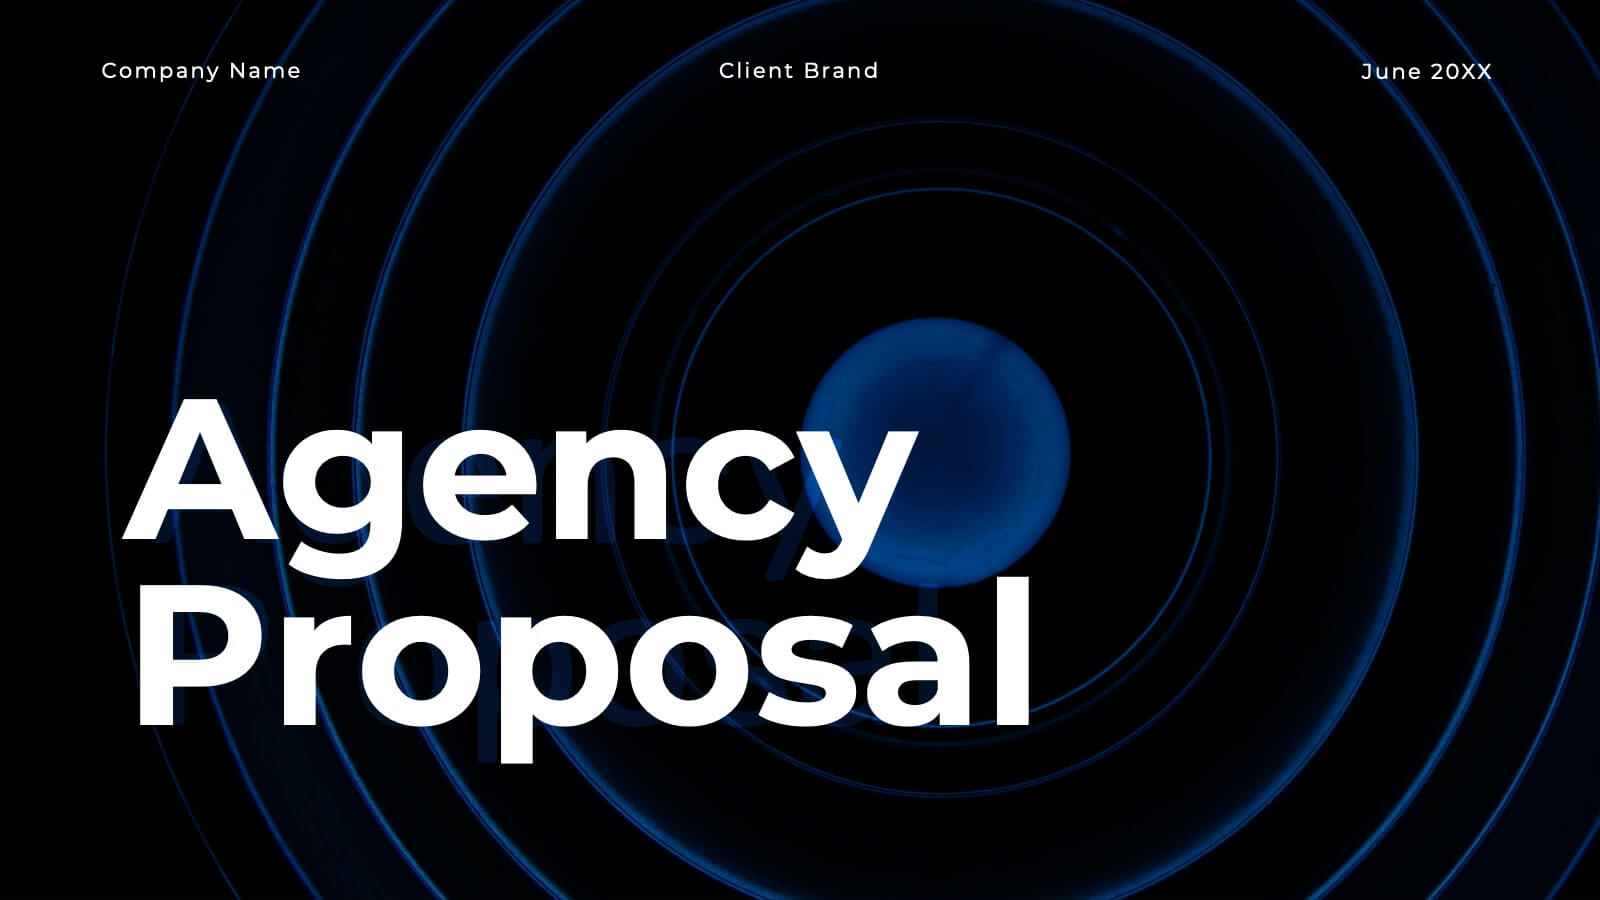
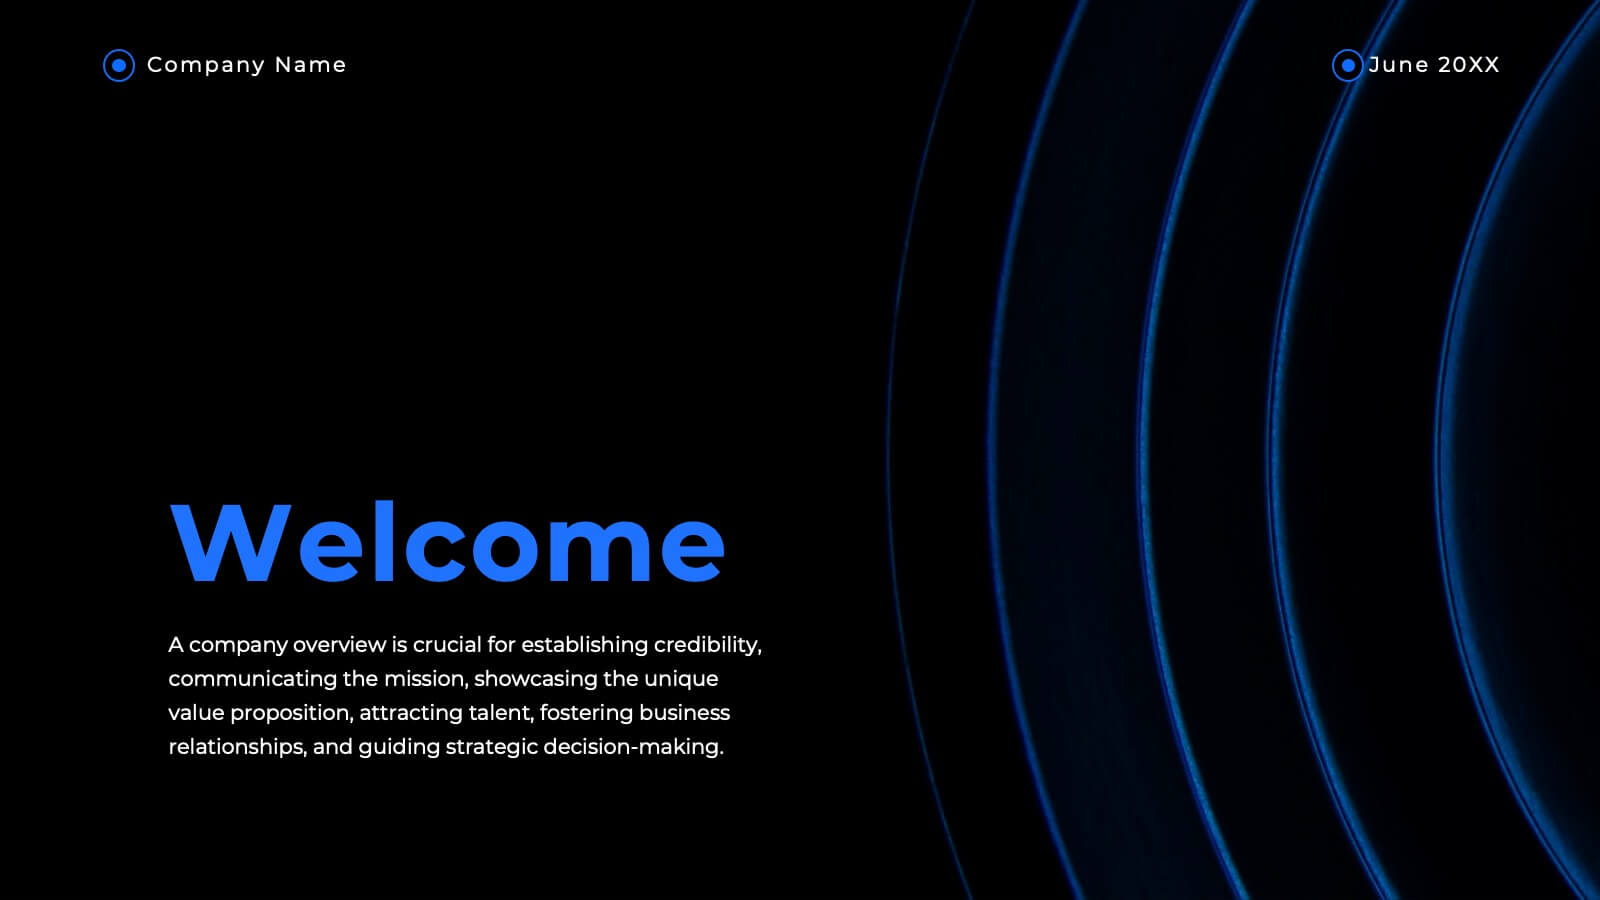
Haven Advertising Agency Proposal Presentation
Wow your clients with this sophisticated agency presentation template! Perfect for showcasing your services, client success stories, and market analysis. Ideal for agencies looking to impress and secure new business. Compatible with PowerPoint, Keynote, and Google Slides, this template ensures your proposals stand out with professional elegance. Perfect for any pitch or proposal.


6 diapositivas
Prioritized Business List Format
Streamline your priorities with this clean and structured list layout, perfect for project steps, goals, or ranking business initiatives. Featuring five connected stages with icons, this editable design highlights key information in an easy-to-follow format. Fully customizable in PowerPoint, Keynote, and Google Slides.


6 diapositivas
Global Sourcing and Distribution Presentation
Present your supply strategy with clarity using the Global Sourcing and Distribution Presentation. This slide features a central sourcing hub with segmented groups to illustrate regional or functional distribution channels. Ideal for global logistics, procurement planning, or stakeholder reporting. Fully editable in PowerPoint, Keynote, and Google Slides.


2 diapositivas
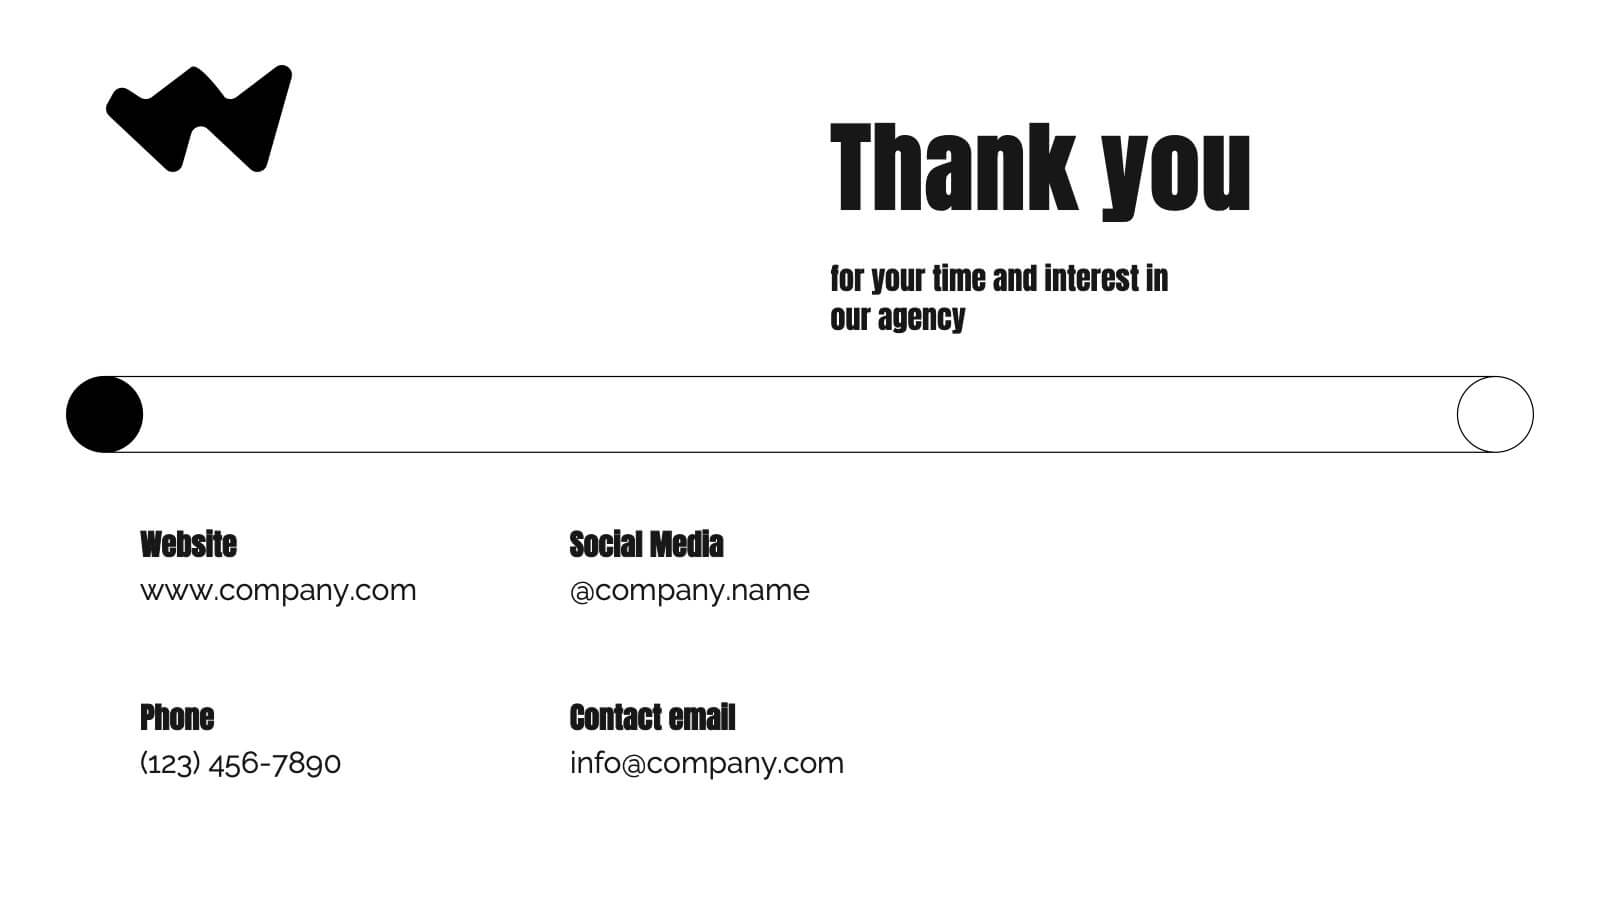
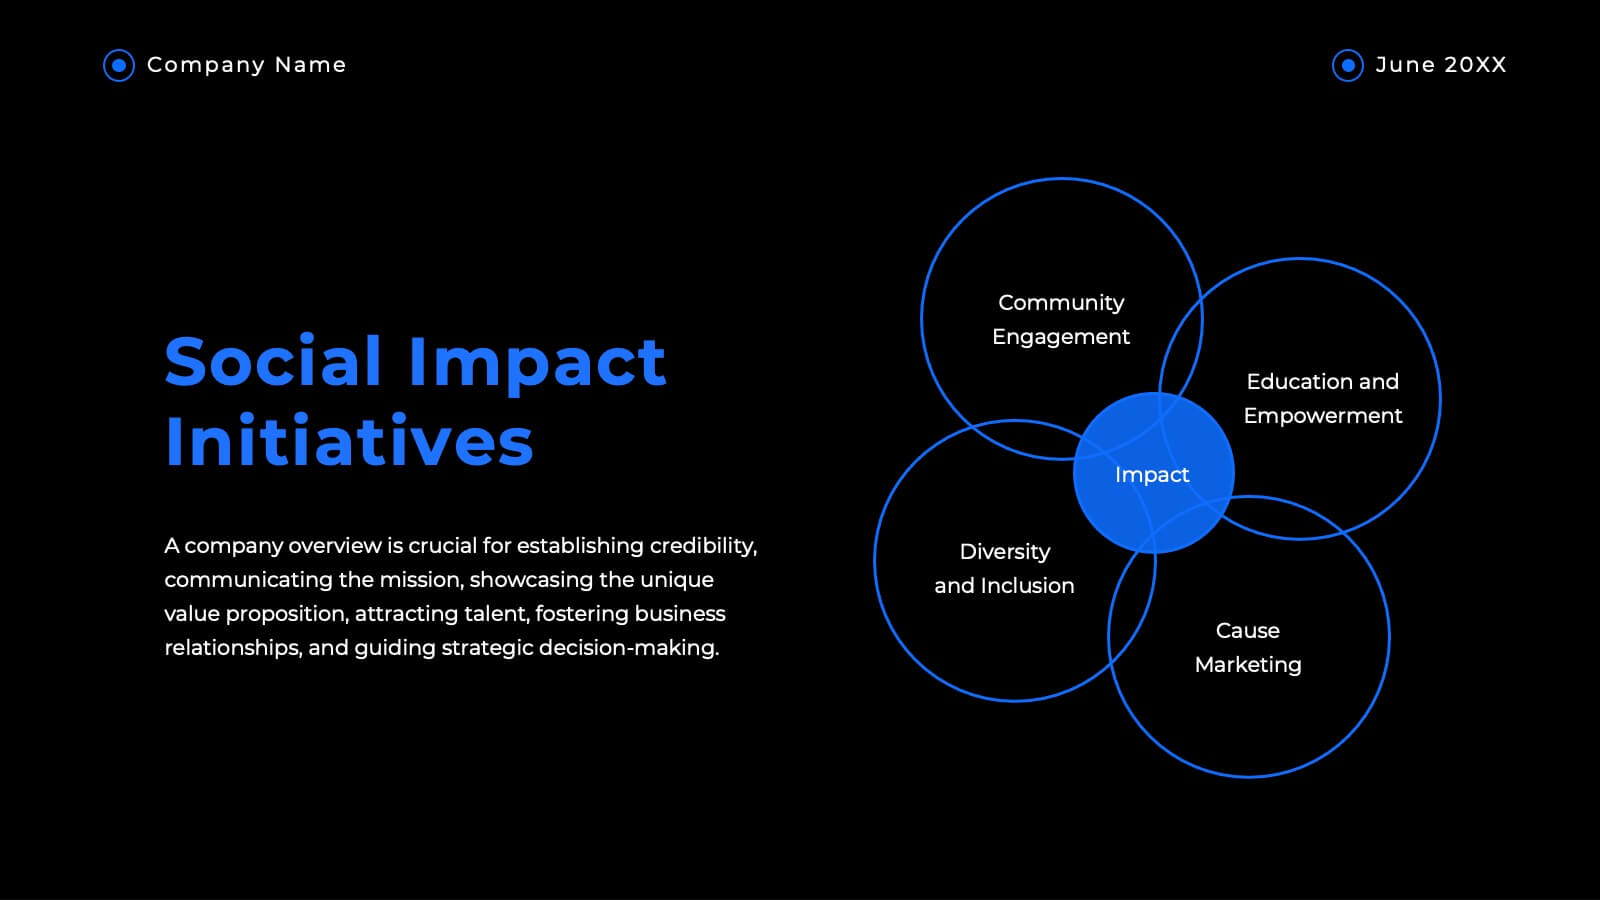
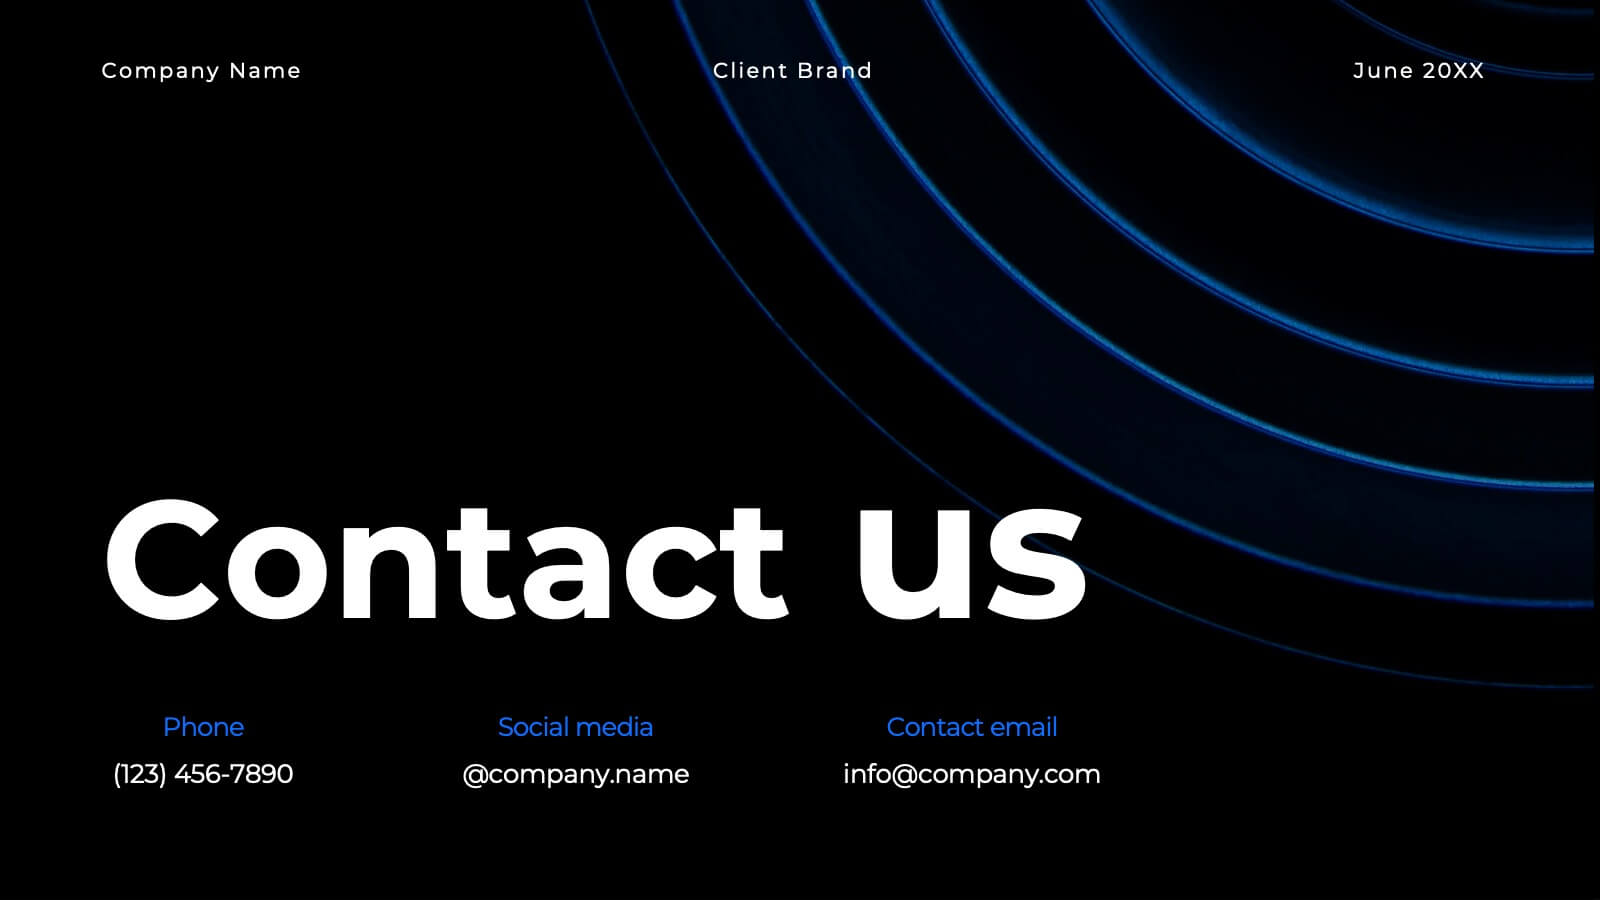
Thank You Page for Final Impressions Presentation
Leave a lasting impression with a bold, modern layout that speaks professionalism and clarity. This presentation template is designed to wrap up your message with impact, offering space for contact details and a short message of appreciation. It’s fully editable and works seamlessly in PowerPoint, Keynote, and Google Slides.