


Características


¿Tienes alguna pregunta?
Recomendar


4 diapositivas
Customer Feedback Report Presentation
Transform audience insights into actionable strategies with this clean, data-focused presentation. Designed to highlight customer satisfaction trends, improvement areas, and feedback analysis, it helps visualize complex information with clarity and flow. Fully customizable and compatible with PowerPoint, Keynote, and Google Slides for a polished, professional, and presentation-ready report.


4 diapositivas
Modern Transportation and Logistics Strategy Presentation
Move your audience through a fast-paced world of movement and delivery with a clean, visual slide that maps out each step of your logistics process. This layout helps explain workflows, supply chain stages, and transportation planning with clarity and ease. Fully compatible with PowerPoint, Keynote, and Google Slides.


5 diapositivas
Strategic Inquiry Mapping Presentation
Bring your ideas to life with a fresh visual flow that maps key questions into action. This strategic template helps you organize complex inquiries across five stages—from insights and communication to analysis and execution. Fully editable and easy to use in PowerPoint, Keynote, and Google Slides for clear visual storytelling.


22 diapositivas
Nimbus Project Milestones Report Presentation
This project plan template offers a modern, vibrant design that clearly outlines key project components, including problem statements, objectives, deliverables, timelines, and risk management. It’s perfect for teams looking to present a comprehensive project overview. Compatible with PowerPoint, Keynote, and Google Slides for impactful presentations with a polished look!


6 diapositivas
PESTEL Framework Business
Simplify your strategic analysis with this clean and colorful PESTEL presentation. Perfect for breaking down Political, Economic, Sociocultural, Technological, Environmental, and Legal factors. Each segment uses bold icons and color coding to guide your audience through external influences. Easily customizable in PowerPoint, Keynote, and Google Slides.
8 diapositivas
3-Step Arrow Process Flow Presentation
Kickstart your message with a bold, directional visual that makes every step feel clear and intentional. This presentation showcases a simple three-stage progression ideal for explaining workflows, strategies, or business processes with clarity and impact. Easy to customize and fully compatible with PowerPoint, Keynote, and Google Slides.


10 diapositivas
Leadership and Team Management Presentation
Enhance team leadership with the Leadership and Team Management presentation template. Featuring a structured layout with a clear hierarchy, this template helps illustrate management strategies, team roles, and leadership principles. Perfect for business leaders, HR professionals, and trainers. Fully customizable and compatible with PowerPoint, Keynote, and Google Slides.


26 diapositivas
Corporate Finance Presentation
The "Corporate Finance" template is your financial compass for presentations that require a mix of precision and clarity. Tailored for use on PowerPoint, Keynote, and Google Slides, it is perfect for demystifying the world of corporate finance. Commence with the "Wealth strategies designed for your unique journey" slide to capture the tailored approach of your financial services. The "Table of Contents" neatly outlines the topics such as investment strategies, risk management, and financial forecasting. Introduce the minds behind the numbers with "Meet Our CEO" and "Meet Our Team" slides. Utilize the "Three Option Slide" to present different financial models, and the "Chart Slide" to depict financial performance. The "Bringing a new perception of investing" slide can redefine investment approaches, while "Feel good with Earning, Feel free to call us." invites engagement. Every slide offers the opportunity to infuse data-driven insights with compelling visuals, ensuring that your "Corporate Finance" presentation not only informs but also impresses your corporate audience.


5 diapositivas
Purpose-Driven Mission and Values Presentation
Present your organization’s core purpose and guiding principles with this Purpose-Driven Mission and Values presentation. This clean, flag-style layout is perfect for showcasing five key pillars such as integrity, collaboration, or innovation. Easily customizable in Canva, PowerPoint, or Google Slides to align with your brand.


4 diapositivas
Simple Title Page Design Presentation
Make a memorable first impression with a clean, modern title design that instantly draws attention. Ideal for creative portfolios, business reports, or marketing decks, this layout combines strong typography with sleek visuals for a professional look. Fully editable in PowerPoint, Keynote, and Google Slides for complete flexibility.


5 diapositivas
Agile and Waterfall PM Models Presentation
Compare two popular project methodologies with ease using the Agile and Waterfall PM Models Presentation. This side-by-side layout highlights key differences in structure, flexibility, and delivery approach—perfect for client briefings, team onboarding, or stakeholder reviews. Fully editable in PowerPoint, Google Slides, Keynote, and Canva for seamless customization.


12 diapositivas
Sales Metrics Dashboard Presentation
Unlock a sharper view of your sales story with a clean, data-driven layout that highlights performance trends at a glance. This presentation organizes KPIs, charts, and progress indicators into an easy-to-follow dashboard that supports smarter decision-making. Fully compatible with PowerPoint, Keynote, and Google Slides.


23 diapositivas
Wendigo Agency Portfolio Presentation
This sleek agency portfolio template showcases your mission, services, and success stories with modern flair. From case studies and strategy development to campaign execution and client testimonials, it’s designed to highlight your agency’s strengths. Perfect for agency presentations across PowerPoint, Keynote, and Google Slides, this template makes your content shine effortlessly.


4 diapositivas
Veterinary Practice Overview Presentation
Give your veterinary insights a professional touch with this clean, modern infographic layout. Designed to showcase workflows, patient care processes, and team structures, it helps present information clearly and visually. Fully customizable and compatible with PowerPoint, Keynote, and Google Slides for easy editing and seamless presentation design.


6 diapositivas
Historical Data Timeline Visualization
Showcase historical progression with clarity using the Historical Data Timeline Visualization. Designed for presenting chronological data points, this template combines circle elements with image icons and milestone labels—perfect for educational or historical presentations. Fully editable in Canva, PowerPoint, Keynote, and Google Slides for seamless customization.


21 diapositivas
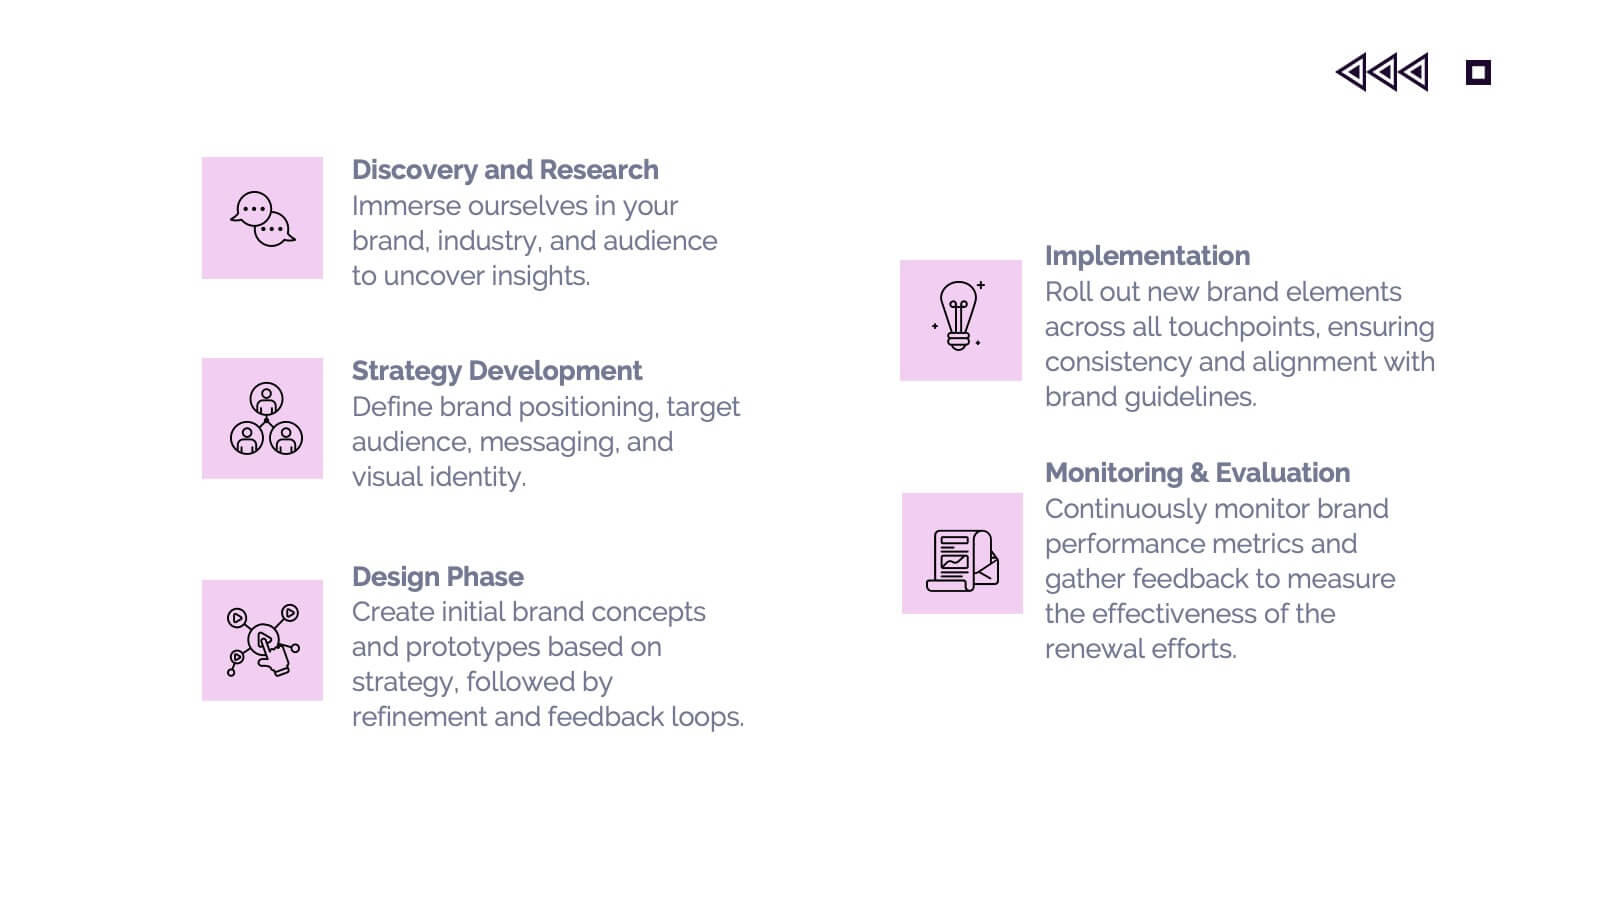
Crystalhearth UX Design Presentation
This professional template simplifies UX/UI design presentations, covering user research, personas, journey mapping, wireframes, and usability guidelines. Showcase visual elements, branding, accessibility, and responsive design. Ideal for illustrating the iterative process, testing insights, and project showcases. Fully customizable and compatible with PowerPoint, Keynote, and Google Slides.


5 diapositivas
Enterprise Risk Management Framework Presentation
Visualize your organization’s risk strategy with the Enterprise Risk Management Framework Presentation. This slide outlines four core steps—Set Objective, Identify Risks, Assess Risks, and Risk Response—using a clear, directional design. Perfect for risk assessments, board updates, or audit reviews. Fully editable in PowerPoint, Google Slides, and Canva.