


Características


¿Tienes alguna pregunta?
Recomendar


23 diapositivas
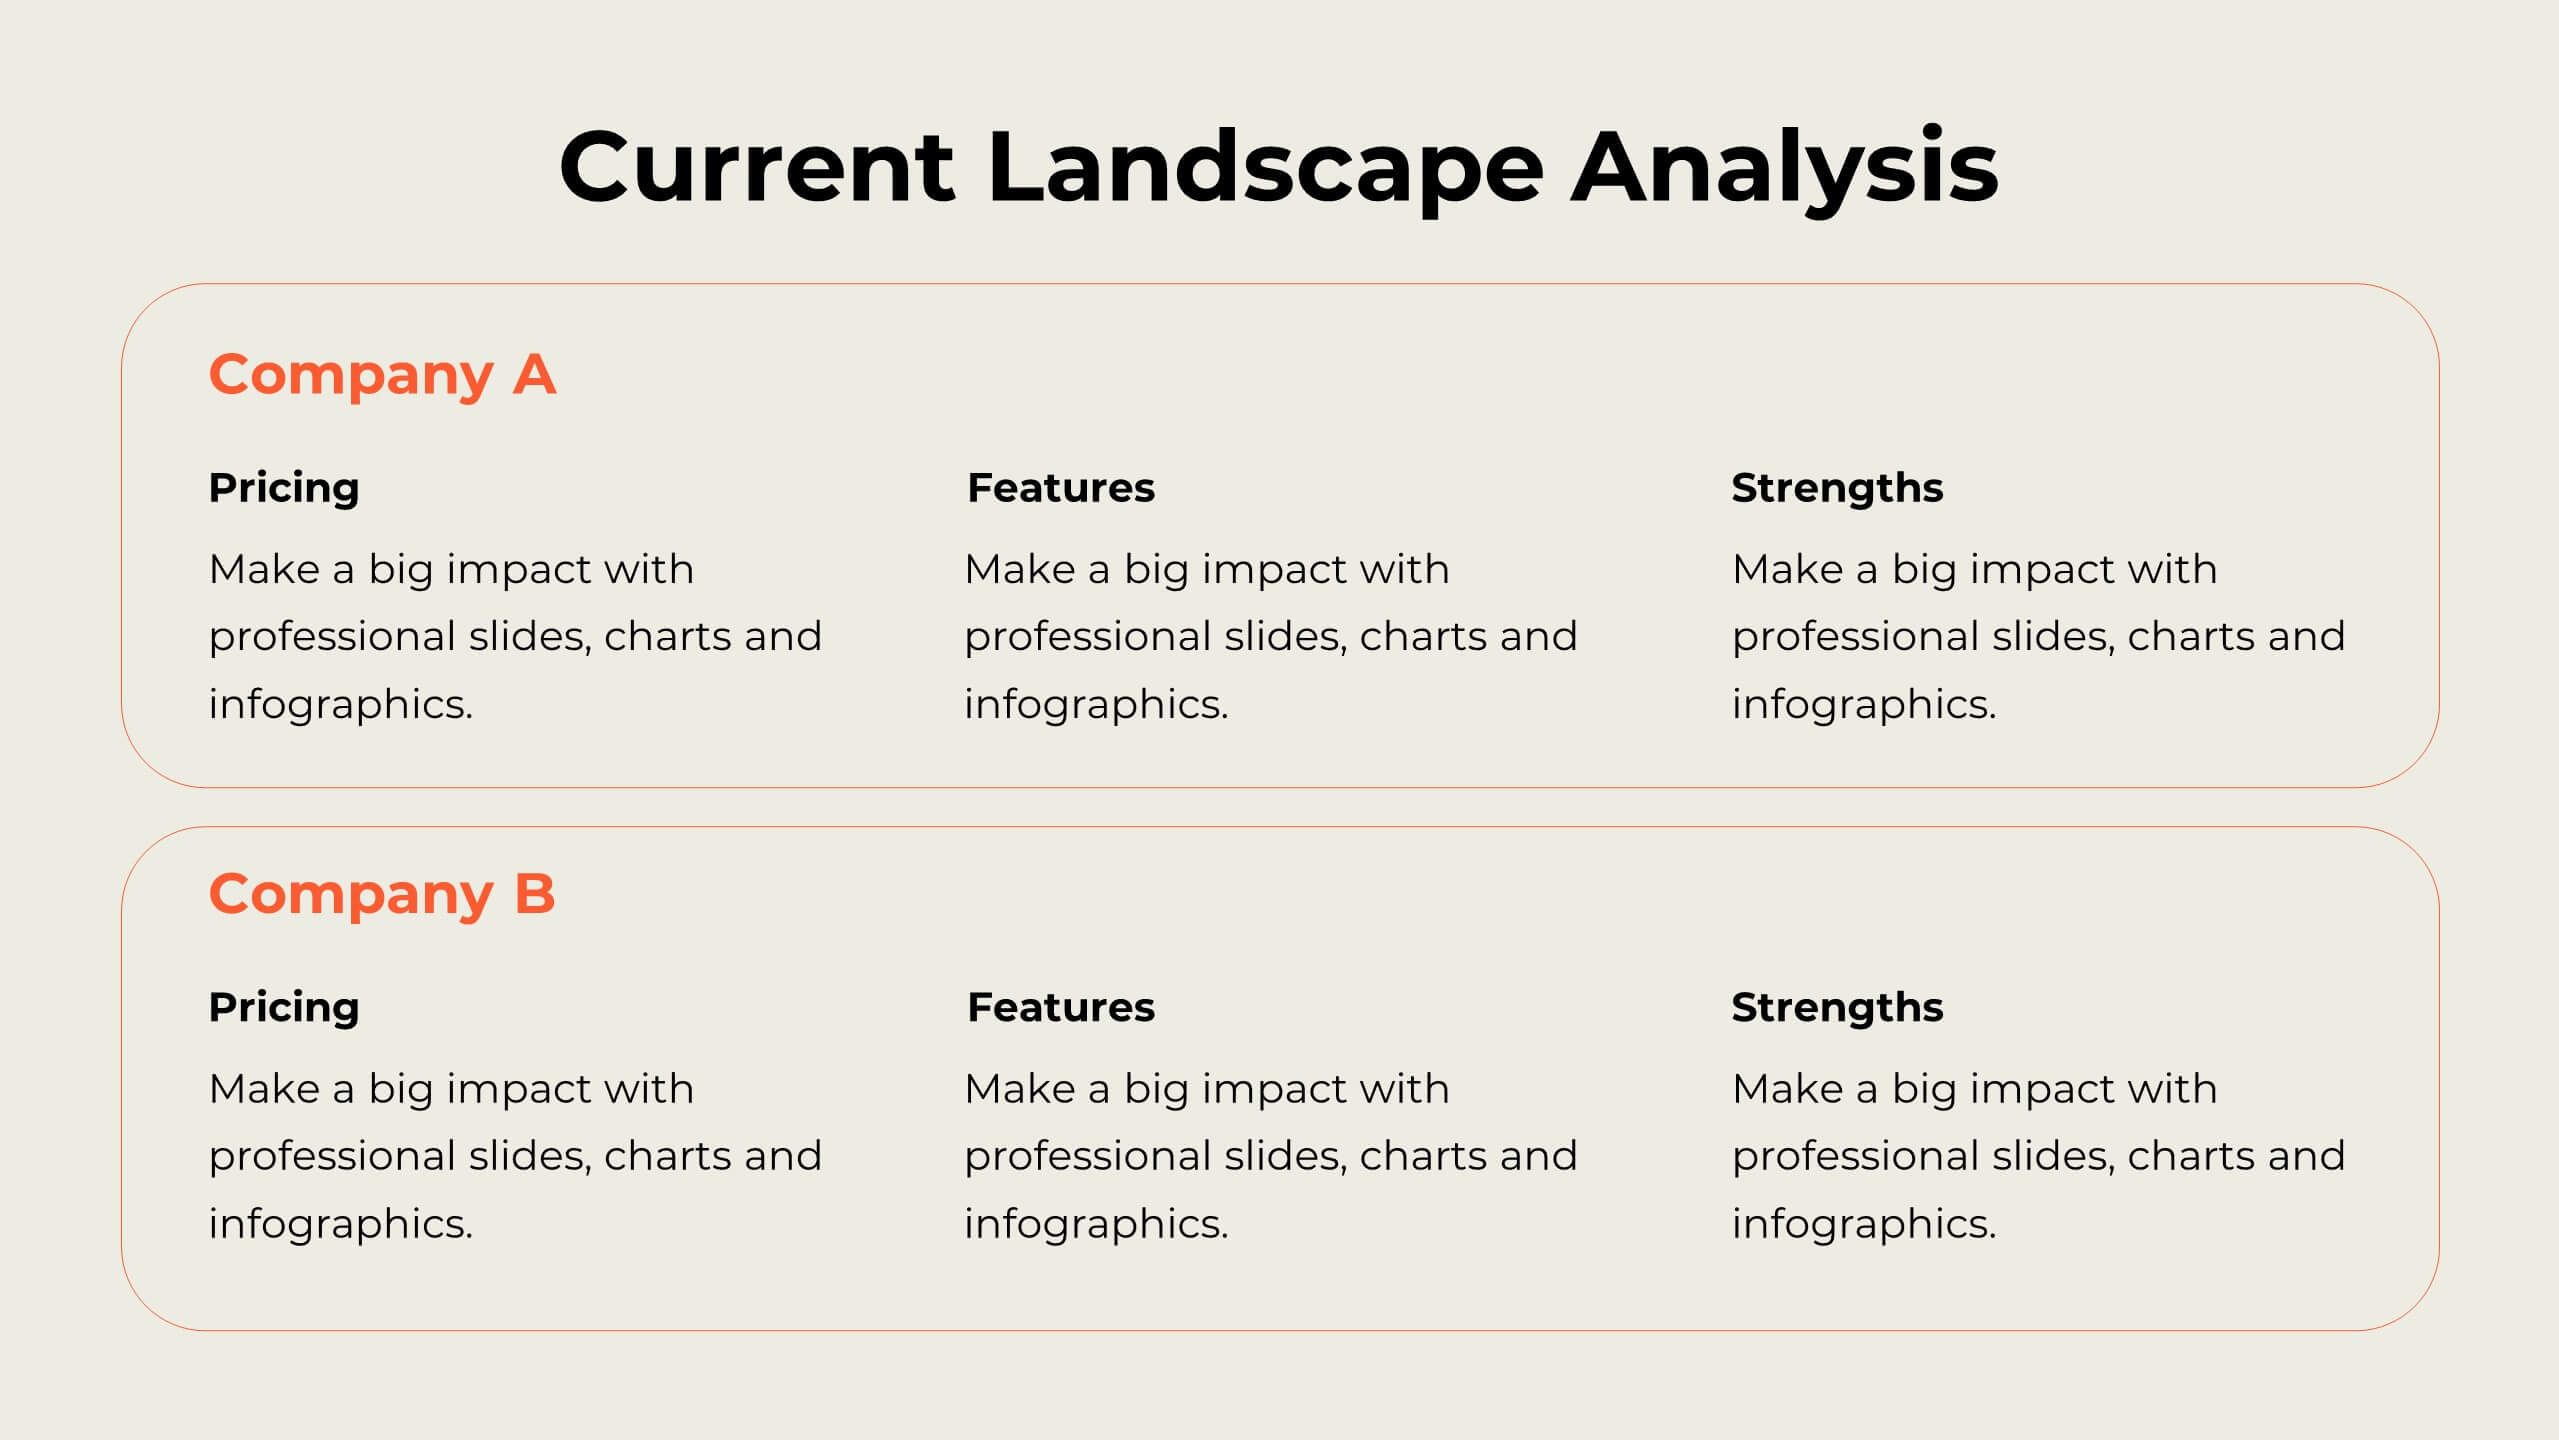
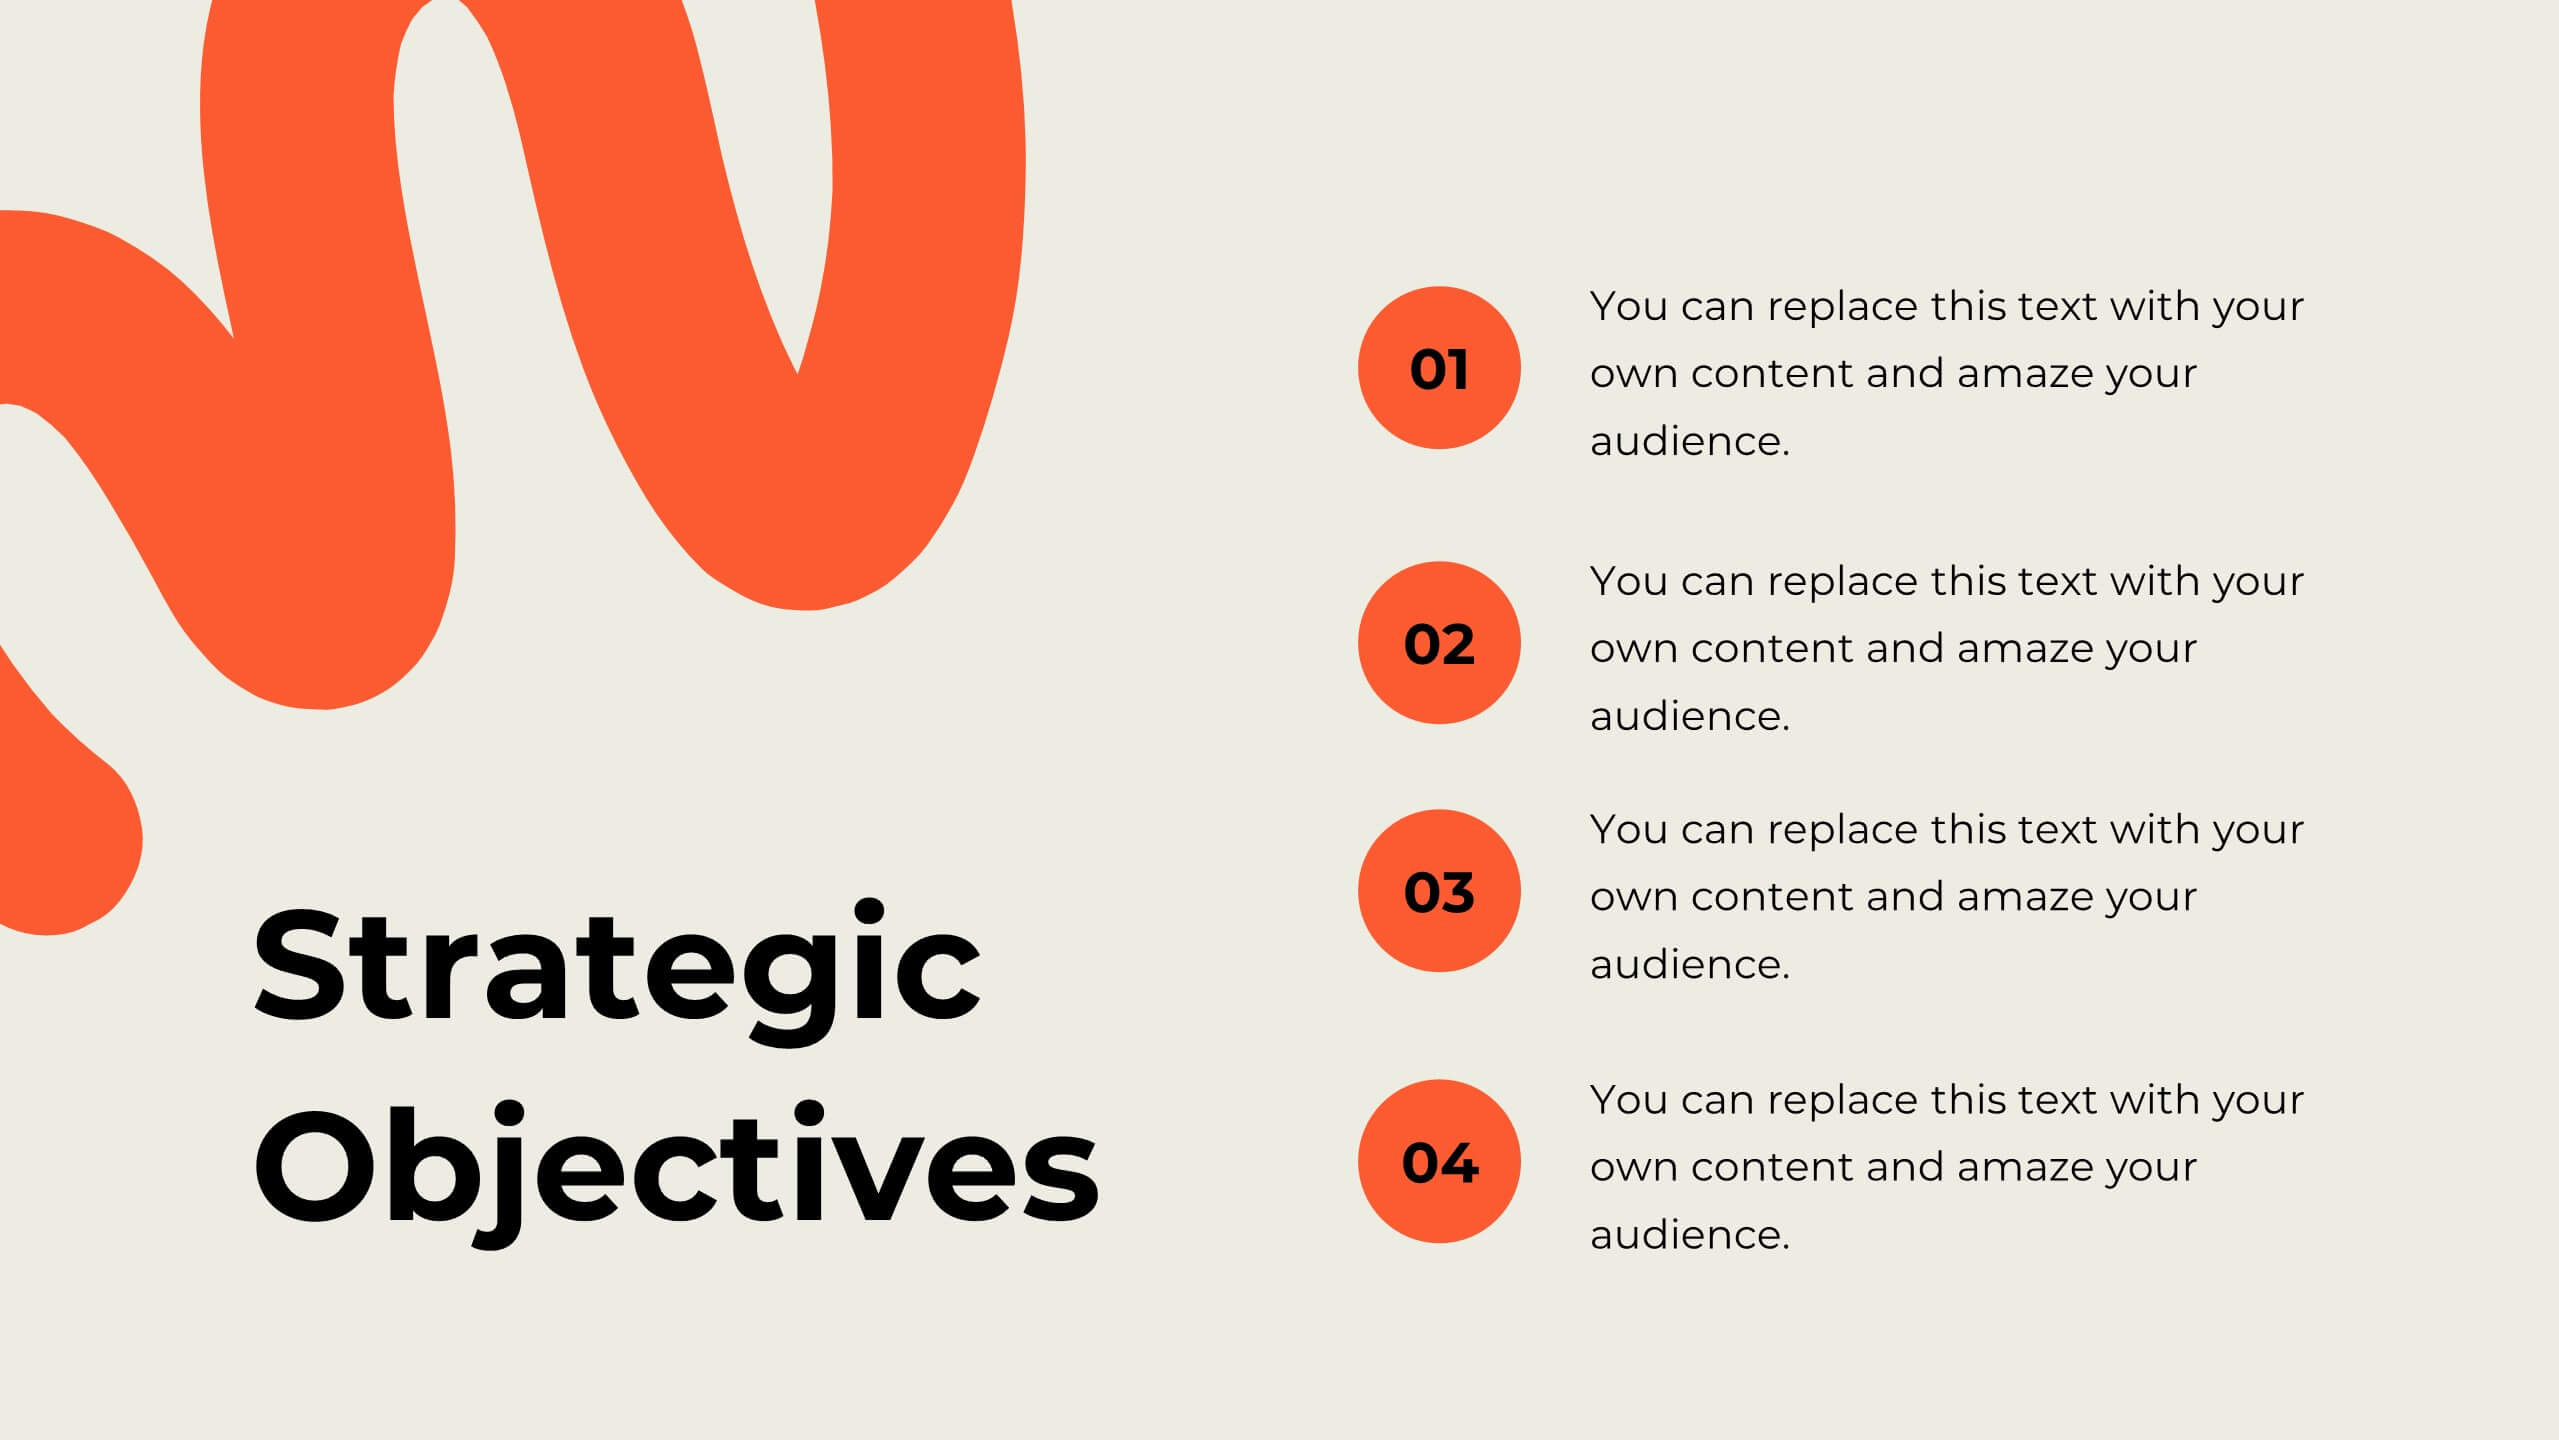
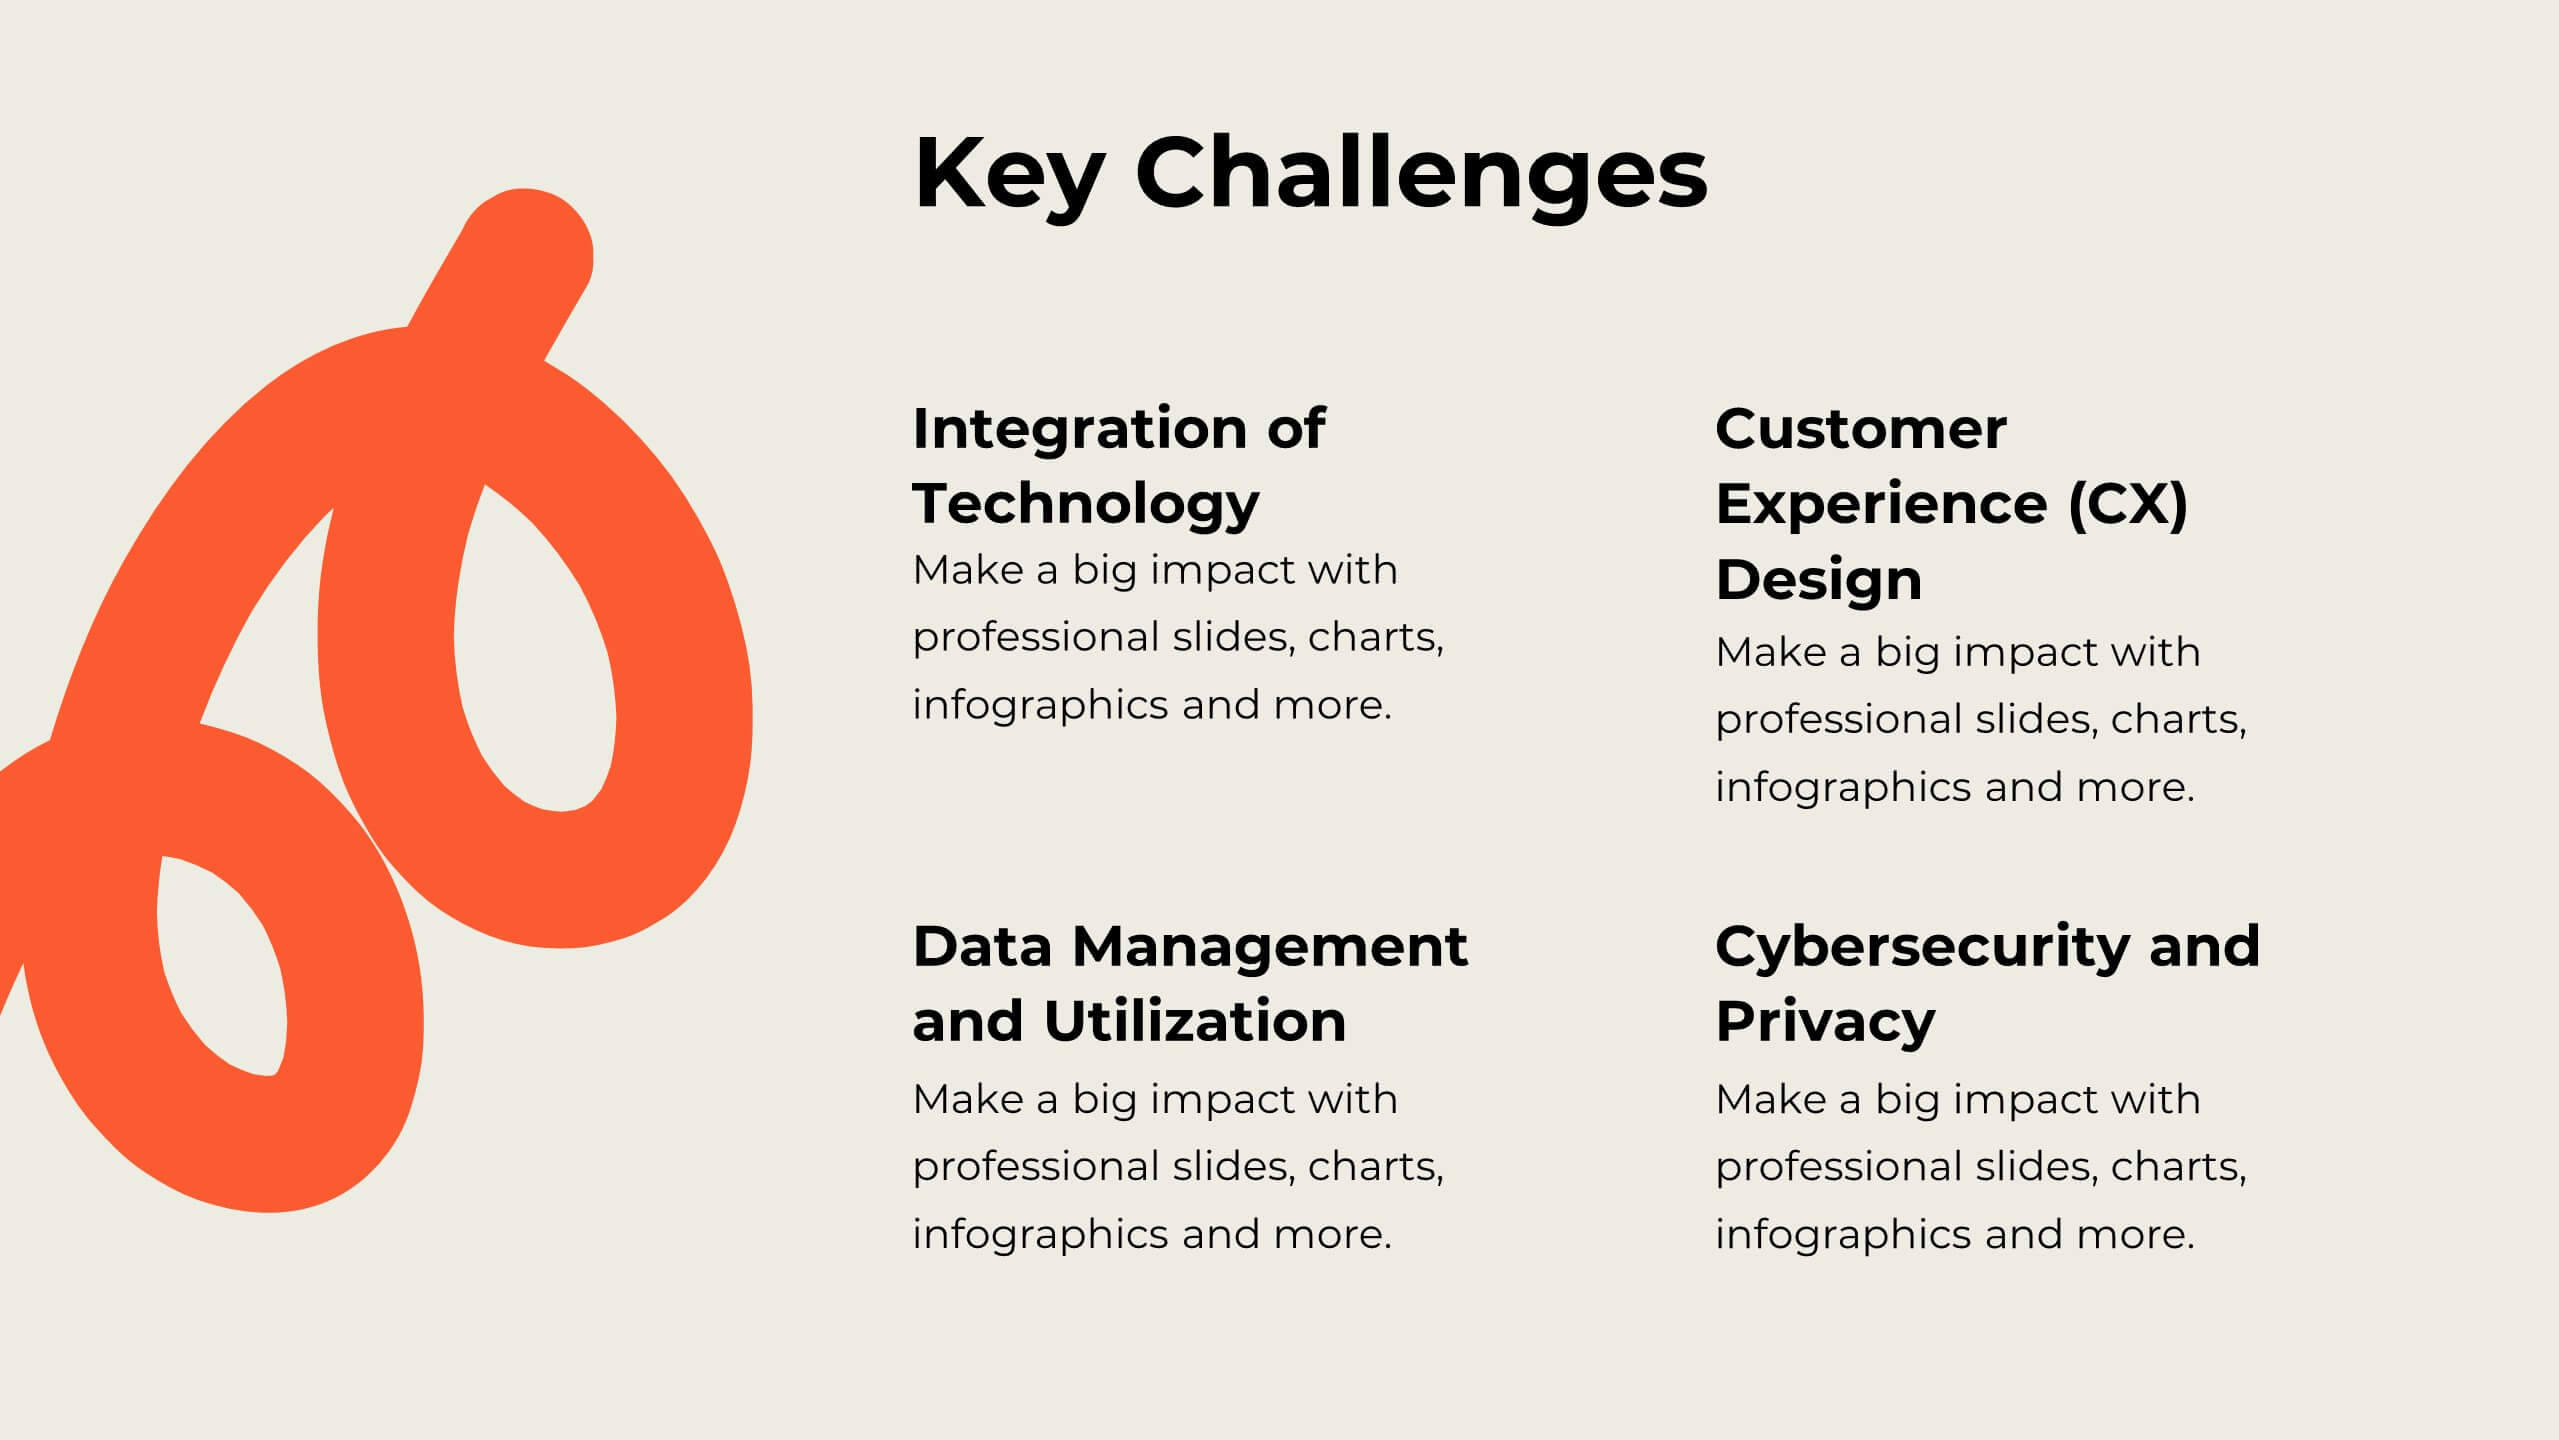
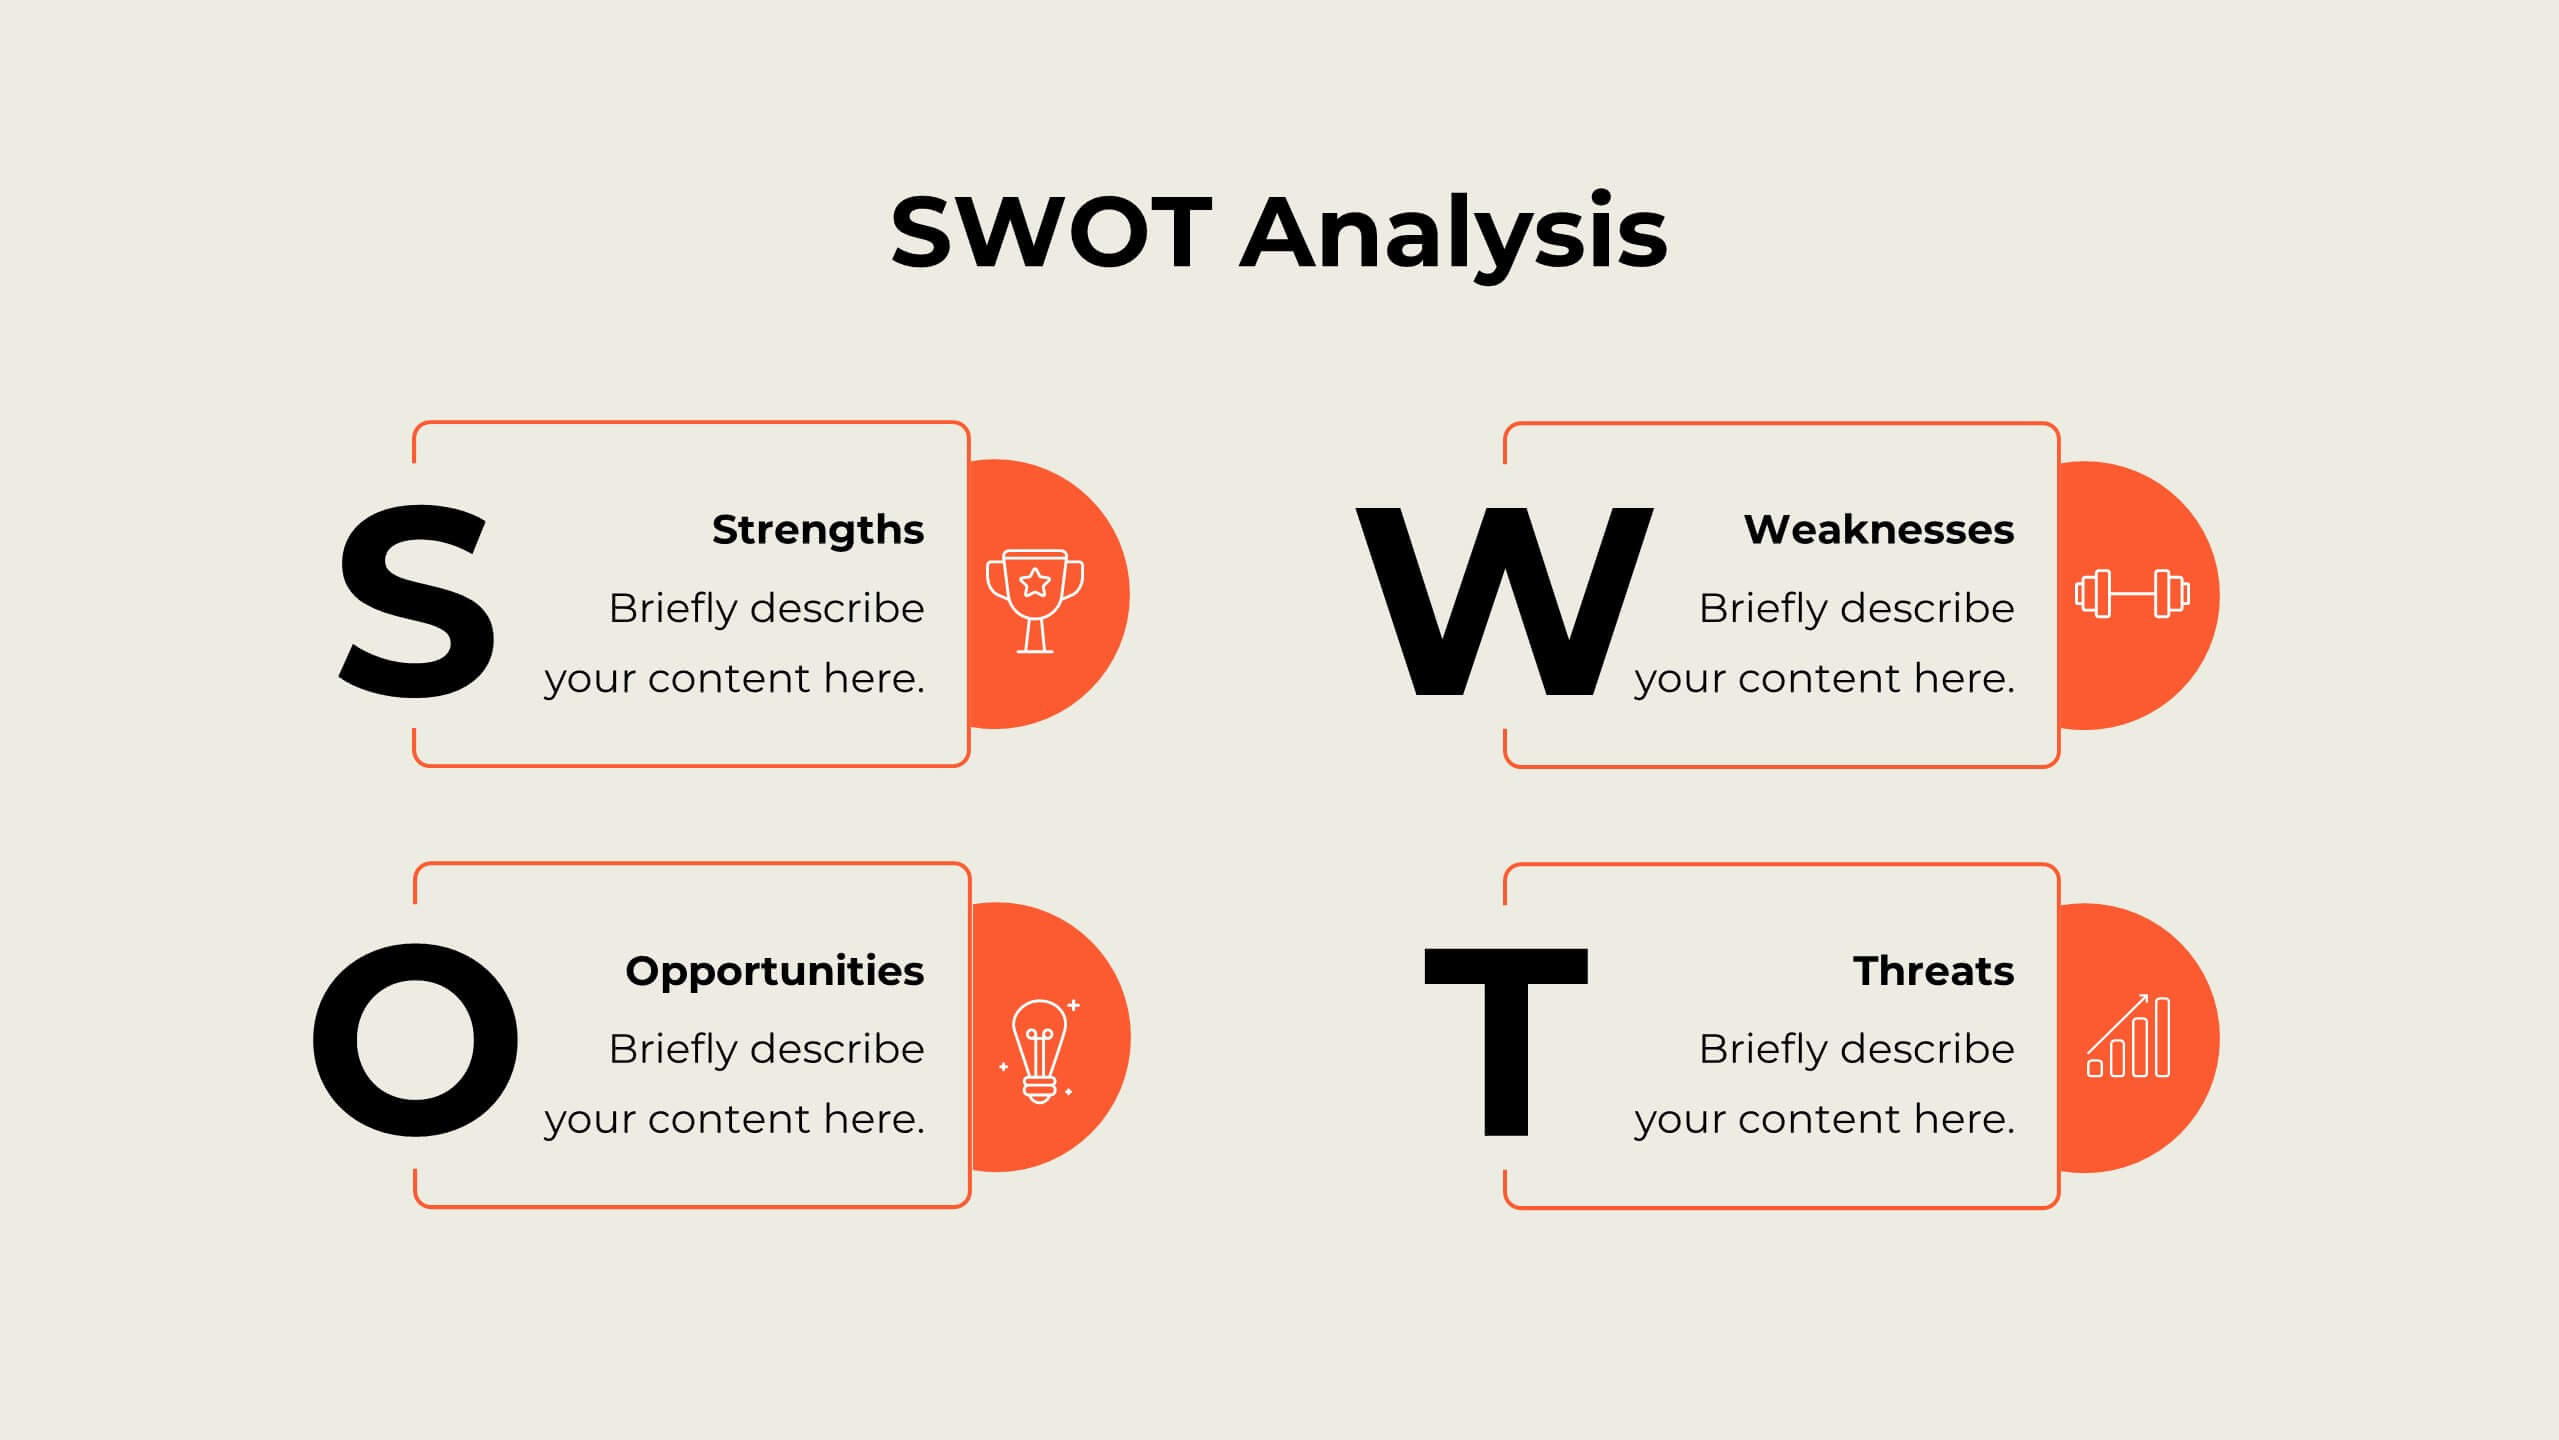
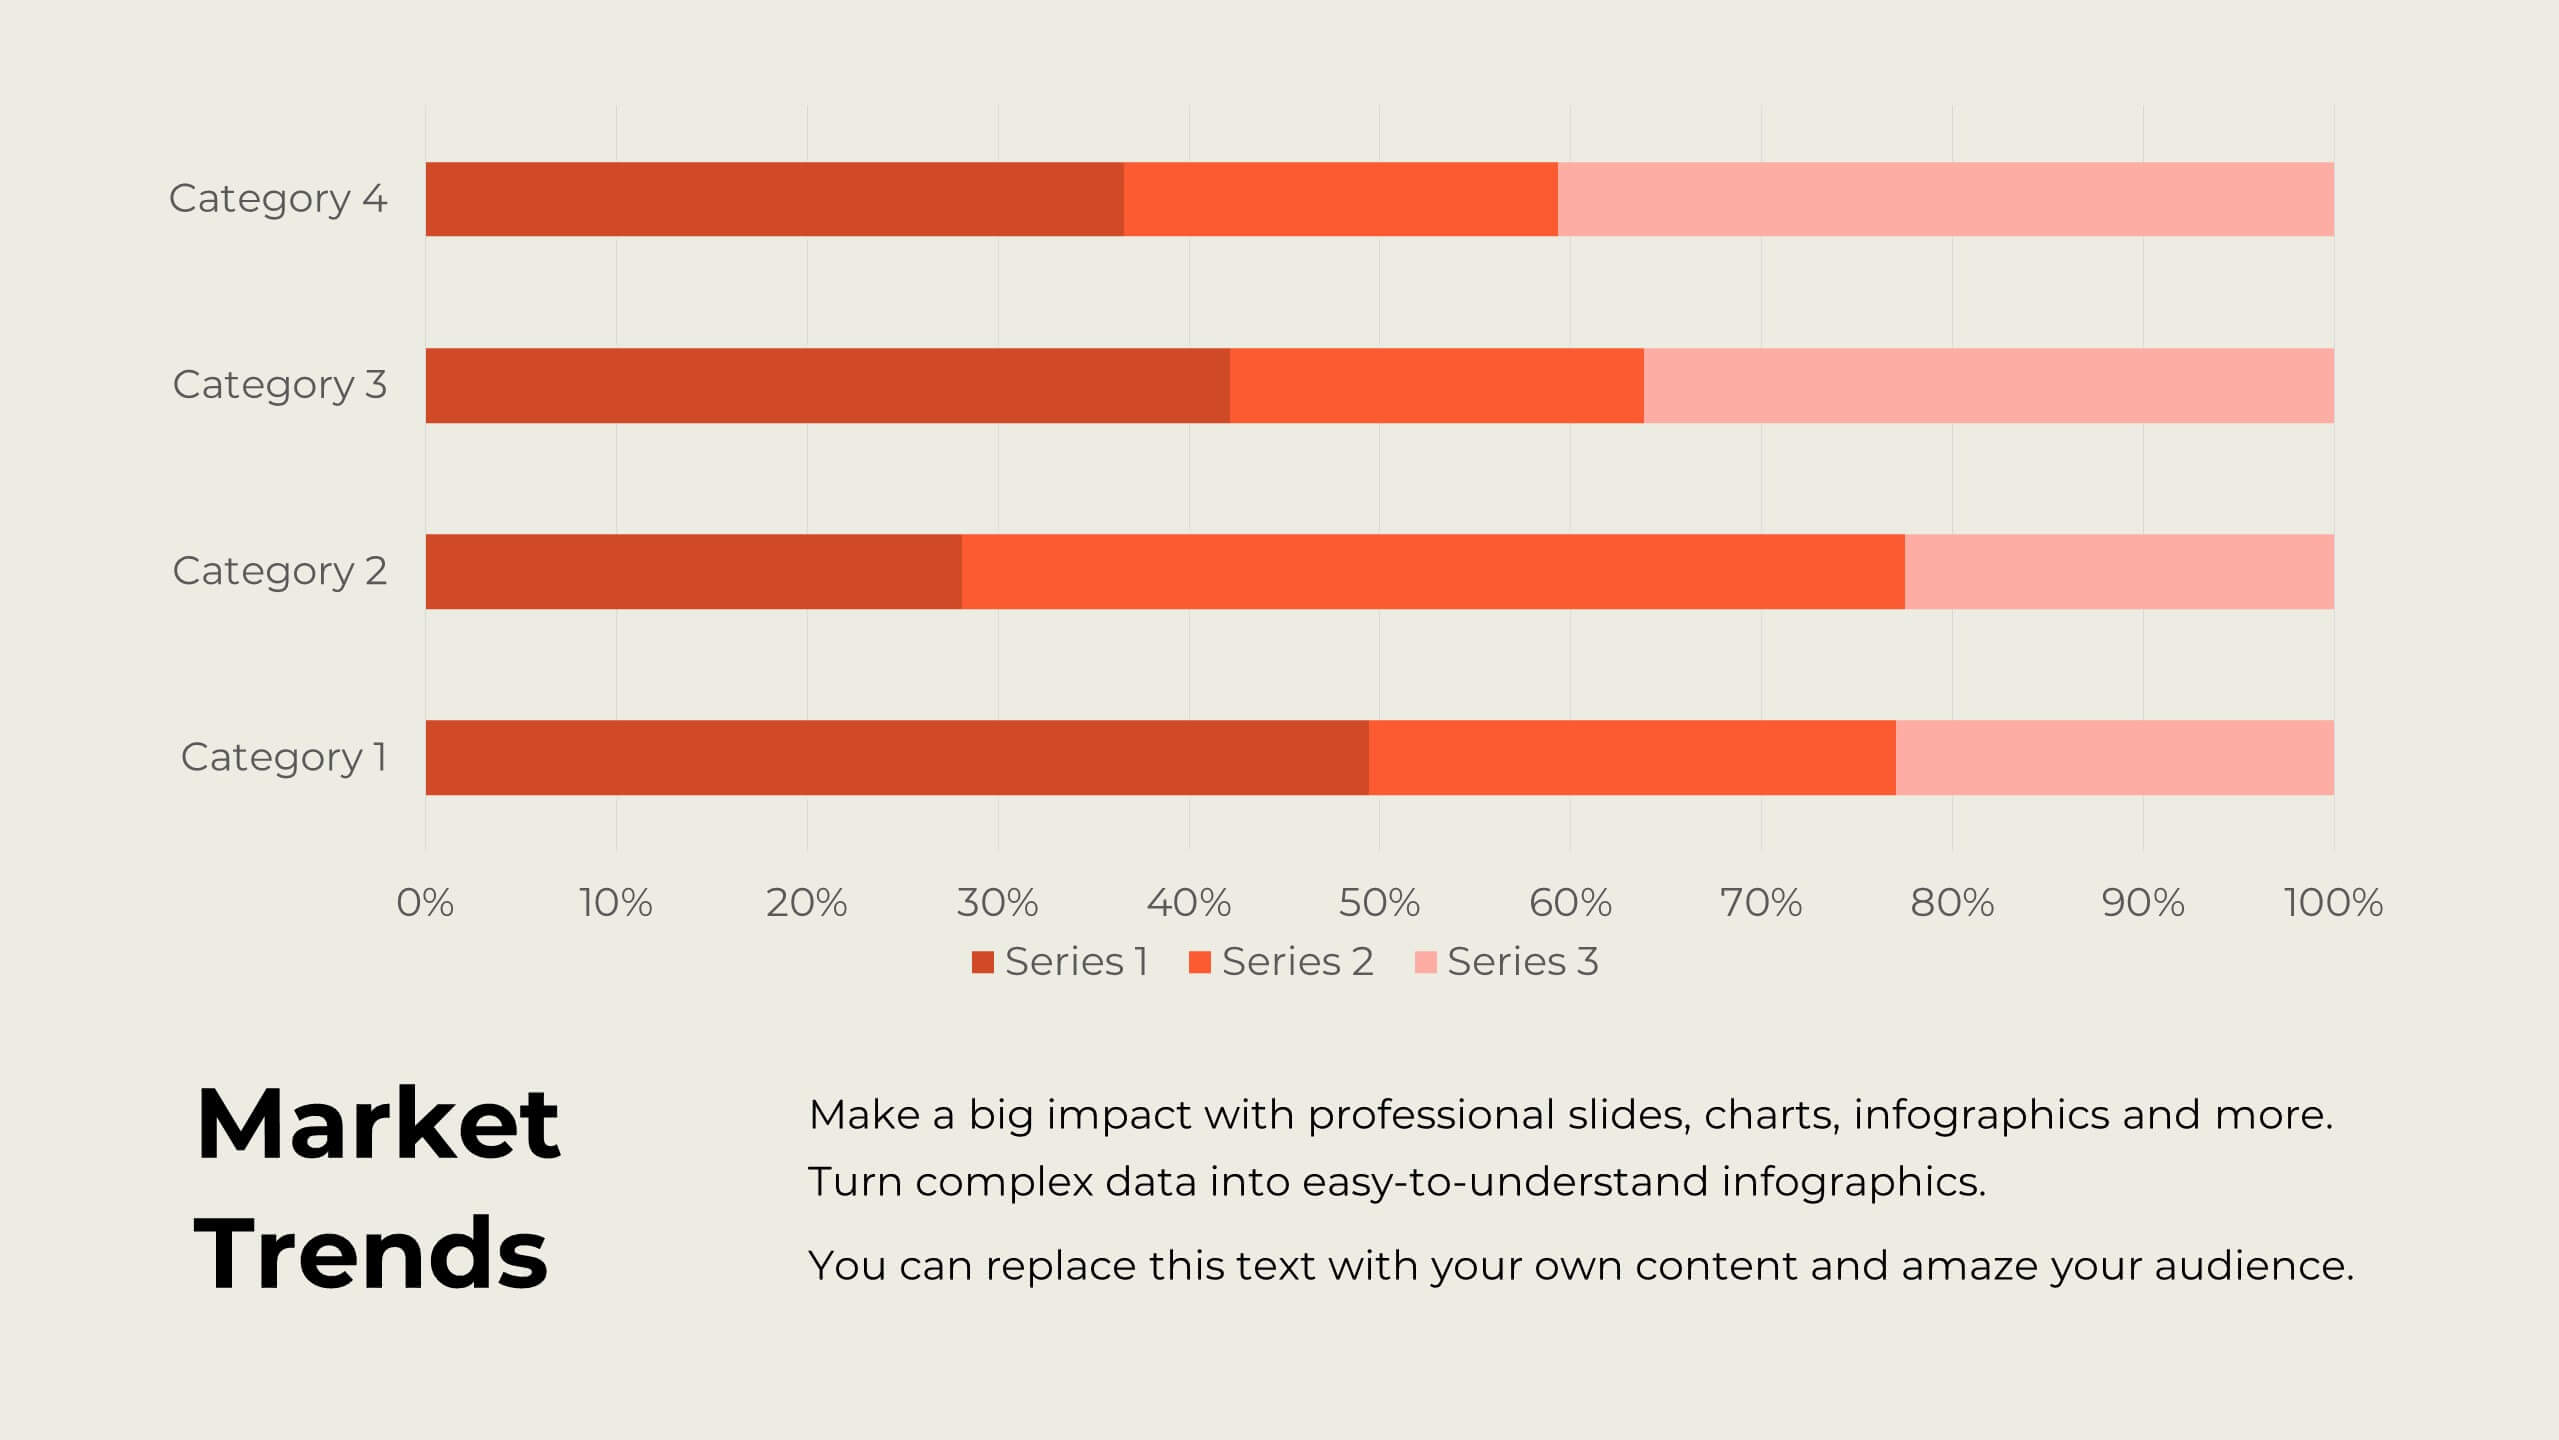
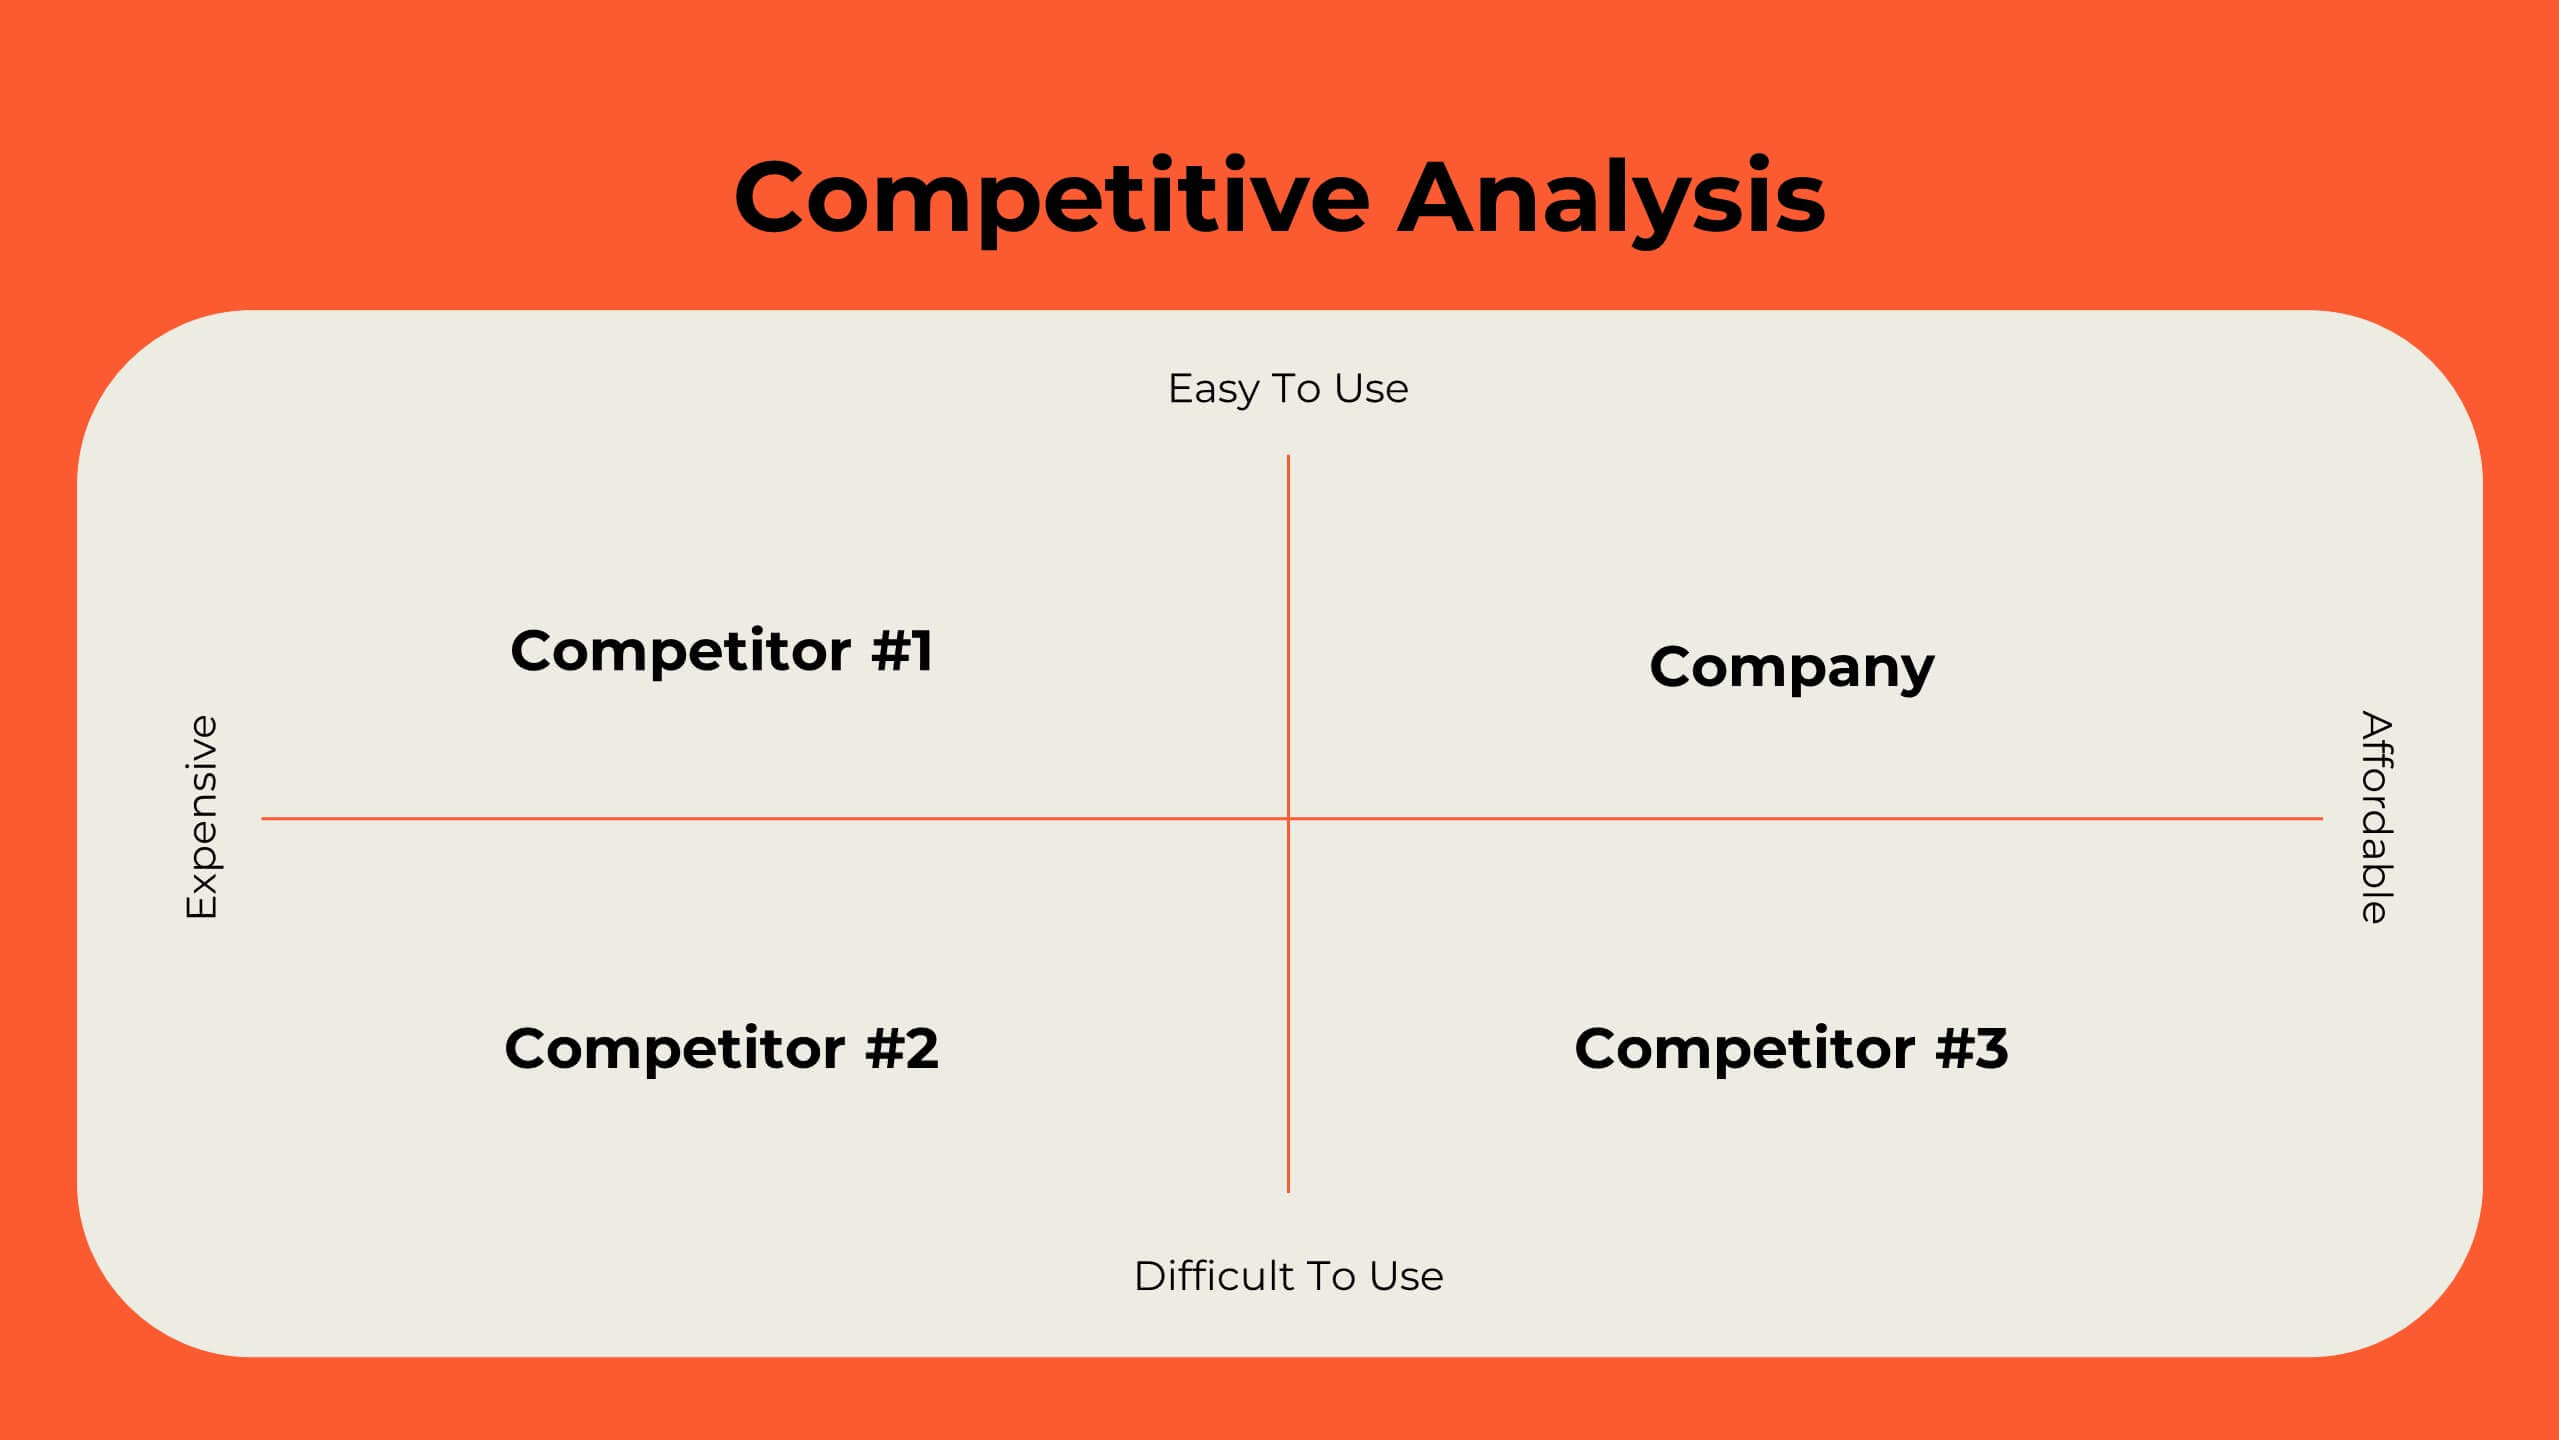
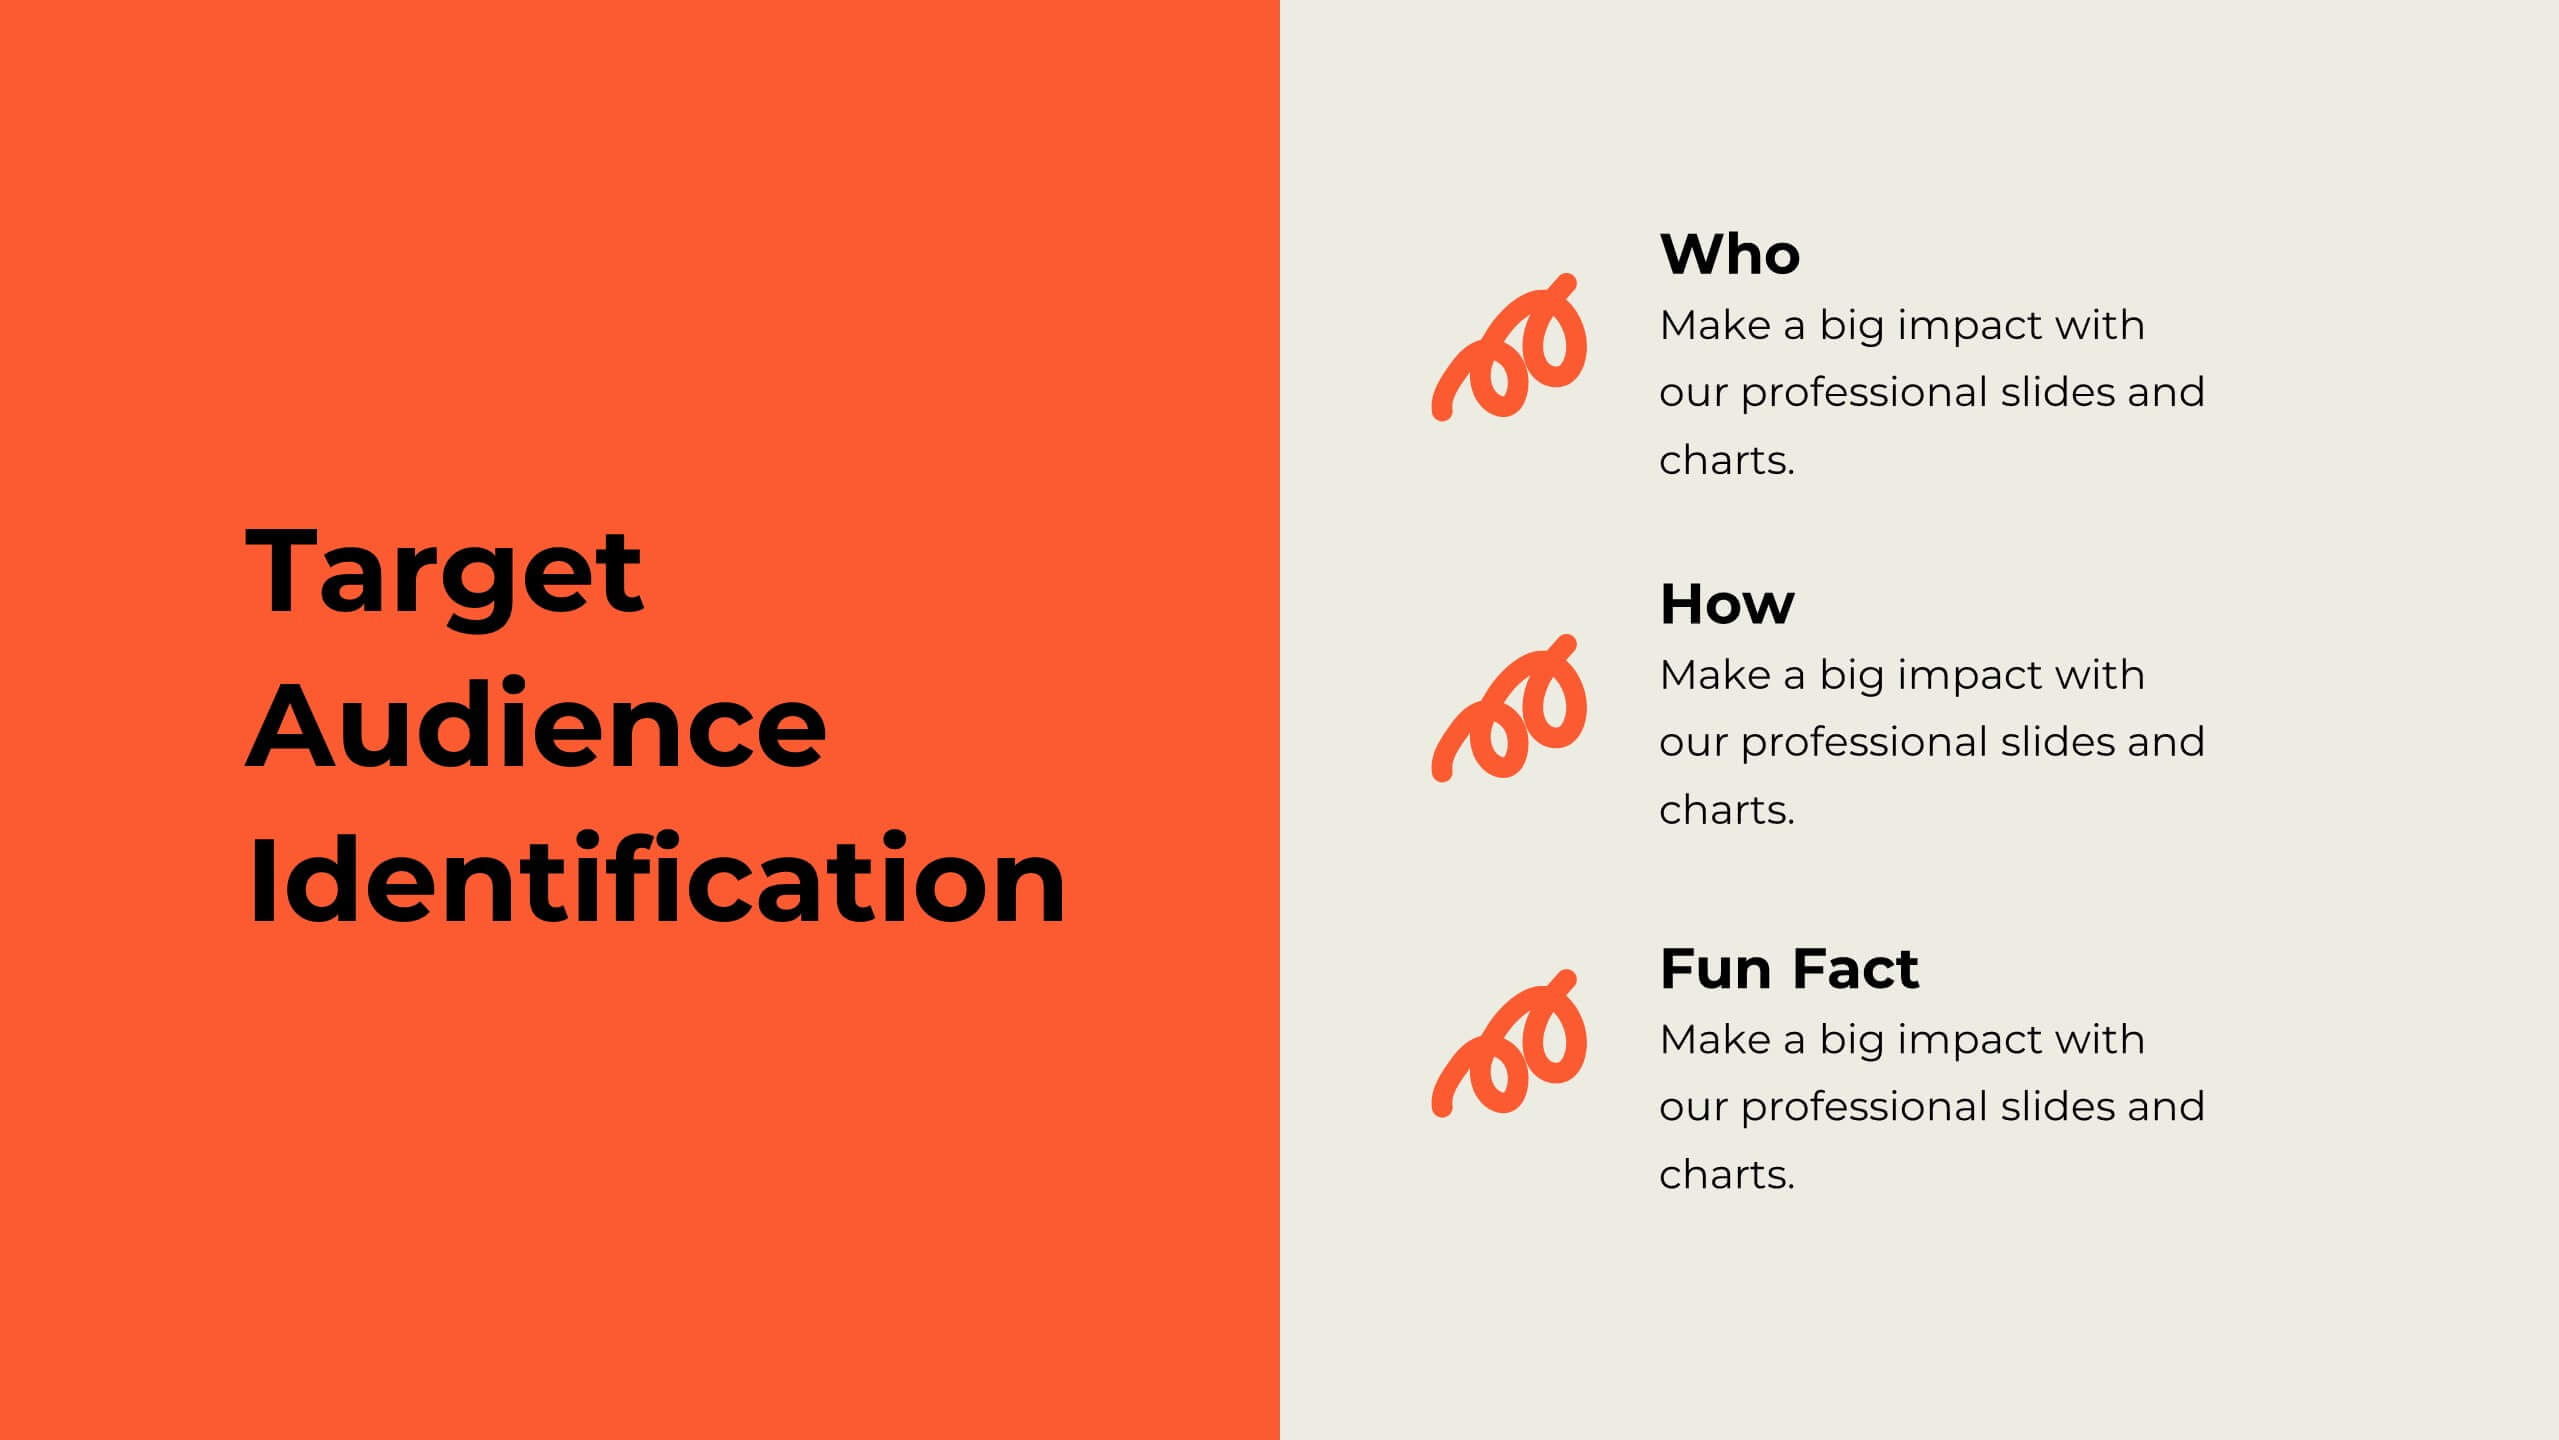
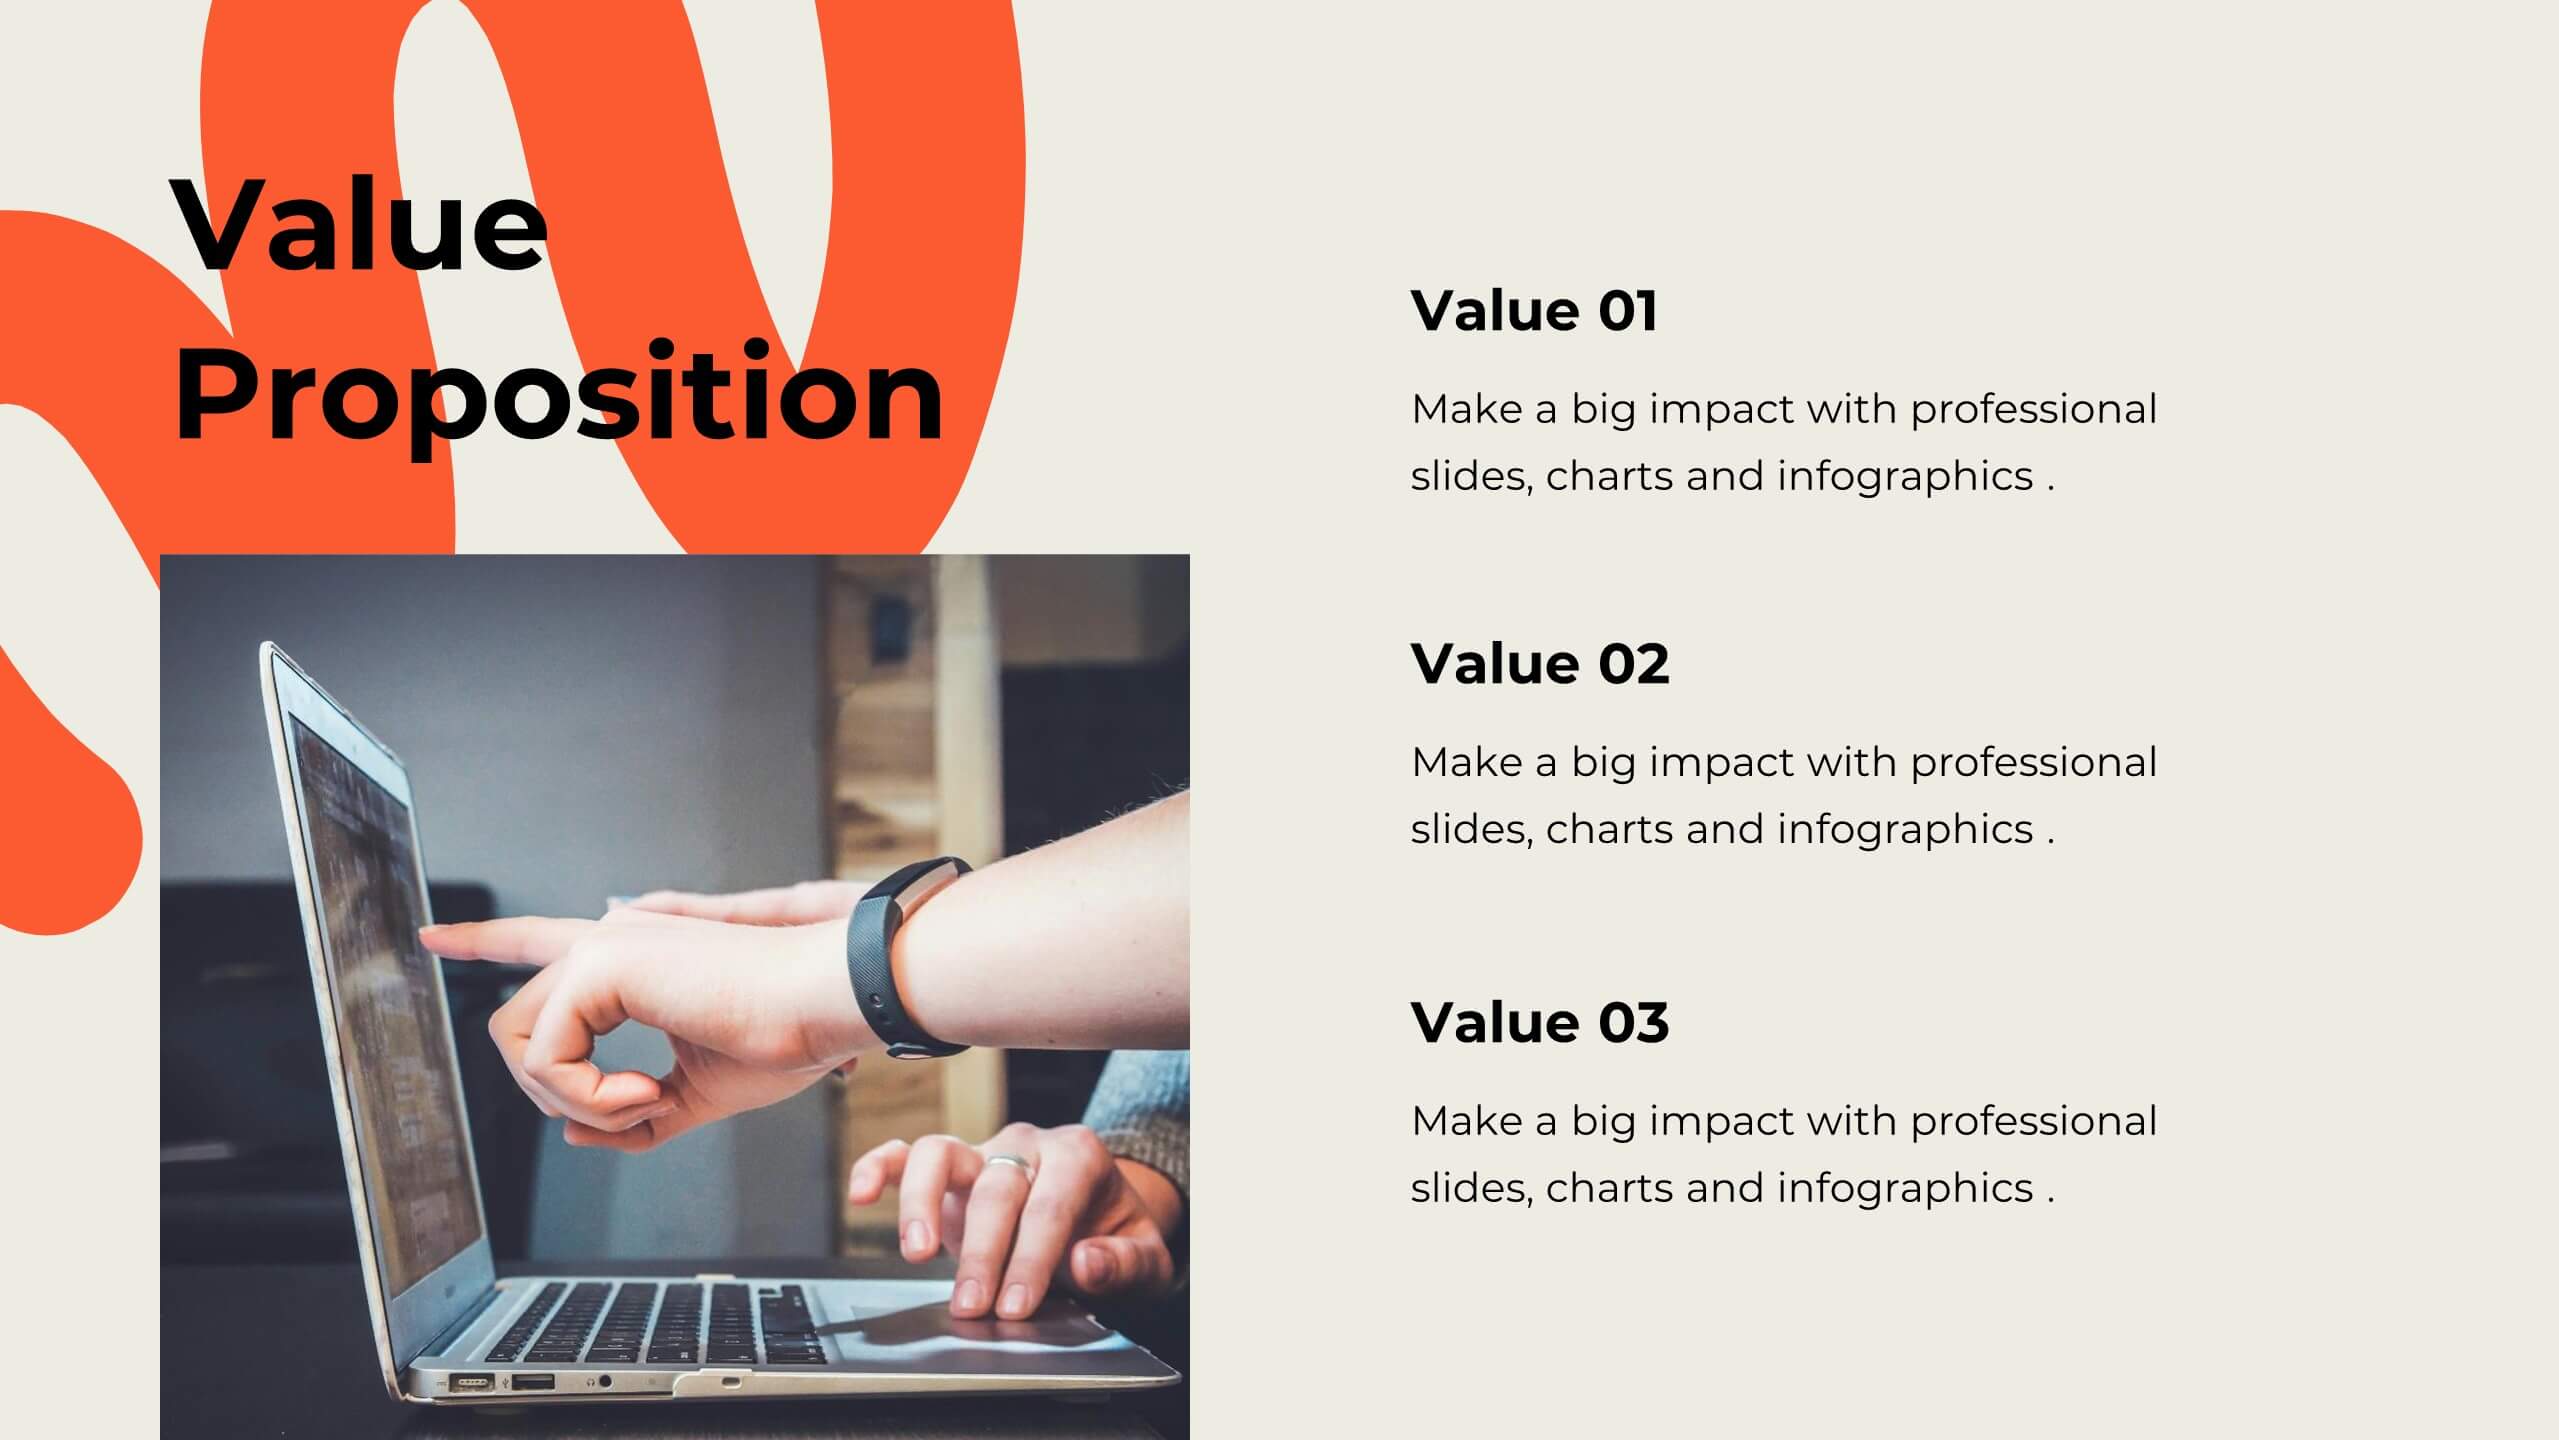
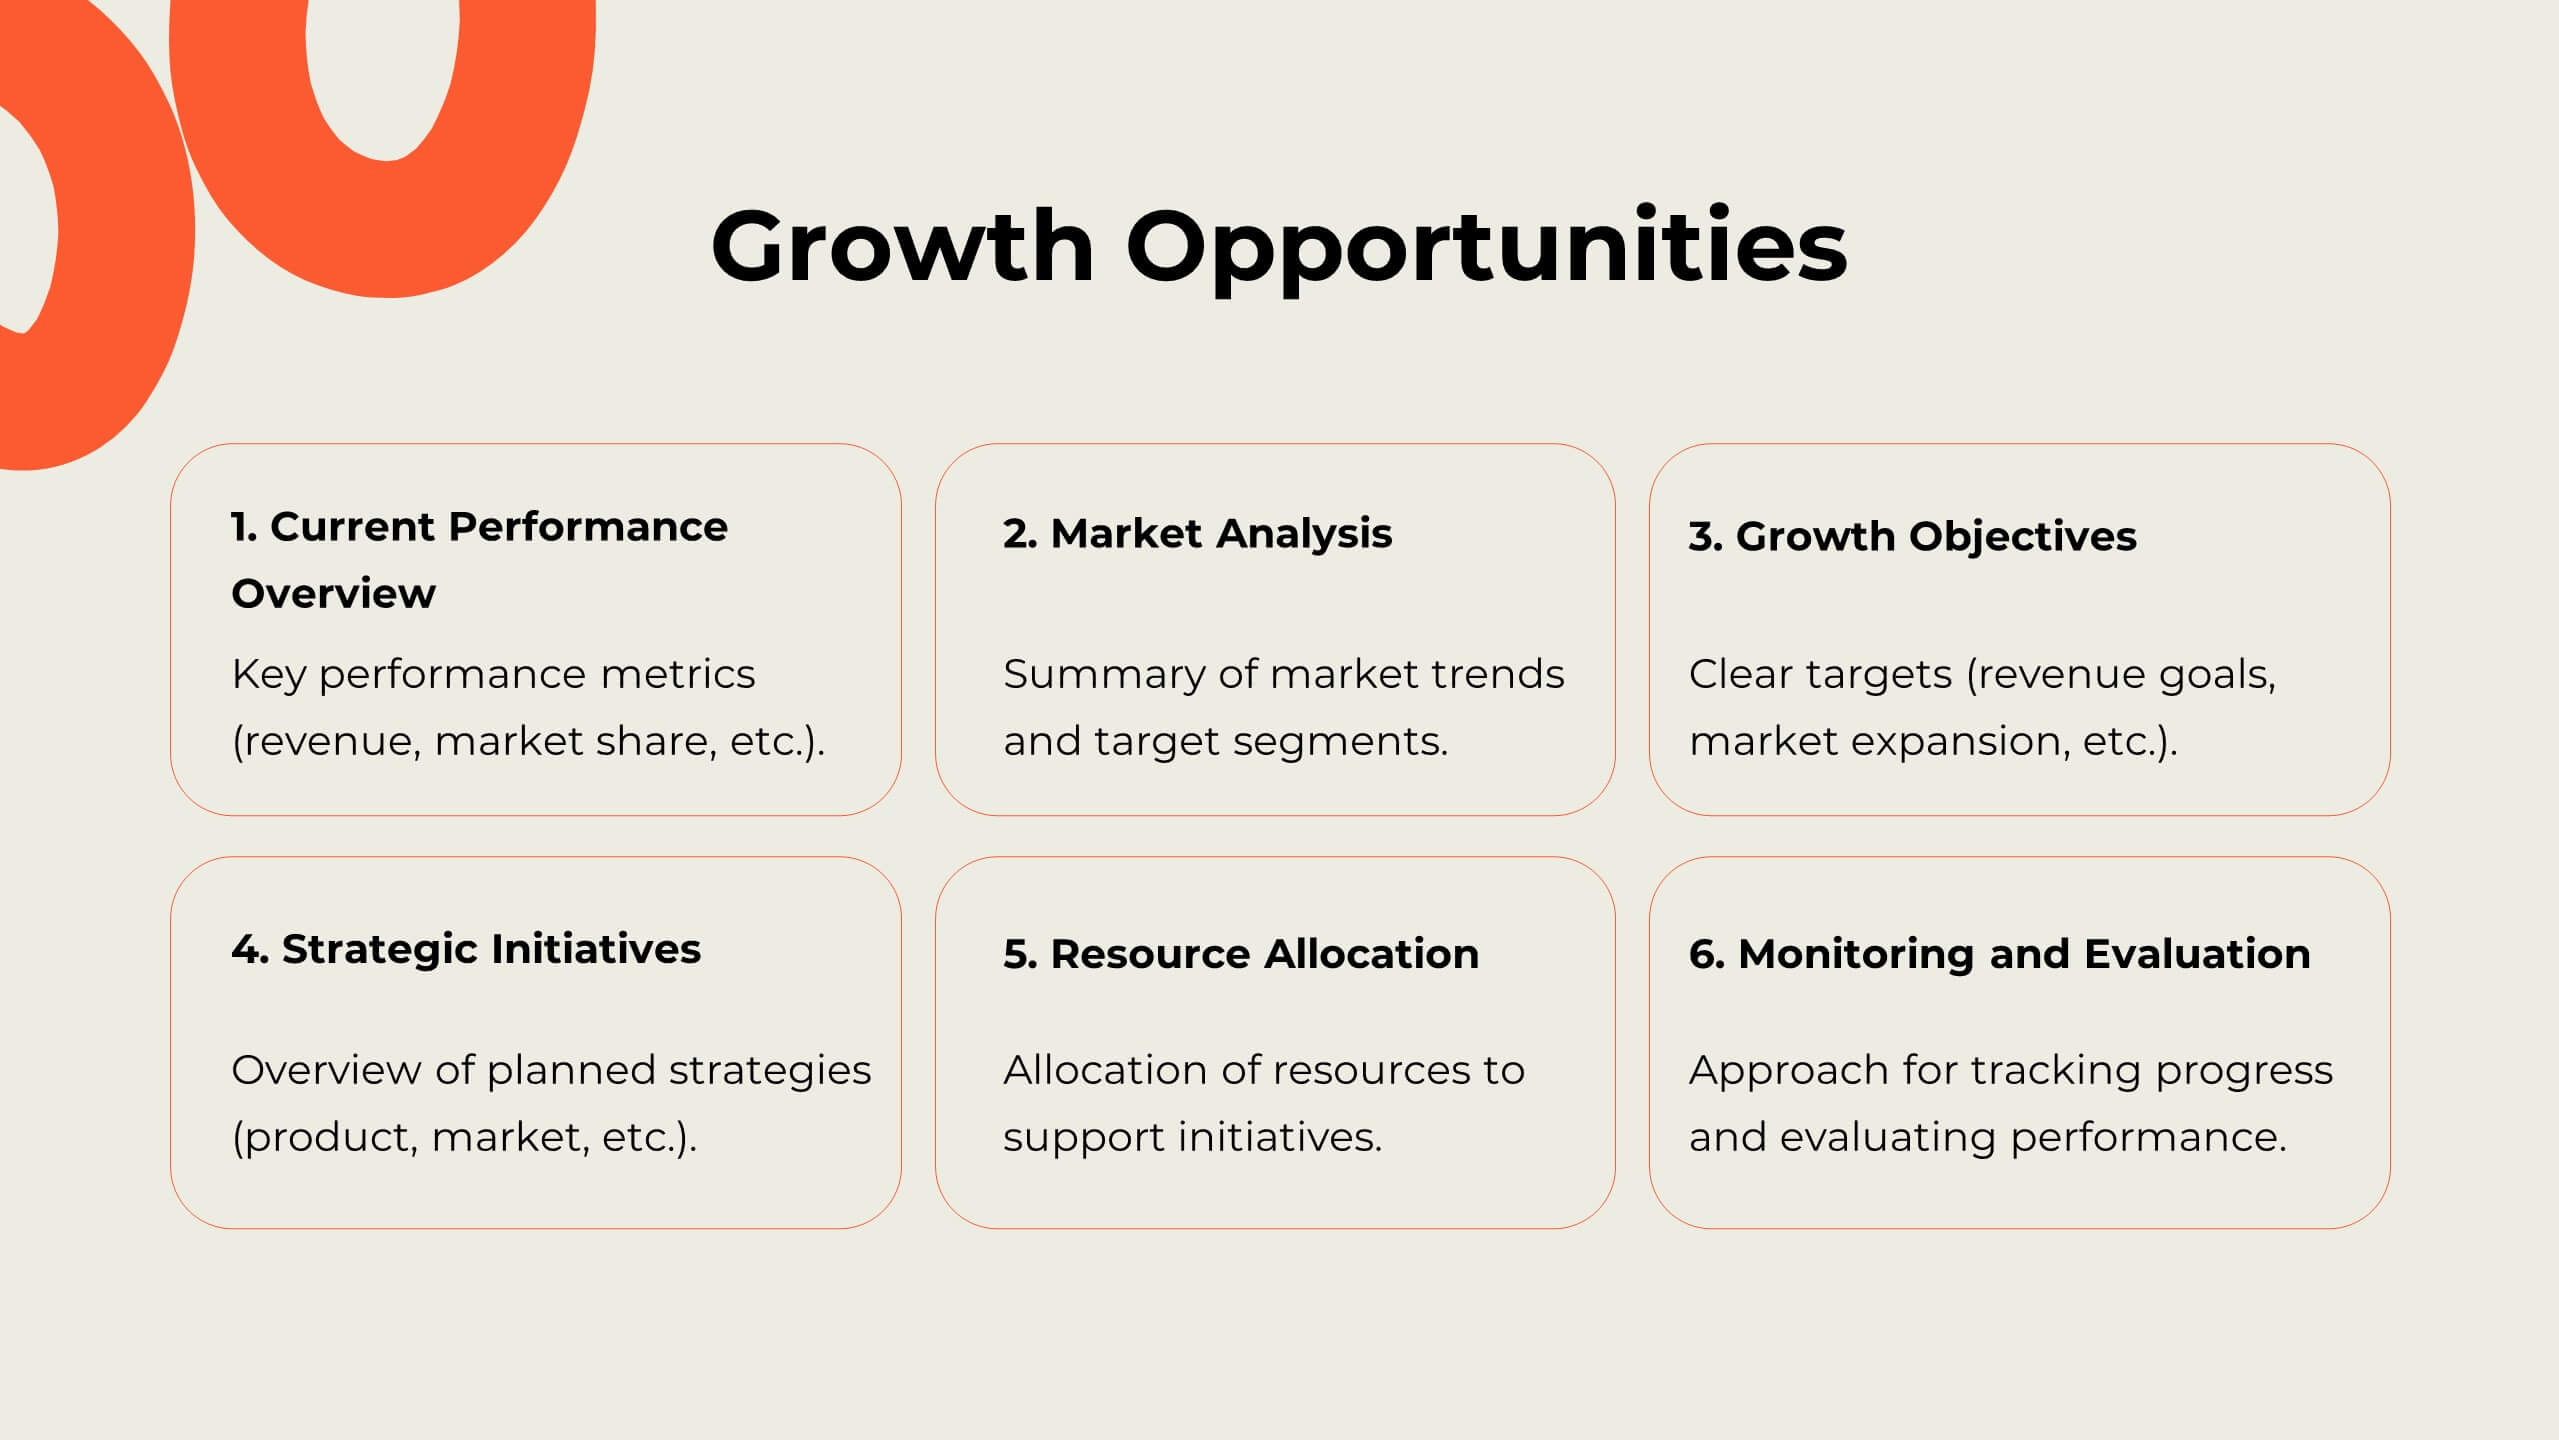
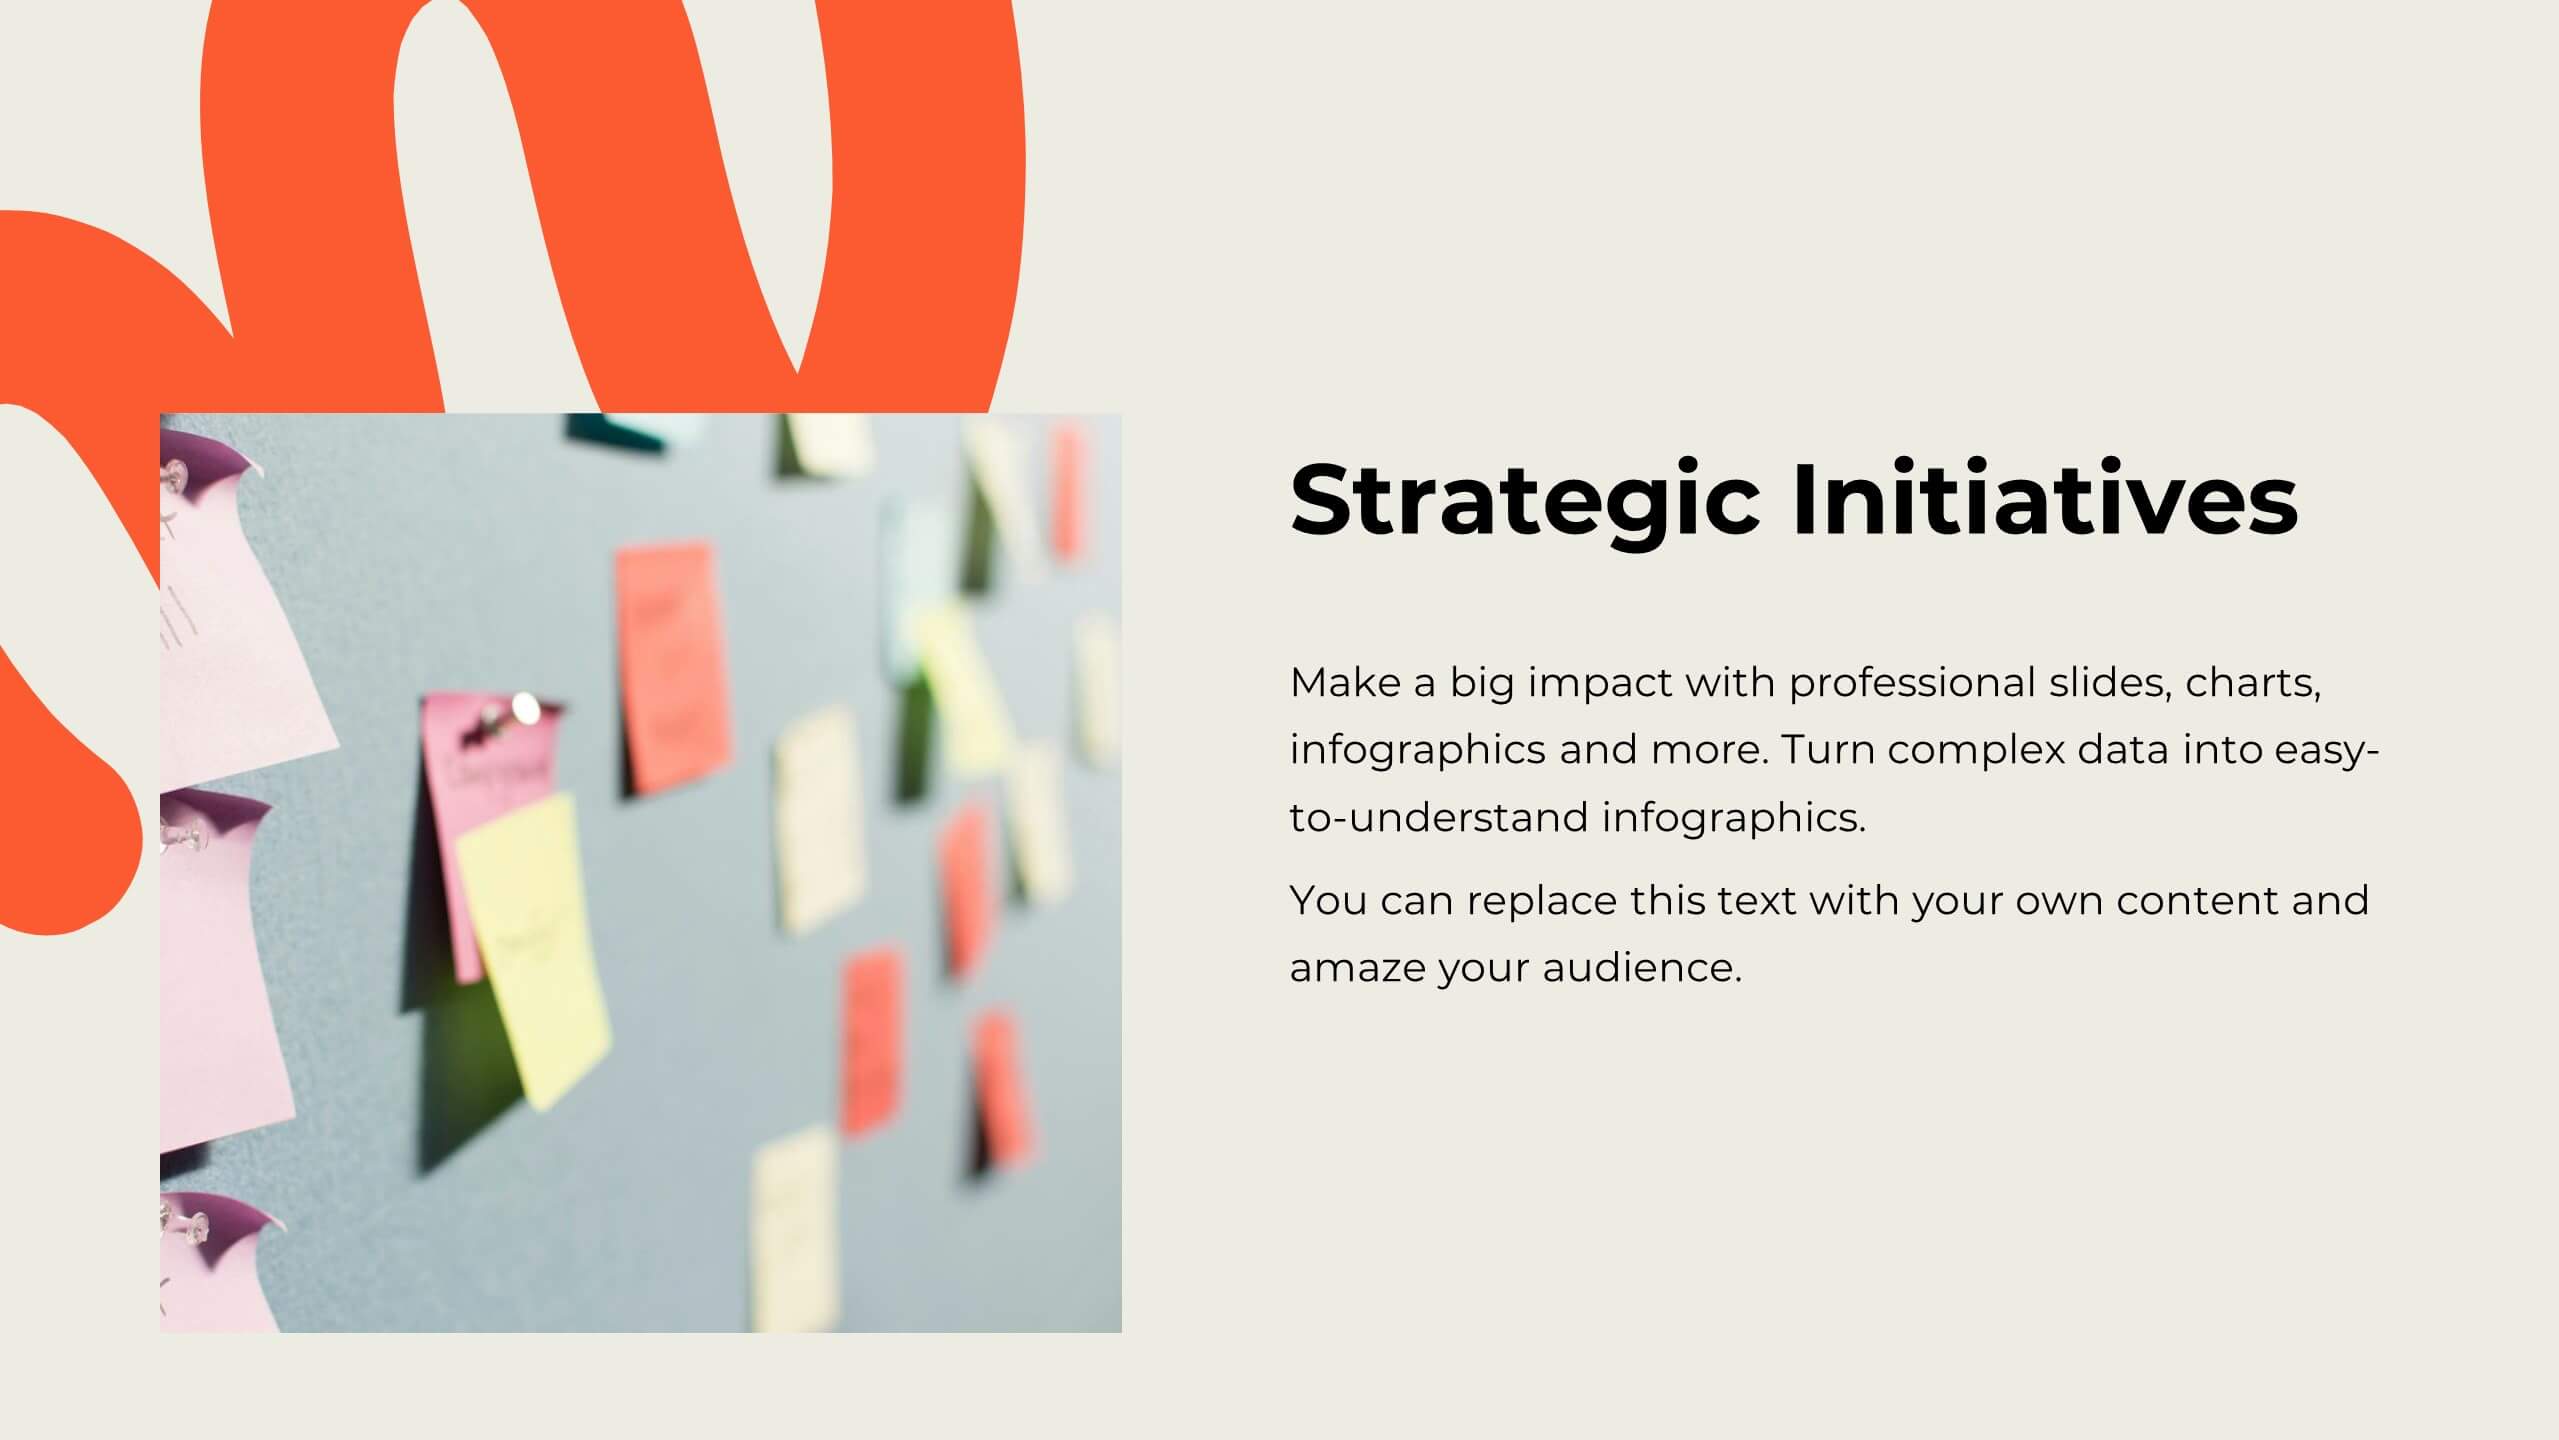
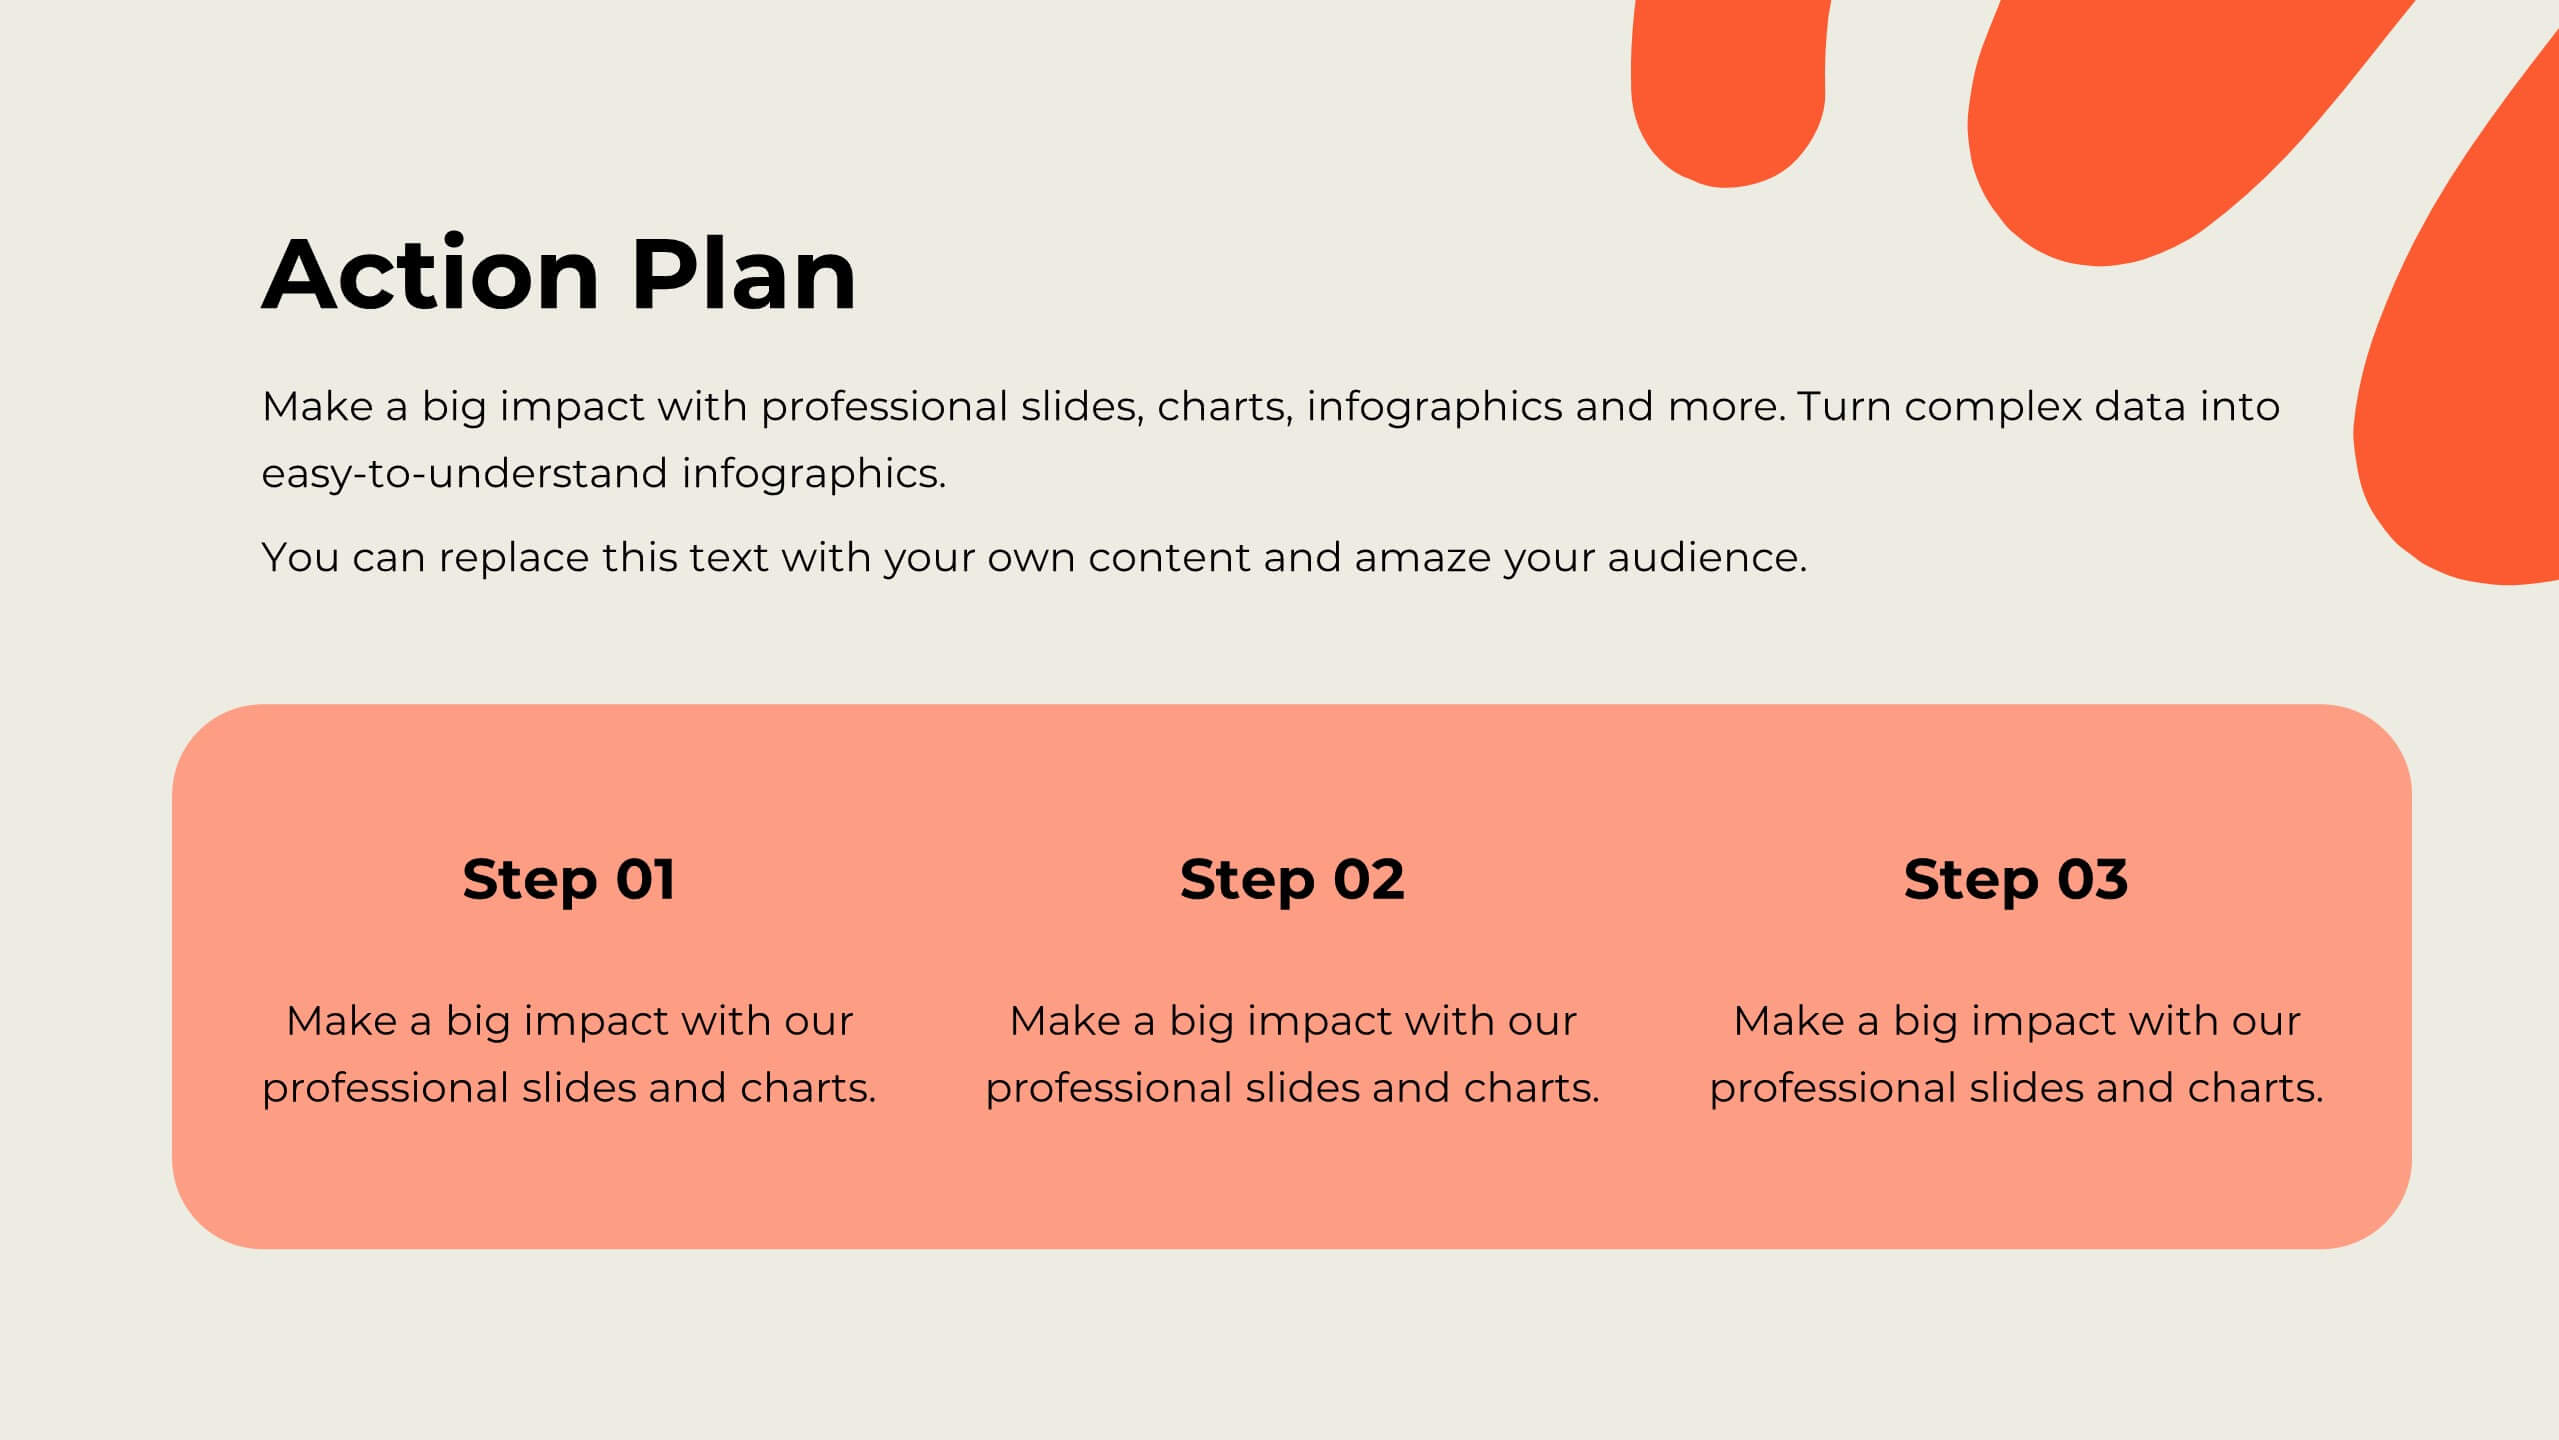
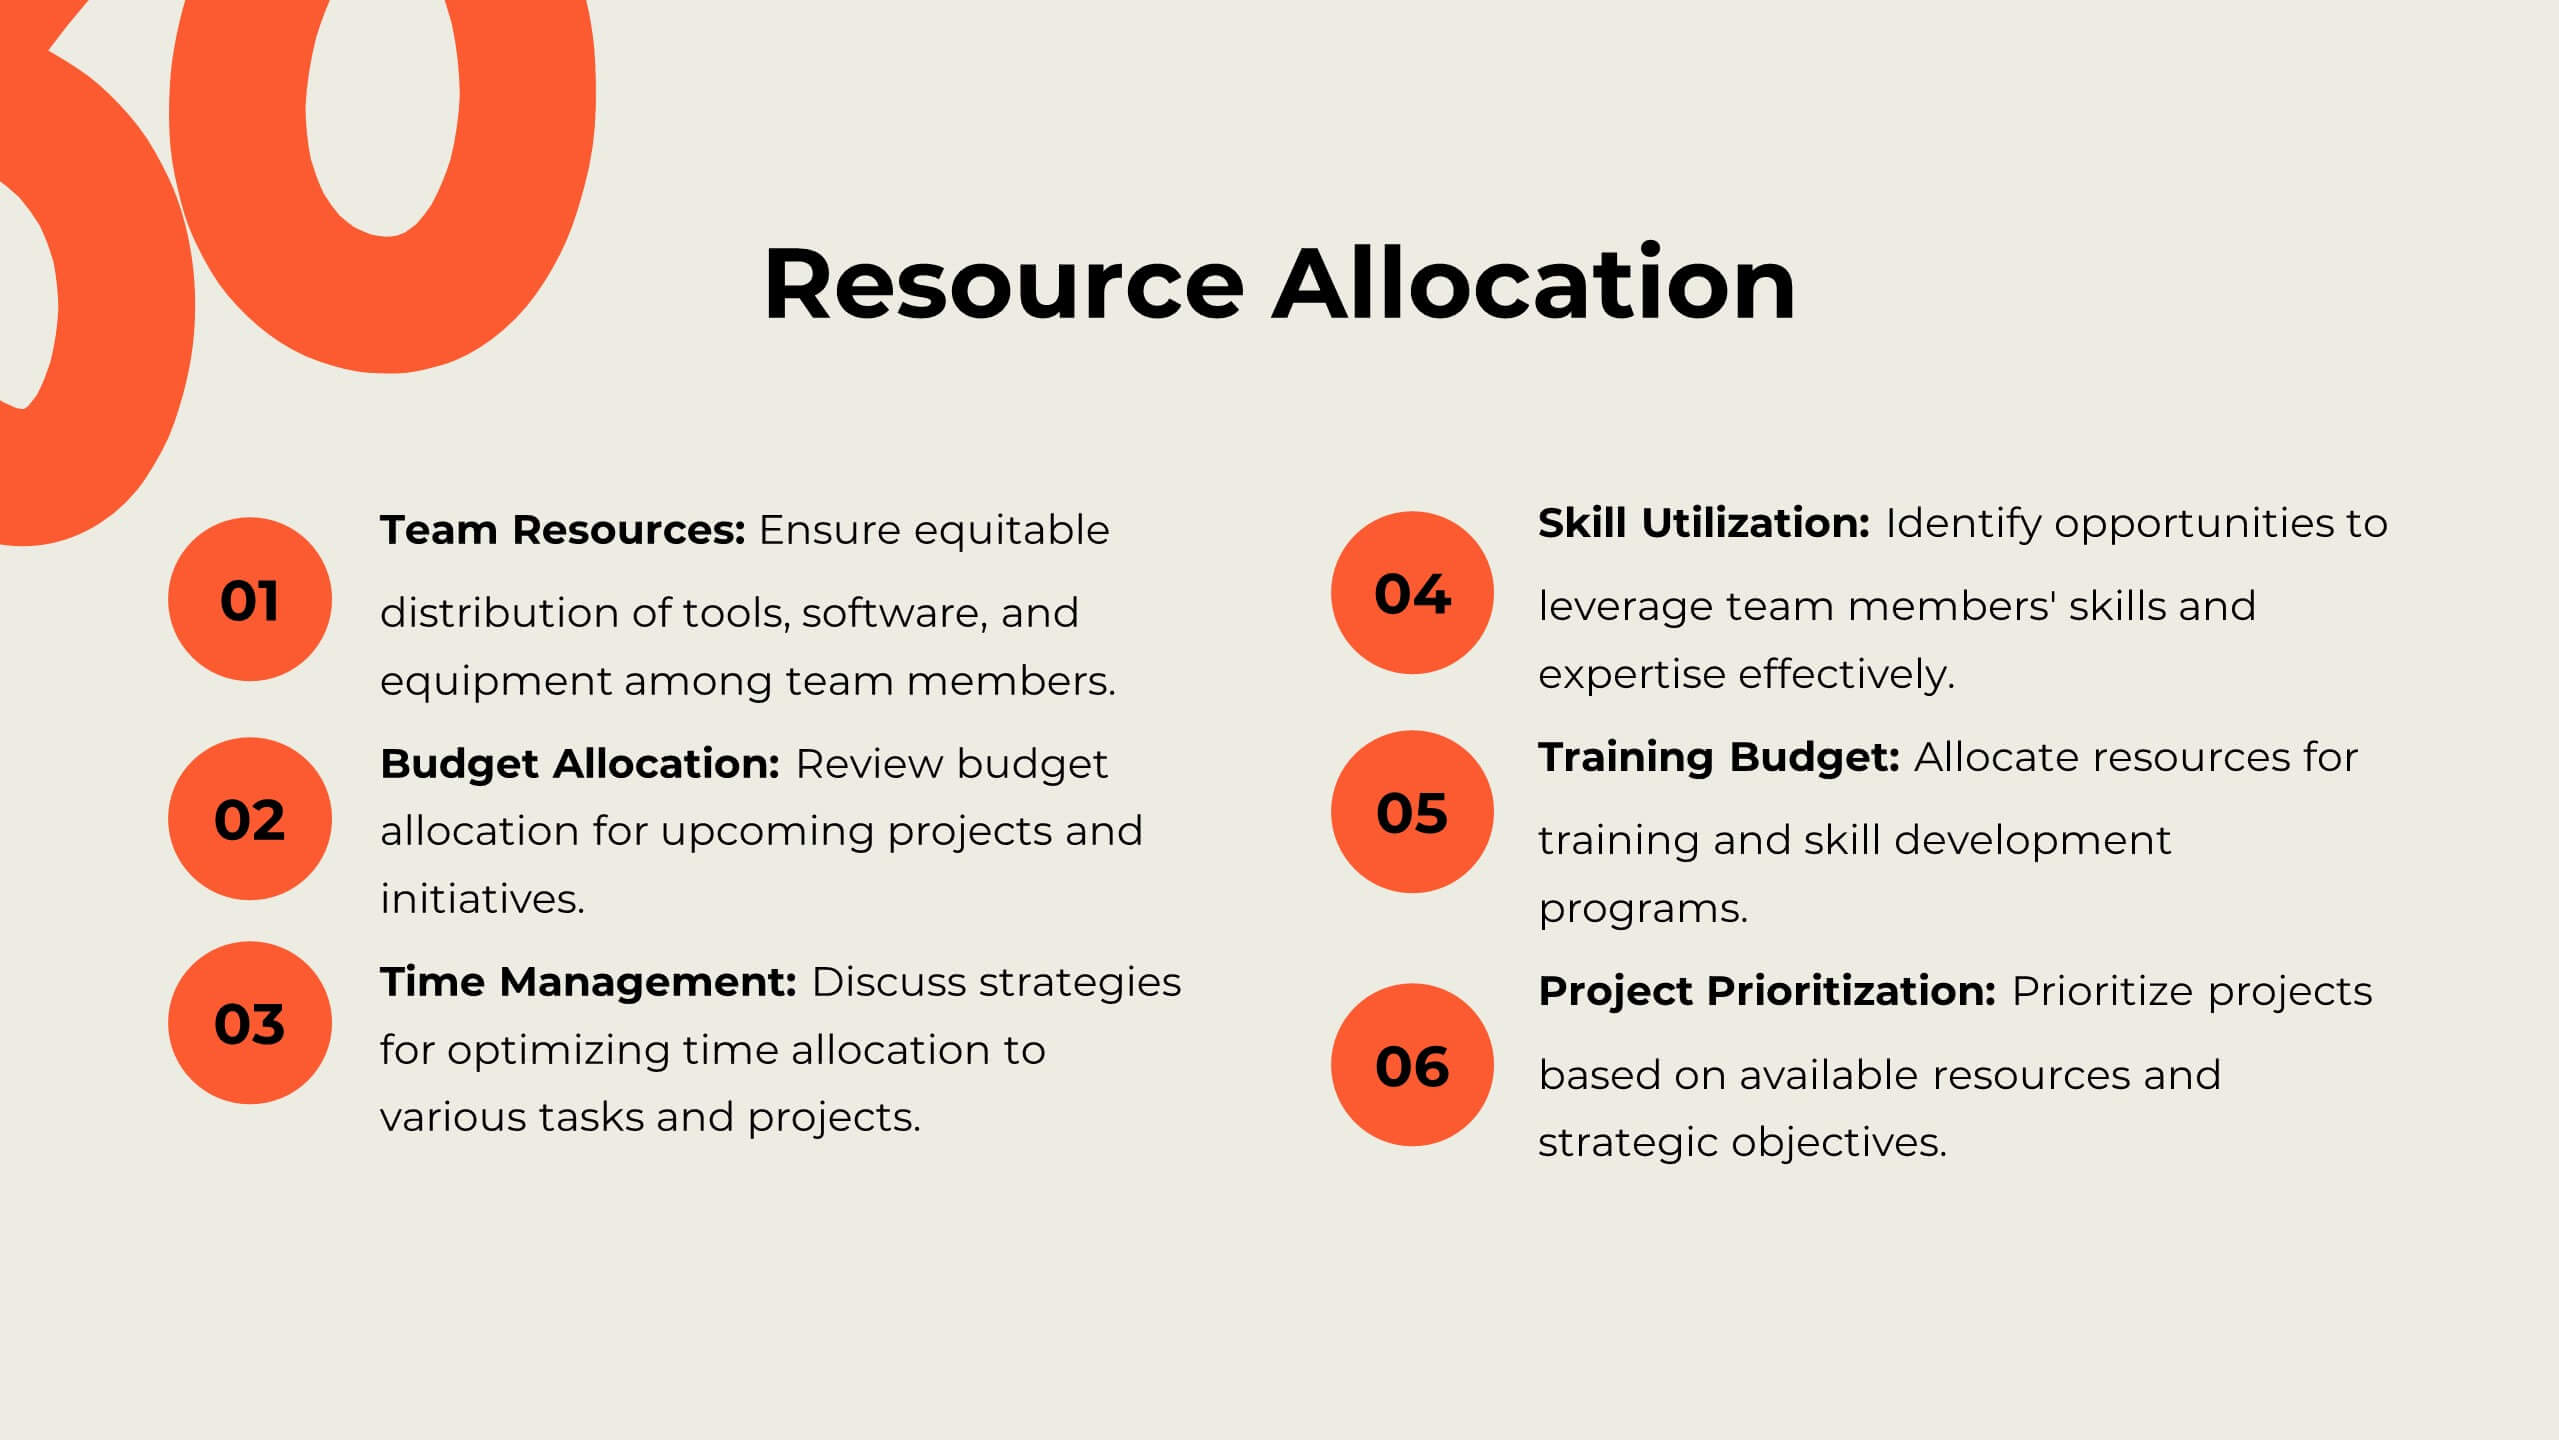
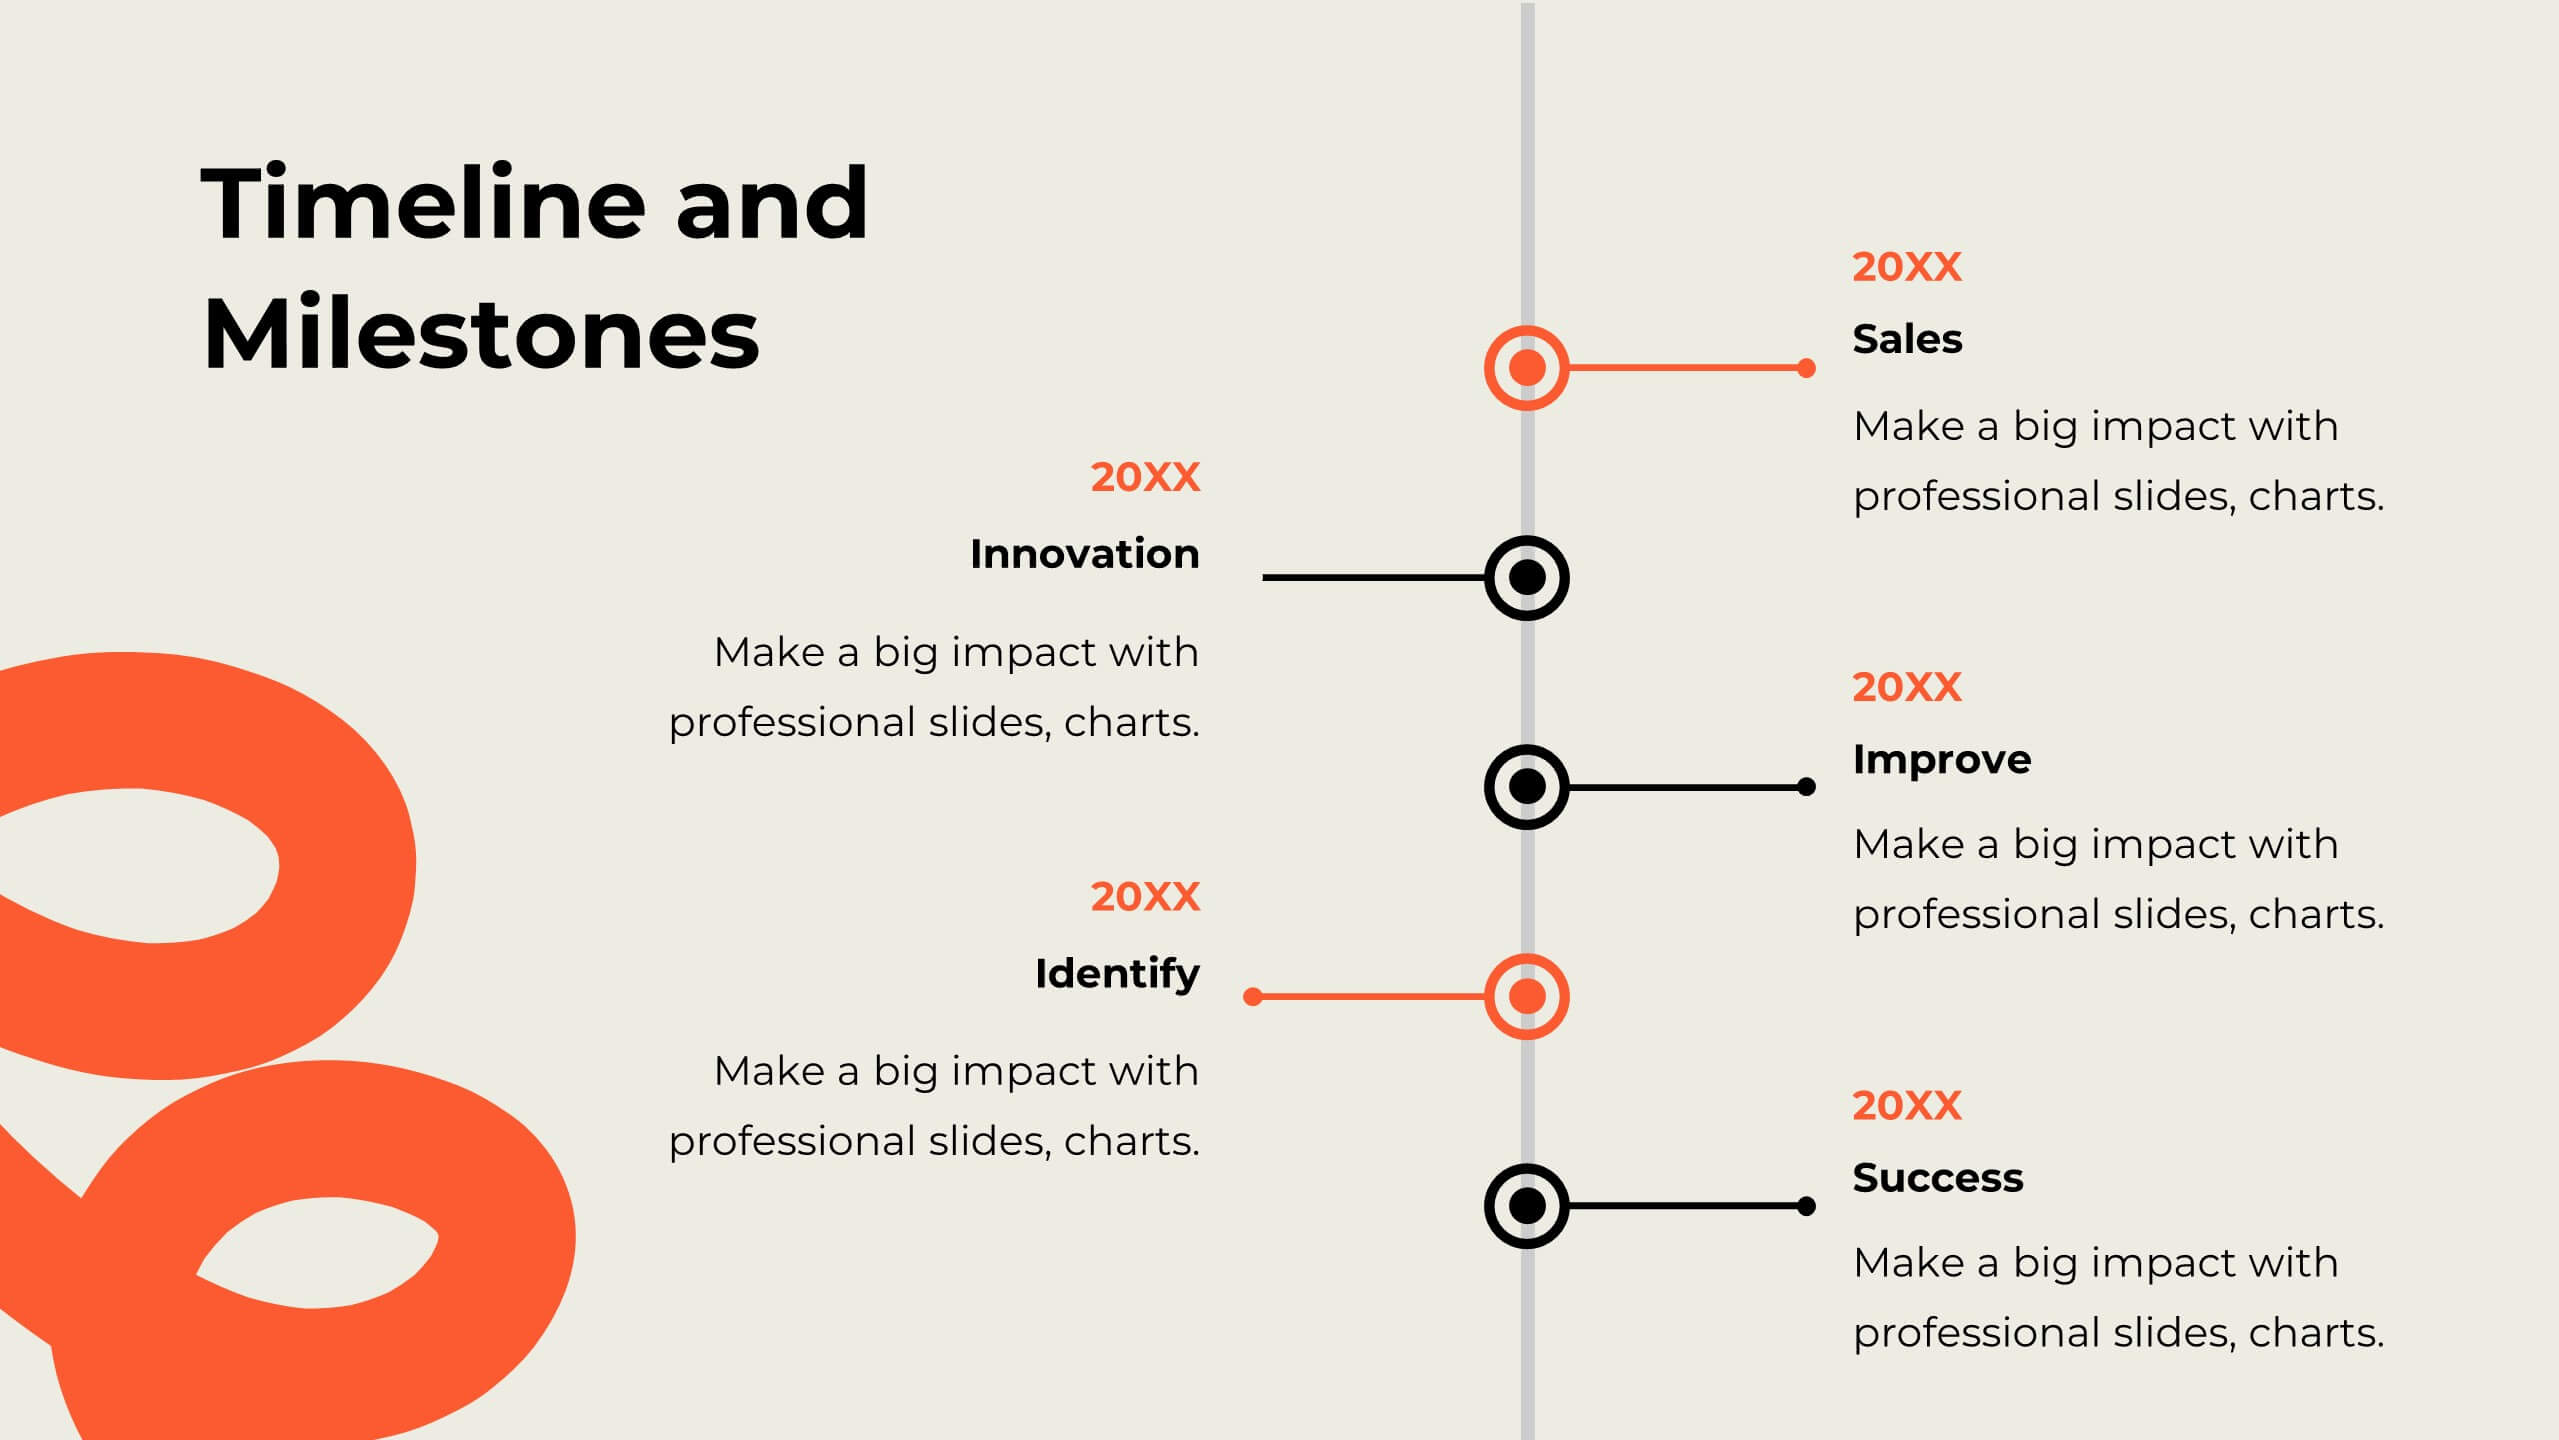
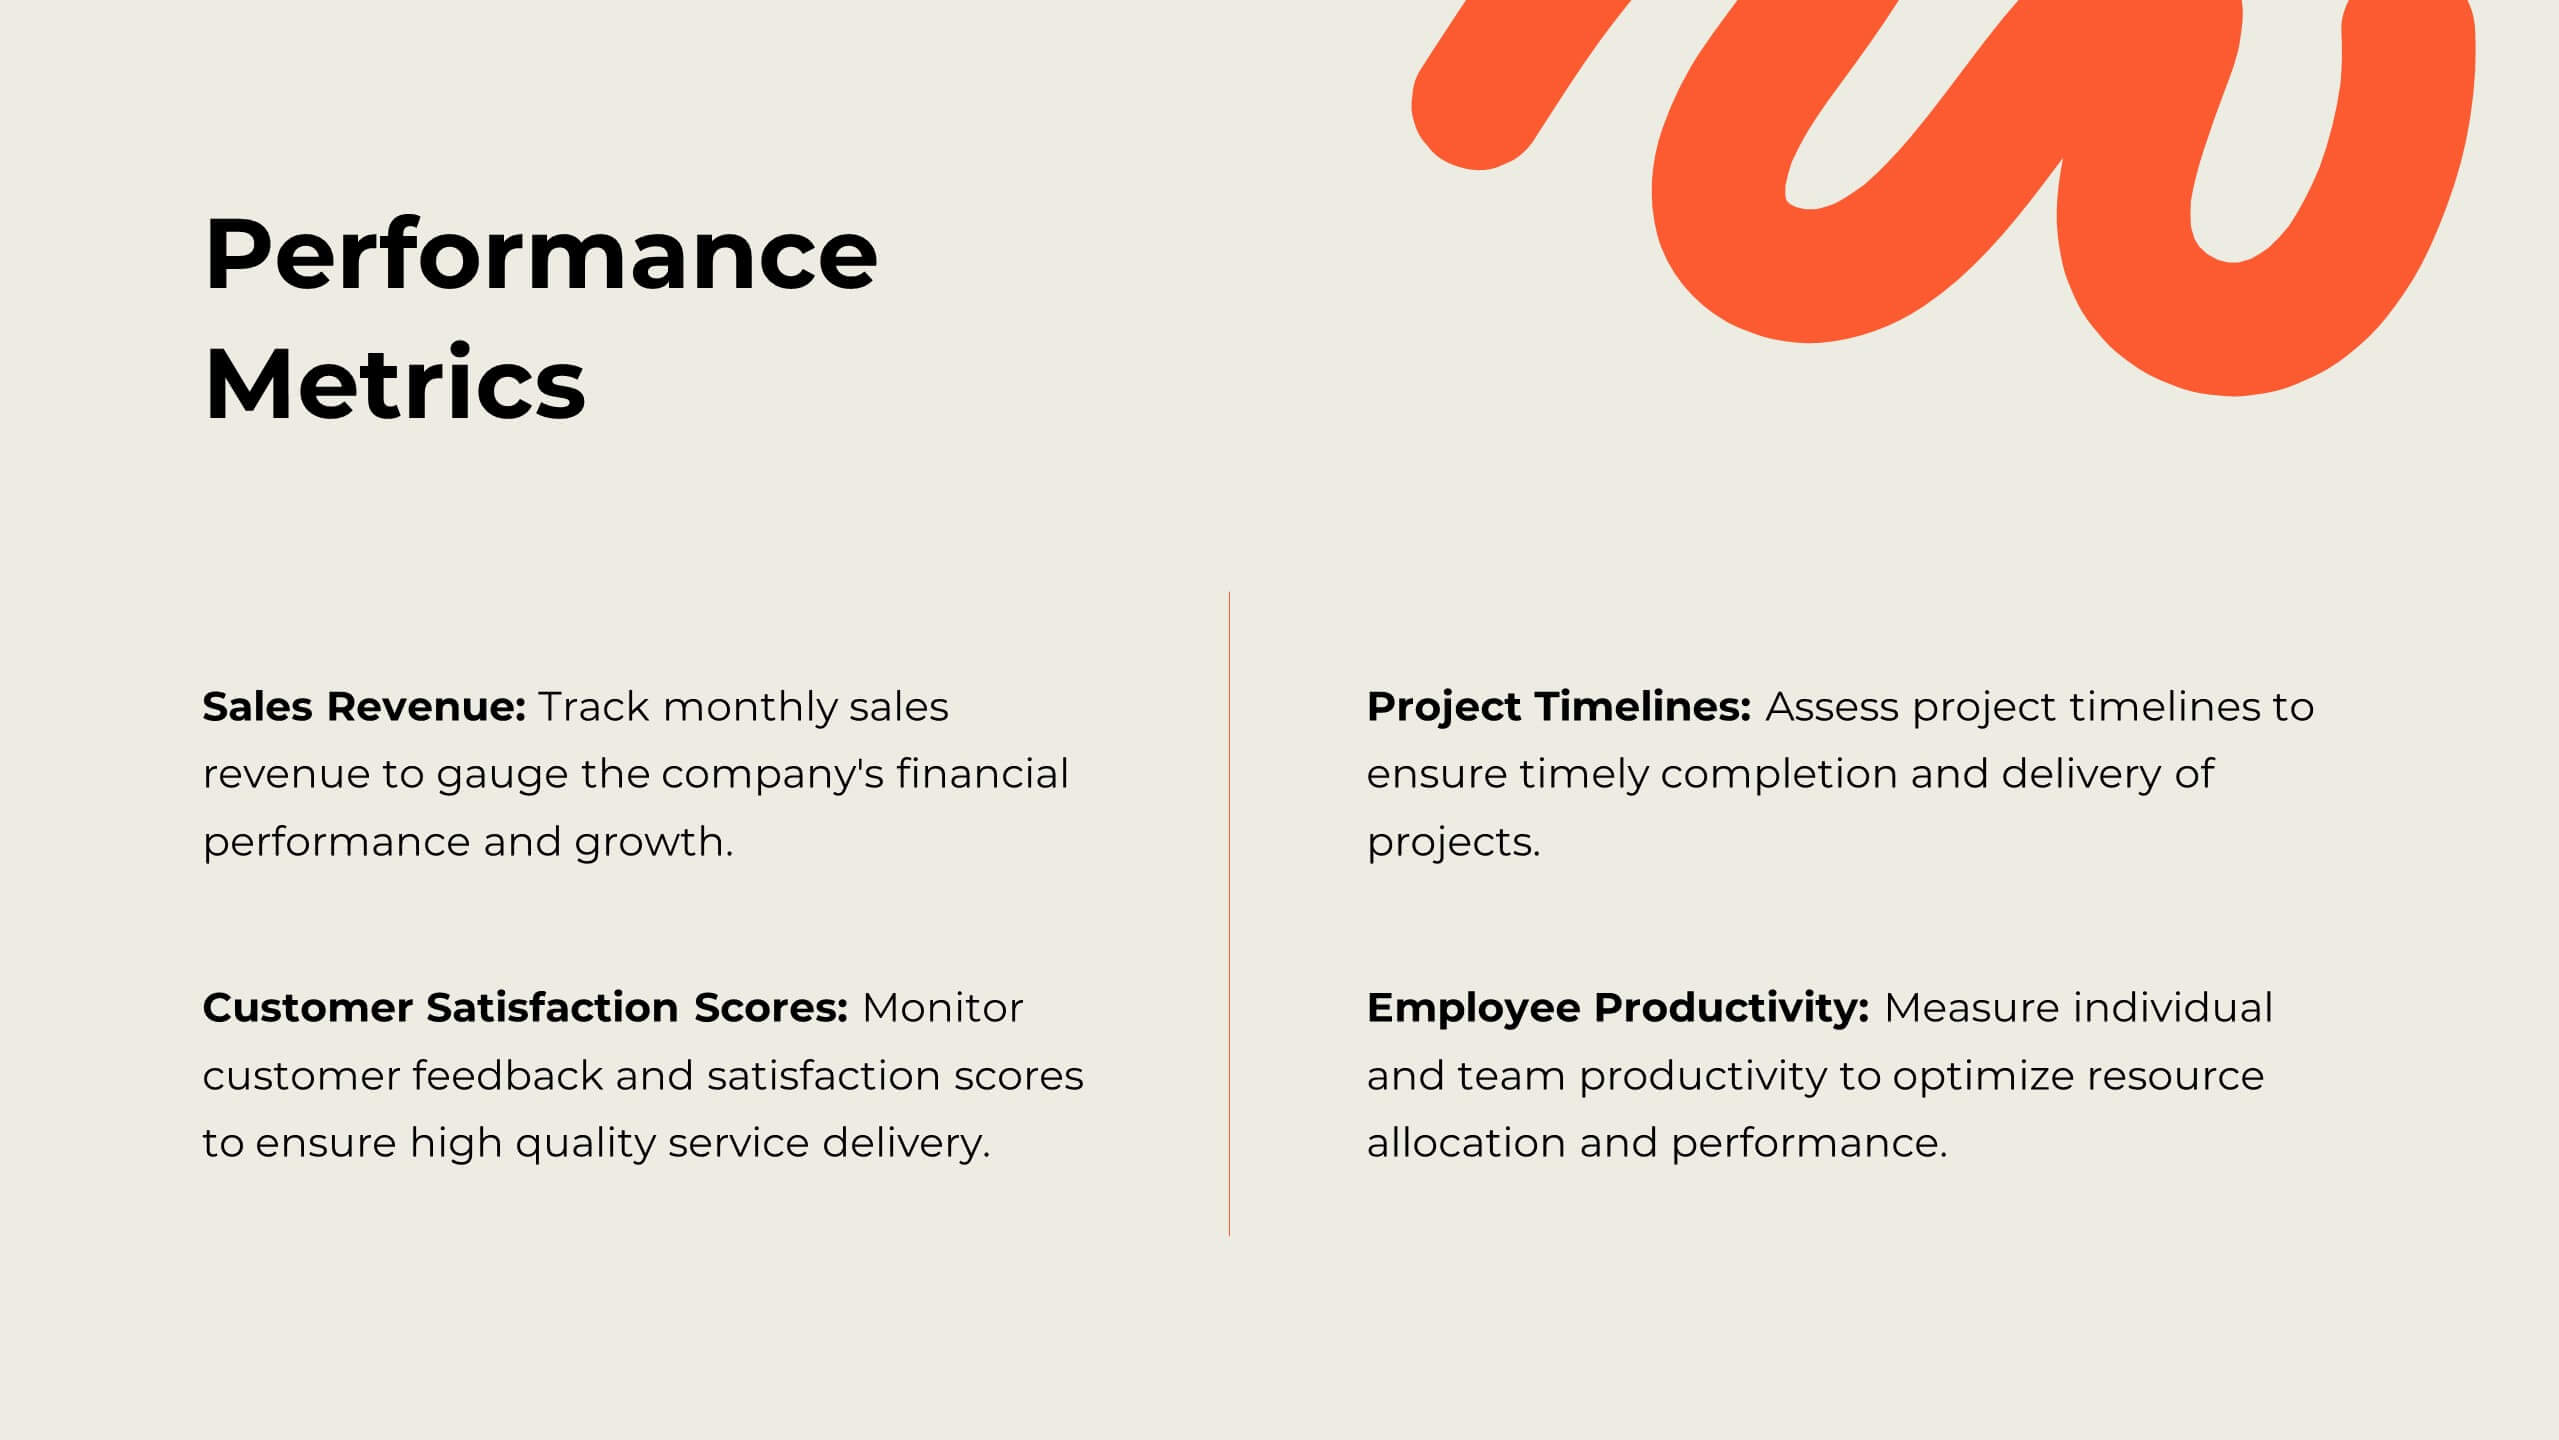
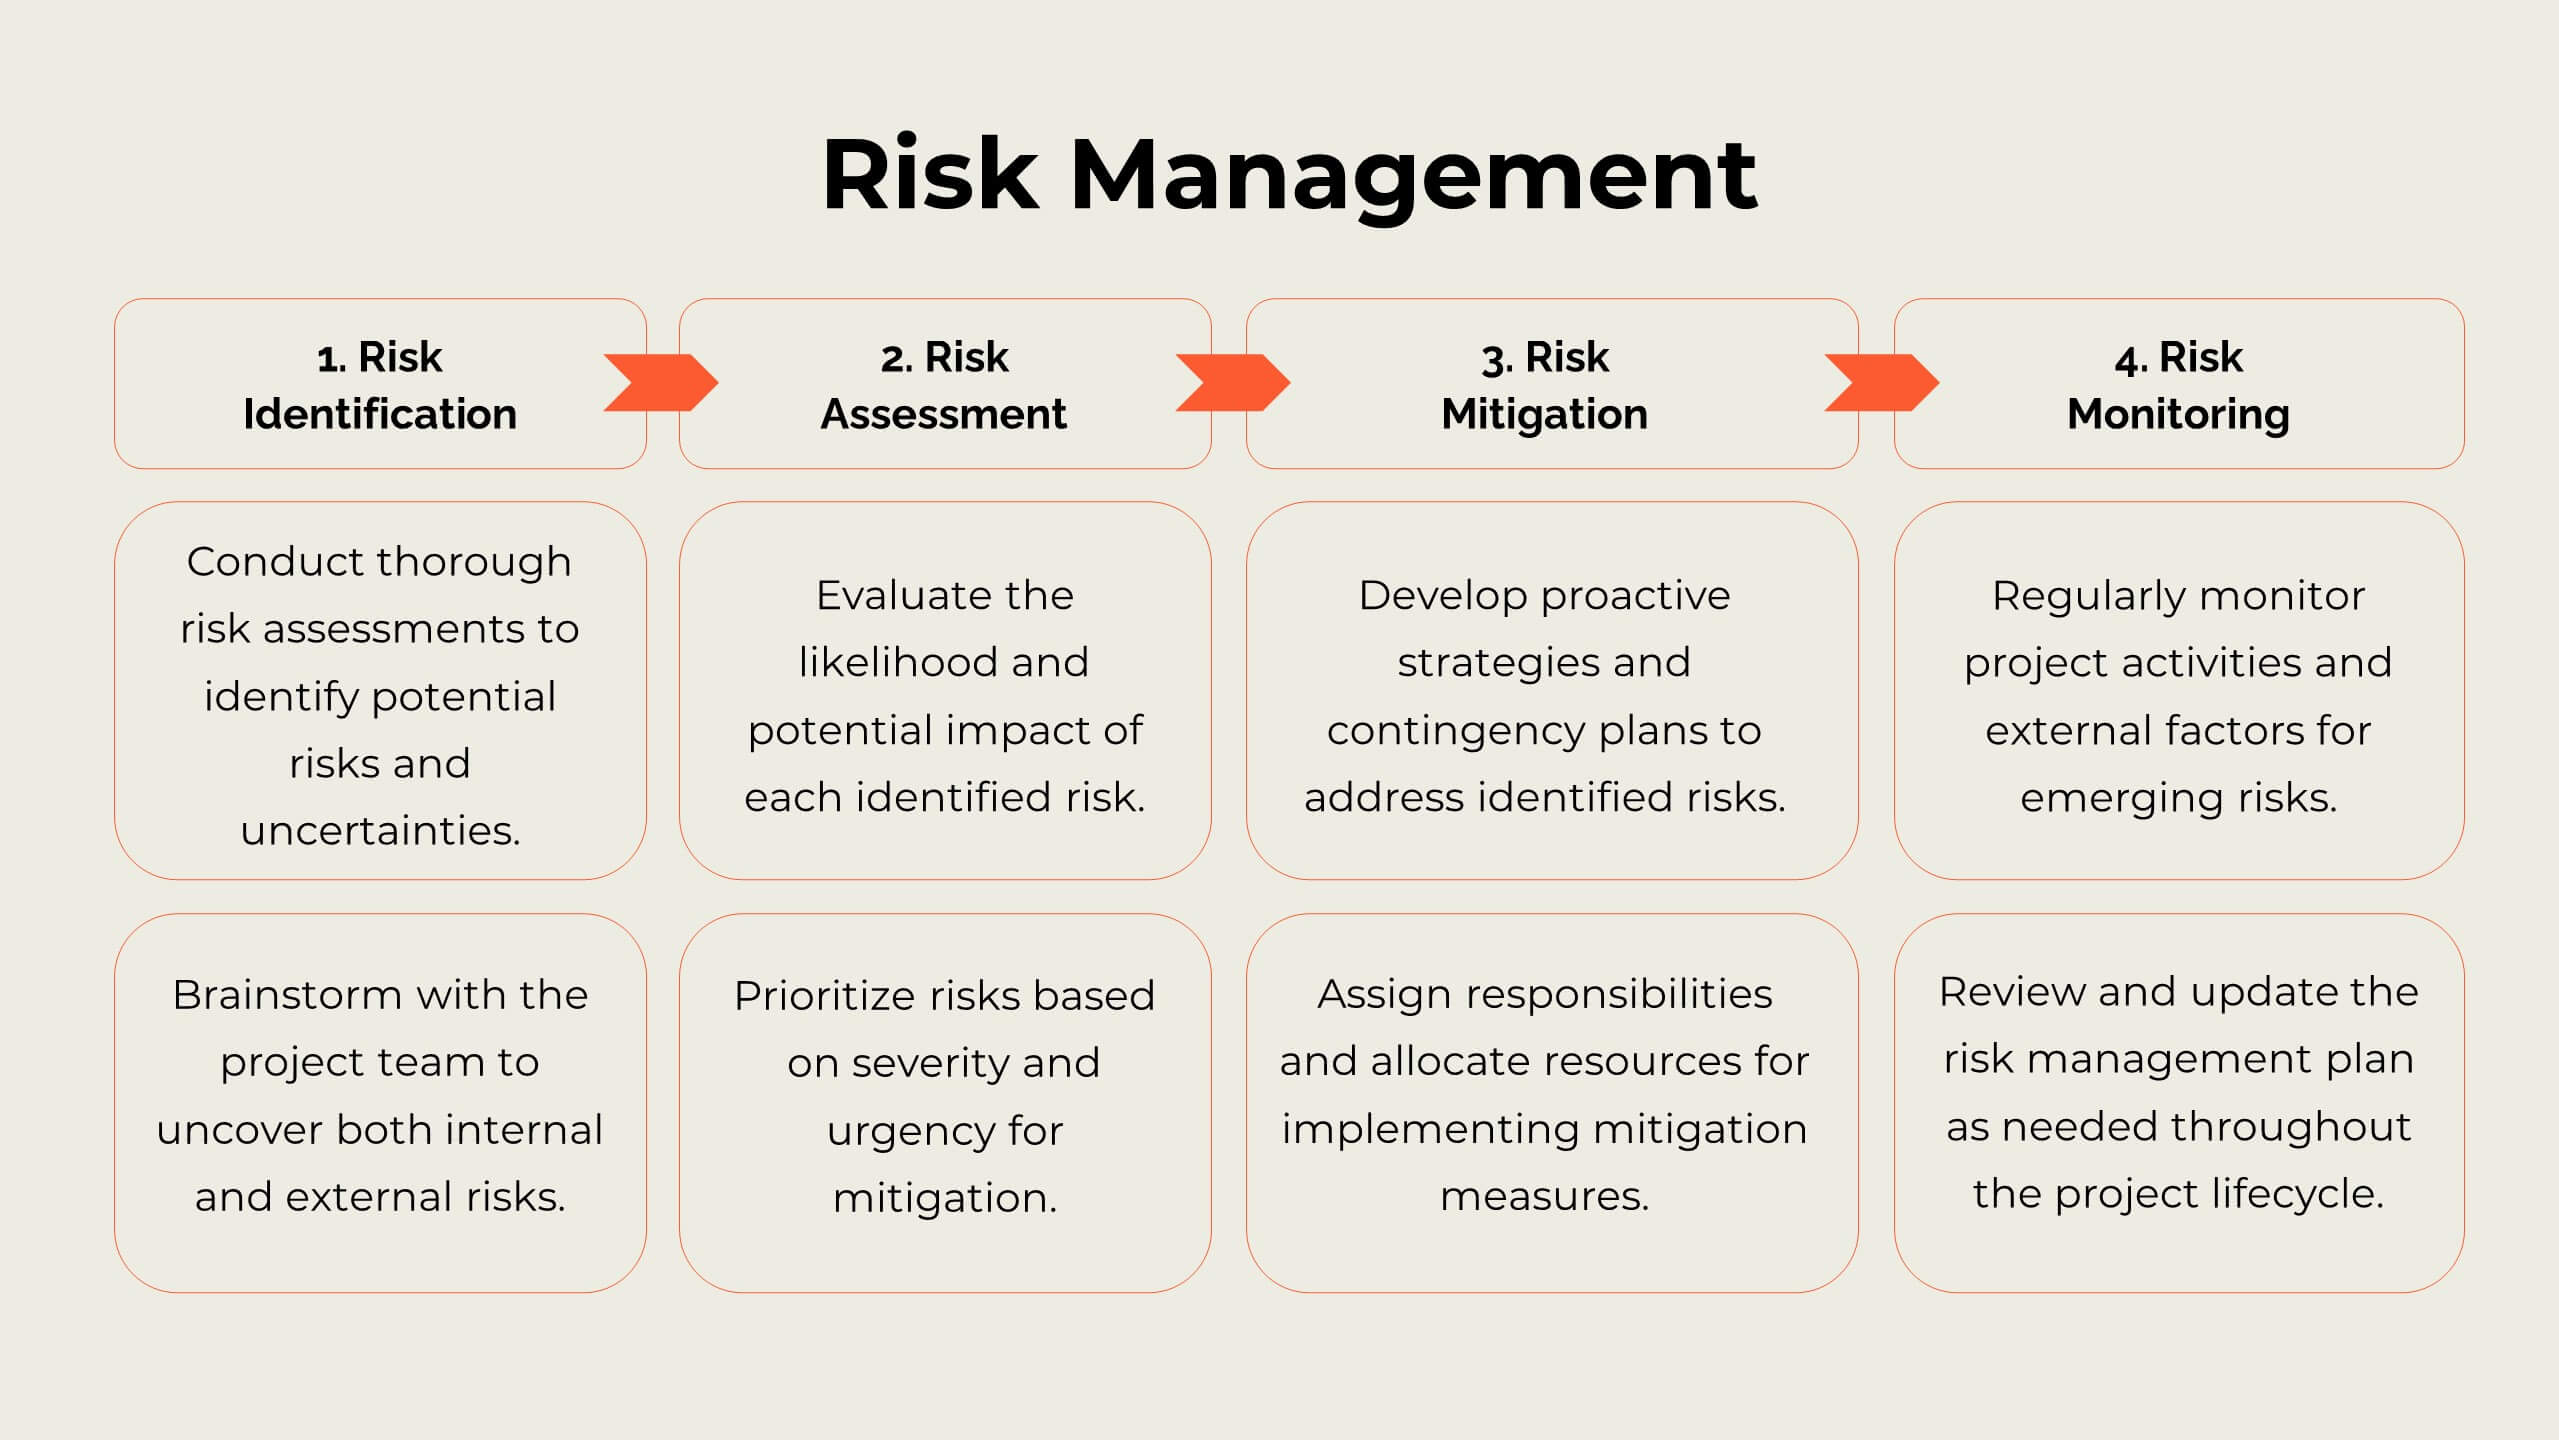
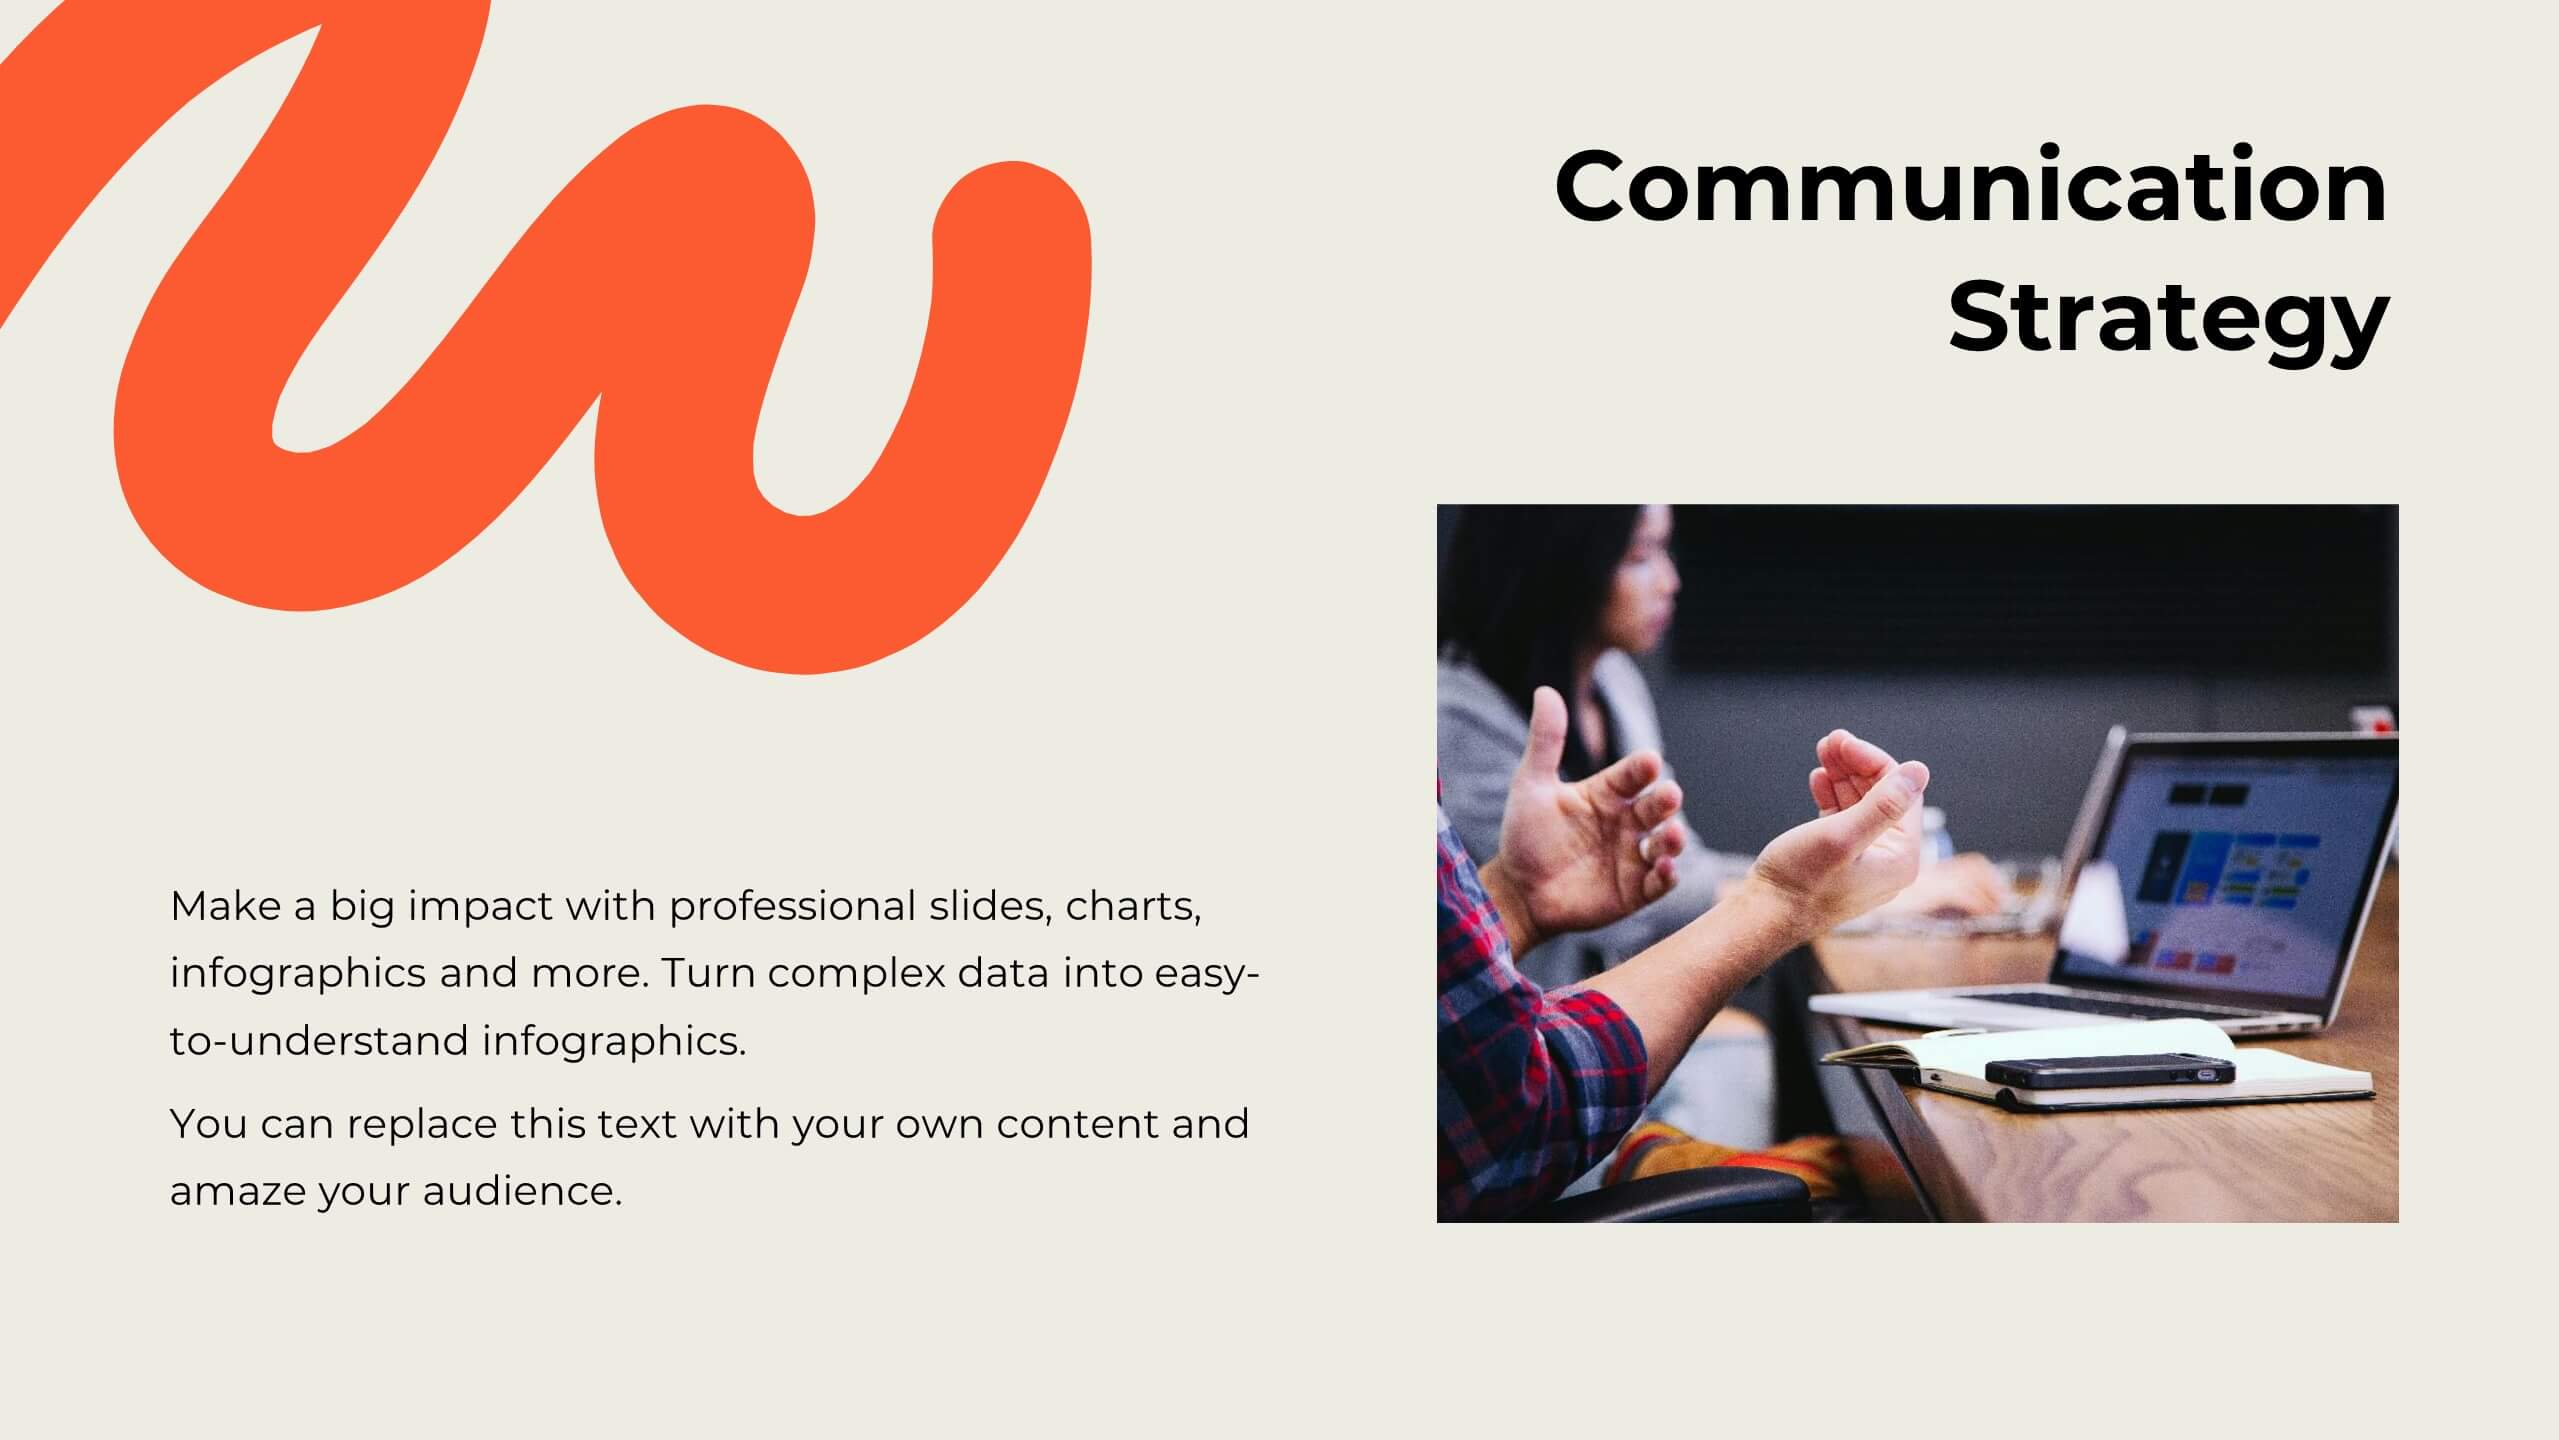
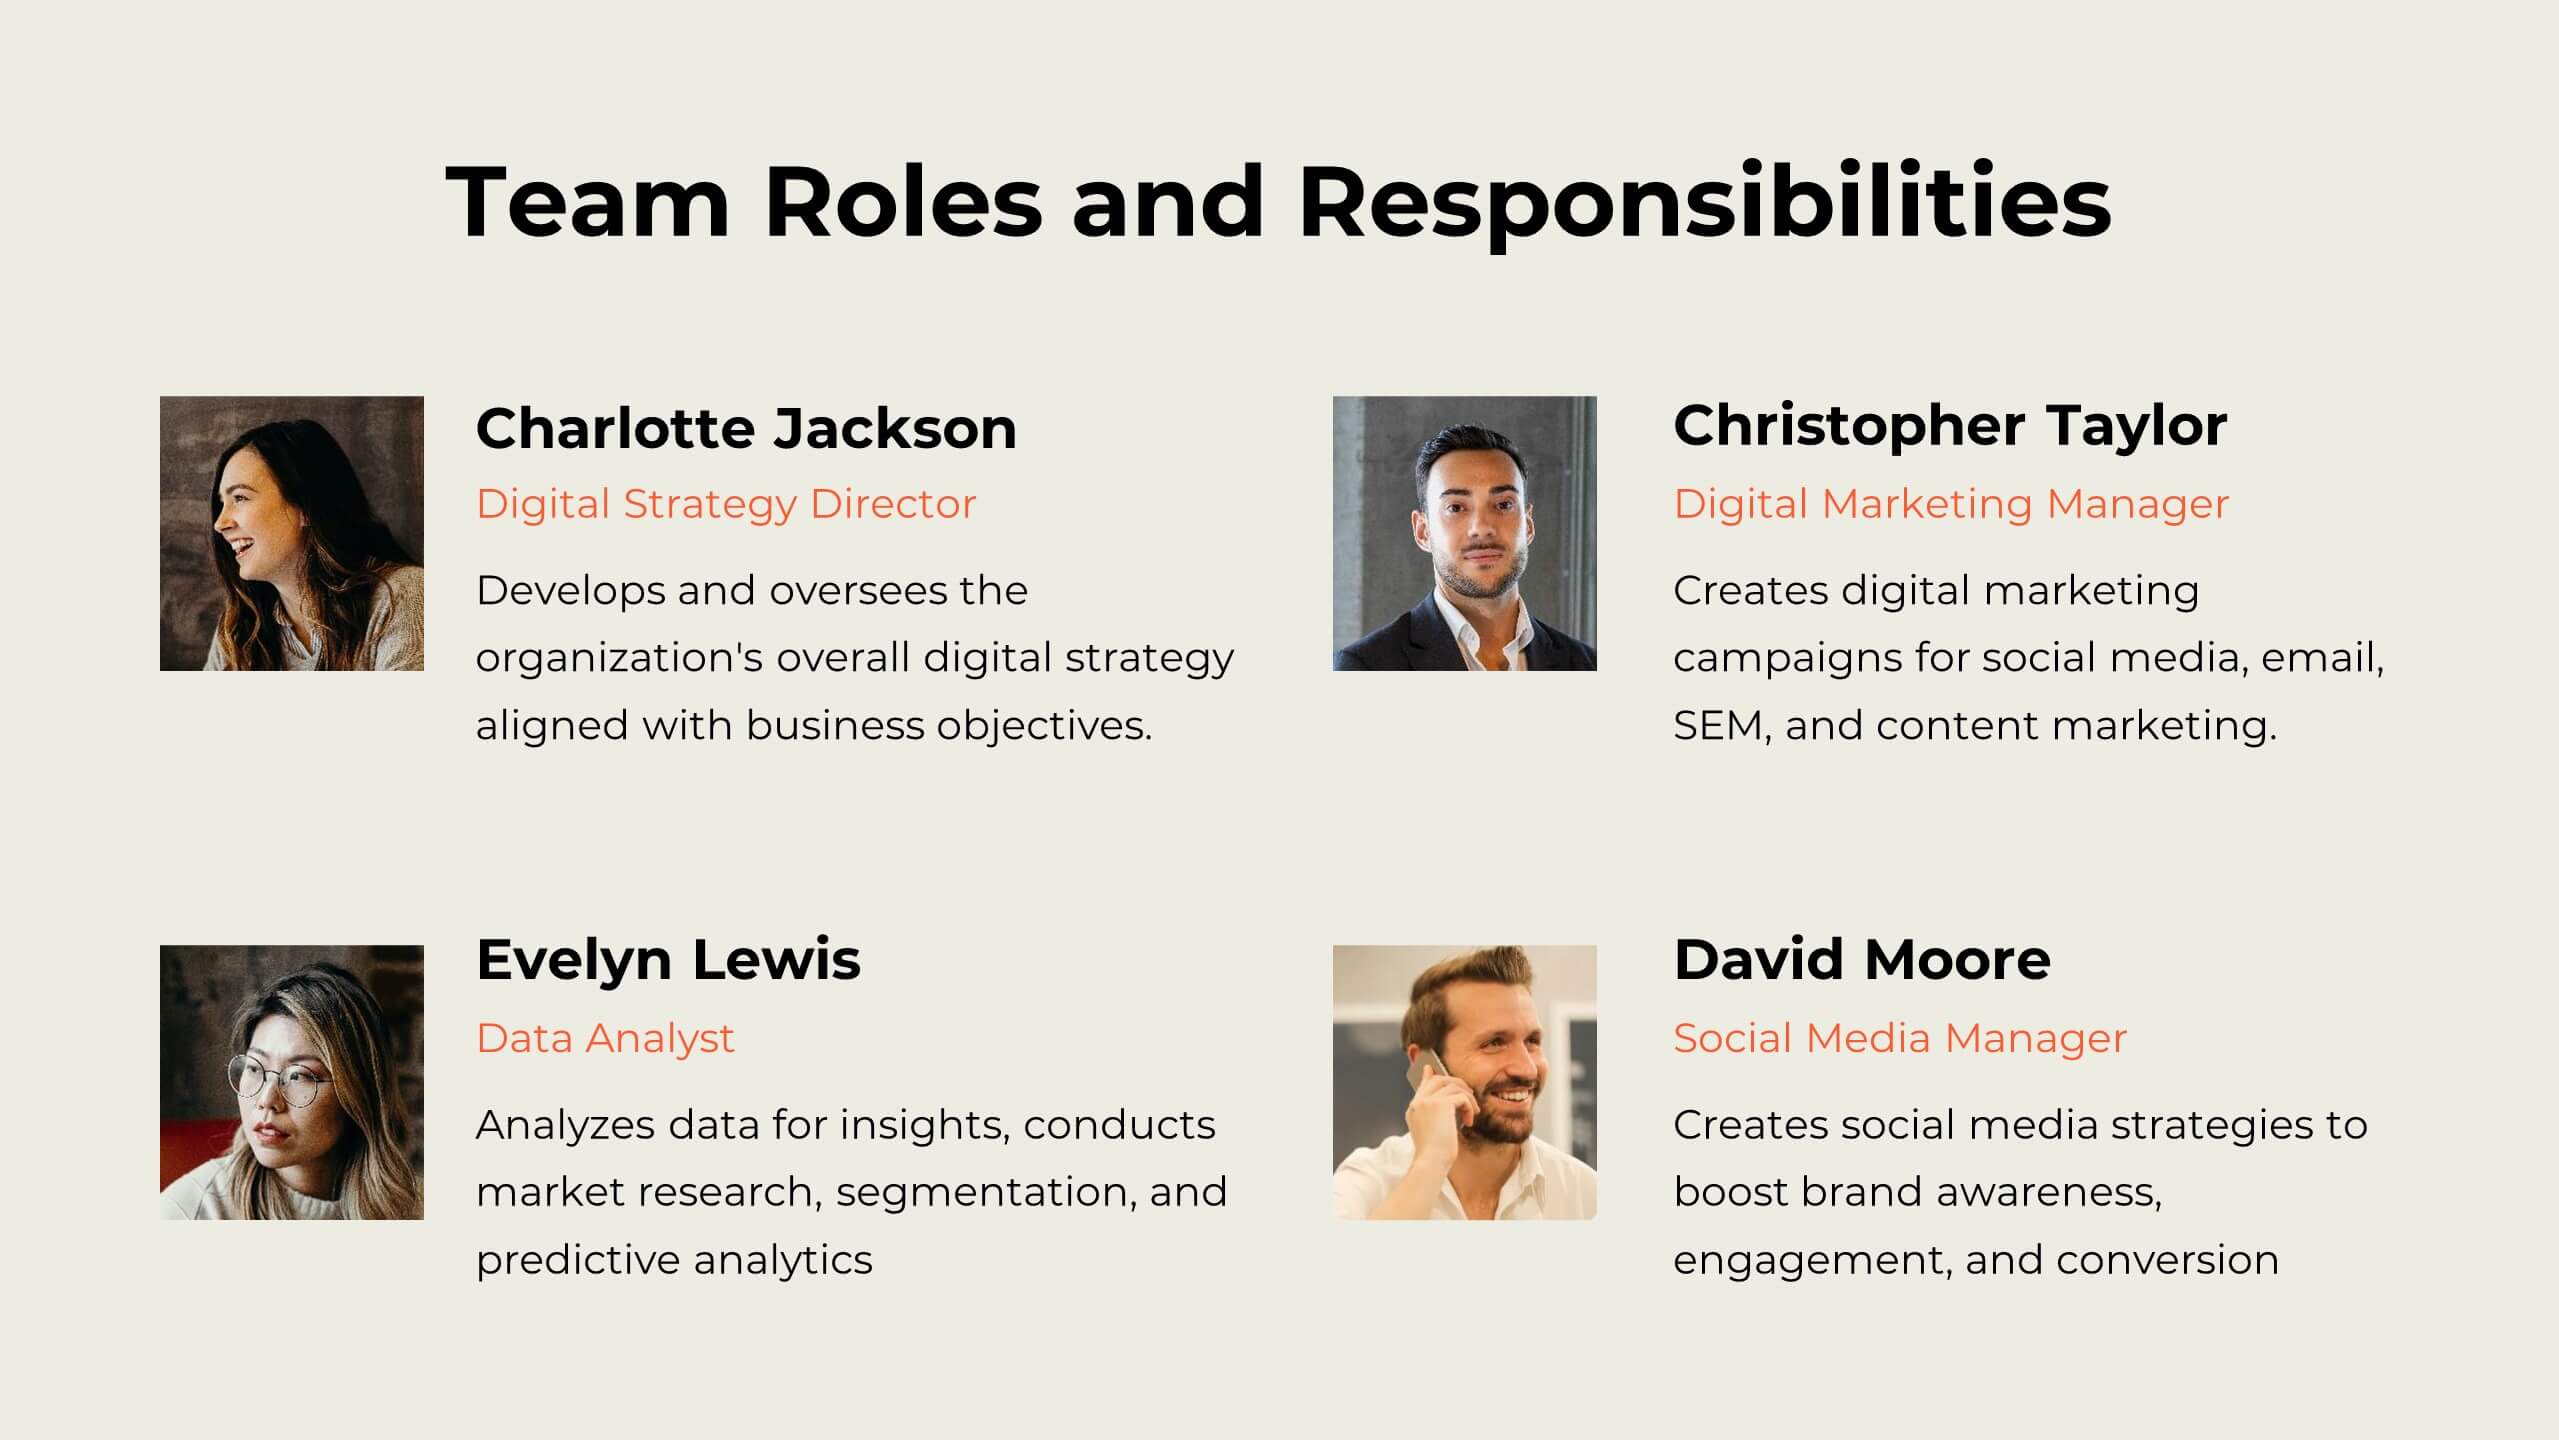
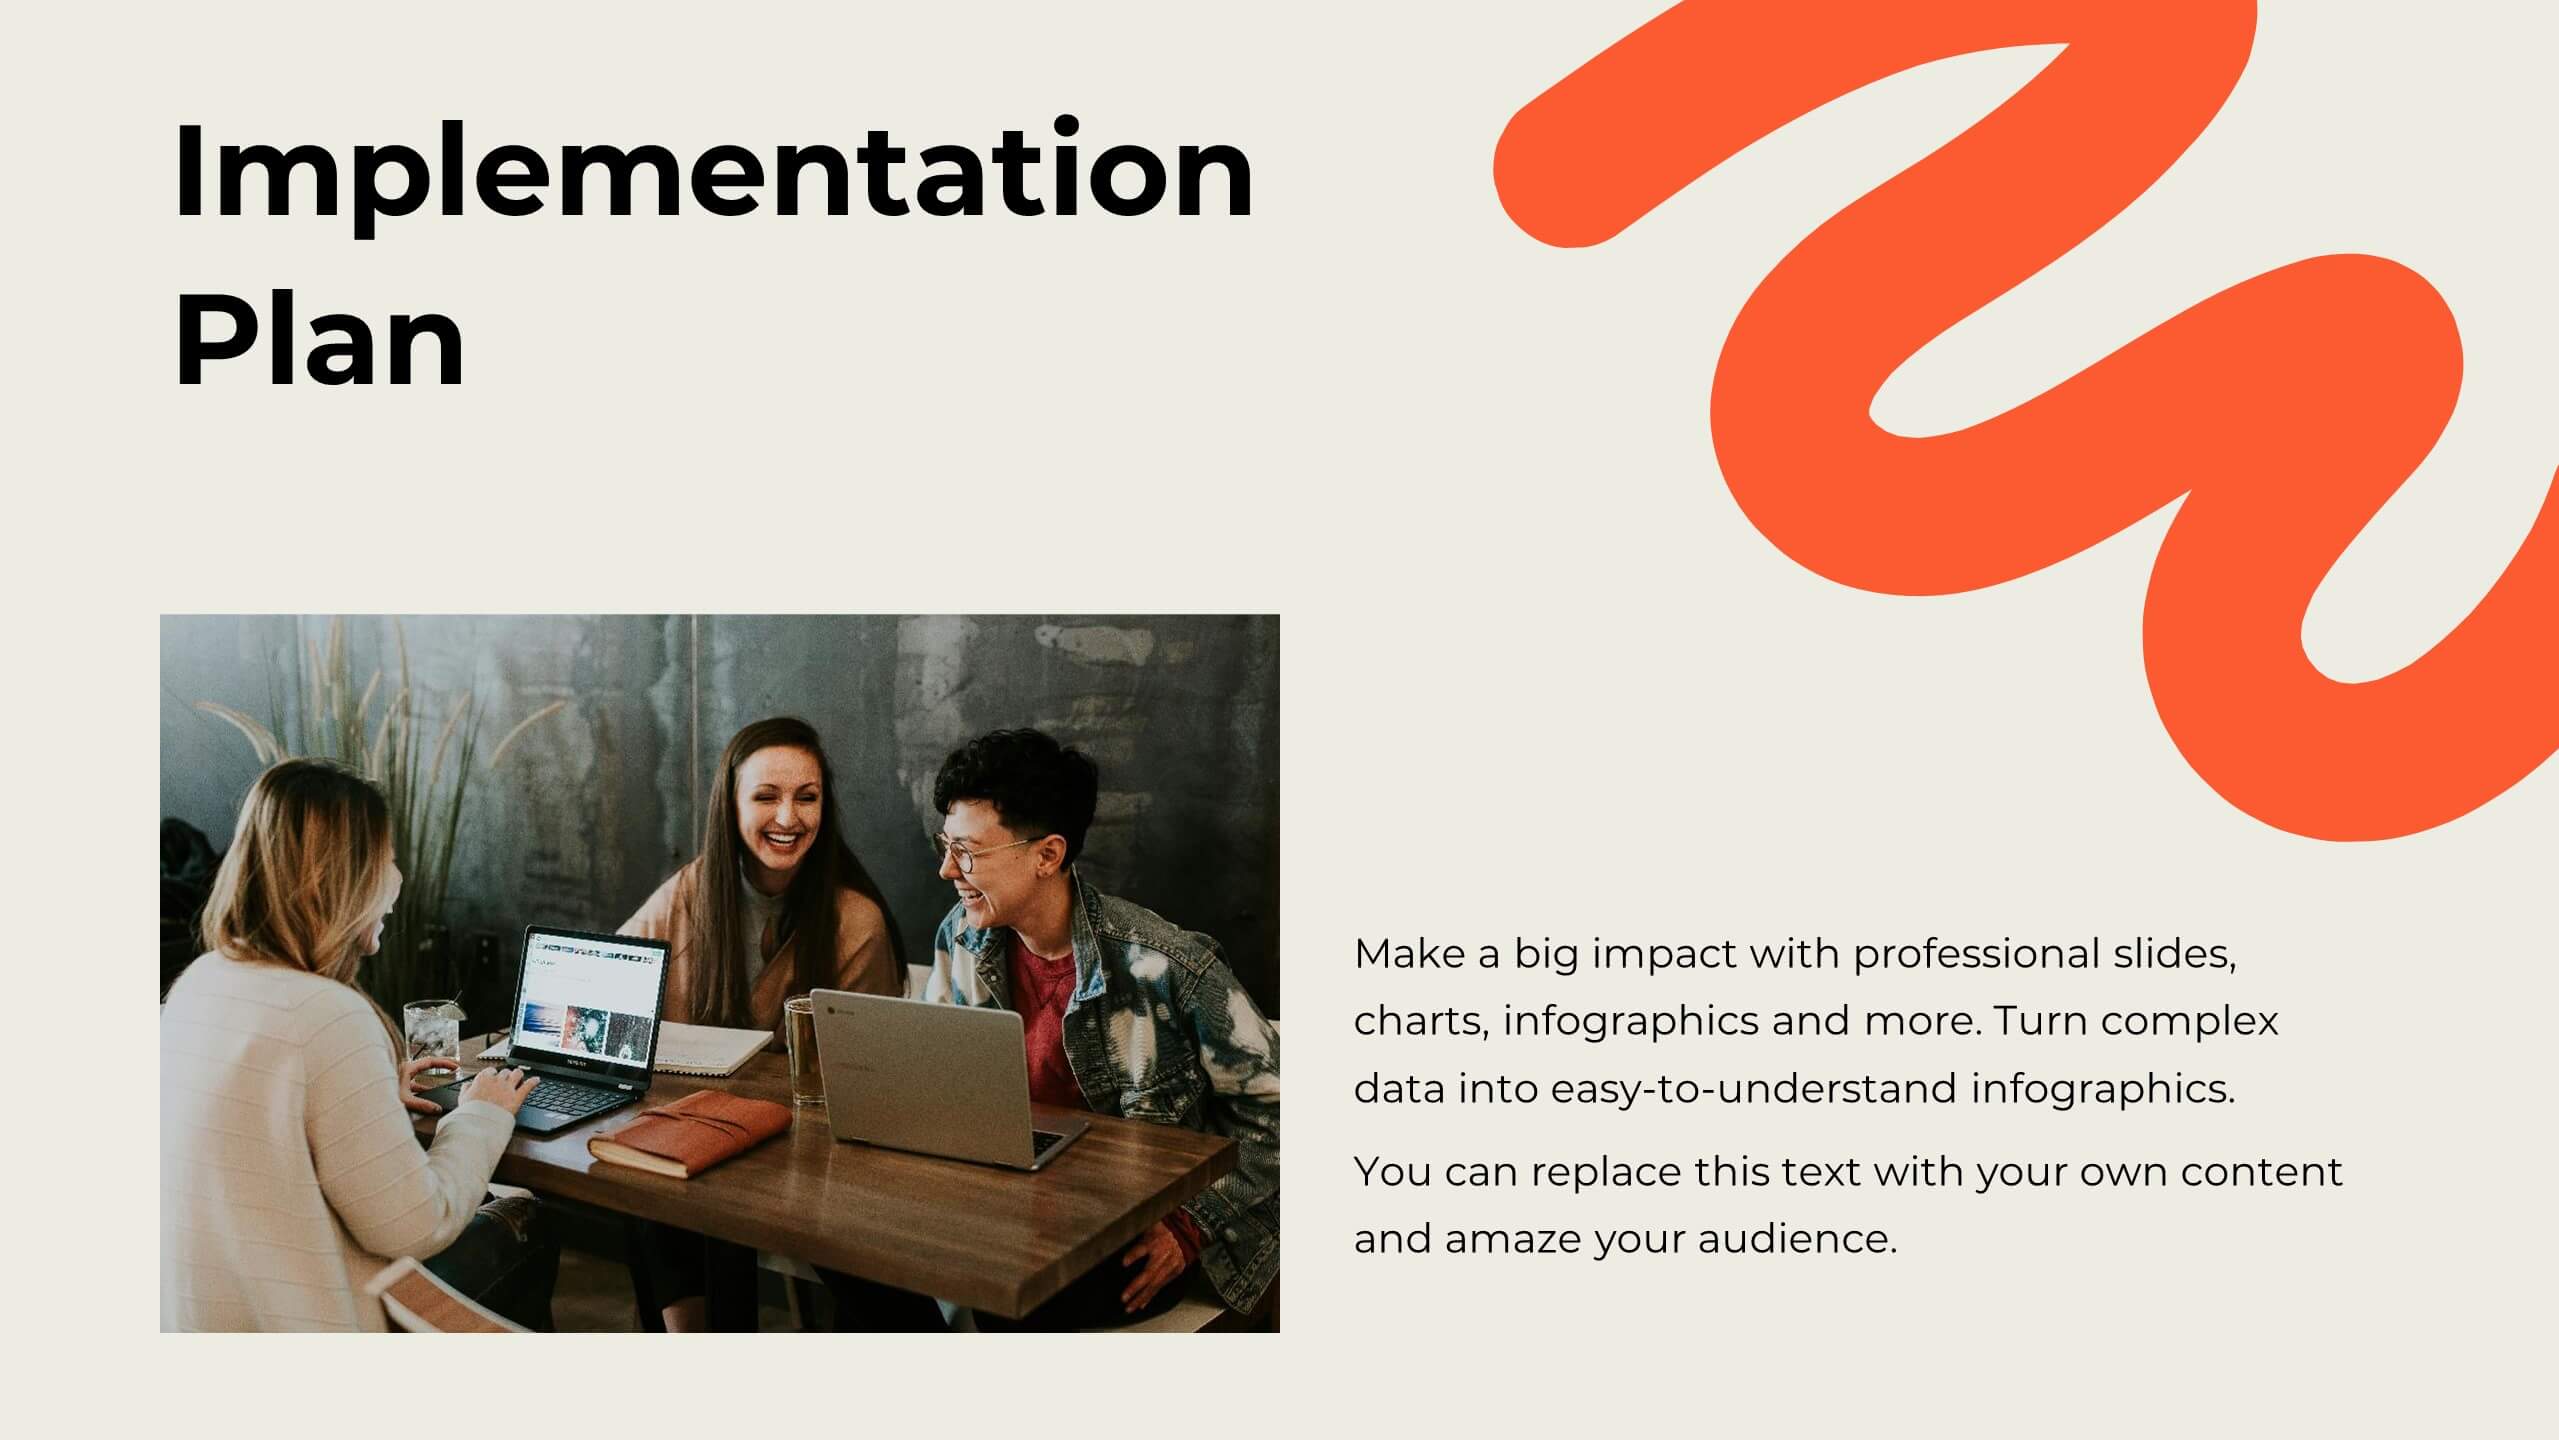
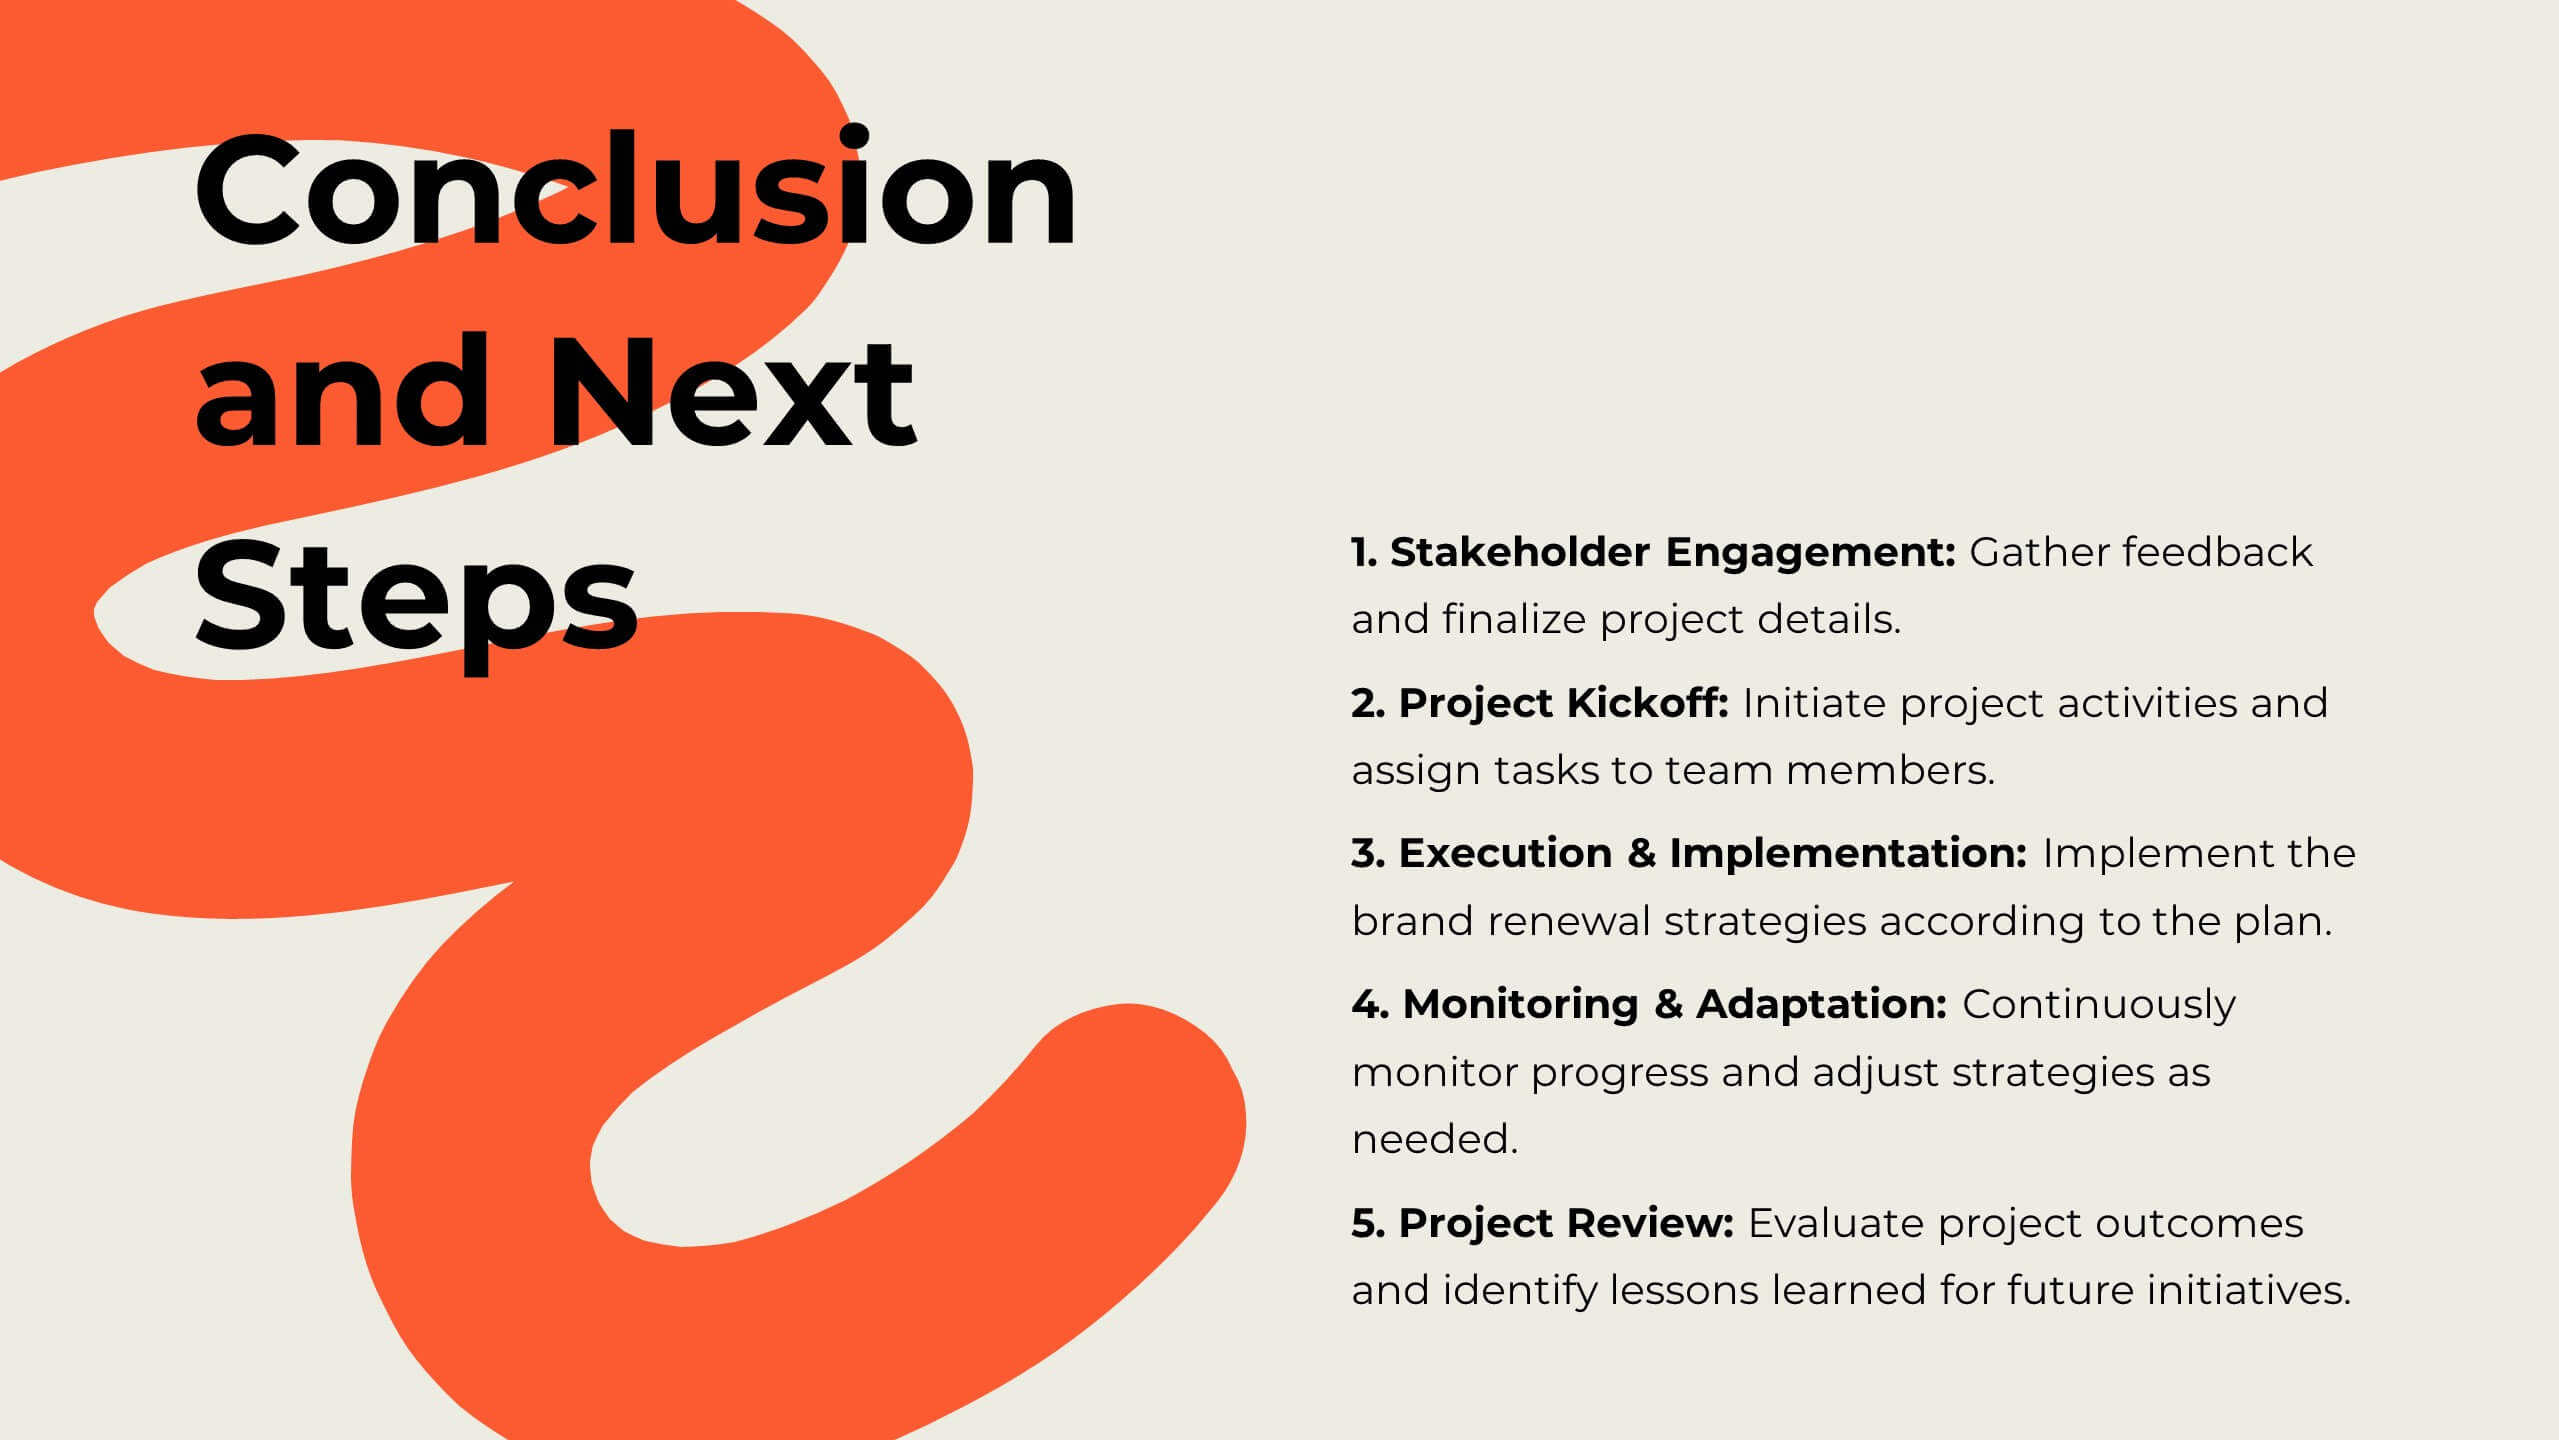
Mirage Digital Strategy Presentation
Revitalize your marketing efforts with this dynamic strategy plan template! Perfect for outlining objectives, competitive analysis, and target audience identification, it includes slides for SWOT analysis, resource allocation, and implementation plans. Engage stakeholders with vibrant visuals and comprehensive content. Compatible with PowerPoint, Keynote, and Google Slides for seamless presentations on any platform.


8 diapositivas
Identifying and Addressing Business Problems Presentation
Break down challenges with clarity using this structured 4-step business problem-solving slide. Highlight each issue with its own icon, number, and explanation, making it easy to communicate obstacles and outline solutions. Ideal for team strategy meetings, leadership briefings, or client reports. Fully customizable in PowerPoint, Keynote, and Google Slides.


8 diapositivas
Startups Pitch Deck Presentation
Bring your idea to life with a bold, energetic layout designed to showcase vision, traction, and future potential. This presentation helps you communicate your business model, strategy, and key insights with clarity and confidence. Clean visuals and structured sections keep your message strong and compelling. Fully compatible with PowerPoint, Keynote, and Google Slides.


6 diapositivas
Employment Law Infographic
Employment law, also known as labor law, is a legal framework that governs the rights, responsibilities, and relationships between employers and employees in the workplace. This infographic template can be an effective way to convey key information about various aspects of employment law in a visually engaging manner. This template allows you to illustrate the importance of workplace safety regulations and the employer's responsibility to provide a safe working environment. The goal of this infographic is to educate and inform your audience about important aspects of employment law while maintaining a visually engaging and easily digestible format.


12 diapositivas
Breast Cancer Awareness Day Presentation
The Breast Cancer Awareness Day presentation template is an essential tool for health awareness campaigns. With distinctive pink icons symbolizing support and education, this template is perfect for seminars and presentations. It's fully compatible with PowerPoint, Keynote, and Google Slides, enhancing accessibility and user experience.


7 diapositivas
Project Summary Infographic
This collection of project summary slides is designed to streamline the presentation of project outcomes and statuses effectively. The slides feature a variety of layouts tailored to emphasize critical data and conclusions, making them an ideal choice for project managers and teams who need to report on progress and results. Each slide is crafted with a clear focus on visual hierarchy, which helps in directing the viewer's attention to the most important information. Use of bullet points, charts, and infographics enhances the viewer's understanding by breaking down complex data into easy-to-digest visuals. Color coding is effectively utilized to differentiate between themes or topics, which aids in quick comprehension. These slides are versatile enough to be used in various scenarios, such as end-of-project presentations, stakeholder updates, or team meetings. They provide a professional and polished way to showcase project achievements, timelines, and future steps. Overall, these summary slides are a valuable tool for anyone looking to present project information clearly and concisely, ensuring that key points are communicated effectively and are memorable.


4 diapositivas
Business Strategy Alternatives Presentation
Present and compare strategic choices effectively with the Business Strategy Alternatives Presentation template. Designed to highlight key decision points, competitive advantages, and alternative approaches, this slide is ideal for business strategy discussions, market positioning, and executive planning. Fully customizable for PowerPoint, Keynote, and Google Slides to fit your presentation needs.


6 diapositivas
Staff Integration and Onboarding Journey Presentation
Streamline your onboarding process with the Staff Integration and Onboarding Journey Presentation. This clean, step-by-step layout uses human icons to represent each phase of a new hire's journey—from orientation to full integration. Ideal for HR professionals, it’s fully editable in Canva, PowerPoint, Keynote, or Google Slides for easy customization.


5 diapositivas
Regional Development in Oceania Map Presentation
The Regional Development in Oceania Map template provides a comprehensive visualization of growth and development metrics across various regions in Oceania. This template is designed to aid in presenting demographic data, economic indicators, or development status in a clear, easily understandable format. It's suitable for reports, presentations, and educational materials. Compatible with PowerPoint, Keynote, and Google Slides.


5 diapositivas
Product and Service Benefits Slide
Highlight your value offerings with this clean, 4-column benefits layout. Each box provides space for an icon, title, and concise description—ideal for comparing features, services, or product advantages. Fully editable in PowerPoint, Keynote, and Google Slides to match your brand style.


6 diapositivas
Academic Science Infographic Presentation
Bring your scientific insights to life with a clean, engaging slide that turns complex concepts into an easy-to-follow visual story. This presentation highlights key academic data through connected icons and structured text, helping you explain research findings clearly and confidently. Fully compatible with PowerPoint, Keynote, and Google Slides.


4 diapositivas
Organizational Hierarchy Diagram Presentation
Clearly map out your company’s structure with this modern organizational hierarchy slide. Designed for clarity, it displays multiple team roles and reporting lines using intuitive icons and connector lines. Ideal for onboarding, strategy, or HR decks. Fully customizable in Canva, PowerPoint, or Google Slides for seamless integration into any presentation.


5 diapositivas
Visual Mind Connections Bubble Chart Presentation
Visualize interconnected concepts with clarity using the Visual Mind Connections Bubble Chart Presentation. This engaging layout centers around a core idea, surrounded by supporting points in a clean, circular flow. Ideal for mapping strategies, team roles, or processes. Fully editable in PowerPoint, Keynote, or Google Slides—perfect for business, education, or coaching.


7 diapositivas
Medical Center Infographic
A medical center, often referred to as a healthcare center, is a facility or establishment where a range of medical services and care are provided to individuals in need of medical attention. This infographic template is designed to provide a comprehensive overview of the medical center, emphasizing its services, healthcare professionals, facilities, patient satisfaction, and community engagement. This infographic is fully customizable and compatible with Powerpoint, Keynote, and Google Slides. Easily customize and design this to align with your specific medical center's brand and message.


4 diapositivas
Innovation with Design Thinking Framework Presentation
Drive innovation with the Design Thinking Framework presentation. This visually engaging layout structures ideas, processes, and solutions into a clear and adaptable design. Perfect for brainstorming sessions, business strategy meetings, and creative problem-solving. Fully customizable and compatible with PowerPoint, Keynote, and Google Slides for a seamless workflow.


10 diapositivas
SEO and Content Marketing Plan
Highlight your SEO and content strategy with a modern magnifying glass-themed design. This slide makes it easy to break down key phases like keyword research, content creation, optimization, and analytics. Fully customizable and compatible with PowerPoint, Keynote, and Google Slides.


7 diapositivas
Root Cause Diagram
Root Cause Analysis, is a structured approach used to identify the fundamental reason or core issue underlying a problem, incident, or undesired outcome within a system. This infographic template is designed to guide you through the investigative journey of identifying the fundamental causes that lie at the core of complex issues. Compatible with Powerpoint, Keynote, and Google Slides. This introduces the concept of root cause analysis, illustrating its importance in problem-solving and decision-making. This infographic showcases how each level digs deeper into the underlying issues, starting to reaching the fundamental causes.