


Características


¿Tienes alguna pregunta?
Recomendar


6 diapositivas
Annual Corporation Report Infographics
Our Annual Corporation Report infographic is an optimal visual enhancement for presentations in Powerpoint, Keynote, and Google Slides, tailored for corporate executives, financial analysts, and stakeholders. This infographic is meticulously designed to present annual financial and operational data in a structured and easily interpretable manner. The infographic provides a visual summary of an organization's yearly performance, including financial figures, growth metrics, and key performance indicators (KPIs). Its layout is engineered to present complex data in a digestible format, facilitating quick comprehension and analysis of the company's annual achievements and areas for improvement. Incorporating this infographic into your annual report presentations will not only streamline the communication of your corporation's yearly outcomes but also enable your audience to better grasp the strategic insights derived from this data. Whether you're reviewing revenue streams, expenditure, or performance benchmarks, this infographic will serve as a powerful tool to convey your message with clarity and precision.


5 diapositivas
Sex Education in Schools Infographics
Navigating the sensitive topic of sex education becomes approachable and comprehensible with our sex education in schools infographics template. Cast in shades of understanding purple and a spectrum of relatable colors, this creative yet educational tool is a boon for educators and advocacy groups. It simplifies complex concepts into visuals, fostering an environment of learning and open dialogue. Compatible with Powerpoint, Keynote, and Google Slides. The template features instructive graphics and discrete icons, curated specifically to aid in the delicate task of imparting sex education with respect, care, and factual accuracy.


8 diapositivas
Cost Analysis and Budgeting Presentation
Easily assess financial performance with the Cost Analysis and Budgeting Presentation template. This visually engaging slide helps break down cost structures, budget allocation, and financial comparisons in a clear and professional manner. Ideal for financial analysts, business strategists, and project managers presenting financial data. Fully editable in PowerPoint, Keynote, and Google Slides for effortless customization.


5 diapositivas
Corporate Risk Assessment Slide Presentation
Streamline complex evaluations with a clean, step-by-step visual that guides your audience through key business risks and mitigation strategies. Ideal for planning sessions or executive reports, this modern design helps simplify communication and enhance decision-making. Fully compatible with PowerPoint, Keynote, and Google Slides for seamless editing and presentation.


8 diapositivas
Africa Market Potential and Improvement Map Presentation
Visualize market opportunities across Africa with this insightful map template. Featuring percentage-based growth indicators and color-coded country highlights, it’s perfect for showcasing regional potential, trends, and business expansion strategies. Fully customizable in PowerPoint, Keynote, and Google Slides, this template supports clear, data-driven storytelling for marketing, economic, or strategic presentations.


3 diapositivas
Risk Assessment Spider Chart
Evaluate risks across key criteria with the Risk Assessment Spider Chart Presentation. This template showcases a multi-dimensional radar chart, ideal for comparing variables like probability, impact, and preparedness. Use this to present security assessments, project vulnerabilities, or business exposure insights. Fully editable in PowerPoint, Keynote, and Google Slides.


21 diapositivas
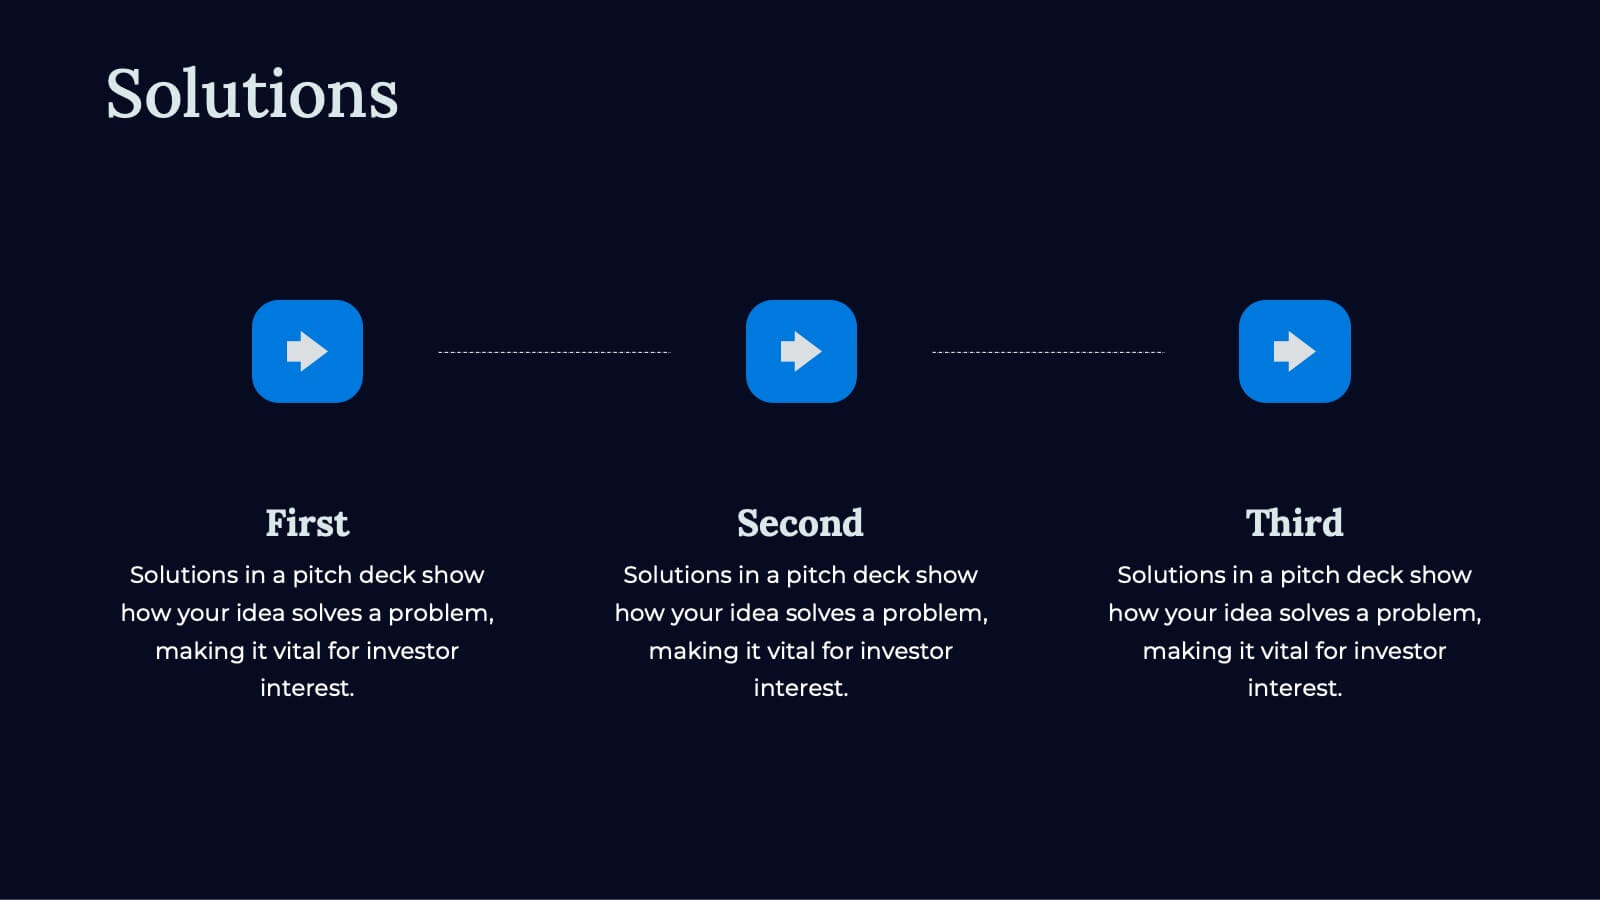
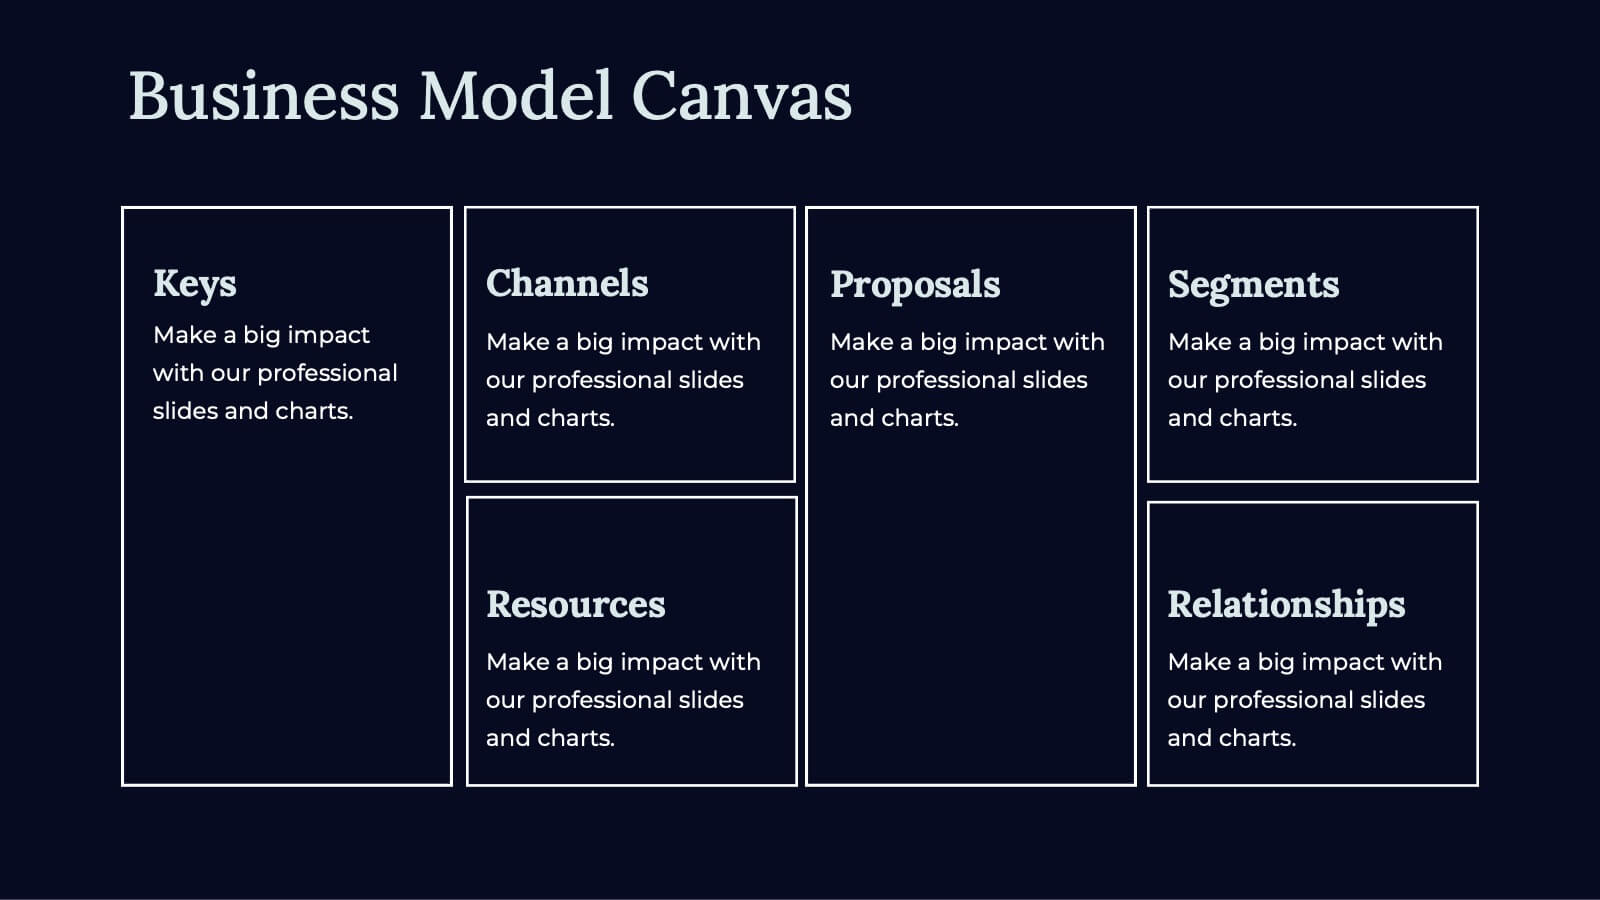
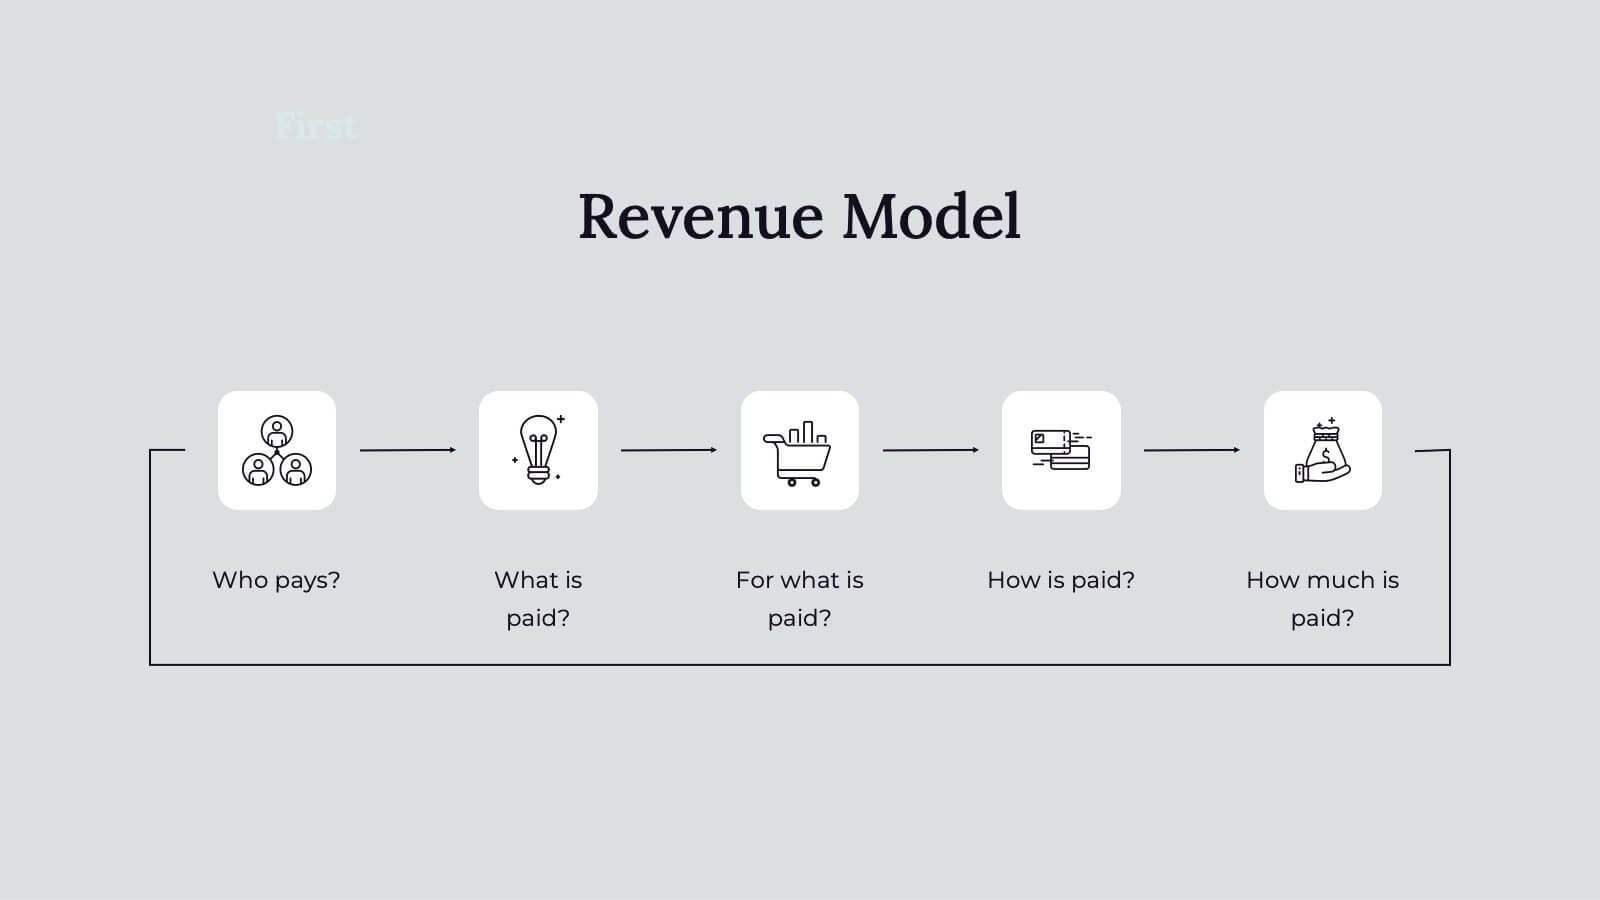
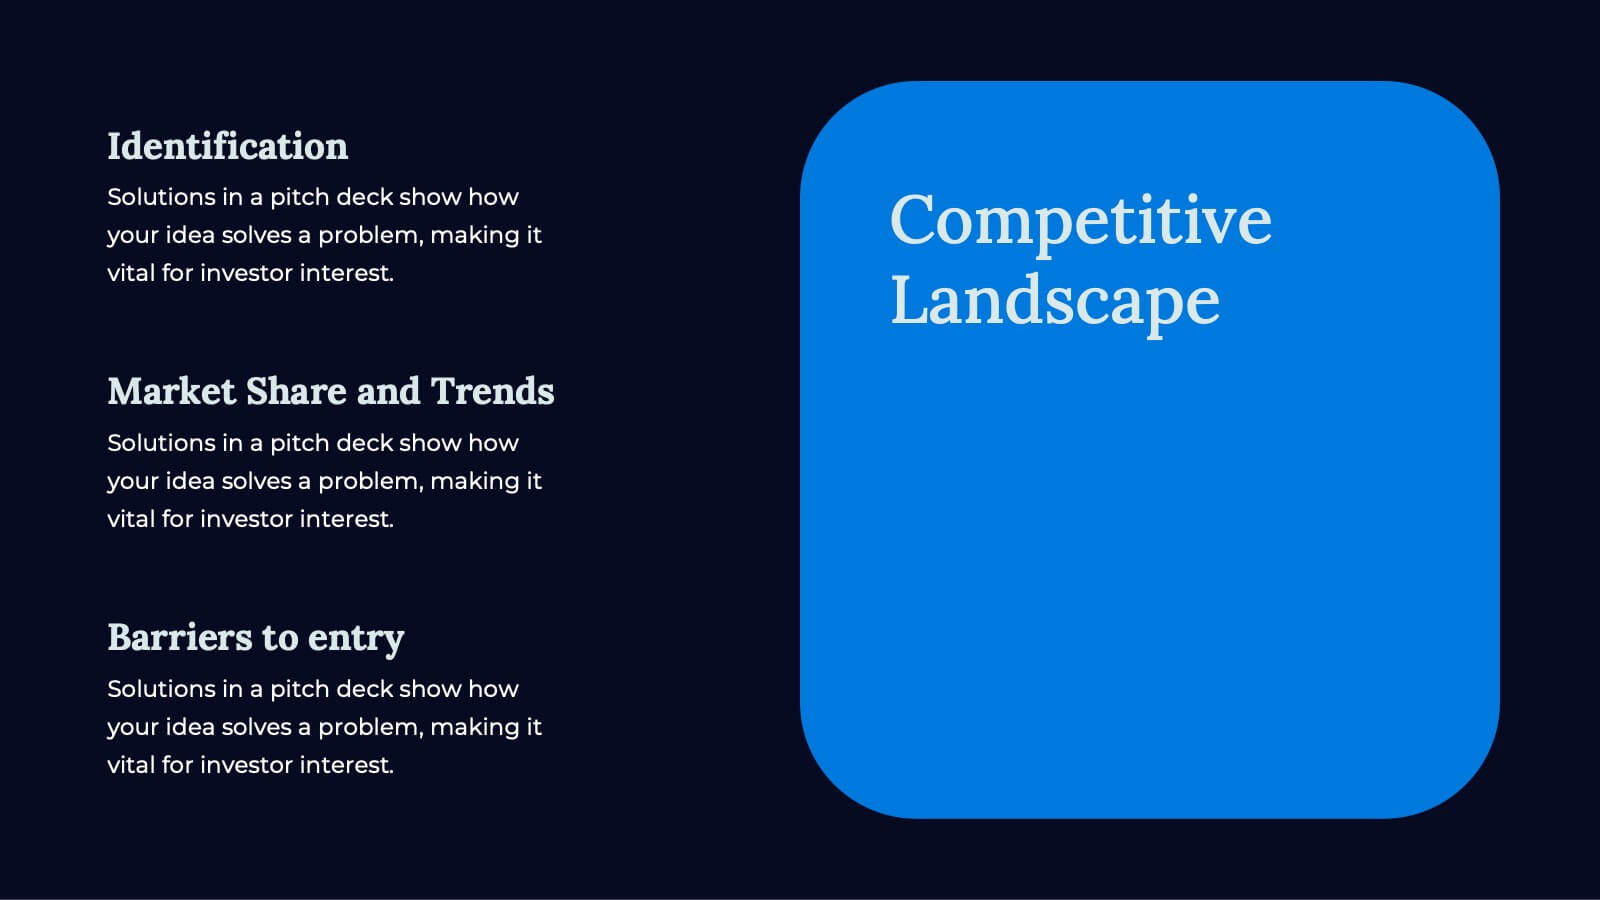
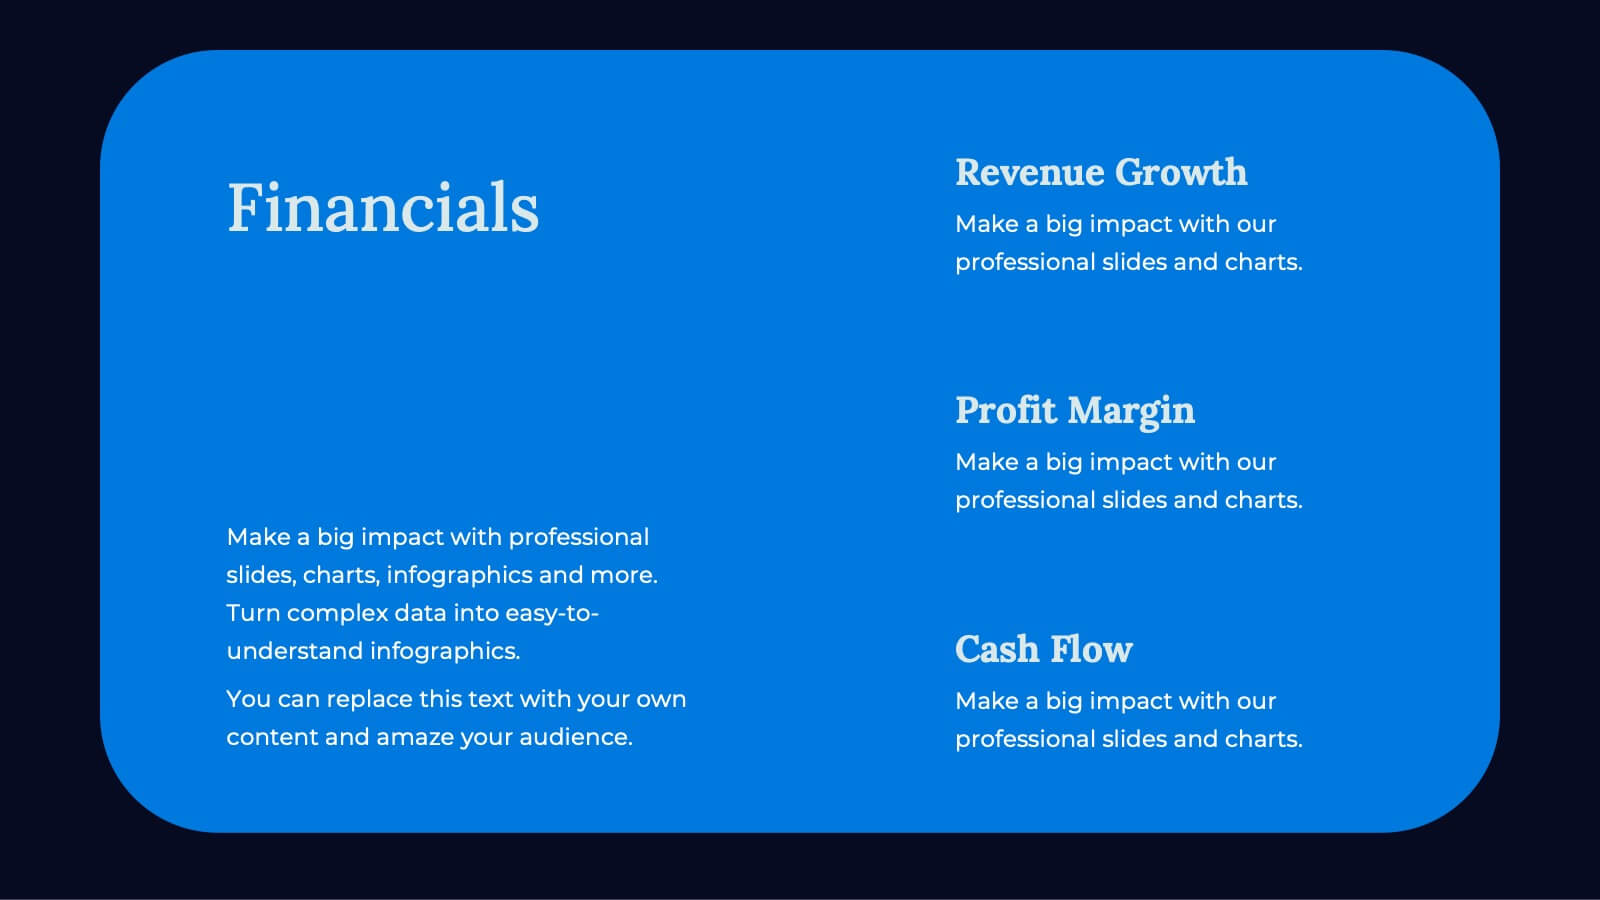
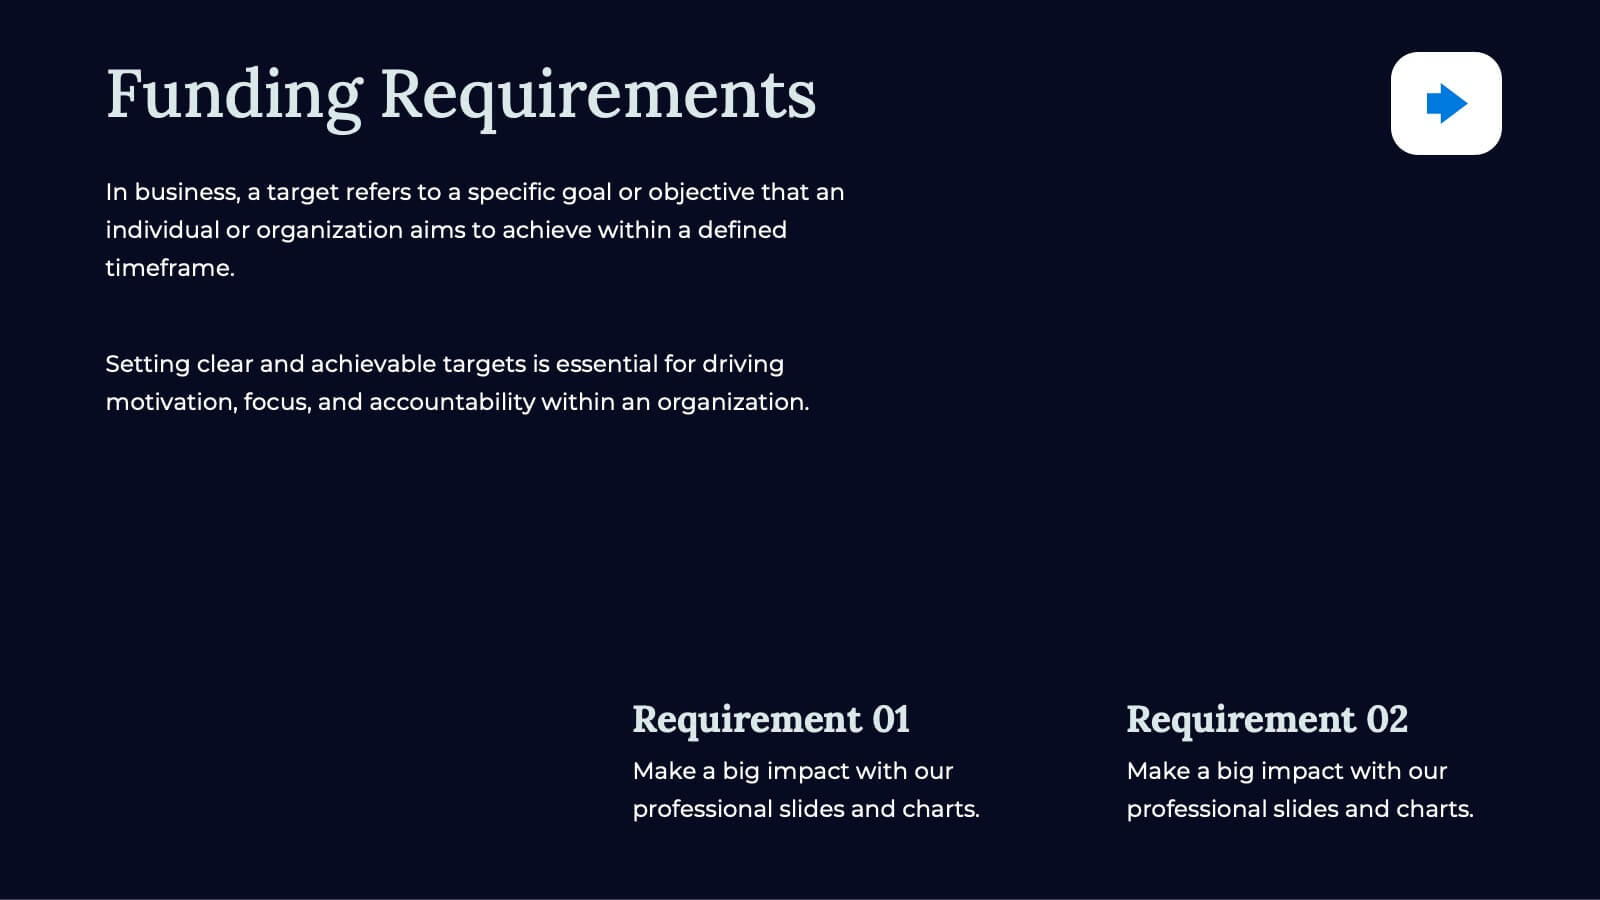
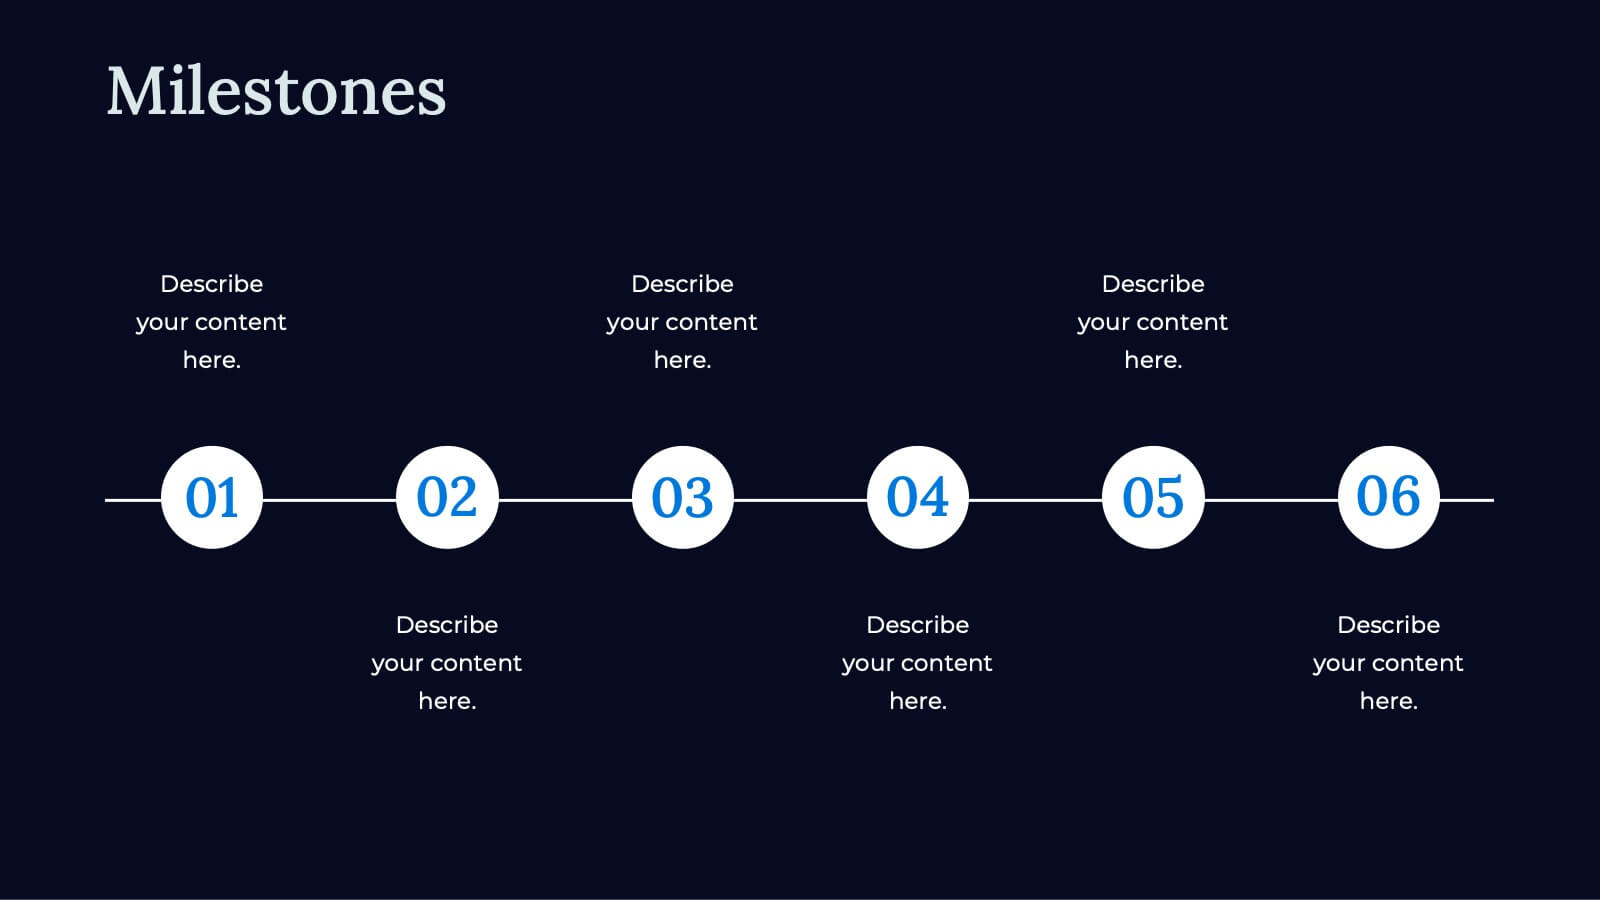
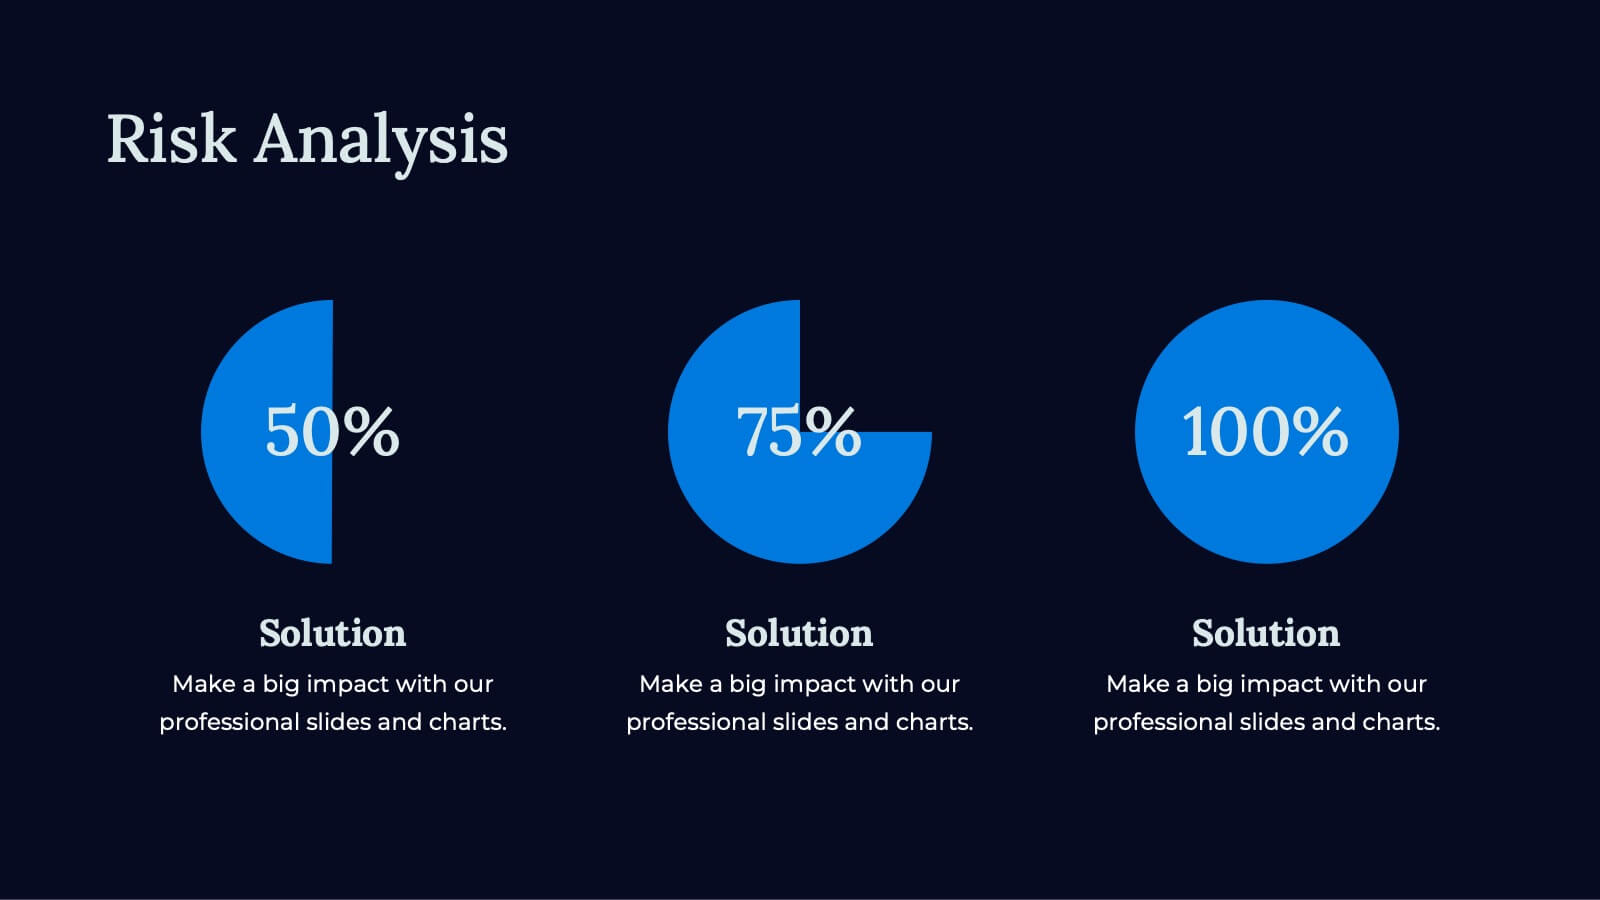
Apex Business Idea Pitch Deck Presentation
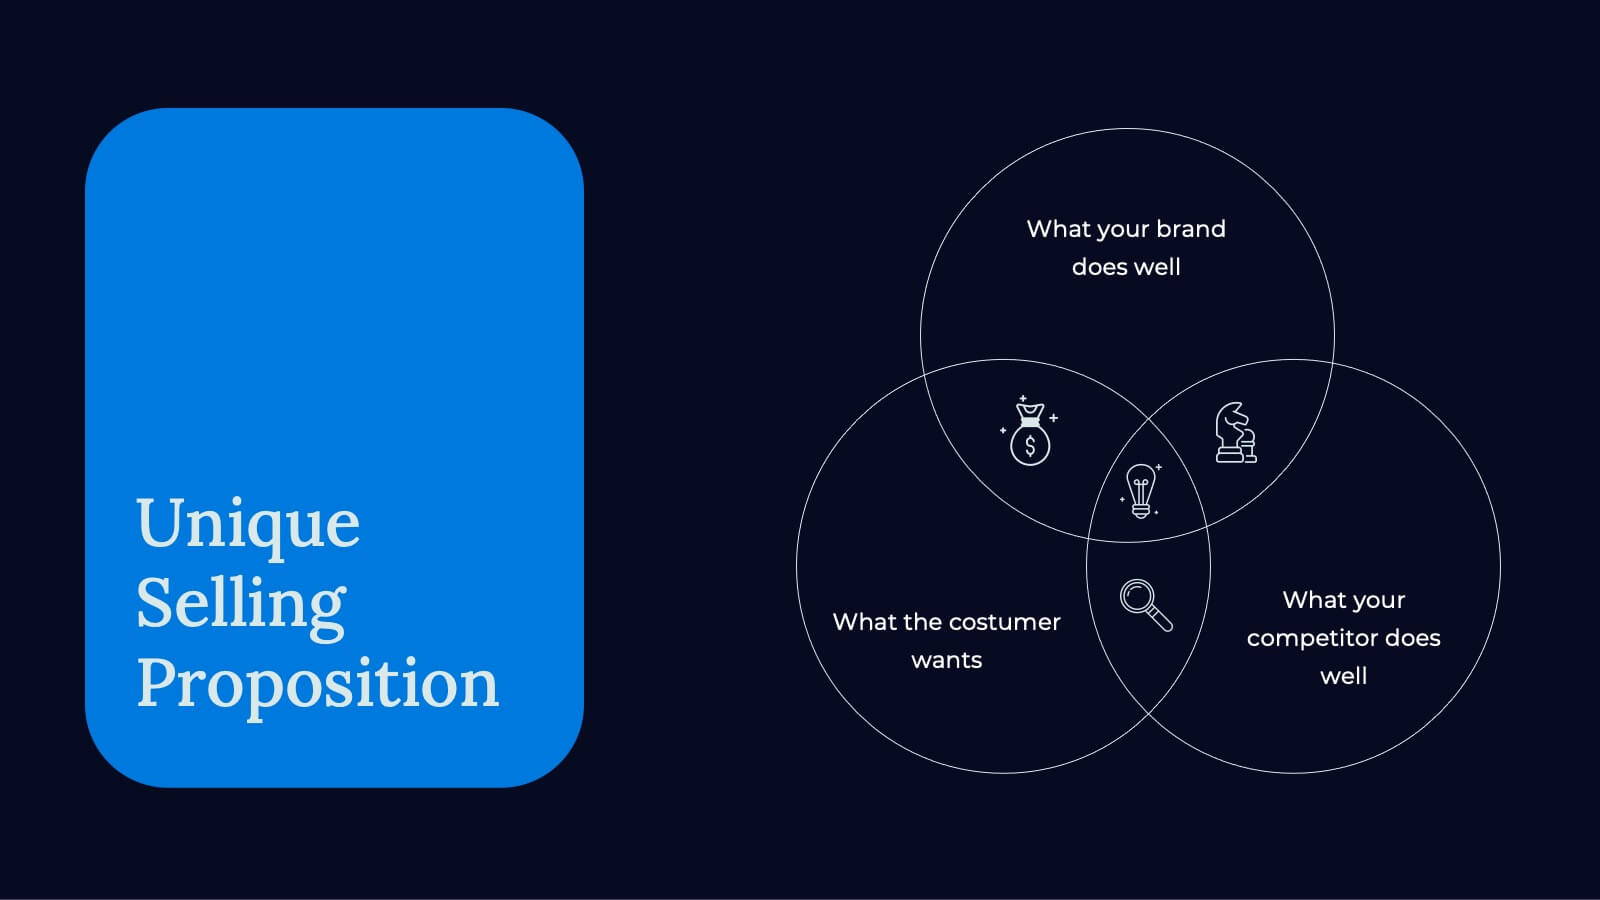
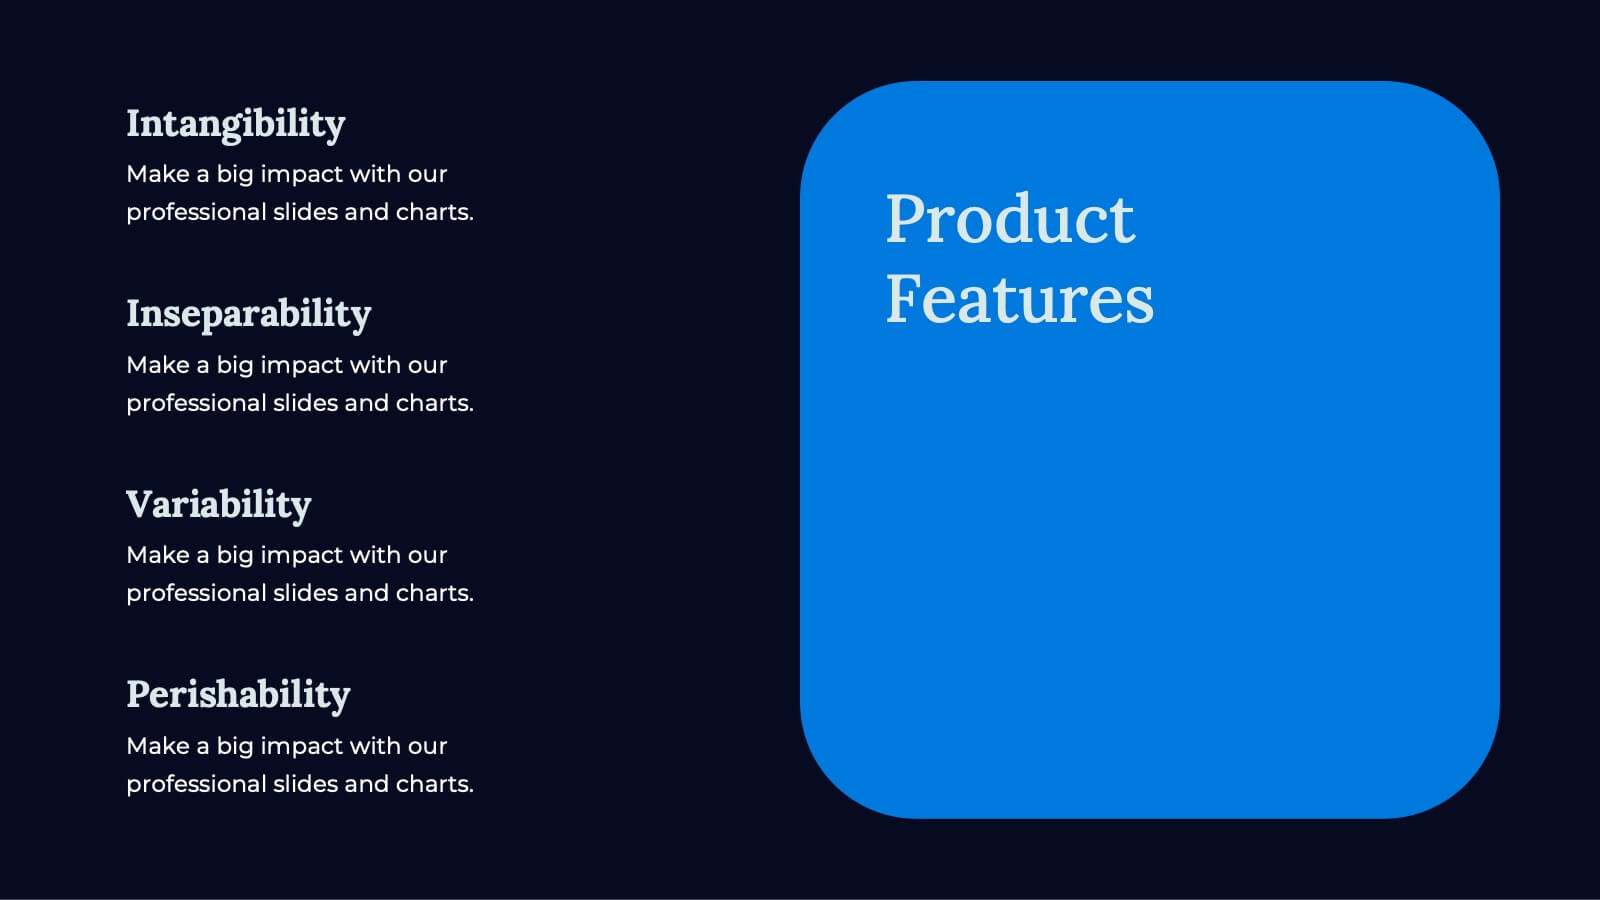
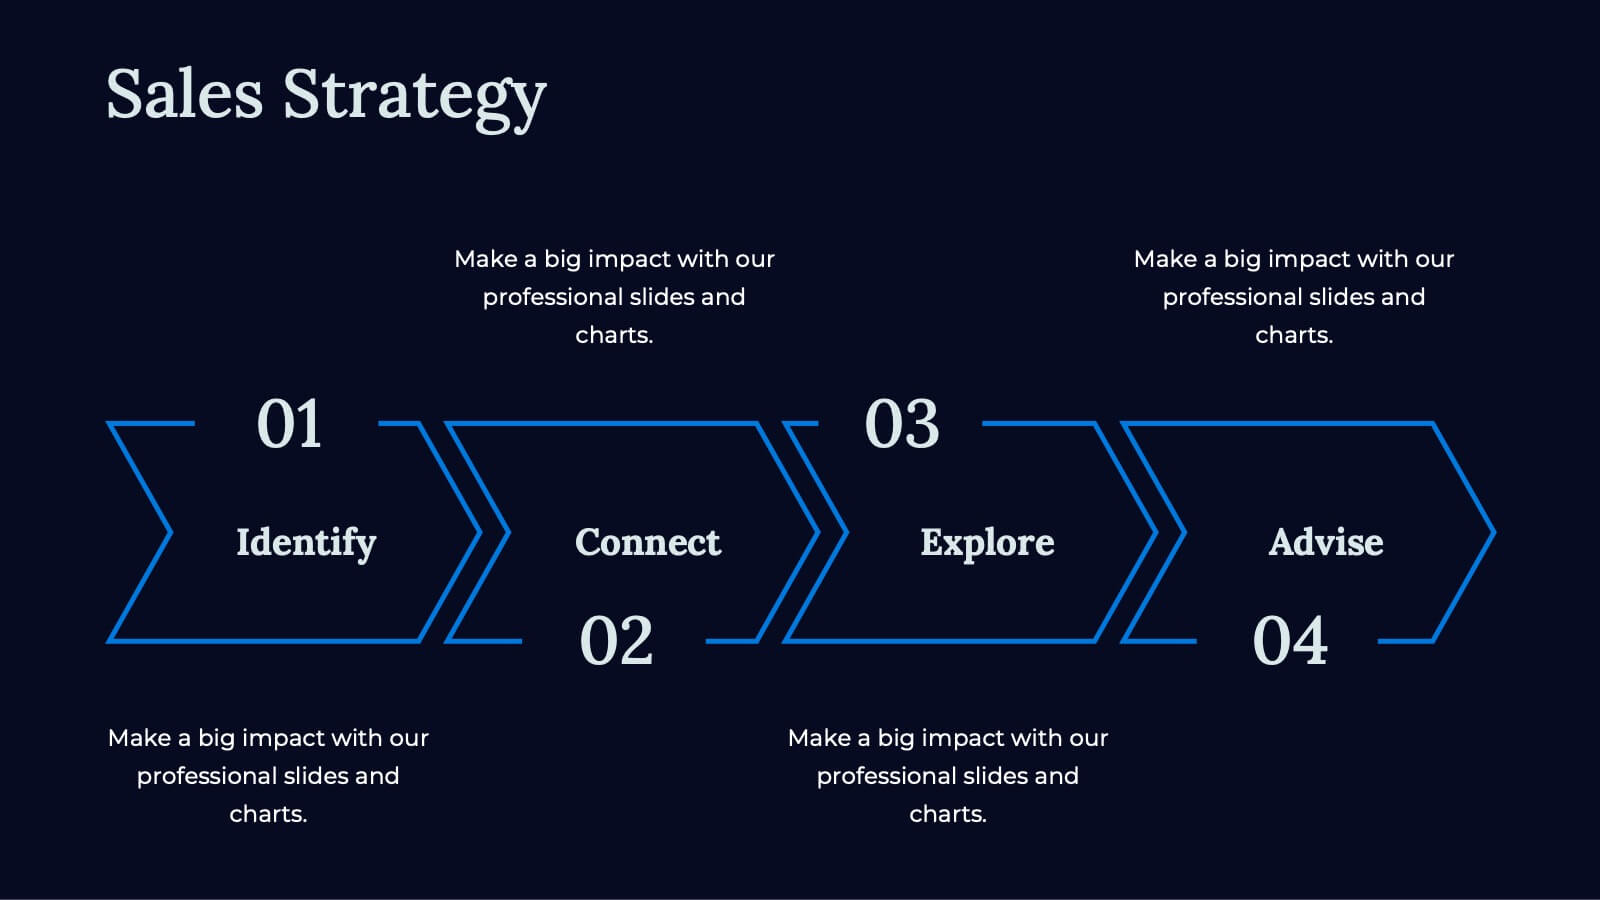
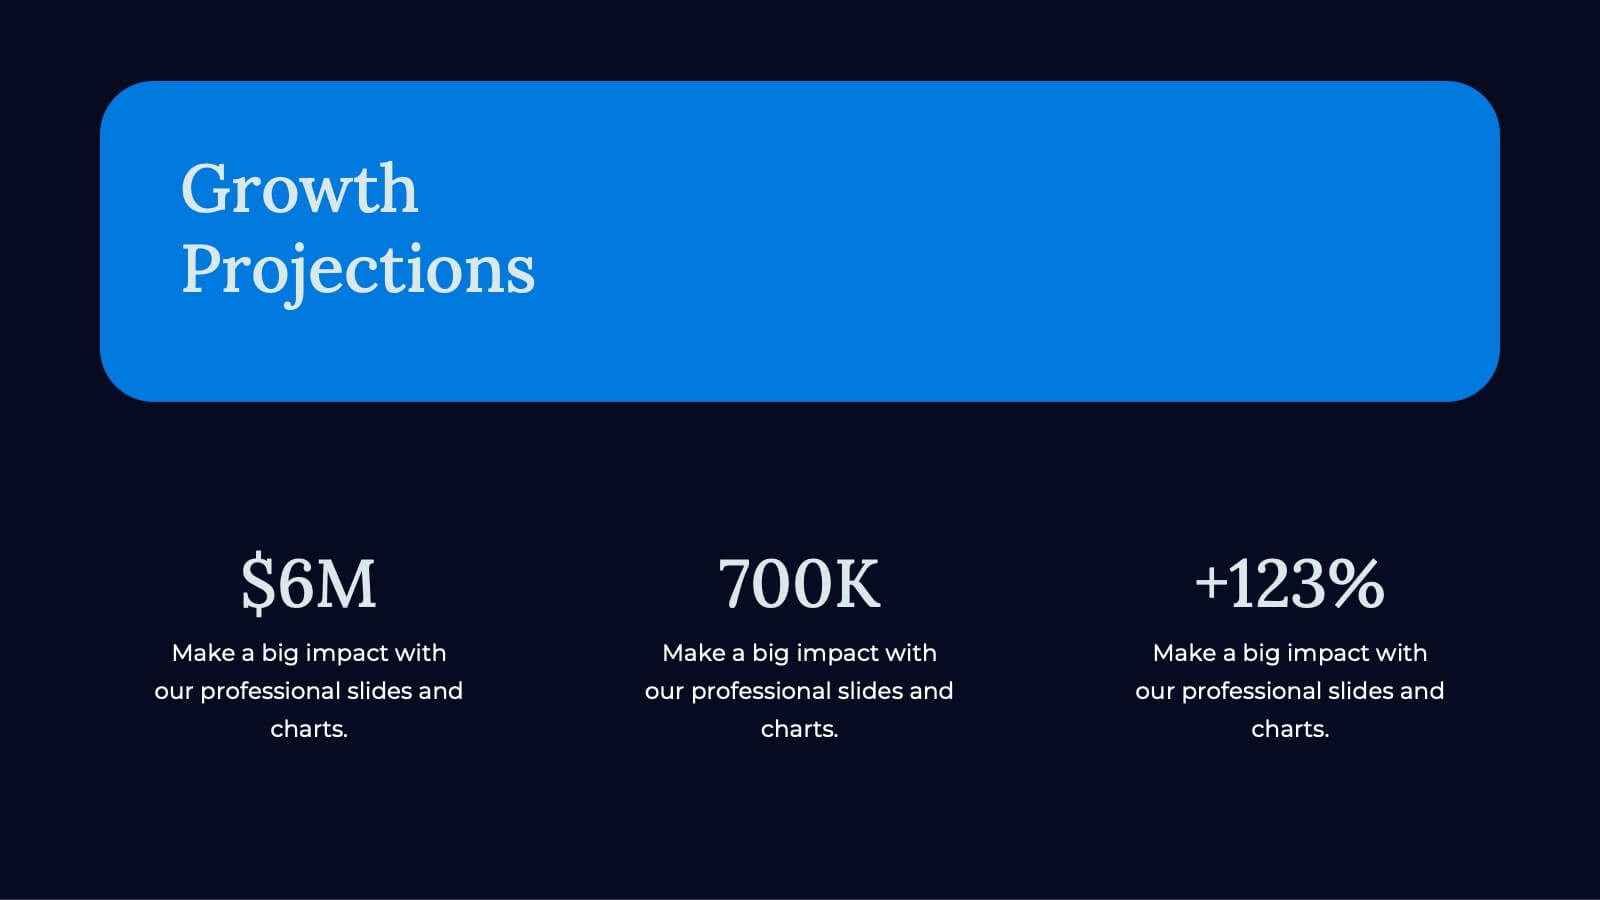
Craft powerful business pitch decks with this sleek template. Present your company overview, problem statement, solutions, and market opportunity. Showcase your business model, revenue model, competitive landscape, and unique selling proposition. Perfect for highlighting financials, growth projections, and funding requirements. Compatible with PowerPoint, Keynote, and Google Slides. Impress investors and stakeholders with clear, concise, and visually appealing presentations.


5 diapositivas
Innovation Framework Presentation
Turn bold ideas into structured success with this engaging presentation design. Perfect for mapping creative processes, innovation systems, and project development stages, it helps present ideas clearly and visually. Fully editable and easy to customize, this presentation is compatible with PowerPoint, Keynote, and Google Slides for effortless use.


10 diapositivas
Buyer Persona Journey Presentation
Understand your audience better with the Buyer Persona Journey Presentation. This intuitive layout showcases the key stages of your ideal customer’s experience—from discovery to decision-making. Great for marketing campaigns, product development, and sales alignment. Fully editable and compatible with PowerPoint, Keynote, and Google Slides.


24 diapositivas
Spireflow Corporate Strategy Report Presentation
Showcase your business insights with this modern, dynamic presentation template designed to communicate strategic goals and objectives effectively. From SWOT analysis to sales strategy and financial performance, each slide is tailored to enhance clarity and engagement. Perfect for business strategists and teams, this template is compatible with PowerPoint, Keynote, and Google Slides.


7 diapositivas
International Finance Infographic
International finance is a branch of economics and financial studies that deals with monetary interactions that occur between two or more countries. Dive into the intricate world of finance with our visually captivating international finance infographic. This template is your passport to understanding the complexities and opportunities in the global financial landscape. With this template you will be able to analyze the dynamics of exchange rates, foreign investment, and how these factors influence global economics. This infographic is crafted to provide a holistic view of the world of finance.


5 diapositivas
Performance Progress and Achievements Presentation
Showcase your team’s accomplishments and growth over time with this visually engaging bar chart layout. Each performance level is color-coded for clarity and paired with space for concise descriptions. Ideal for reporting KPIs, quarterly wins, or business milestones. Fully customizable in PowerPoint, Keynote, and Google Slides.


6 diapositivas
360-Degree Feedback System Overview
Clearly communicate your evaluation process with the 360-Degree Feedback System Overview Presentation. Featuring a circular layout with six editable segments, this template helps visualize feedback from peers, subordinates, managers, and more. Ideal for HR reviews, performance evaluations, and leadership development programs. Fully customizable in PowerPoint, Keynote, or Google Slides.


3 diapositivas
Corporate Law and Regulation Guide Presentation
Clarify legal structures with the Corporate Law and Regulation Guide Presentation. This visually balanced design uses legal scale and book icons to symbolize authority, compliance, and fairness. Perfect for illustrating legal frameworks, policy breakdowns, or governance models. Fully editable for PowerPoint, Keynote, and Google Slides.


7 diapositivas
Compliance Gap Analysis Infographic
Navigate the complexities of organizational compliance with our compliance gap analysis infographic. Using a vibrant palette of orange, white, and green, this infographic elucidates the differences between current compliance practices and desired standards. Specifically designed for business analysts, compliance officers, and risk managers, this template is an invaluable tool to identify, analyze, and bridge compliance-related gaps. With its fun yet informative style, communicating these insights becomes more engaging and understandable. This infographic is ready for integration with PowerPoint, Keynote, and Google Slides, ensuring smooth presentations across various platforms.


6 diapositivas
Revenue Growth Sales Slide Presentation
Showcase your business success with this Revenue Growth Sales Slide Presentation. The upward-curved arrow design highlights five key milestones, each with customizable titles, icons, and color accents. Perfect for illustrating sales performance, growth metrics, or financial forecasts. Easy to edit in PowerPoint, Keynote, or Google Slides—ideal for sales teams, analysts, and executives.


6 diapositivas
Supply & Freight Route Management Deck Presentation
Take your logistics reporting to the next level with this circular supply route diagram. Ideal for visualizing freight movement, delivery checkpoints, and warehouse coordination, this slide offers a clean and organized way to map your operational flow. Fully compatible with PowerPoint, Keynote, and Google Slides.