


Características


¿Tienes alguna pregunta?
Recomendar


5 diapositivas
Project Milestone Timeline Presentation
Bring your project’s journey to life with this vibrant and organized presentation layout. Designed to showcase milestones, releases, and key phases clearly, it helps teams stay aligned and focused on goals. Fully editable and compatible with PowerPoint, Keynote, and Google Slides for smooth, professional presentations every time.


8 diapositivas
Impressive Business Metrics by Numbers
Highlight your company’s key wins with the Impressive Business Metrics by Numbers Presentation. This data-driven slide layout emphasizes three core metrics using bold numbering, modern icons, and clear titles—perfect for showcasing KPIs, milestones, or achievements. Ideal for reports, pitches, and performance reviews. Fully editable in PowerPoint, Keynote, and Google Slides.


5 diapositivas
Editable Asia Region Map Slide Presentation
Explore data across countries with a sleek regional map designed to visualize insights and connections in a clear, professional way. Perfect for presenting market trends, business reach, or project highlights across Asia, this editable layout is fully compatible with PowerPoint, Keynote, and Google Slides for easy customization.


5 diapositivas
RAPID Framework for Business Strategy
Clarify decision-making roles with confidence using this vibrant business strategy framework. This template visualizes the RAPID model—Recommend, Agree, Perform, Input, Decide—in a clear flow that simplifies collaboration and speeds up strategy execution. Ideal for leadership teams and cross-functional planning. Works seamlessly in PowerPoint, Keynote, and Google Slides.


6 diapositivas
Clarifying Questions and Response Slide Presentation
Help your audience follow complex topics with the Clarifying Questions and Response Slide Presentation. Designed around a bold question mark layout, this slide format highlights five key clarifications or FAQs alongside thoughtful responses. Ideal for training, onboarding, or product demos, it enhances understanding and engagement. Fully editable in Canva, PowerPoint, Keynote, and Google Slides.


7 diapositivas
One-Page Business Model Overview Presentation
Simplify your business strategy with this One-Page Business Model slide. Perfect for pitches or internal reviews, it maps out key elements like partners, activities, customers, and revenue on a single page. Clean, customizable blocks help communicate your vision clearly—ideal for startups, entrepreneurs, and teams needing quick business clarity.


4 diapositivas
Team and Department Setup Structure Presentation
Organize your team with clarity using the Team and Department Setup Structure Presentation. This template is perfect for showcasing internal team hierarchies, departmental layouts, or functional groupings in a clean and professional layout. Each slide is fully customizable, allowing you to edit icons, titles, and structure to suit your organization. Compatible with Canva, PowerPoint, Keynote, and Google Slides.


6 diapositivas
Professional Business Plan Presentation
Make every idea count with a clean, professional presentation that helps you communicate your business strategy clearly and confidently. Ideal for showcasing goals, market insights, and performance plans, it delivers structure with style. Fully compatible with PowerPoint, Keynote, and Google Slides for easy customization and seamless presentation design.


21 diapositivas
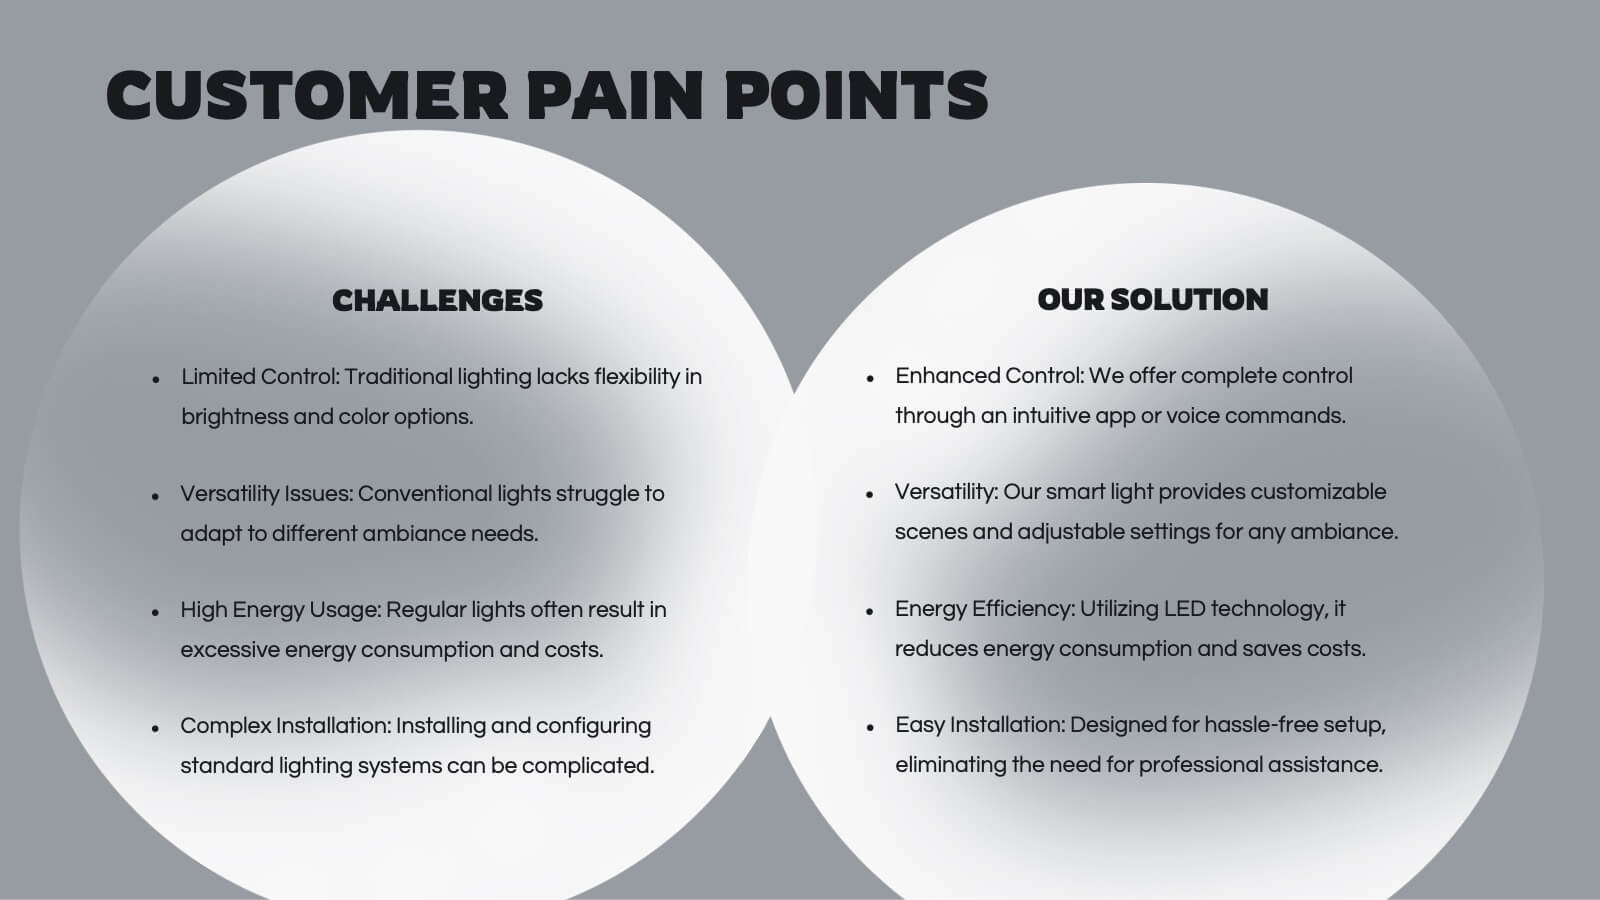
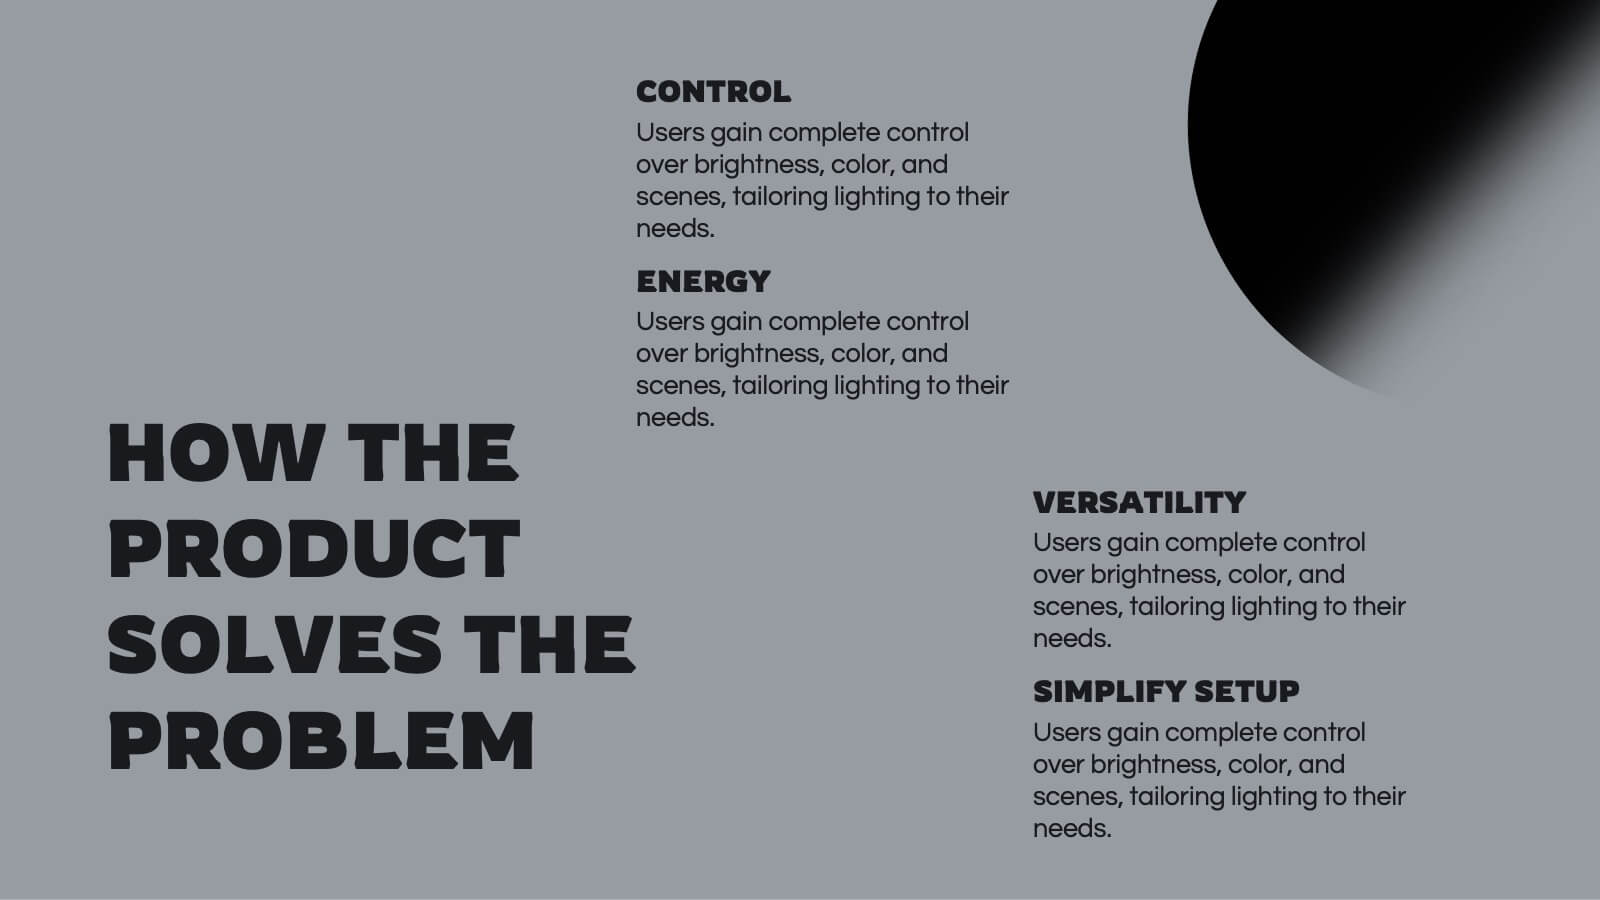
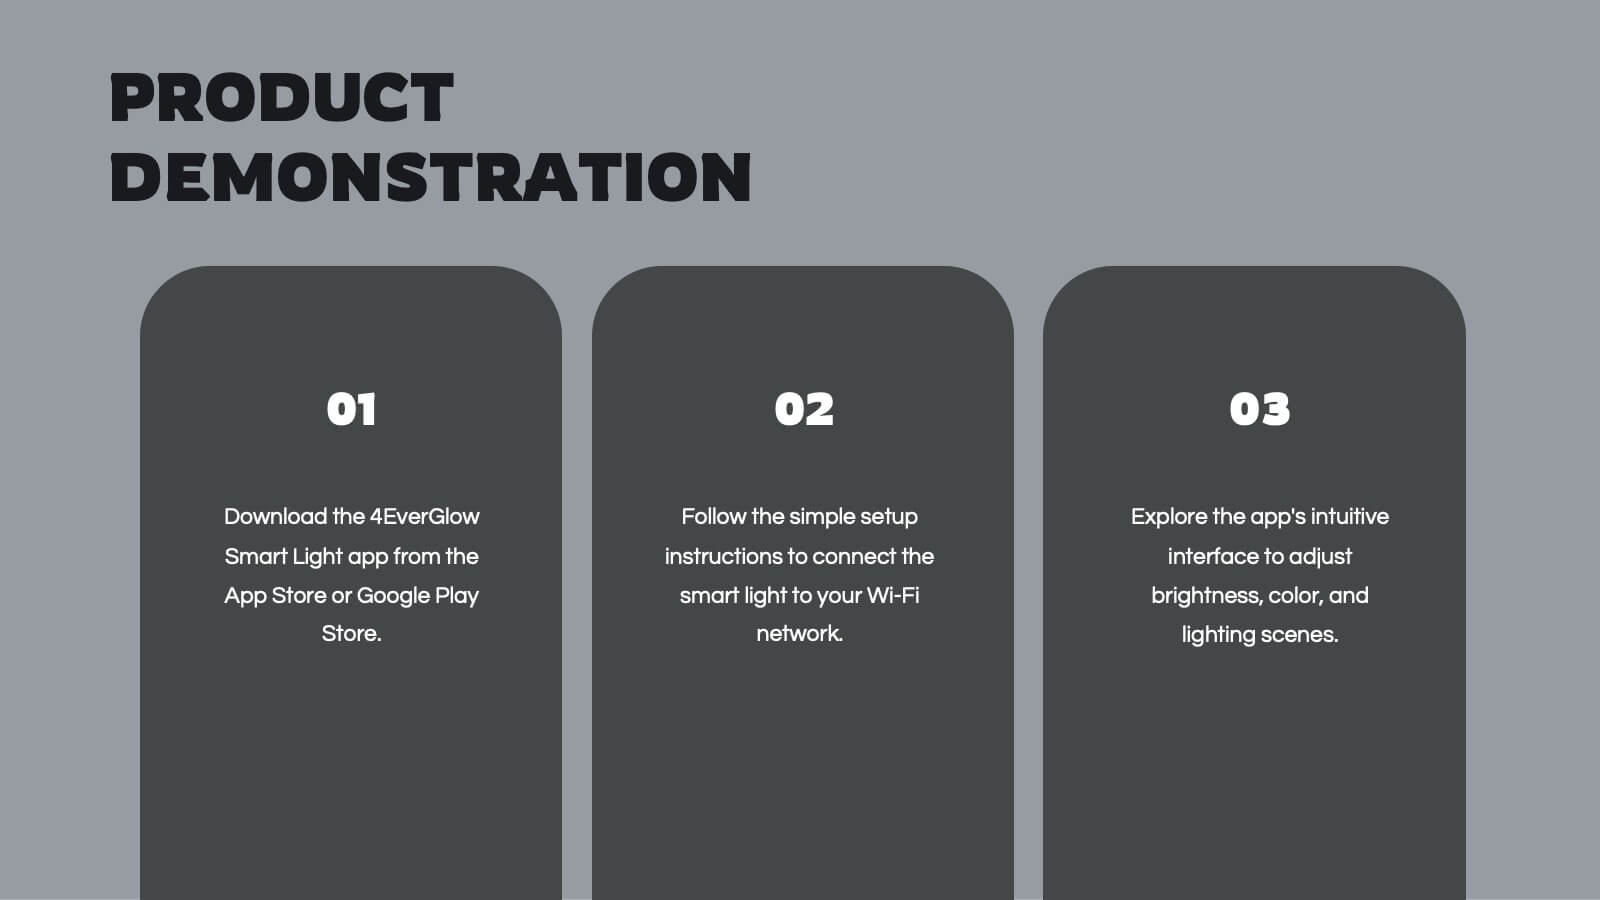
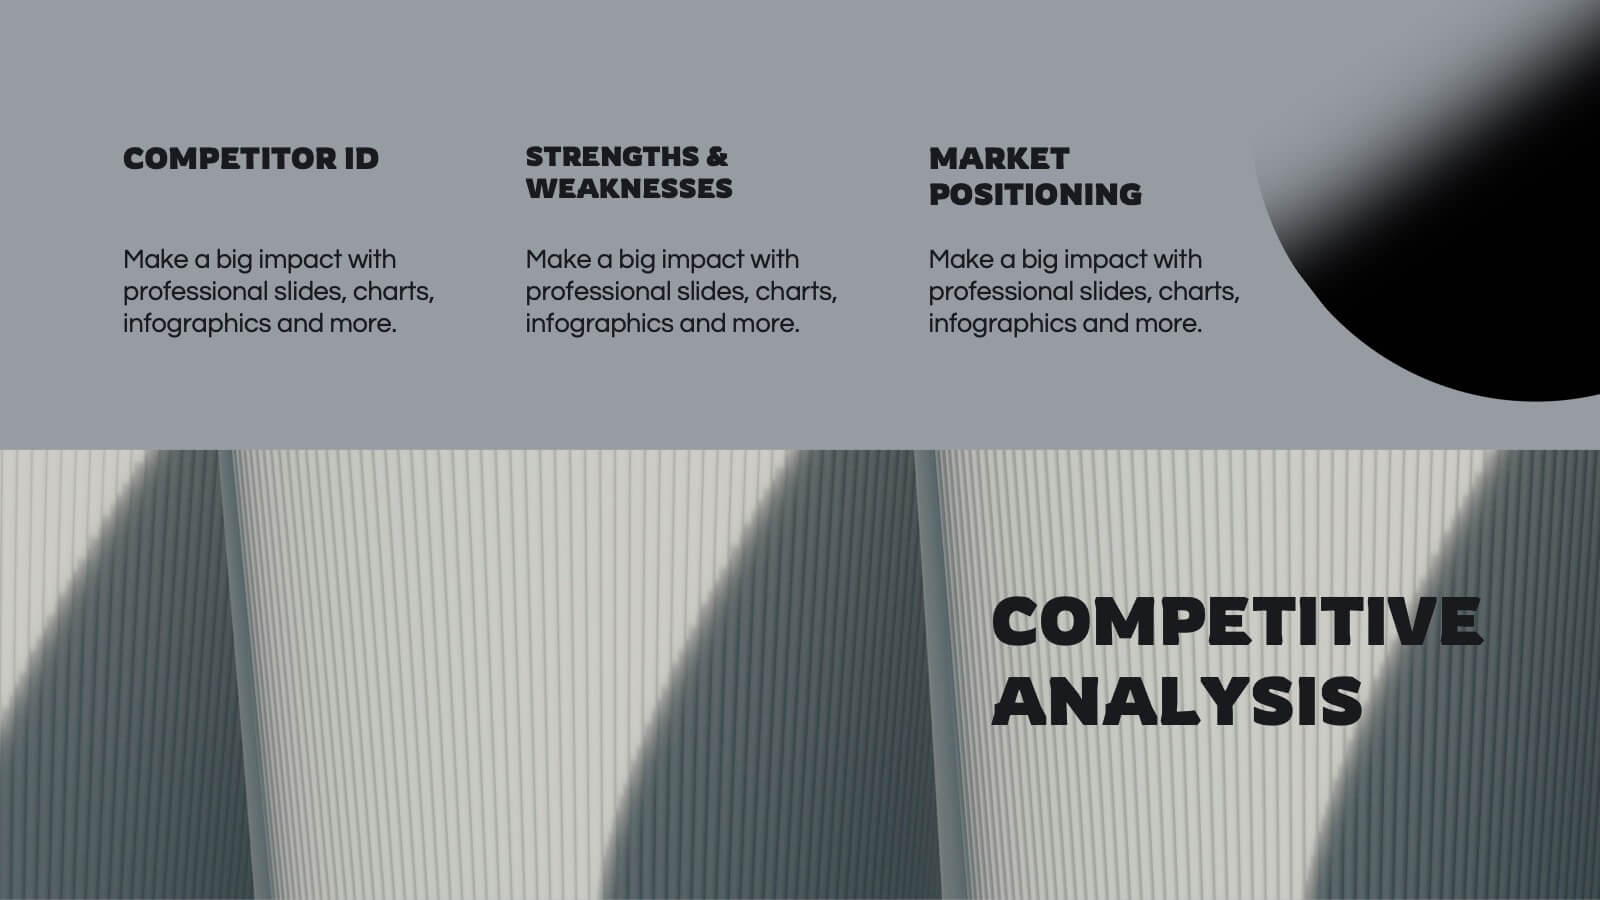
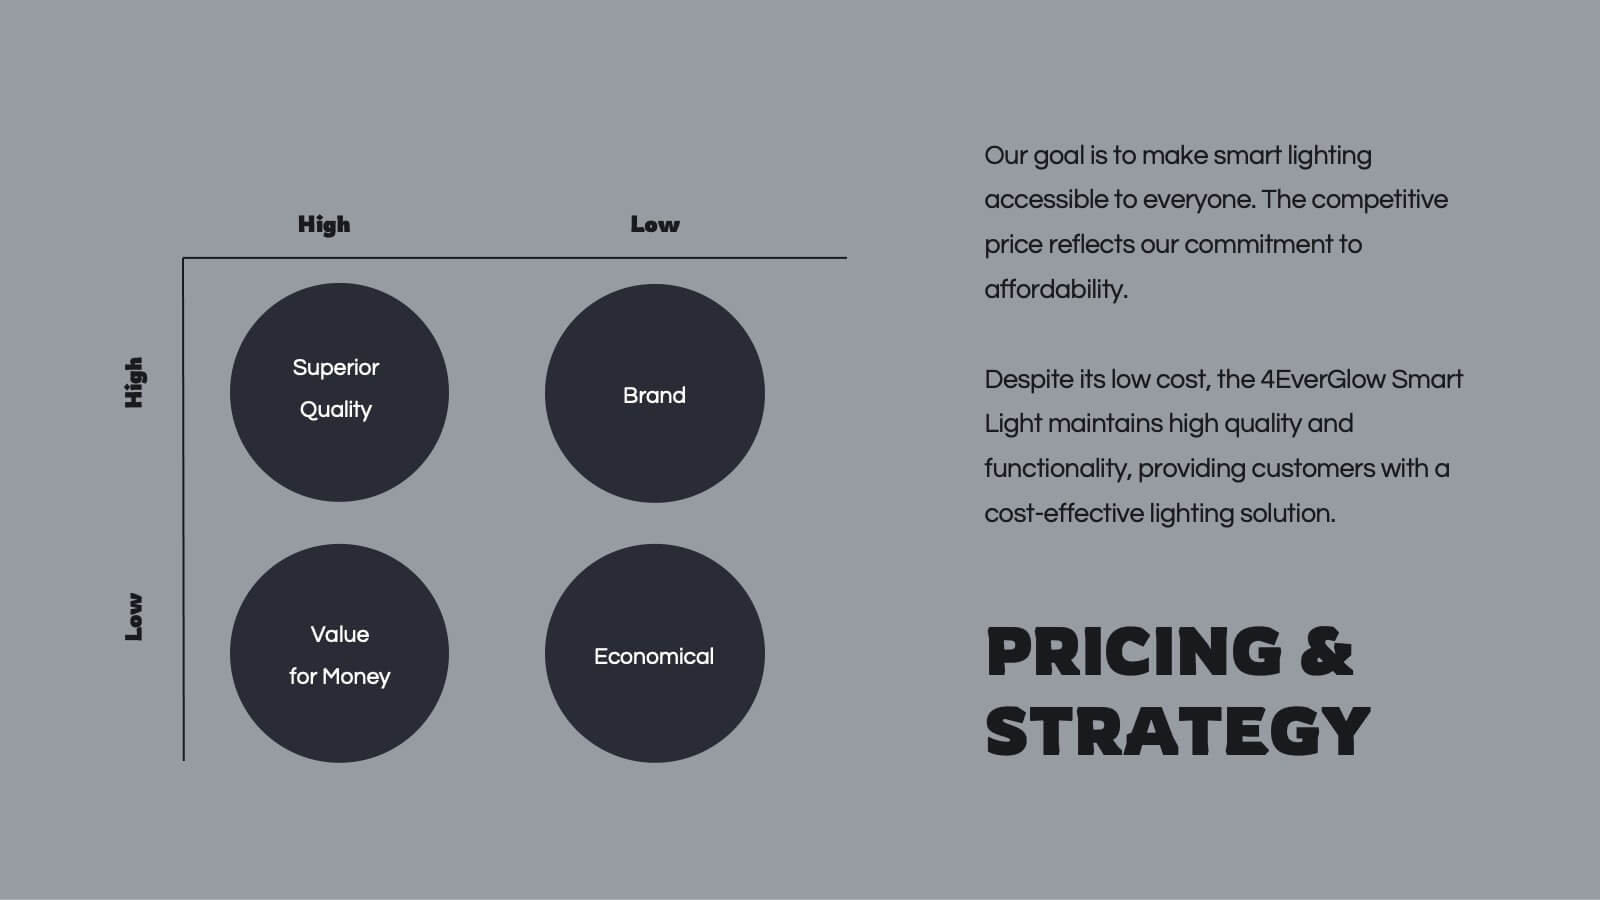
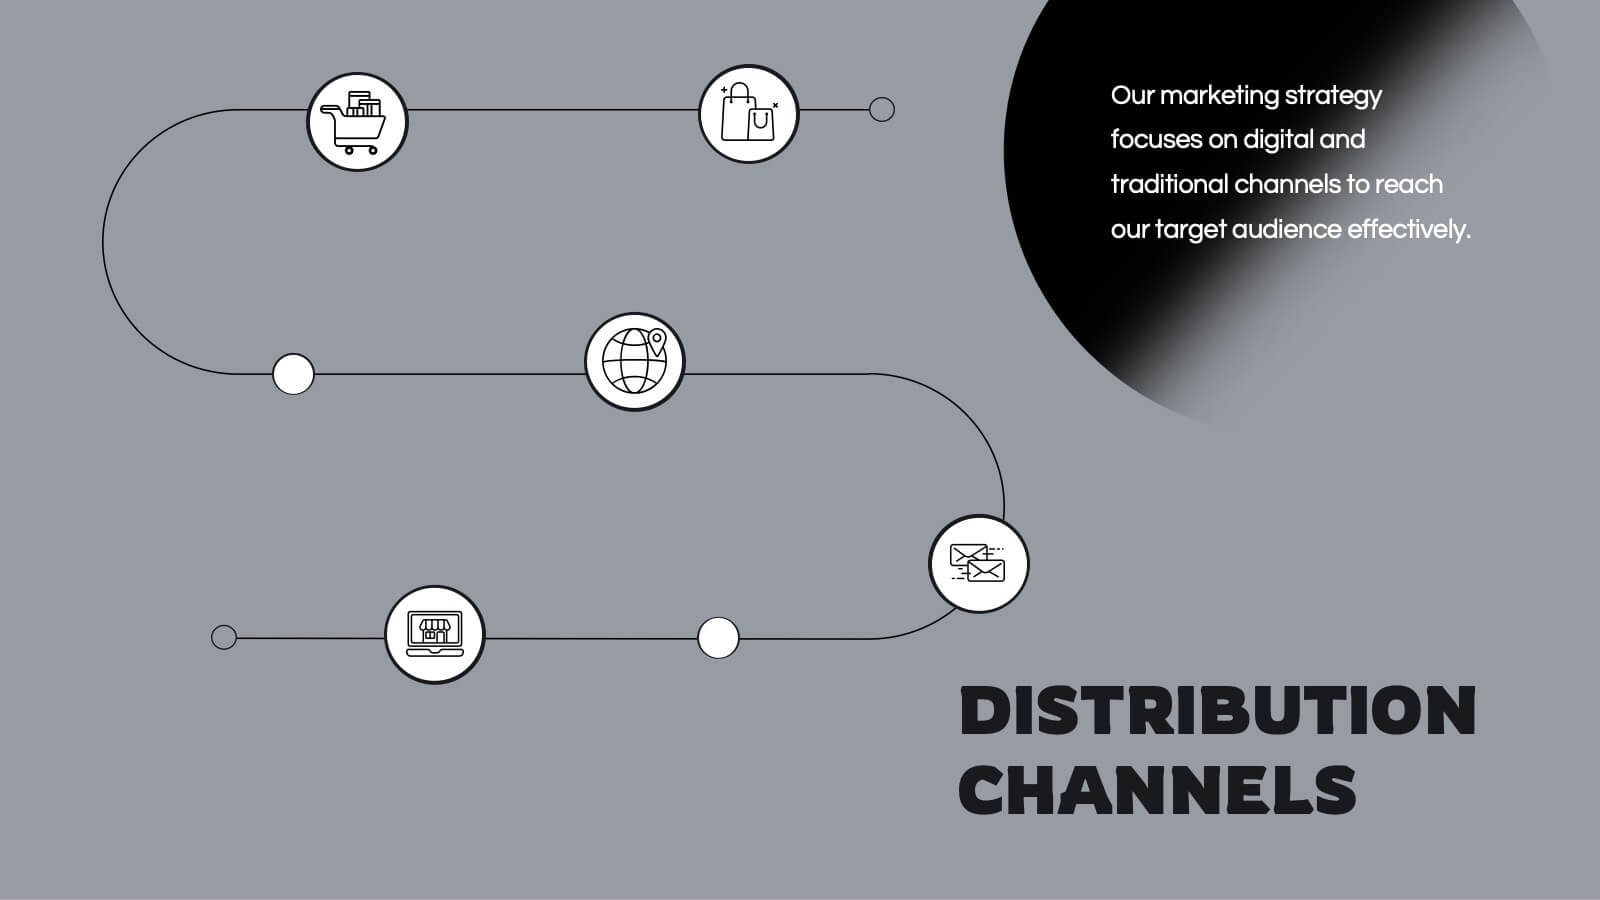
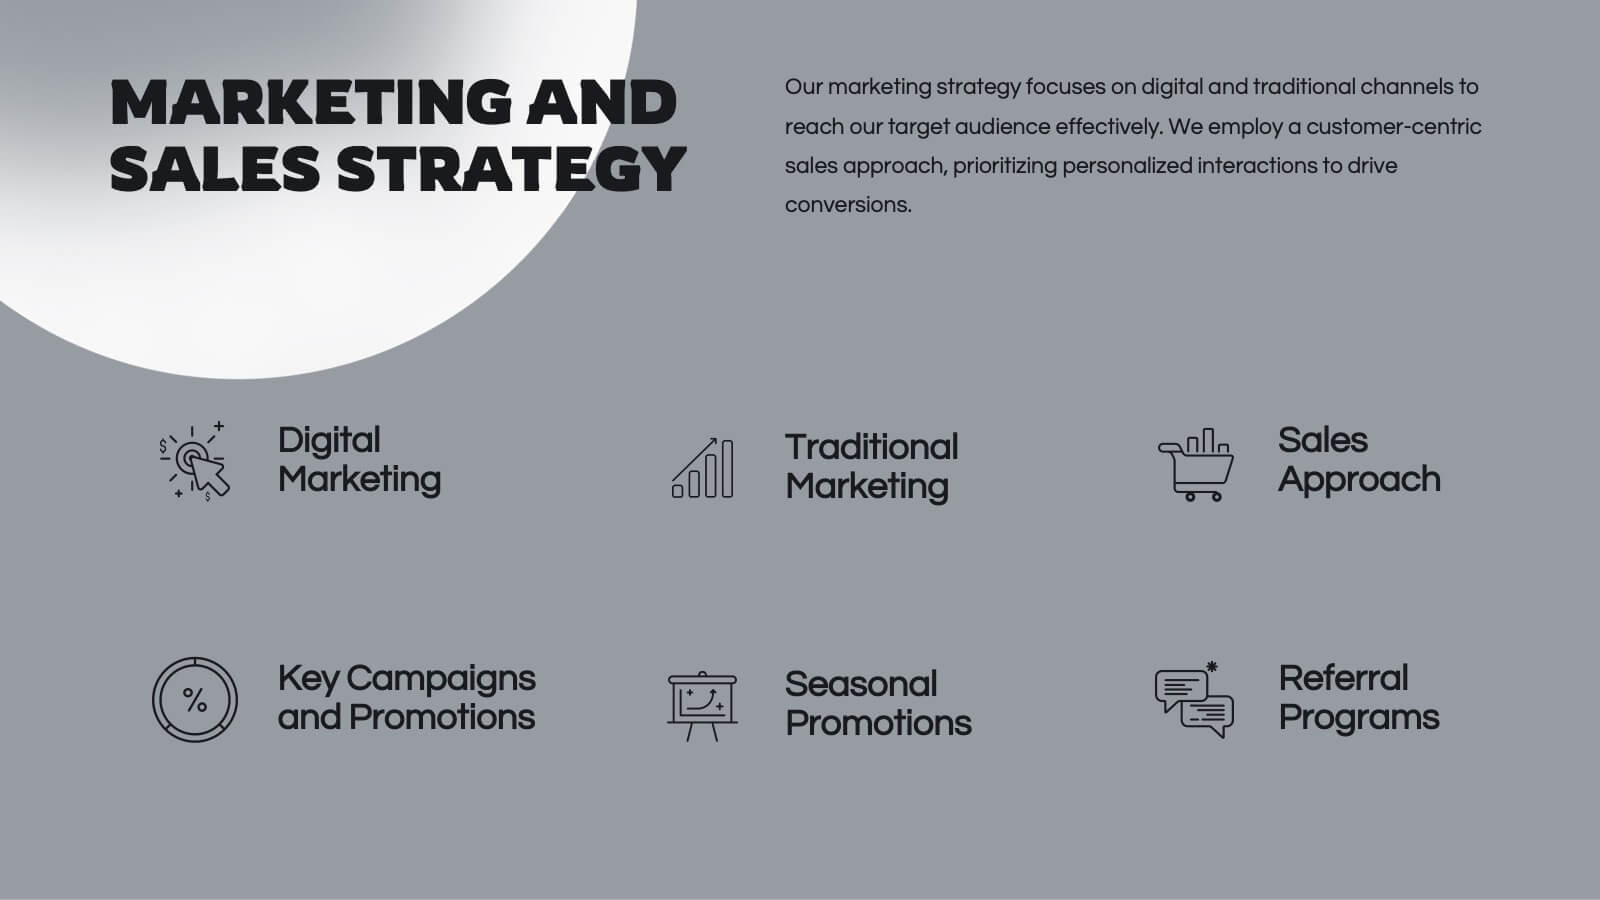
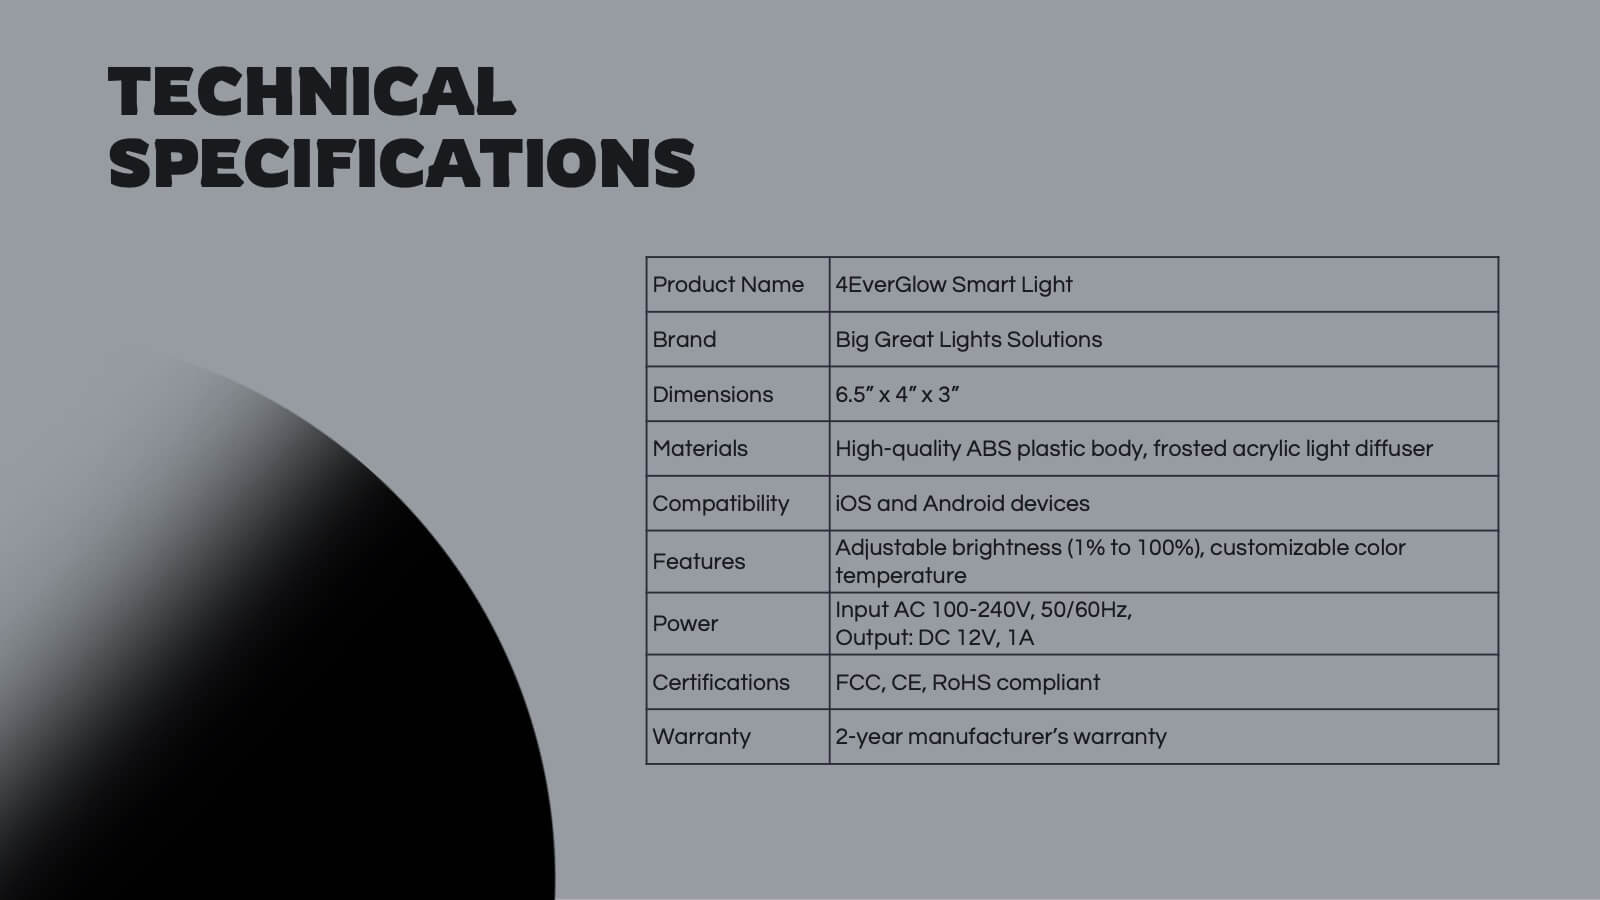
Spinel Product Strategy Report Presentation
Take your product strategy to the next level with this polished, spinel-inspired presentation! Designed to effectively communicate your product's goals, market analysis, and strategy roadmap, this template is both visually striking and easy to navigate. Its sharp design ensures a professional touch. Compatible with PowerPoint, Keynote, and Google Slides.


5 diapositivas
Side-by-Side Product Comparison Table Presentation
Clearly showcase differences with the Side-by-Side Product Comparison Table Presentation. This modern, easy-to-scan layout is perfect for comparing two features, services, or product options. Use icons and color highlights to emphasize key advantages. Ideal for marketing, sales decks, or client proposals. Compatible with PowerPoint, Keynote, Canva, and Google Slides.
6 diapositivas
Team Objective Tracker and Milestone Plan Presentation
Stay on top of team goals with the Team Objective Tracker and Milestone Plan Presentation. Designed for performance reviews, progress reports, or planning meetings, this template visualizes KPIs with clarity. Each slide is fully customizable in PowerPoint, Keynote, or Google Slides—ideal for project leads and department managers.


4 diapositivas
Workflow Bottleneck Fishbone Analysis
Identify slowdowns and streamline performance with the Workflow Bottleneck Fishbone Analysis Presentation. This diagram features a horizontally aligned fishbone structure with segmented semicircles, ideal for pinpointing process inefficiencies across stages. Fully customizable in PowerPoint, Keynote, and Google Slides for professional workflow diagnostics.


5 diapositivas
Business Workflow Process Presentation
Optimize your operations with the Business Workflow Process template, designed to visually map out tasks and streamline workflows. Perfect for project managers and teams, this template enhances clarity and collaboration. Fully customizable and compatible with PowerPoint, Keynote, and Google Slides, making professional workflow presentations seamless and efficient.


6 diapositivas
Business Triangle Model Presentation
Visualize the core components of business success with the Business Triangle Model template. This structured framework highlights three interconnected elements, making it ideal for strategic planning, risk assessment, and performance analysis. Customize it effortlessly to suit your needs. Compatible with PowerPoint, Keynote, and Google Slides for seamless integration.


6 diapositivas
Business Performance Pie Chart Presentation
Showcase key business insights with the Business Performance Pie Chart Presentation template. Designed for professionals, this fully editable slide deck allows you to present performance metrics, financial data, and strategic analysis using visually appealing pie charts. Ideal for business reports, investor meetings, and corporate presentations, it ensures clarity and engagement. Compatible with PowerPoint, Keynote, and Google Slides.


5 diapositivas
Business Executive Summary Report Presentation
Simplify your executive reporting with this 'Business Executive Summary Report' template, designed to present critical insights at a glance. This template streamlines complex data into digestible parts, ensuring clarity and impact in every slide. Perfect for executives and managers using PowerPoint, Keynote, and Google Slides.


10 diapositivas
Six Sigma Process Improvement
Visualize each stage of the Six Sigma DMAIC methodology—Define, Measure, Analyze, Improve, and Control—with this circular diagram layout. Perfect for quality control meetings, workflow optimization, and training sessions. Fully customizable in PowerPoint, Keynote, and Google Slides.