


Características


¿Tienes alguna pregunta?
Recomendar


10 diapositivas
Water Cycle and Hydrological Study Presentation
Break down complex water cycle processes with this engaging diagram layout. Featuring a bottle-shaped center graphic with directional arrows, it’s perfect for illustrating hydrological stages or sustainability concepts. Fully editable in PowerPoint, Keynote, and Google Slides, making it ideal for educational, environmental, or scientific presentations. Clear, modern, and easy to use.


20 diapositivas
Wonderis Design Proposal Presentation
Deliver an impeccable pitch with this minimalistic and professional design proposal template. Crafted for designers, agencies, and creative professionals, this presentation allows you to seamlessly showcase your expertise, methodology, and deliverables. Walk your audience through a polished narrative that includes a project summary, proposed solutions, objectives, methodology, and timeline. Highlight your expertise with dedicated slides for team introductions, budget breakdowns, and pricing structures. Ensure confidence with risk mitigation strategies, references, and clear next steps to solidify trust in your approach. This template is fully editable and works flawlessly with PowerPoint, Google Slides, and Keynote, providing the flexibility you need to tailor your proposal to specific client needs. Perfect for client pitches, project proposals, and business presentations that need a sophisticated and concise design.


5 diapositivas
Annual Overview Report Template Presentation
Bring your yearly achievements to life with this sleek and structured layout designed for clarity and impact. Ideal for summarizing company performance, milestones, and future goals, it organizes data into easy-to-follow visuals. Fully editable and compatible with PowerPoint, Keynote, and Google Slides for a smooth presentation experience.


6 diapositivas
Project Table Infographic
A project table is a structured and organized representation of project-related information in a tabular format. This infographic template is designed to list and track various elements of a project, such as tasks, activities, resources, timelines, and statuses. This infographic showcases project-related data in a concise and organized manner. It is an essential tool for project managers and teams to present project progress, timelines, tasks, and key milestones in a clear and easy-to-understand format. The sections provide additional information about the task's purpose, deliverables, and any specific requirements.


8 diapositivas
Workflow Diagram Presentation
The "Workflow Diagram Infographic" template is designed to clearly illustrate the sequence of tasks or stages within a project or business process. Each segment of the circular design is allocated for a specific phase, equipped with a title and descriptive area, and supported by distinct icons for quick identification. This layout is ideal for delineating task dependencies and operational sequences, helping to simplify and communicate complex procedures. It's particularly useful for project managers, operational leads, and trainers in explaining workflows and processes efficiently. This infographic serves as an effective visual tool for presentations aimed at streamlining discussions around process improvements and team alignments.


6 diapositivas
Medical Technologies Infographics
Explore the forefront of medical technology with this informative and sleek infographic template, tailored for professionals and students in the medical field. This template effectively presents key advancements and projects in medical technology, using a modern and clear design that is easy to follow. The slides are organized to detail different aspects of technology in healthcare, such as innovation in patient care, technological integration into existing systems, and future trends in the industry. Each section uses vibrant graphics and concise text to highlight important data and statistics, ensuring the information is both accessible and engaging. The color scheme is professionally chosen to represent trust and clarity, utilizing shades of blue and red to differentiate topics effectively. This not only enhances readability but also aligns with the themes of healthcare and technology. This template is a perfect tool for presenting at conferences, in educational settings, or during professional meetings where understanding the impact of technology on healthcare is crucial. It helps to convey complex information in a structured and visually appealing manner, making it an invaluable resource for anyone involved in the health technology sector.


5 diapositivas
Corporate Risk Mitigation Plan Presentation
Visualize your risk strategy with the Corporate Risk Mitigation Plan Presentation. Featuring a segmented umbrella graphic (A–D), this slide is perfect for illustrating coverage areas, response actions, or protection levels. Great for corporate risk managers and planning teams. Editable in PowerPoint, Google Slides, and Canva.


22 diapositivas
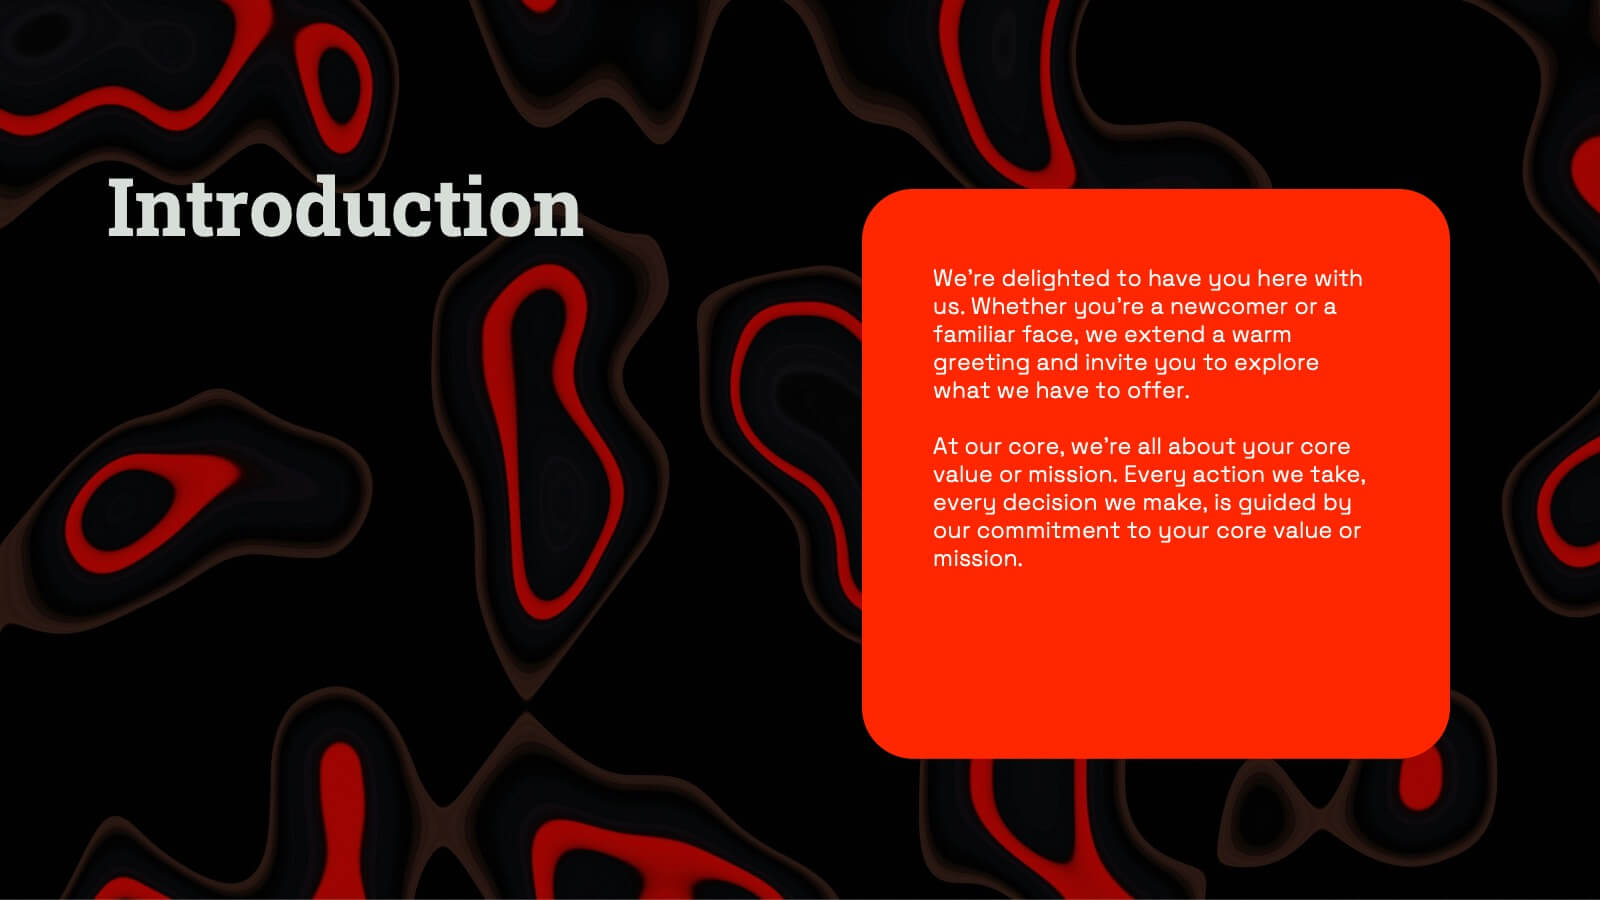
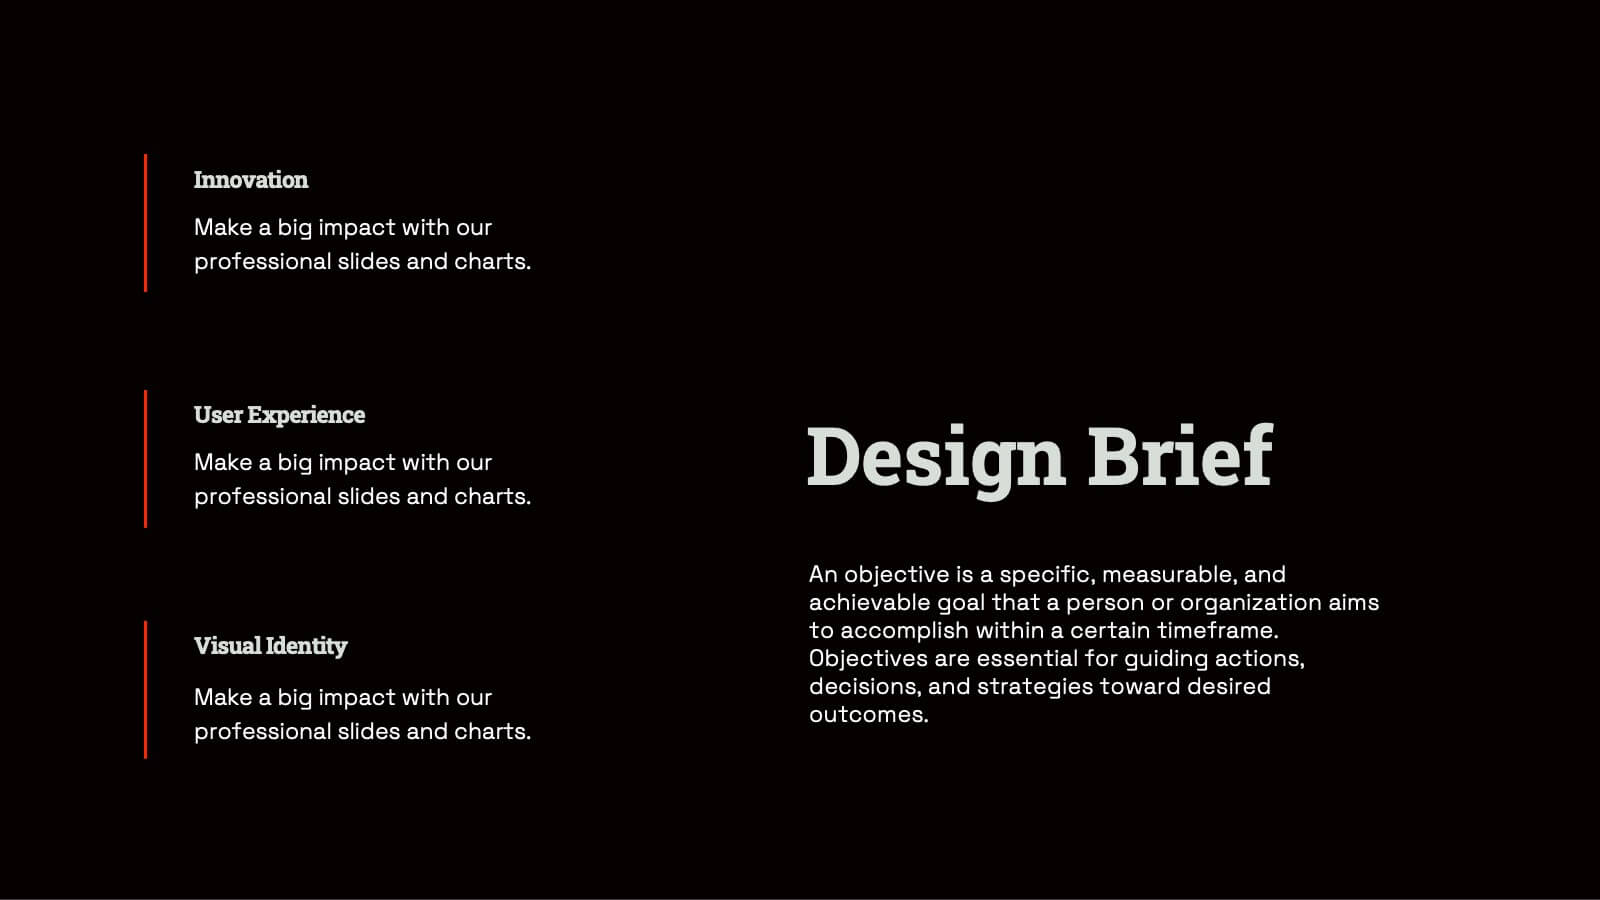
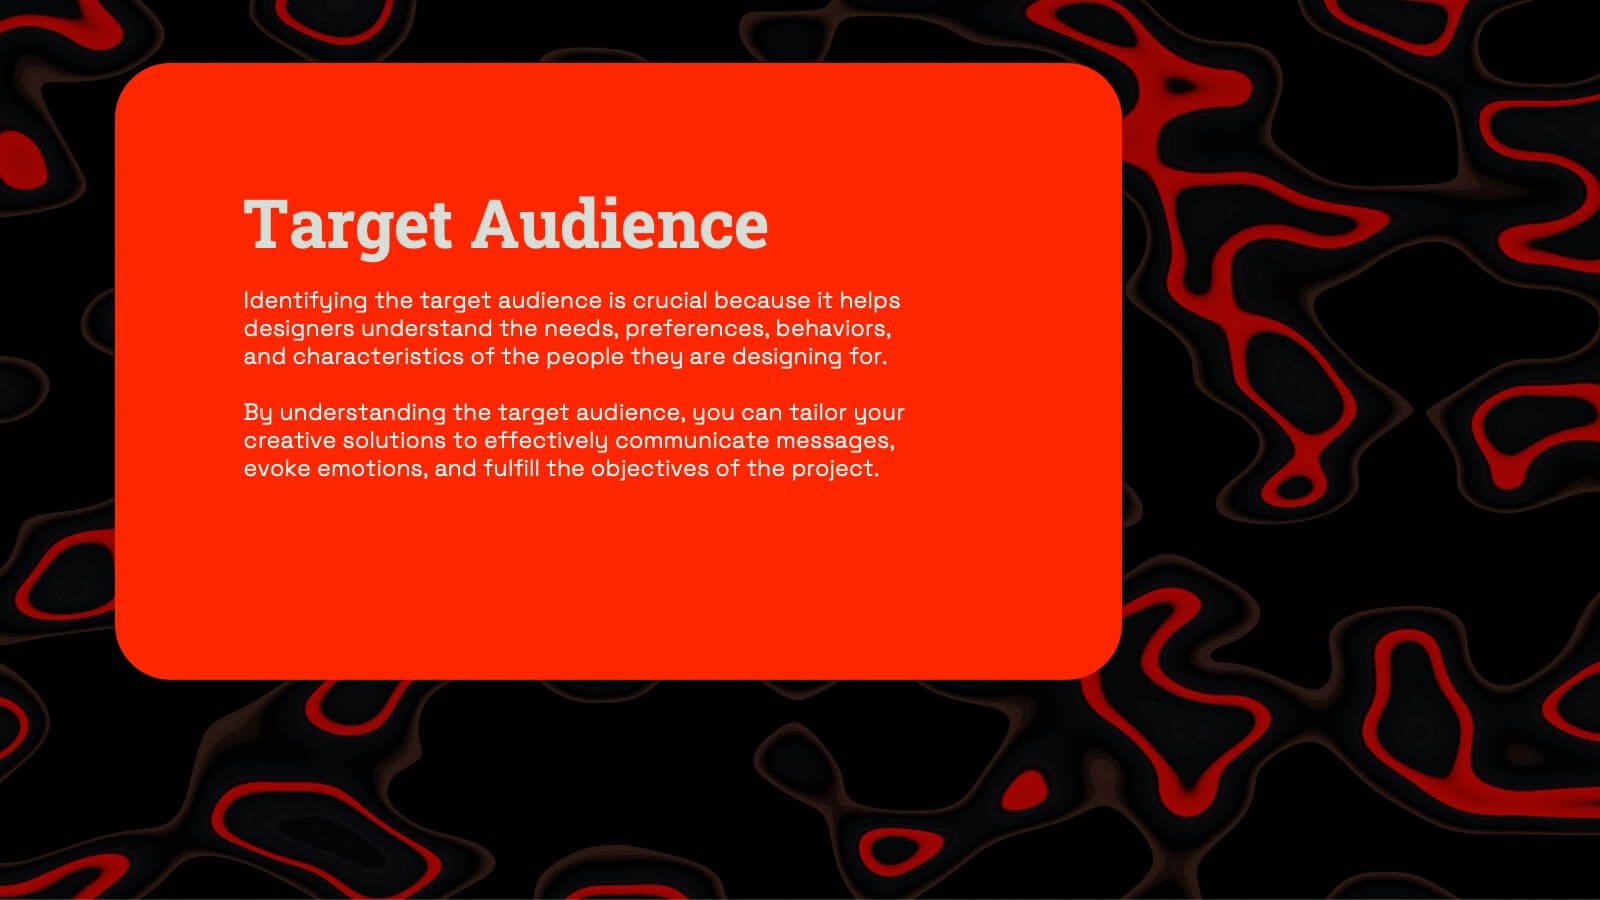
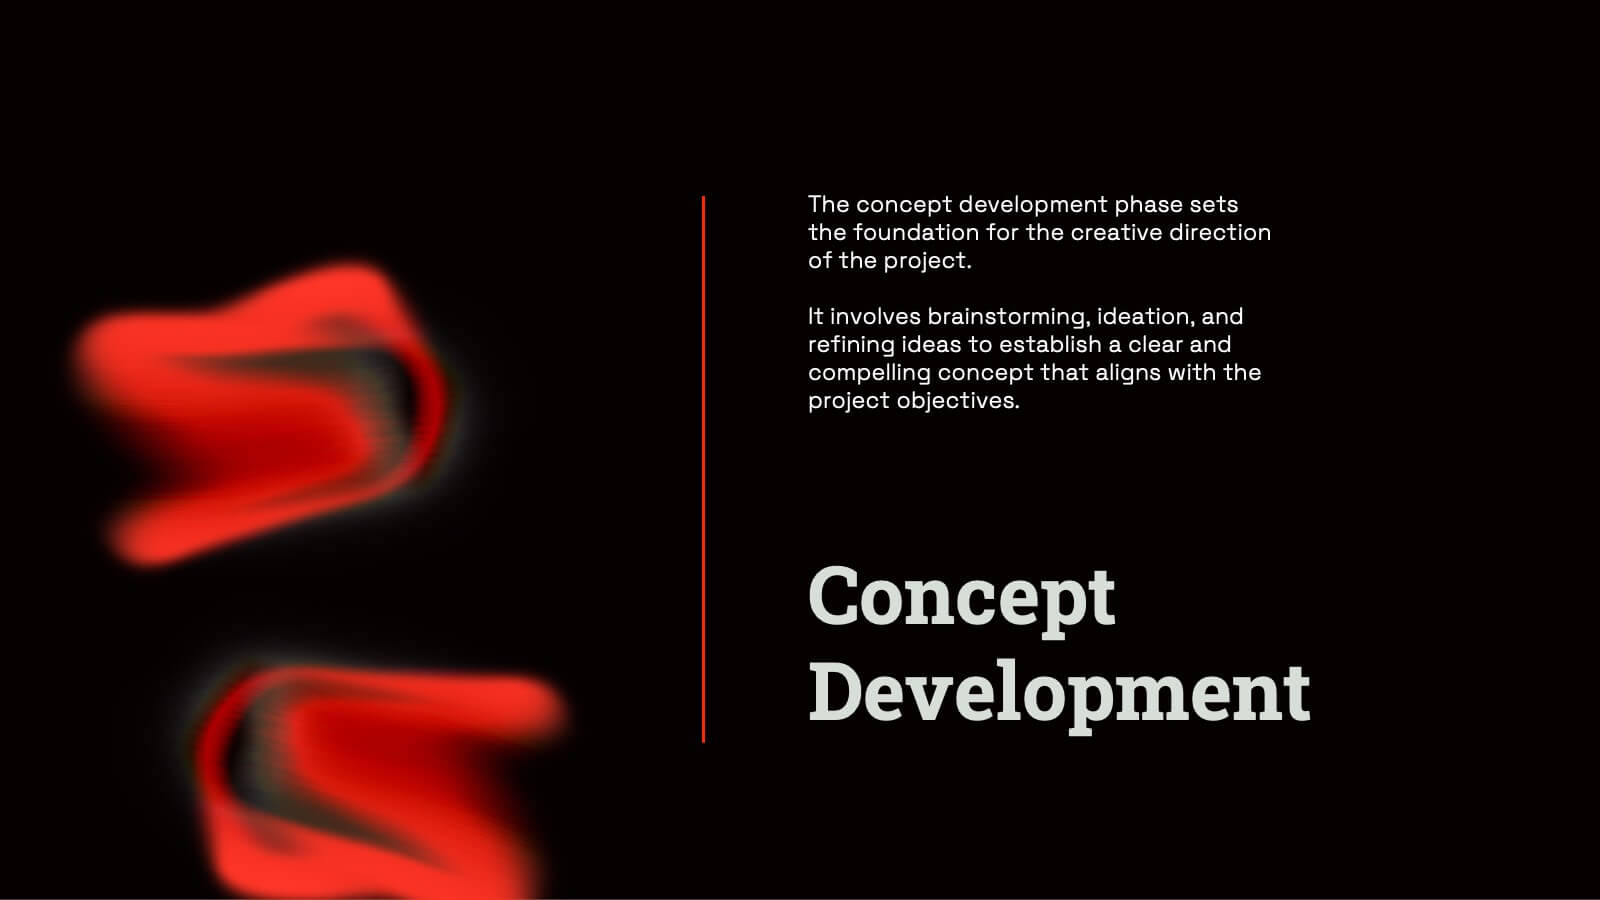
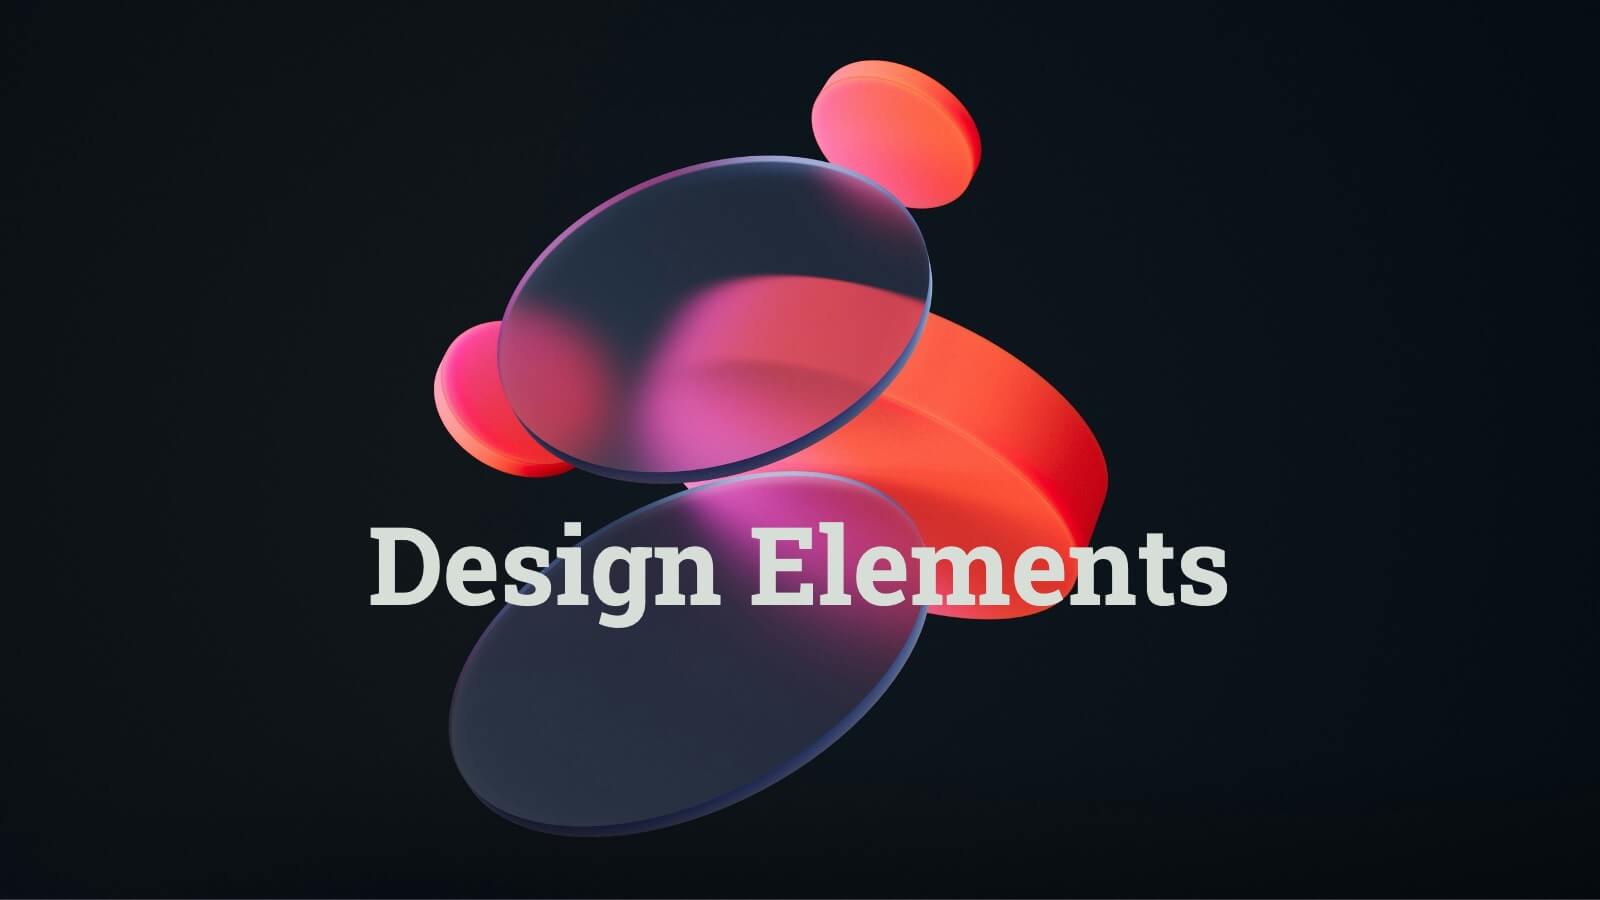
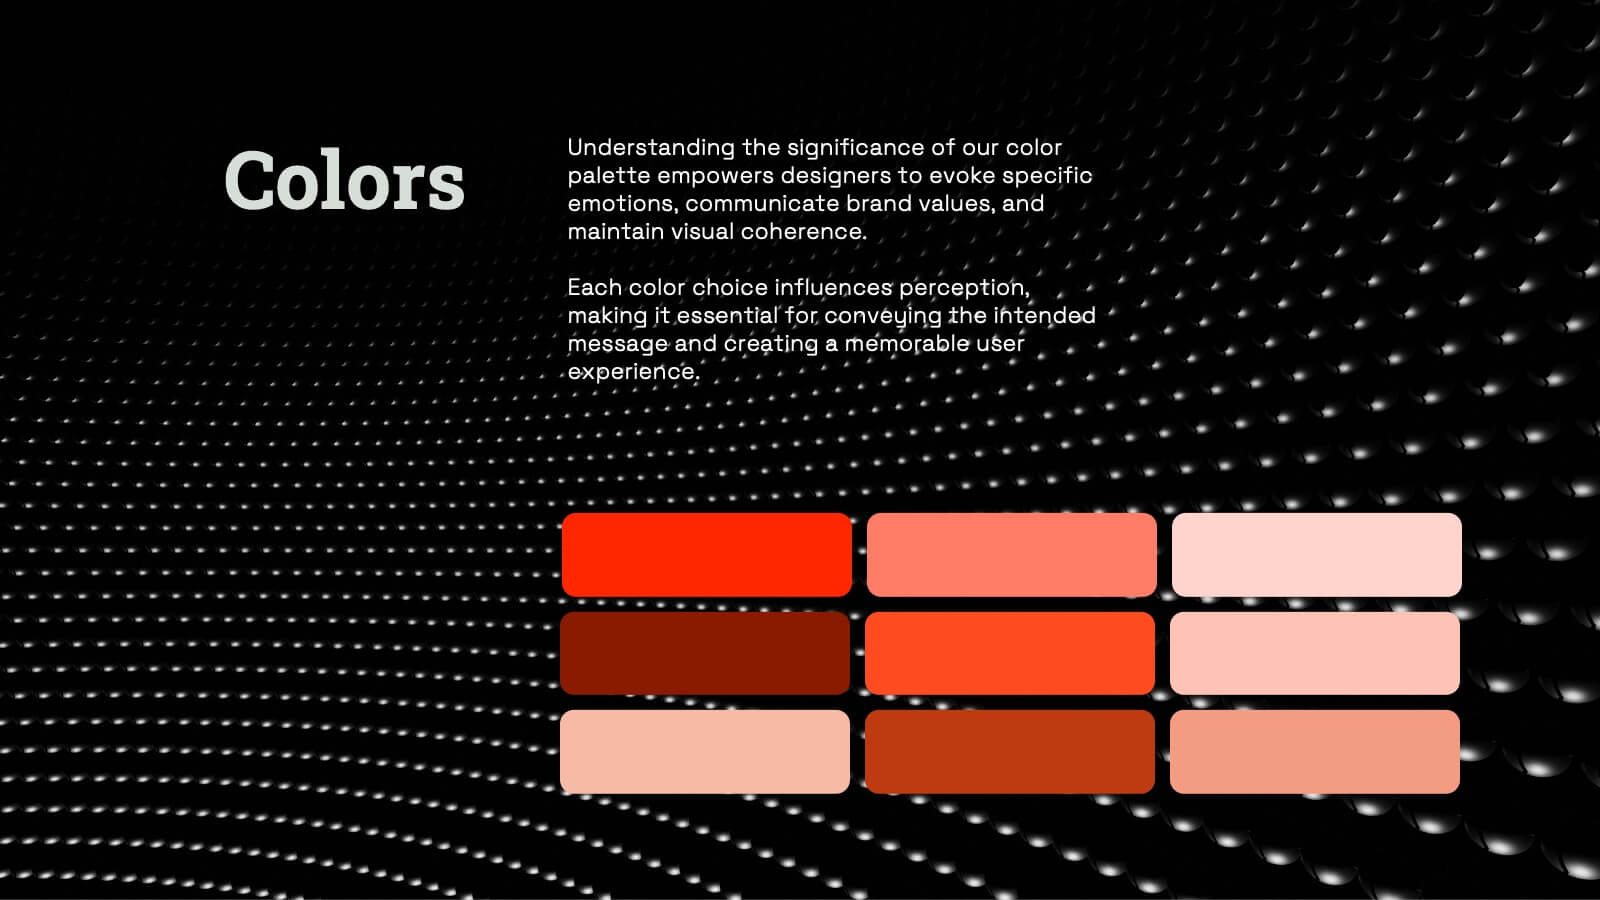
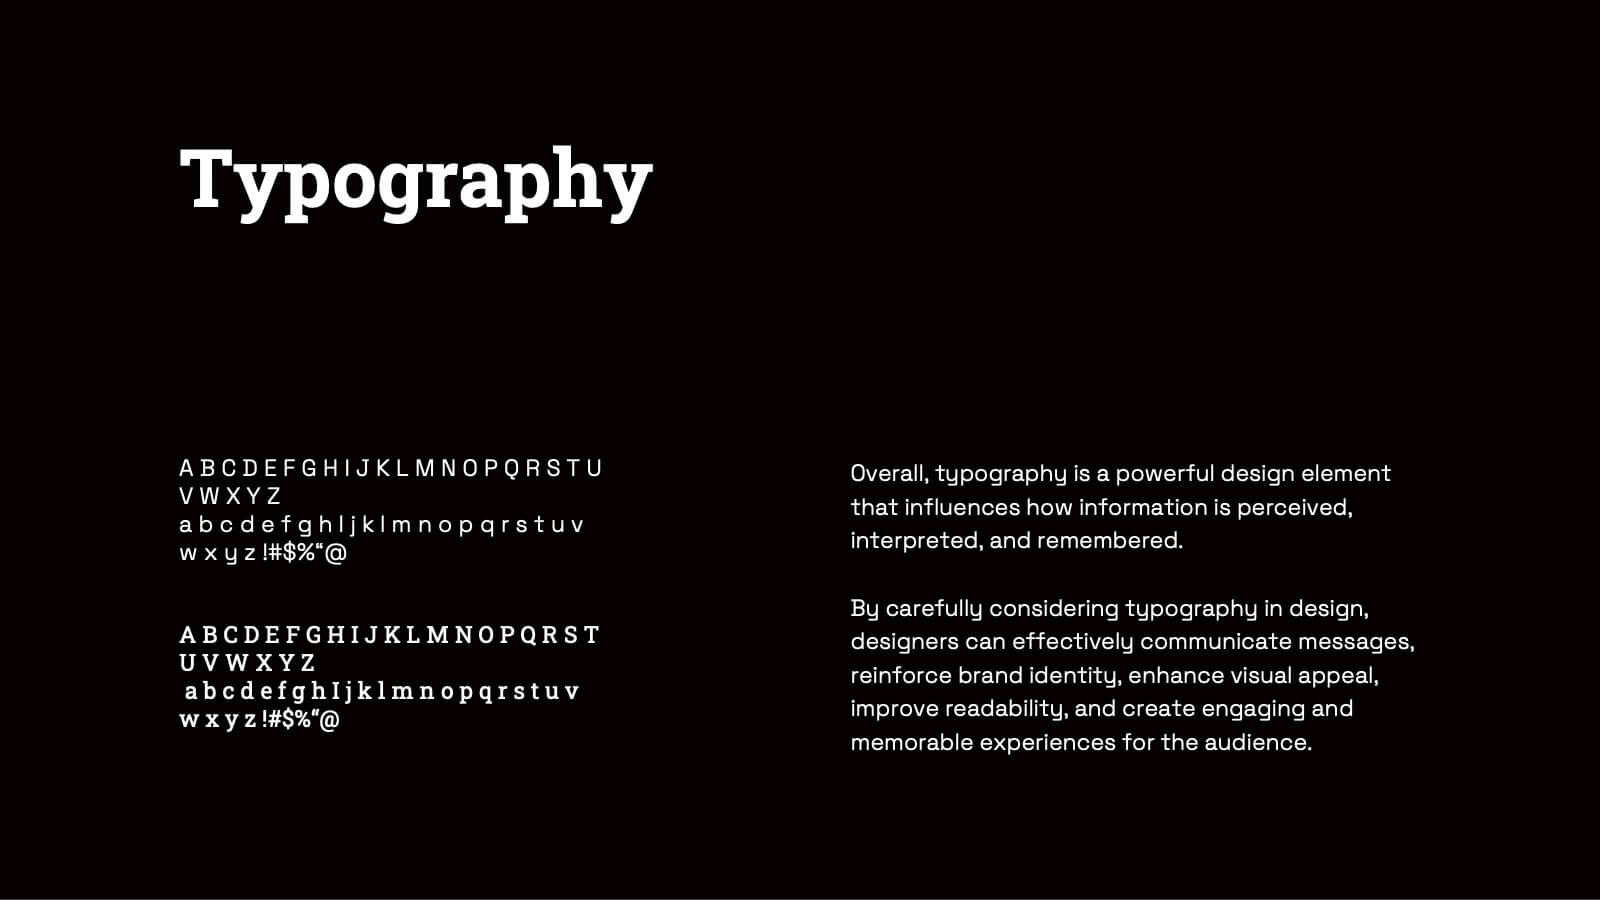
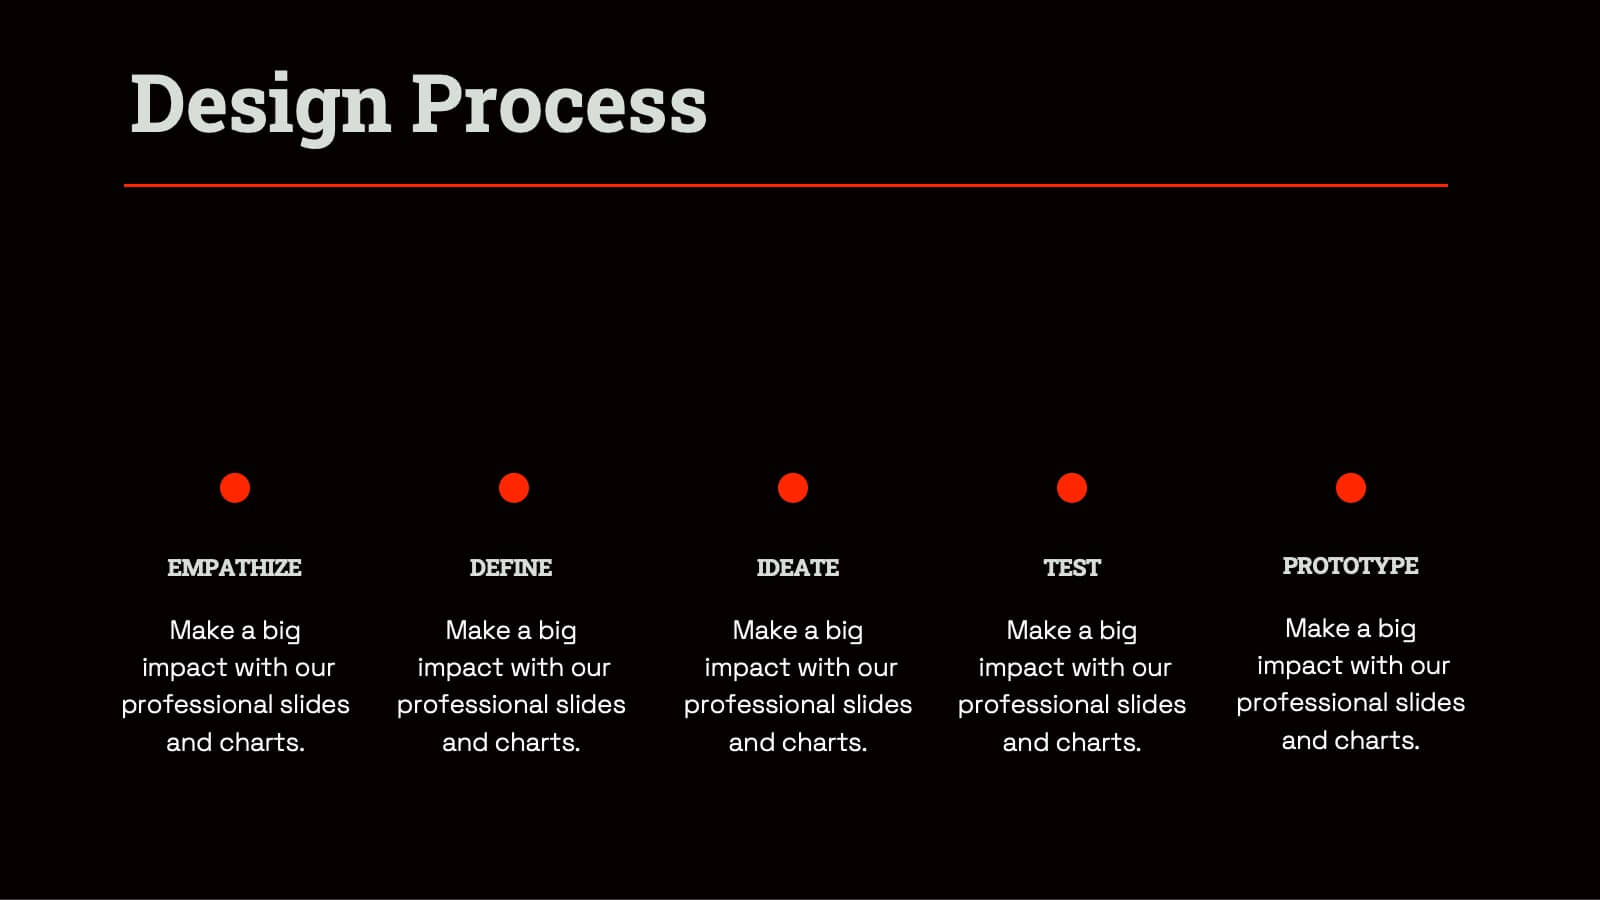
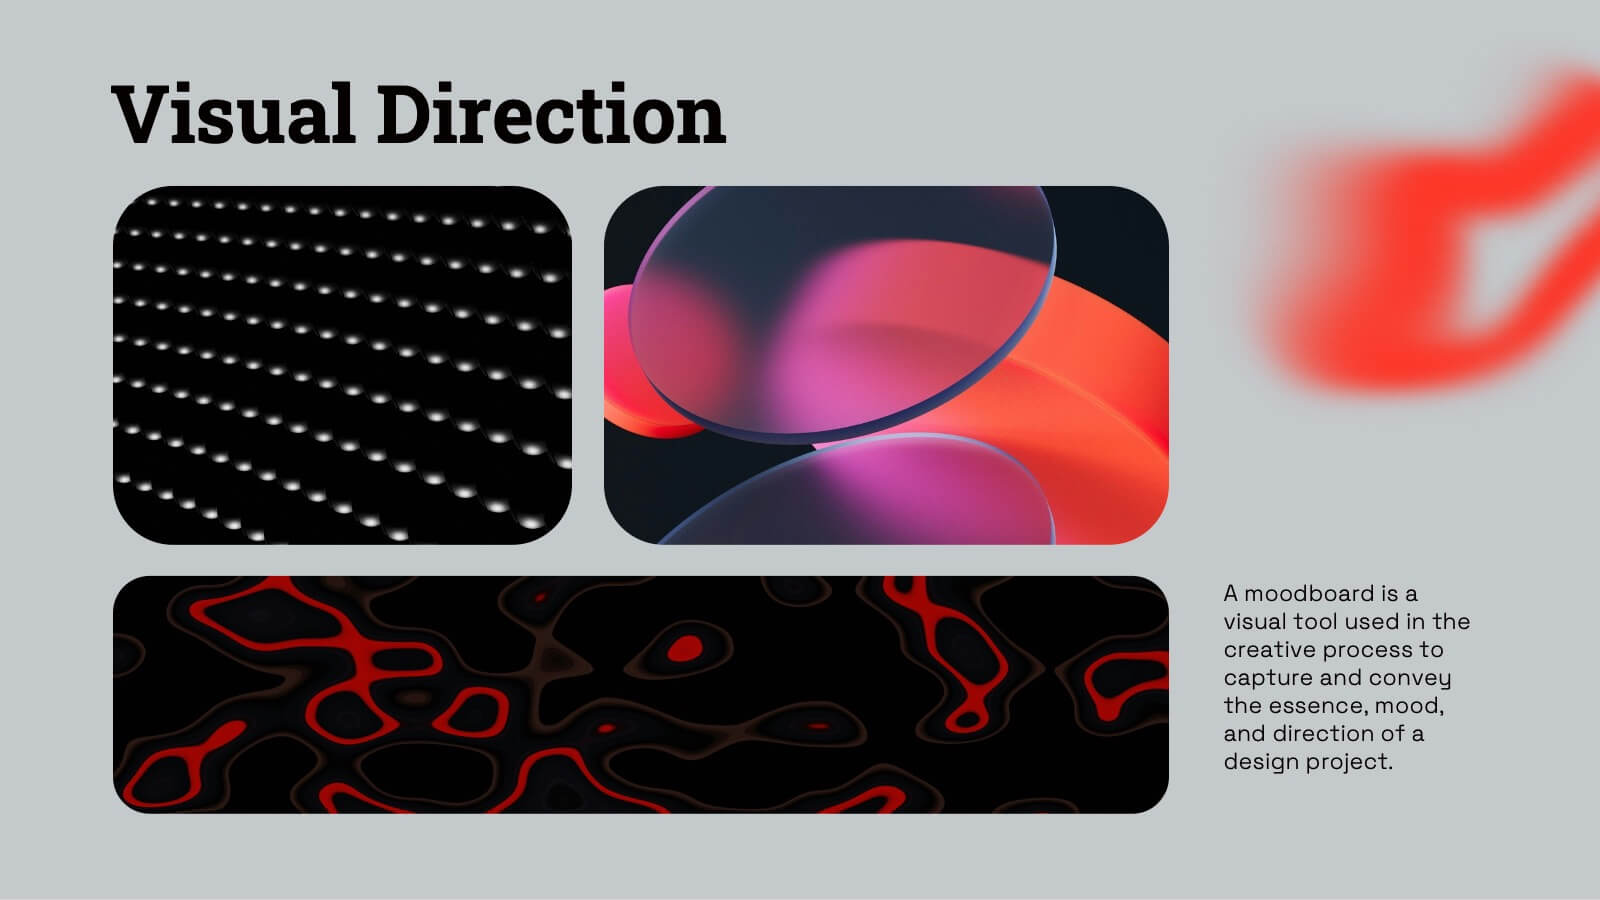
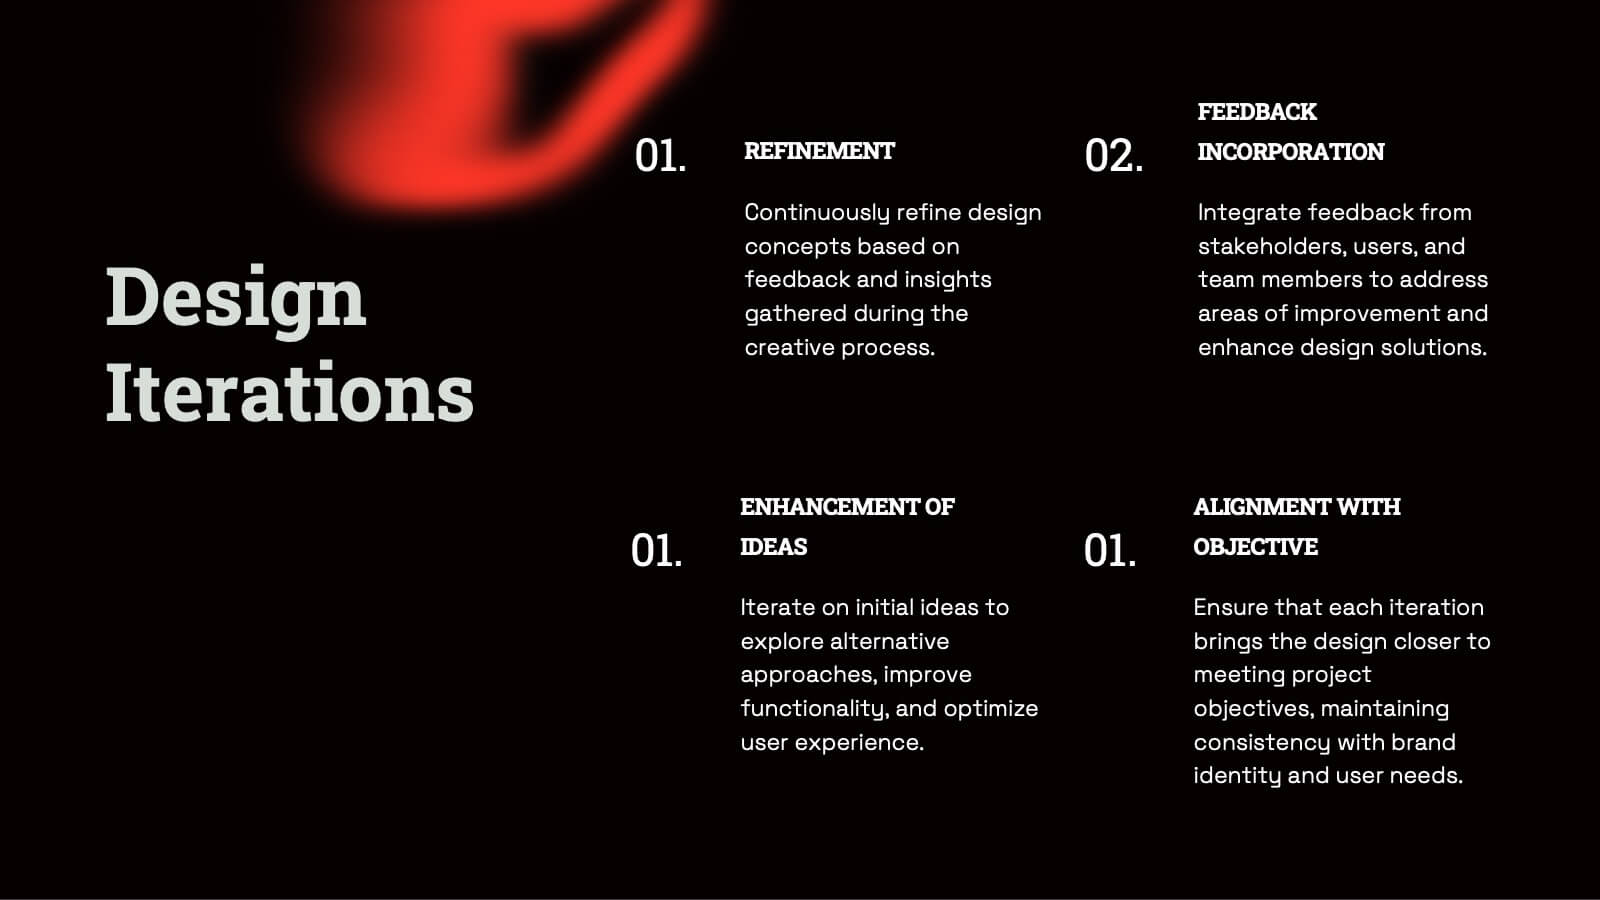
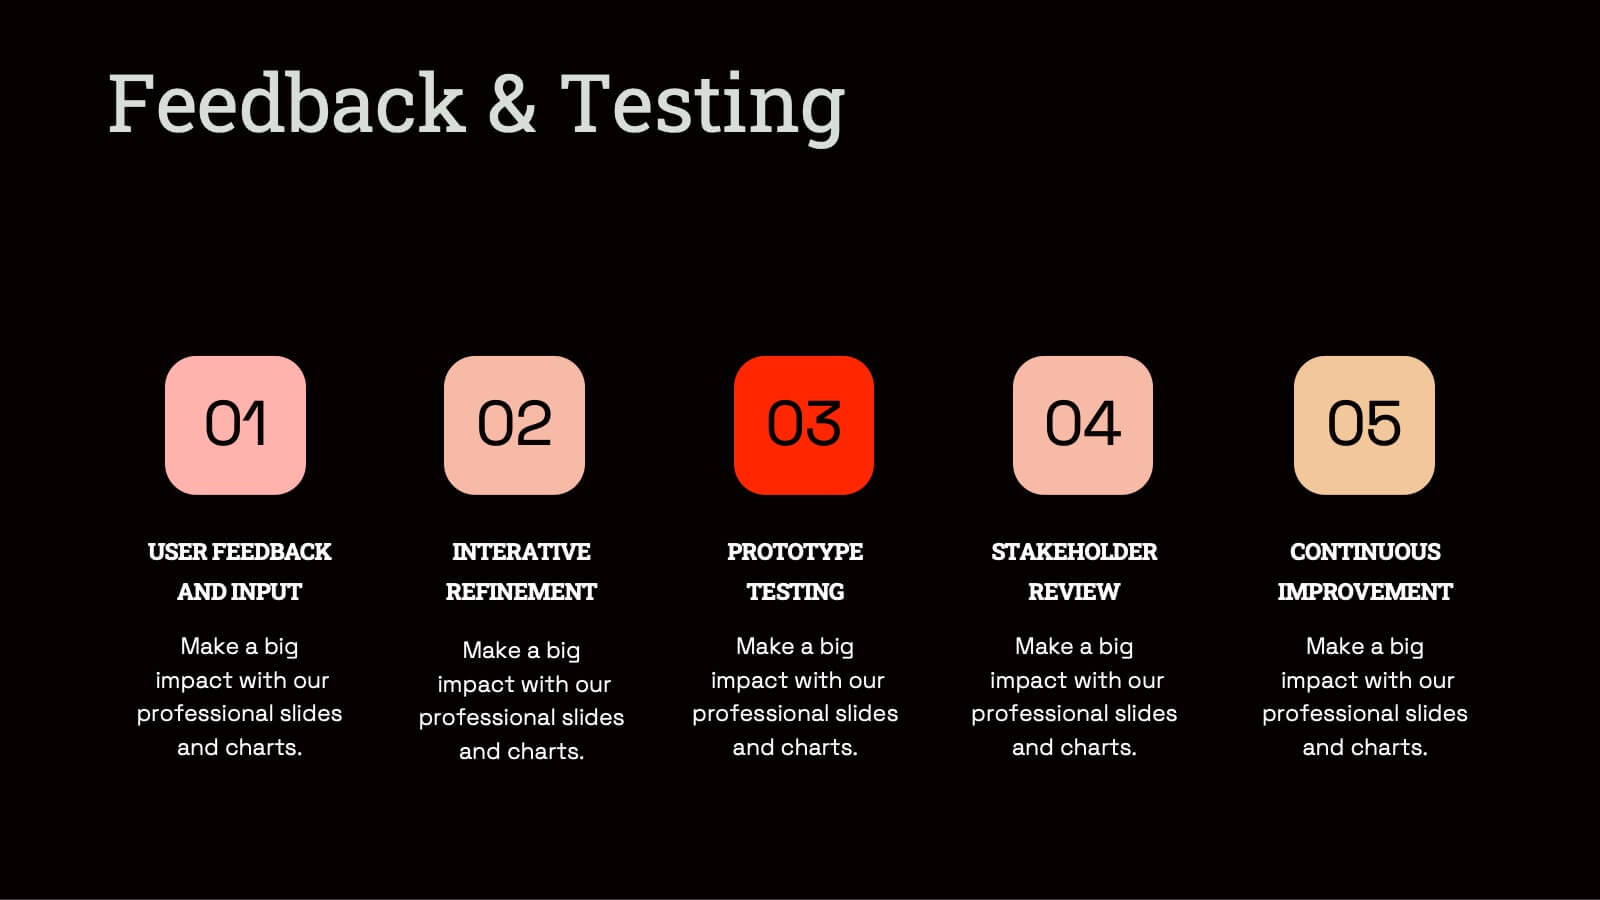
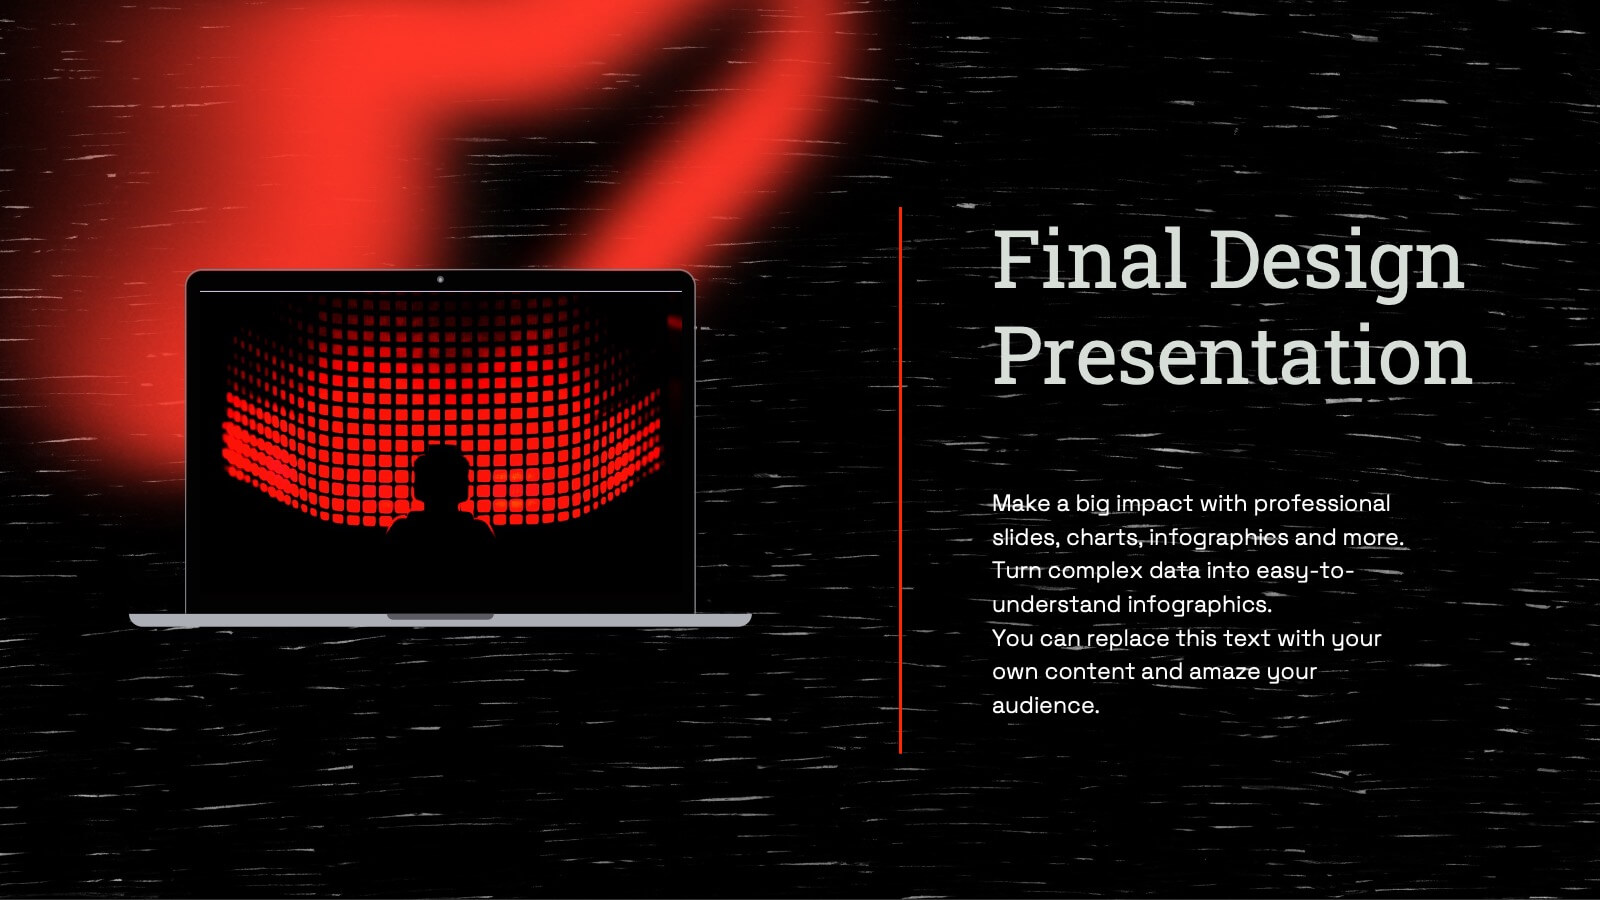
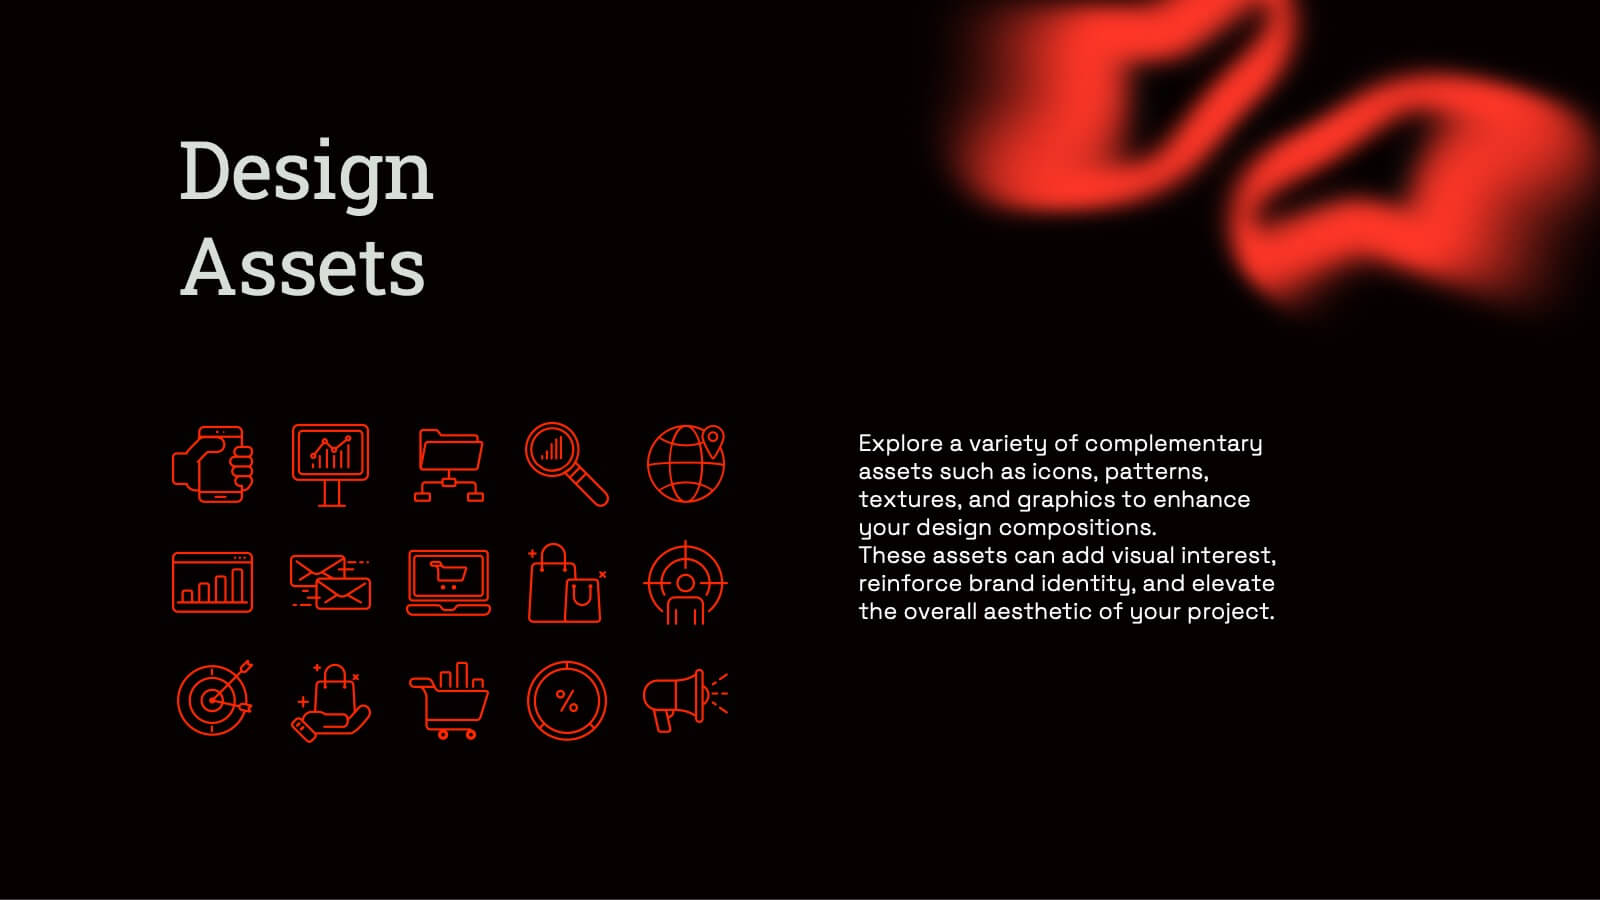
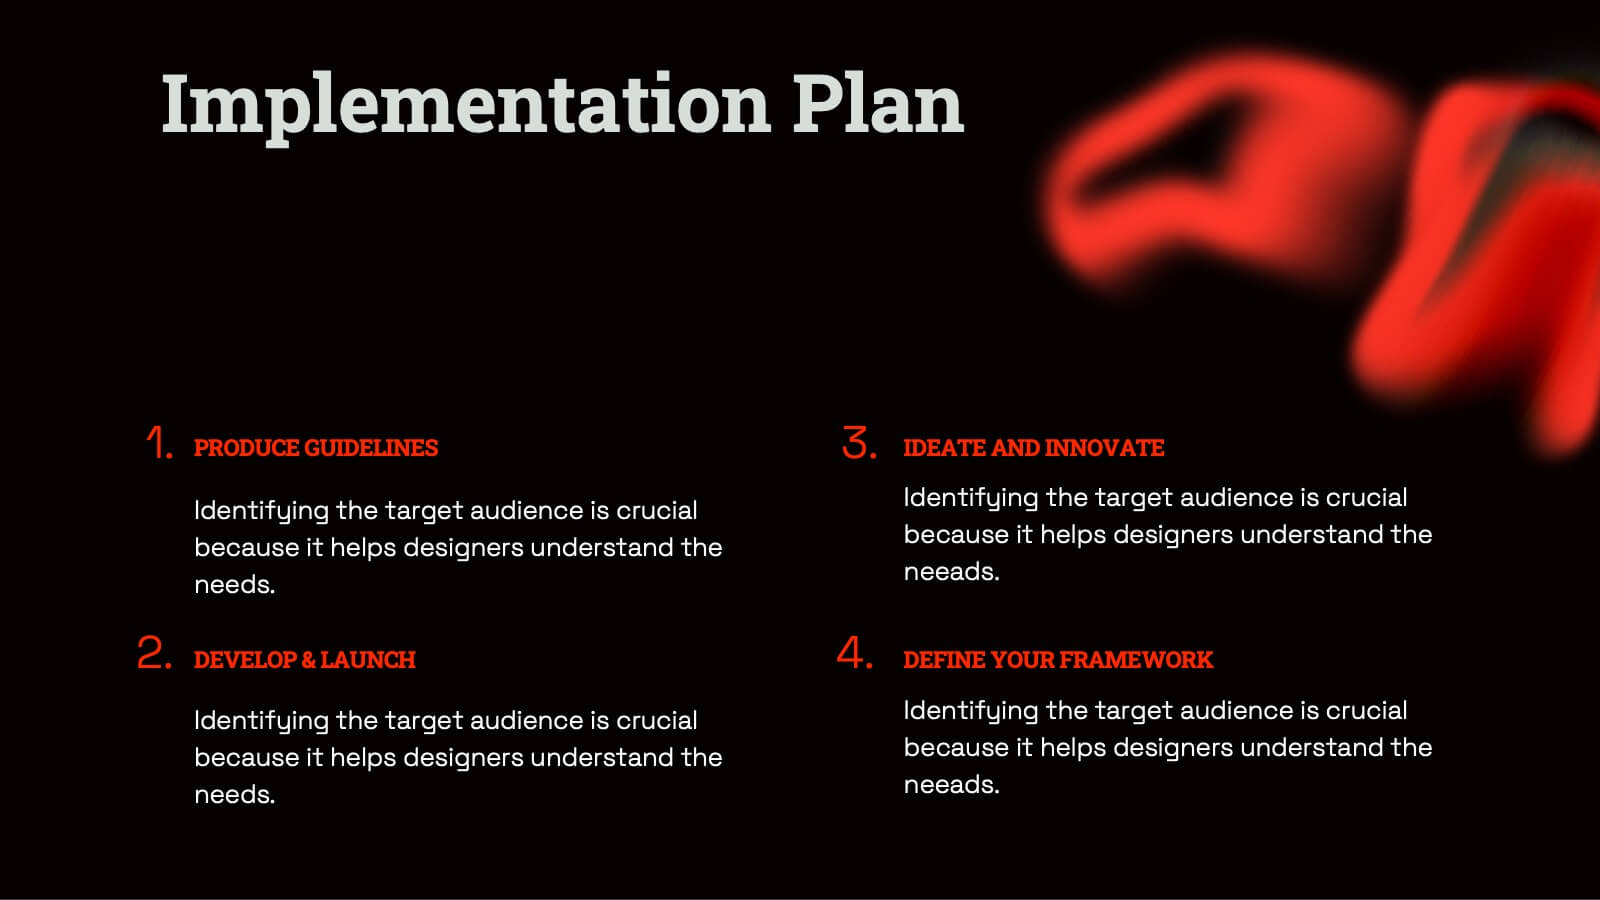
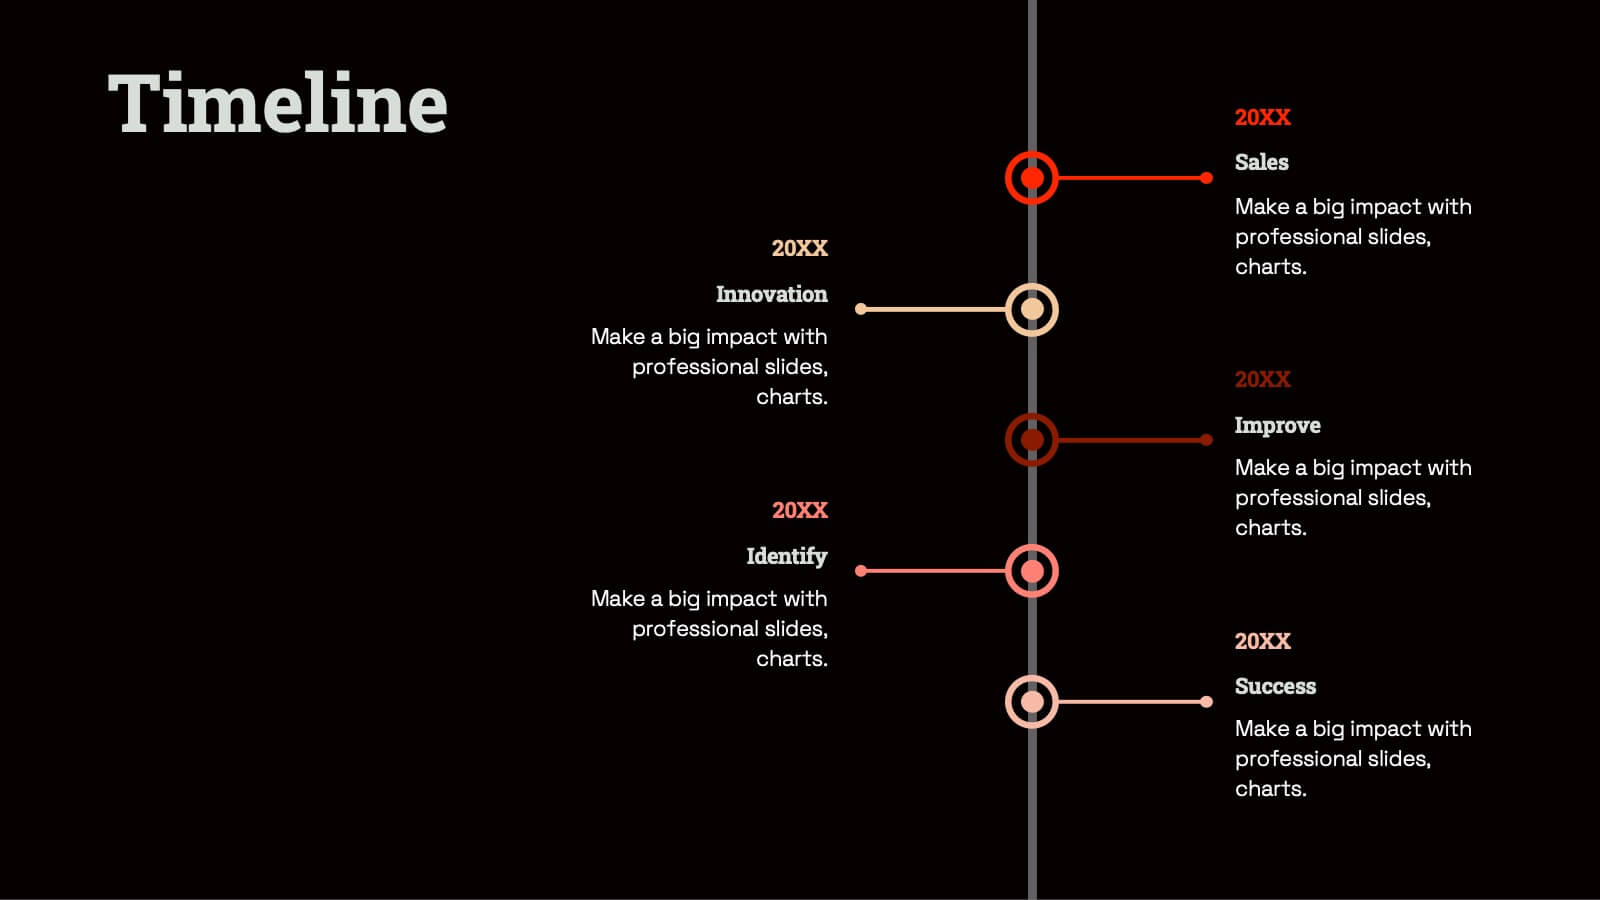
Radiant Graphic Design Project Plan Presentation
Unleash your creativity with this bold and dynamic graphic design project plan template! Perfect for showcasing design elements, textures, and typography, this template guides you through every phase, from concept development and prototyping to feedback and final presentations. Ideal for visual direction and design asset management, it’s fully compatible with PowerPoint, Keynote, and Google Slides for seamless use.


5 diapositivas
Body System Overview Presentation
Visually explain key human body systems with this clean and modern slide. Each section highlights a different organ with labeled points (A–D) for easy reference. Ideal for health education, medical briefings, or anatomy lessons. Fully editable in PowerPoint, Keynote, or Google Slides to suit any professional or academic need.


6 diapositivas
Customer Feedback Insights Chart Presentation
Visualize feedback data effectively with this sleek, horizontal bar chart layout. Highlight percentages per category with bold labels and color accents to emphasize results. Ideal for surveys, product reviews, or satisfaction ratings. Fully customizable in Canva, PowerPoint, or Google Slides for a professional, easy-to-read presentation experience.


4 diapositivas
Income and Expense Highlights Presentation
Enhance learning with the Interactive Digital Learning Experience Presentation. This template mimics a multiple-choice format, making it perfect for quizzes, training modules, or eLearning content. Each slide includes labeled options (A–D) alongside a modern vertical interface, ideal for engaging assessments or lesson recaps. Fully editable in Canva, PowerPoint, Keynote, and Google Slides.


26 diapositivas
Transportation and Logistics Company Profile Presentation
Delve into the fast-paced realm of Transportation and Logistics, the backbone of global commerce. Our vibrant template captures this essence with a lively mix of yellow, blue, orange, and purple. Precision-crafted, it comes alive with industry-specific graphics, adaptable icons, and purpose-built image placeholders. Seamless compatibility ensures smooth sailing whether you're on Powerpoint, Keynote, or Google Slides. Tailored for businesses, it's the go-to choice for presenting company profiles within the transportation sector. Don't just inform; captivate and inspire your audience. Elevate your presentation game today!


26 diapositivas
Corporate Social Responsibility (CSR) Presentation
Make a difference with our Corporate Social Responsibility (CSR) presentation template, perfect for PowerPoint, Keynote, and Google Slides. This template is designed for leaders and organizations committed to ethical practices, environmental stewardship, and community engagement. Our CSR template empowers you to showcase your company's commitment to social responsibility. It provides a structured format to present your sustainability efforts, ethical initiatives, and community projects. It helps you to communicate the value of CSR to stakeholders and illustrates how responsible business practices contribute to overall success. With customizable visuals, you can highlight your CSR achievements and goals, fostering transparency and trust. This template is SEO-optimized, ensuring that your message of commitment to social responsibility reaches a broad audience. Use this template to promote your CSR strategy and demonstrate how your organization is playing a pivotal role in building a sustainable and equitable future.


21 diapositivas
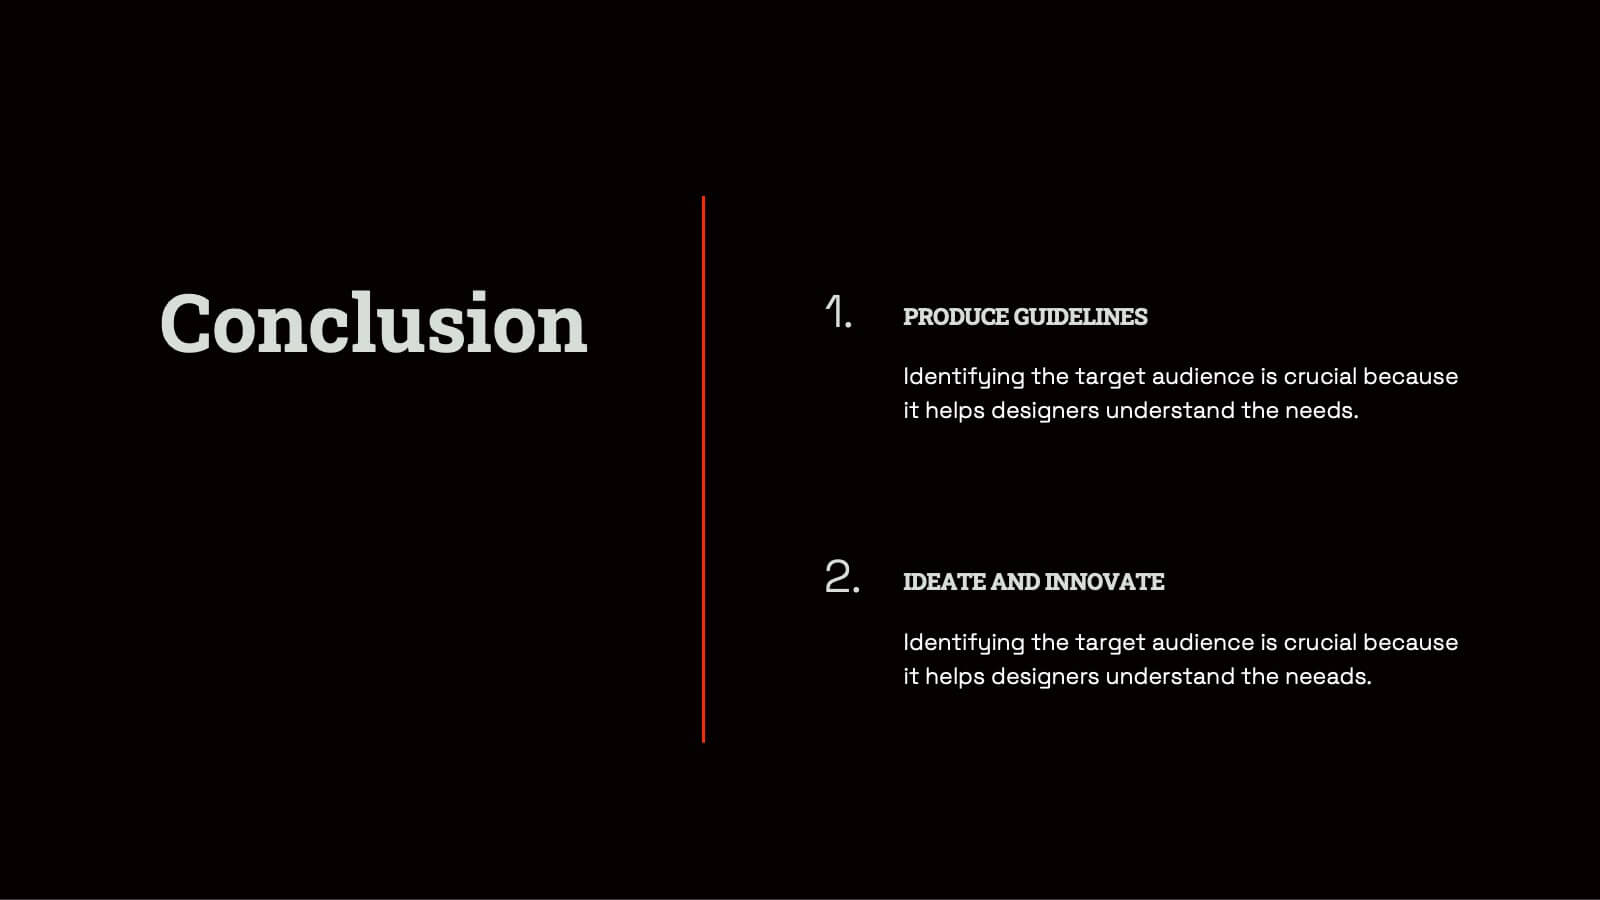
Alchemos UX Case Study Presentation
Showcase your UX process with clarity and impact using this sleek case study presentation. Covering key aspects like user research, interaction design, prototyping, and responsive design, this template helps you tell a compelling design story. Fully customizable and compatible with PowerPoint, Keynote, and Google Slides for a seamless presentation experience.


6 diapositivas
Business Security Compliance Presentation
Visualize your security framework with this clear and modern infographic layout. This slide is ideal for presenting compliance steps, risk assessments, or regulatory requirements, featuring a shield-centered hub with 5 editable sections. Customize easily in PowerPoint, Keynote, or Google Slides.


5 diapositivas
North America Business Landscape Map Presentation
Explore the business terrain with the "North America Business Landscape Map" template, which delivers a comprehensive visualization of business data across various regions. Designed for strategic presentations, it enables clear communication of market insights and data points, crucial for decision-making. This template is compatible with PowerPoint, Keynote, and Google Slides, enhancing its utility for professionals in diverse fields.


7 diapositivas
Sustainability Facility Management Infographic
Sustainability management involves integrating sustainable practices and principles into the strategies, operations, and culture of an organization. This infographic template is a guided tour through sustainable practices, showcasing how facility management can harmoniously coexist with the environment. Compatible with Powerpoint, Keynote, and Google Slides. Fully customizable, easily explore this immersive infographic with vibrant visuals and insightful content. This will help cultivate a greater understanding of the vital role that sustainable practices play in facility management.