


Características


¿Tienes alguna pregunta?
Recomendar


6 diapositivas
Food Market Infographic
The food market refers to the industry and marketplace where various food products are produced, processed, distributed, and sold to consumers. This infographic template is designed to provide insights into the food market industry. This aims to showcase key trends, statistics, and market dynamics related to the global food market. Whether used in presentations, reports, or educational material, this infographic will help your audience gain insights into the market, identify growth opportunities, and make informed decisions in the food industry. Compatible with Powerpoint, Keynote, and Google Slides.


20 diapositivas
Firelight Design Portfolio Presentation
This Design Portfolio Presentation Template offers a bold and modern layout to showcase your creative projects, services, and achievements. It features sections for project highlights, awards, client testimonials, and pricing, making it perfect for freelancers and agencies. Fully customizable in PowerPoint, Keynote, and Google Slides.


2 diapositivas
Closing Thank You Message Presentation
Make your final message feel warm, polished, and memorable with a clean, modern layout that blends bold color and imagery. This presentation slide helps you wrap up your content, share final notes, or encourage next steps with clarity and style. Fully editable and compatible with PowerPoint, Keynote, and Google Slides.


6 diapositivas
Innovation Process Infographic
The innovation process refers to the systematic and structured approach that organizations follow to generate, develop, and implement new ideas, products, services, or processes to create value and drive growth. This infographic template visually illustrates the steps involved in the innovation process, from idea generation to implementation. The infographic includes several stages, each with its own set of activities and objectives. The template visuals to simplify complex concepts and guide viewers through the journey of innovation. This is compatible with Powerpoint, Keynote, and Google Slides.


4 diapositivas
Problem Tracing with Fishbone Diagram Presentation
Identify root causes clearly with the Problem Tracing with Fishbone Diagram Presentation. This template features a horizontal, fish-shaped layout with six categories represented in vertical columns, helping you trace issues back to their source. Ideal for quality control, brainstorming, and strategic reviews. Fully editable in PowerPoint, Keynote, and Google Slides.


10 diapositivas
Market Positioning Competitive Analysis
Visually assess your brand’s position in the market with this quadrant-based layout designed for strategic clarity. This slide helps showcase key comparisons across marketing analysis, target audience alignment, unique value proposition, and messaging consistency. Fully editable in PowerPoint, Keynote, and Google Slides.


26 diapositivas
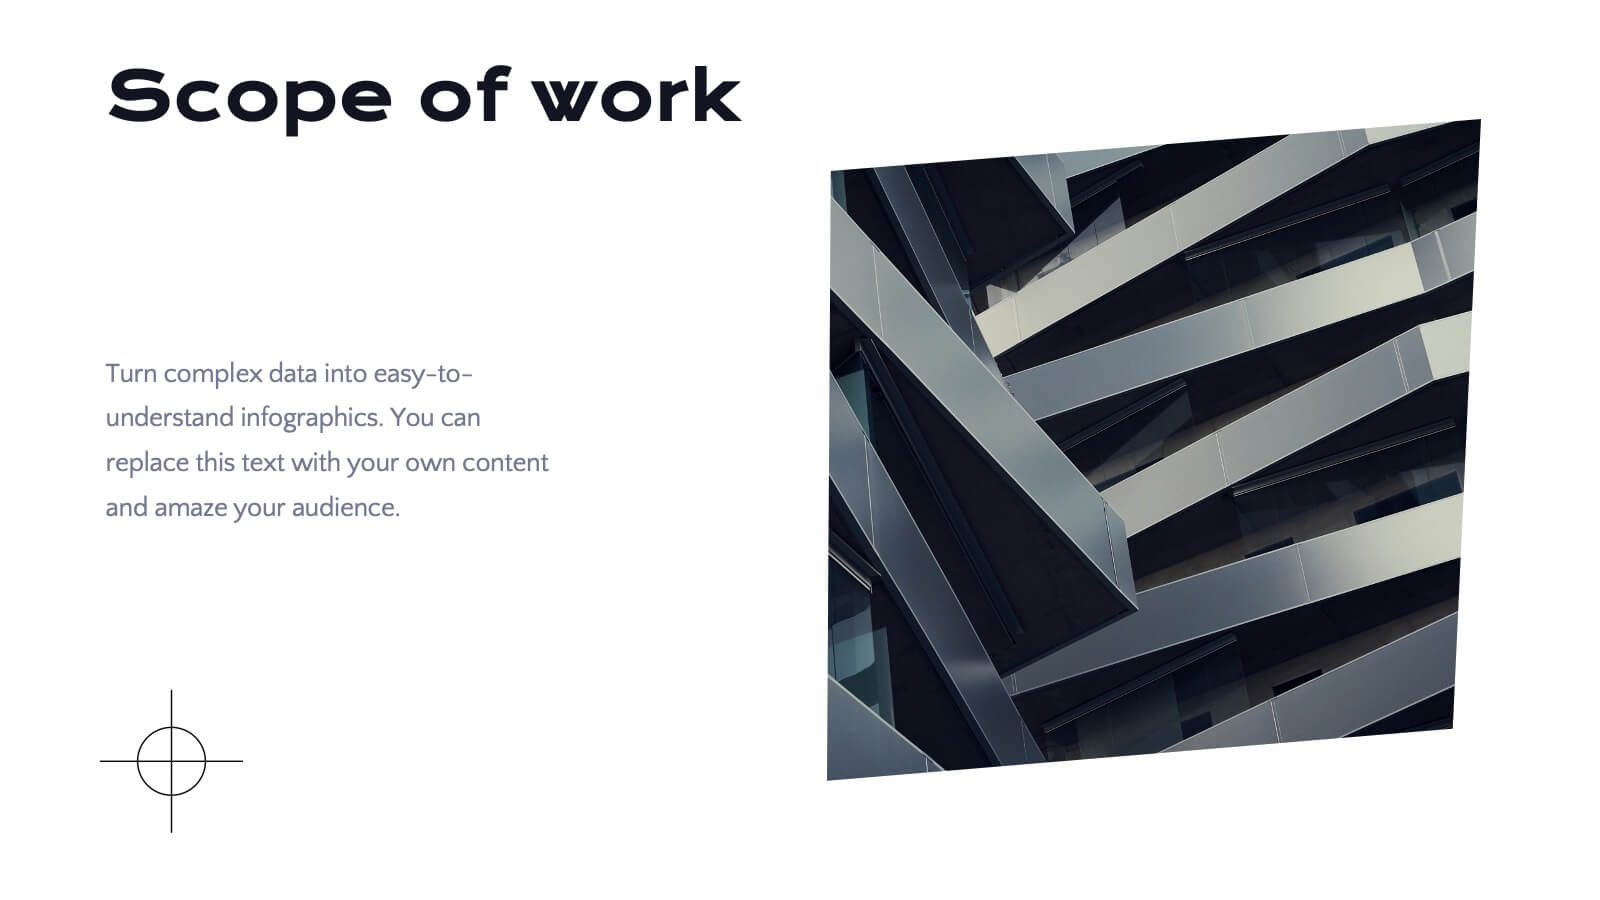
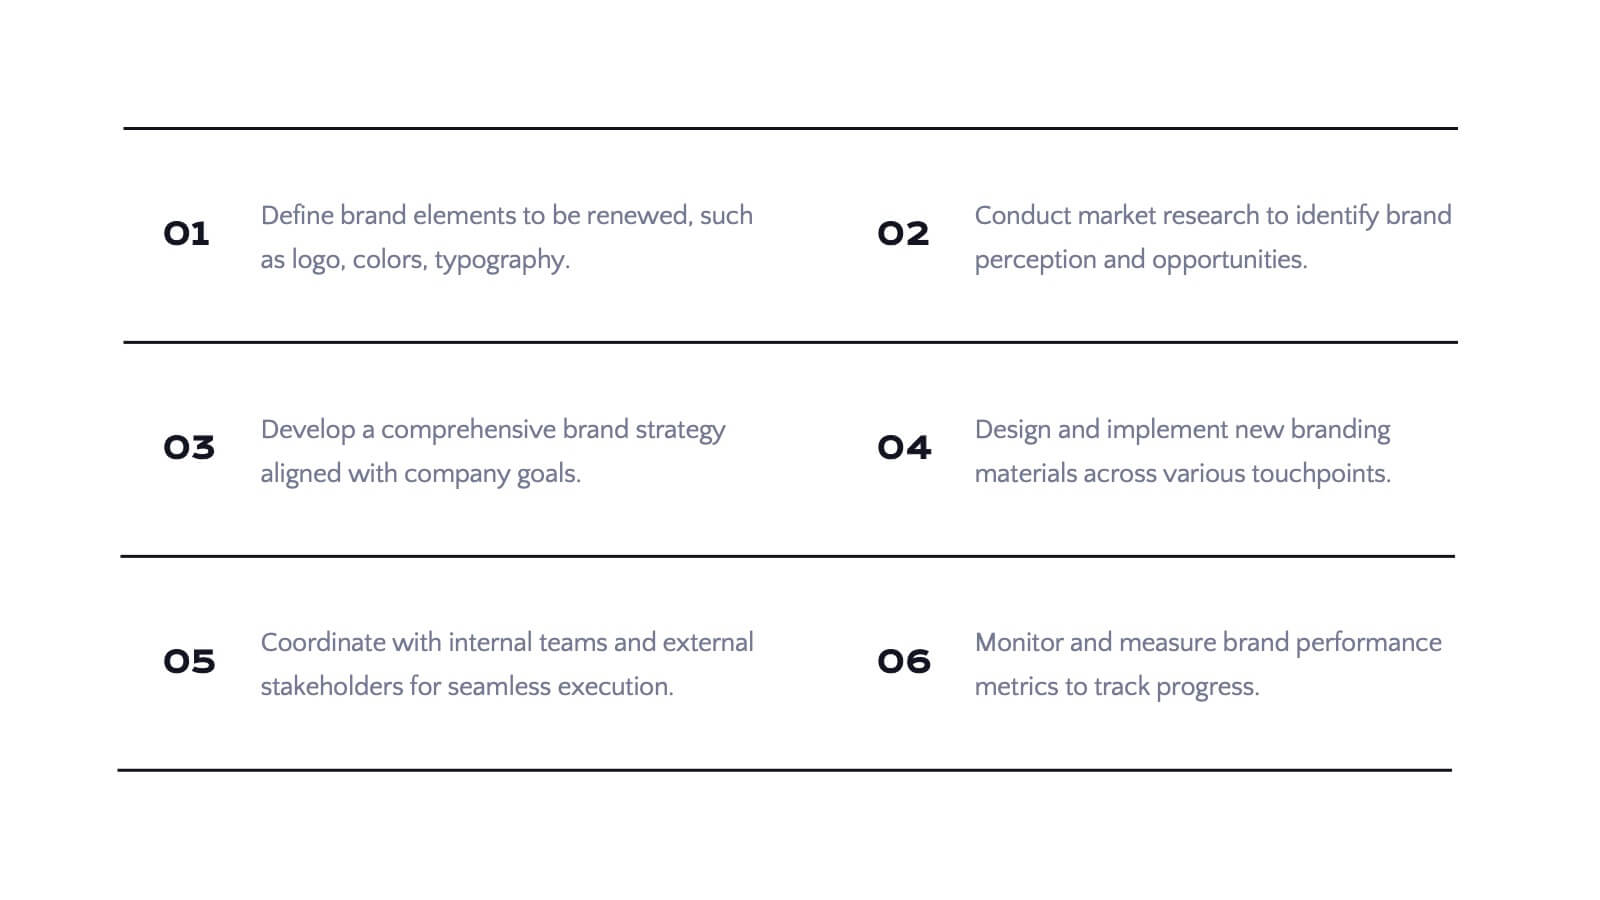
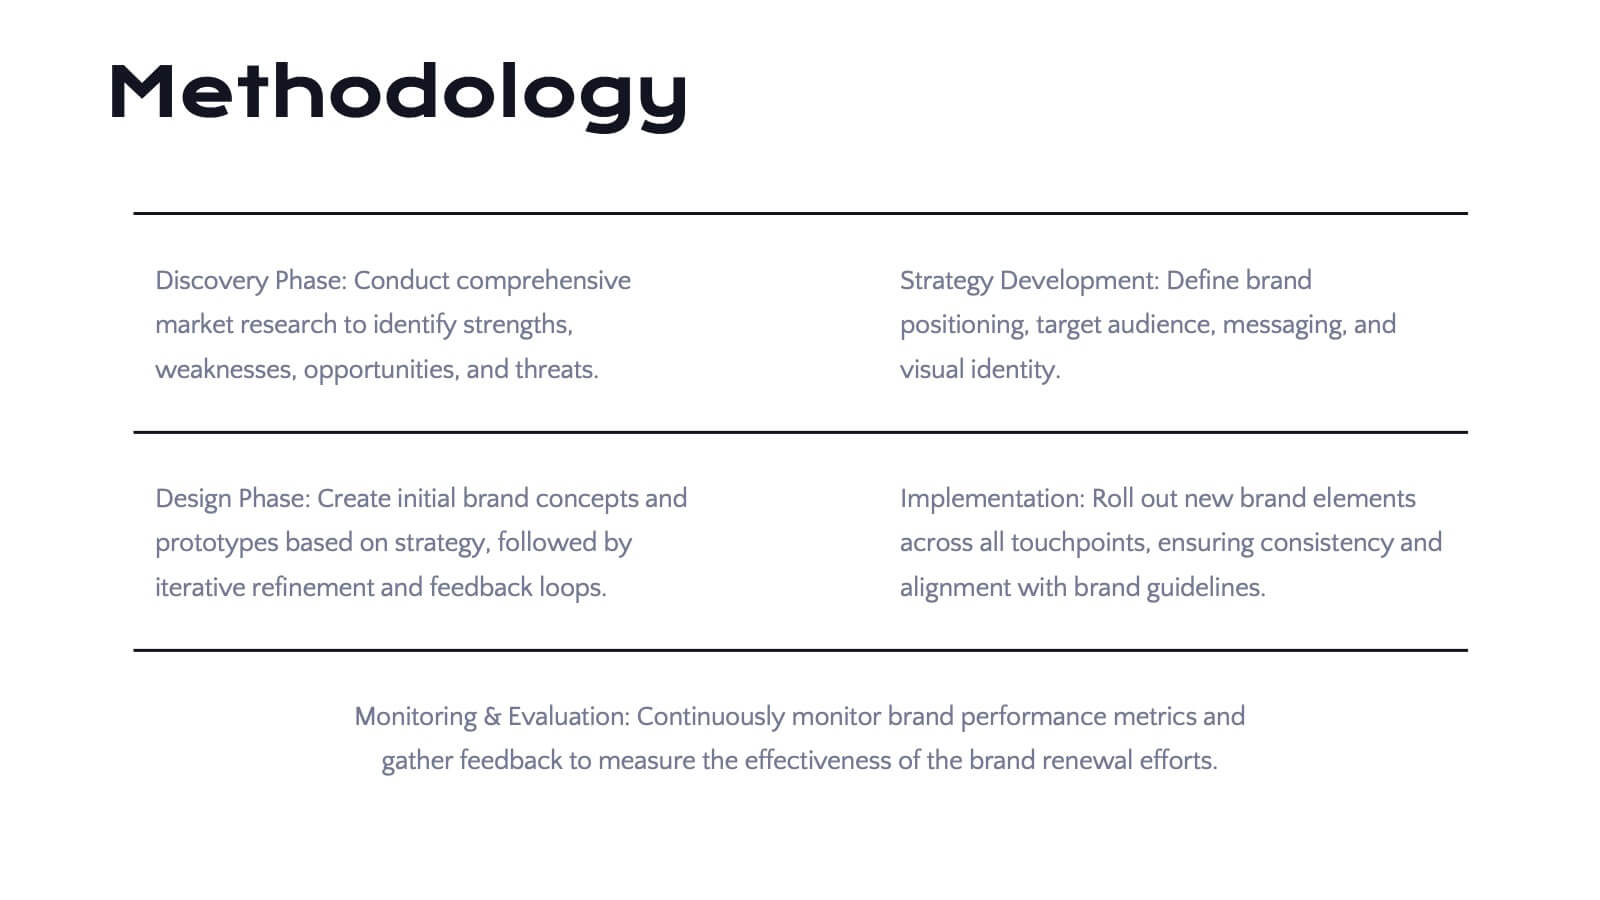
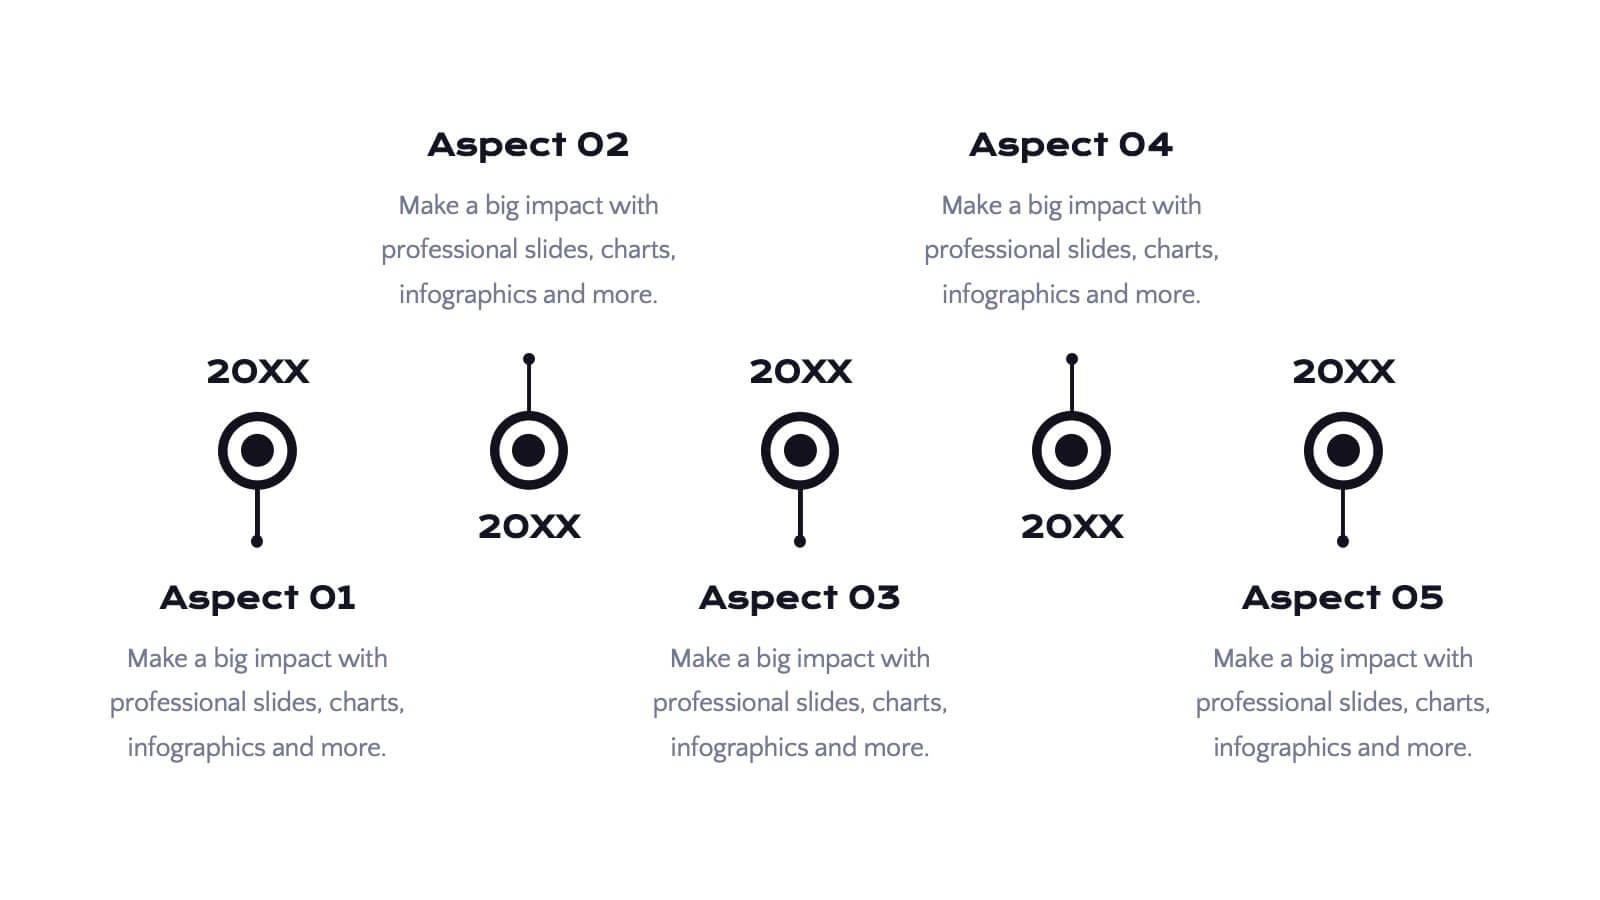
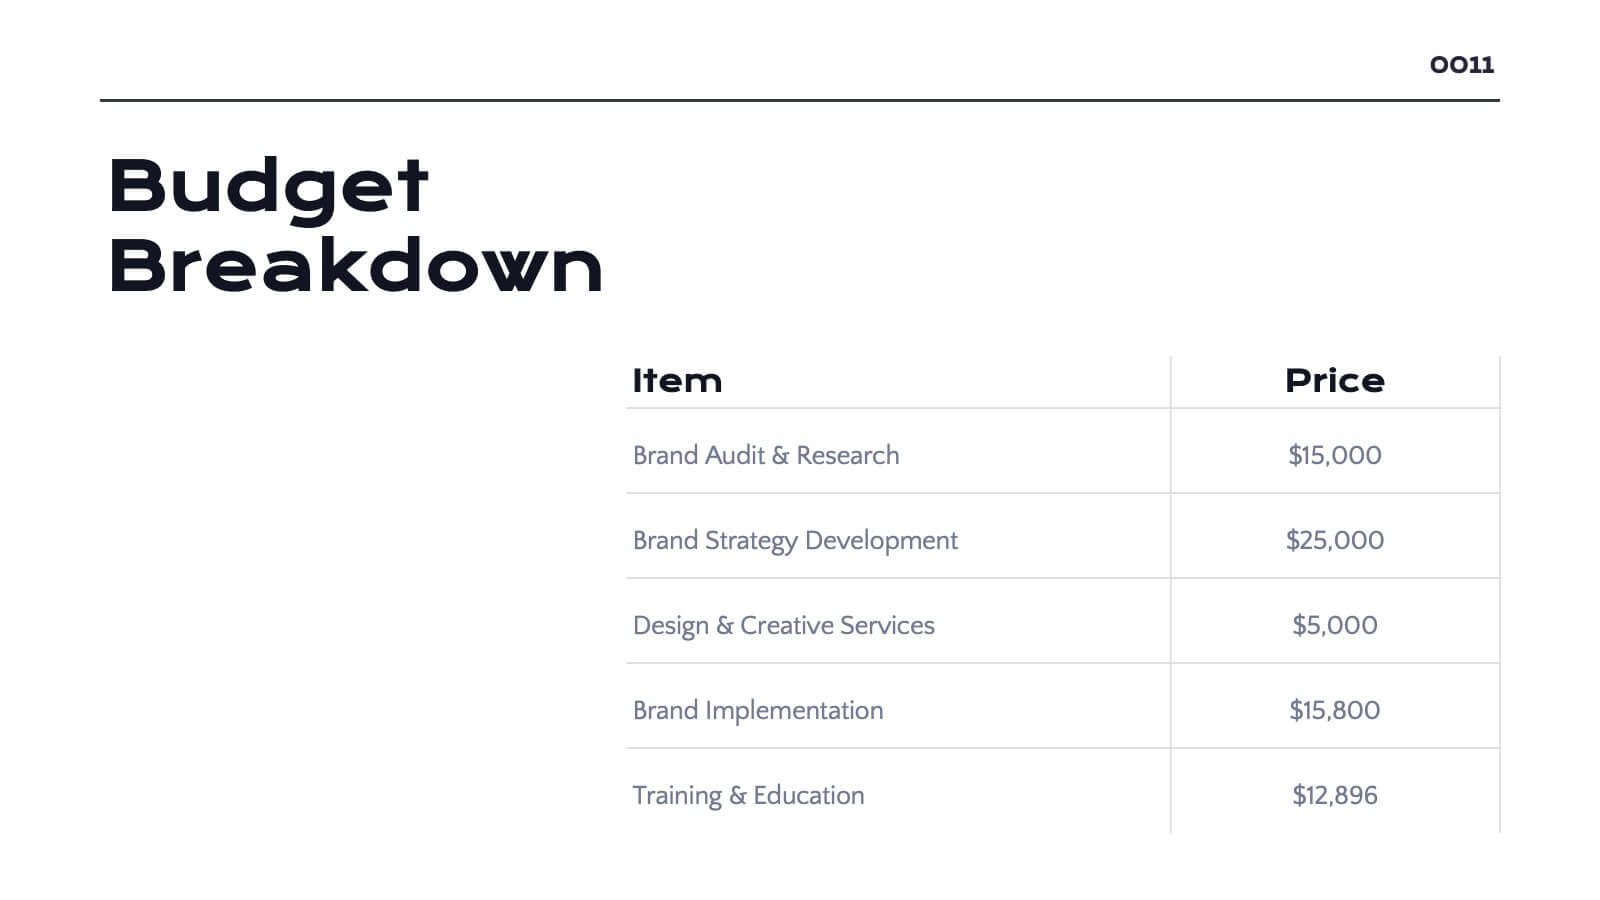
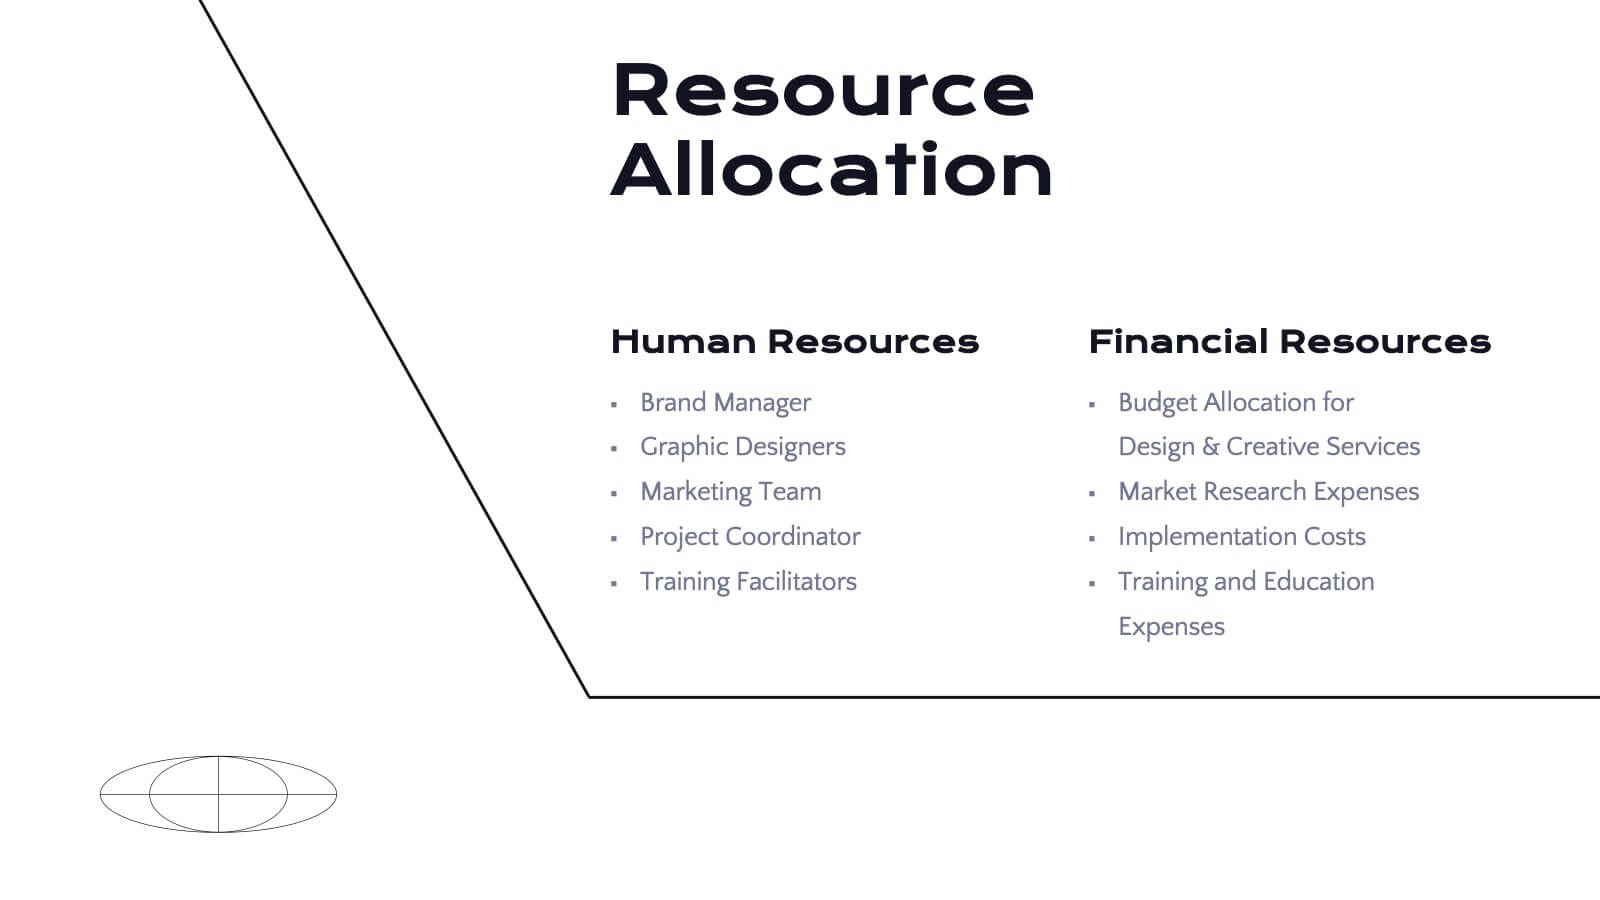
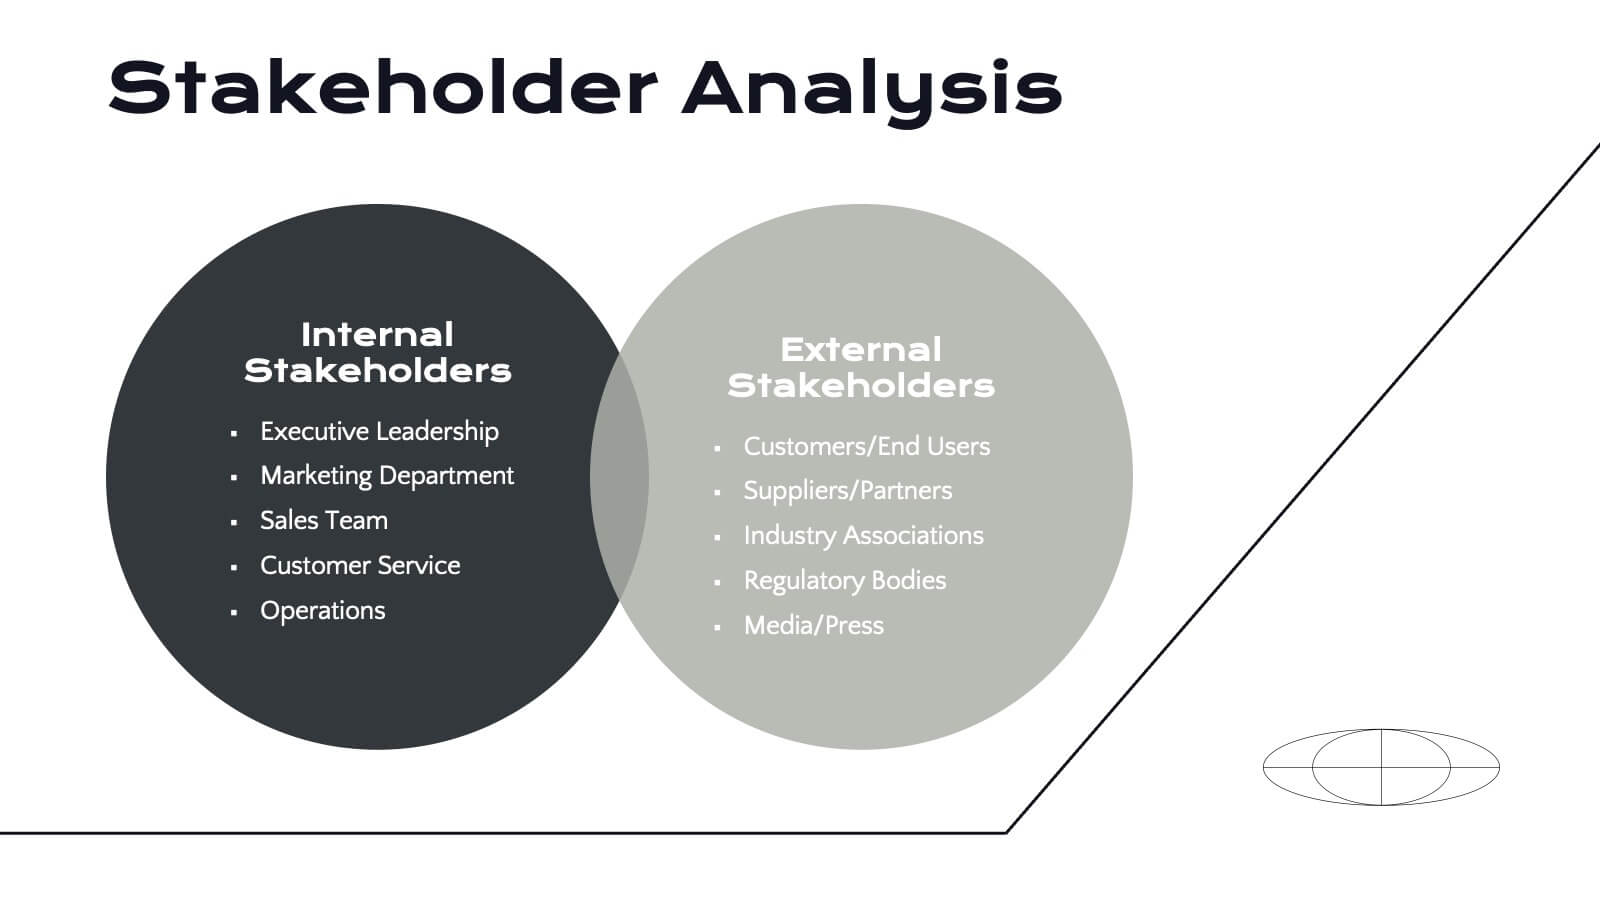
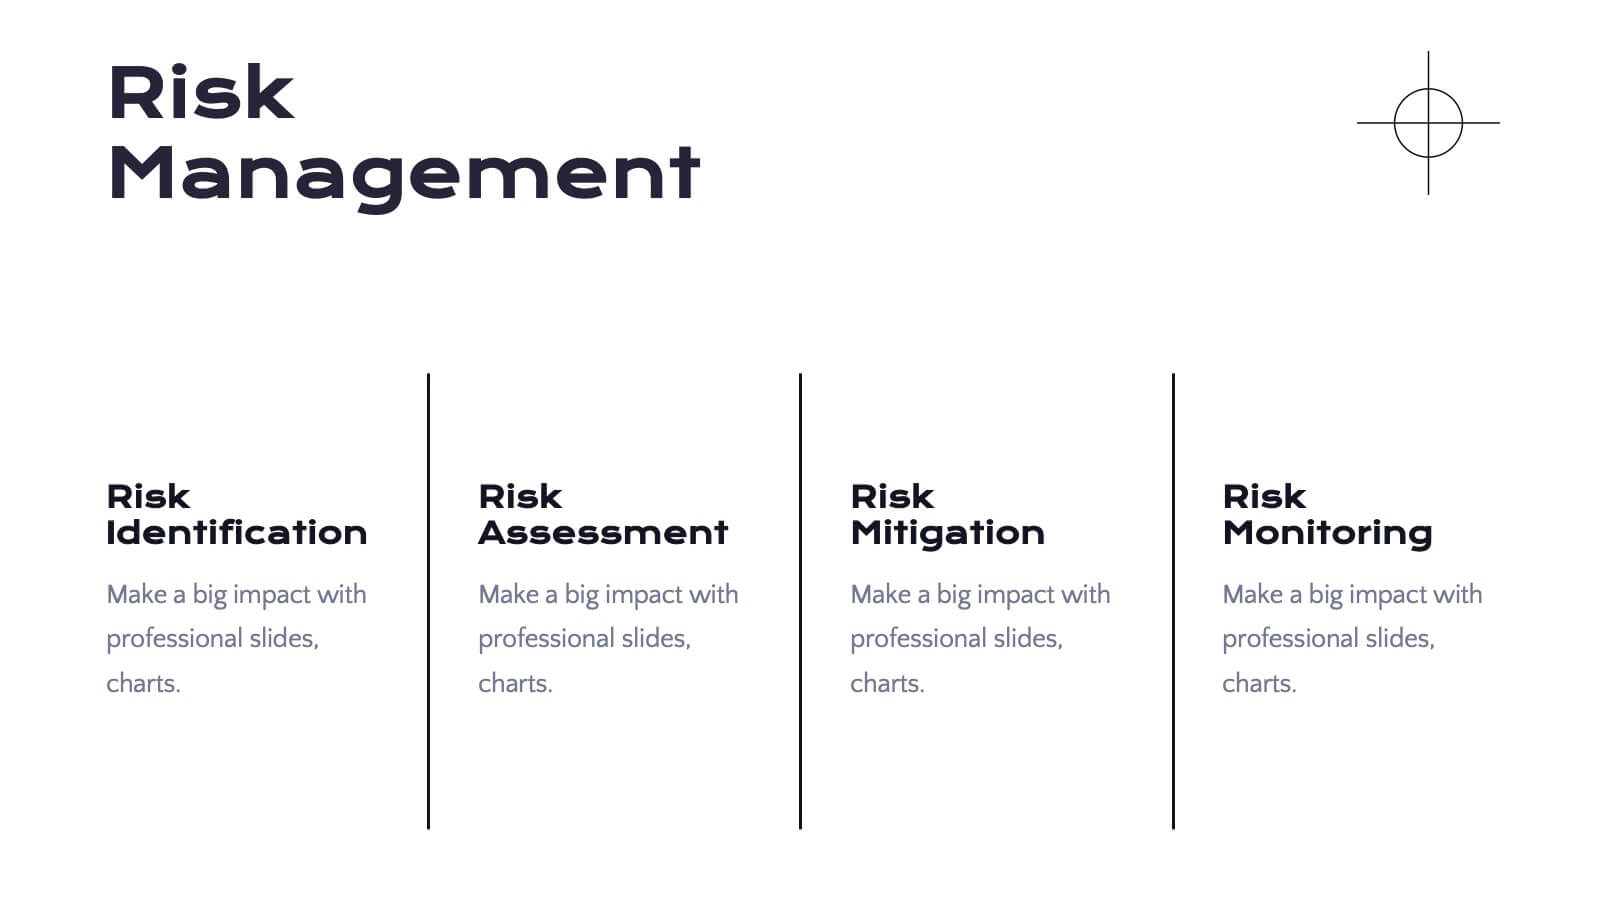
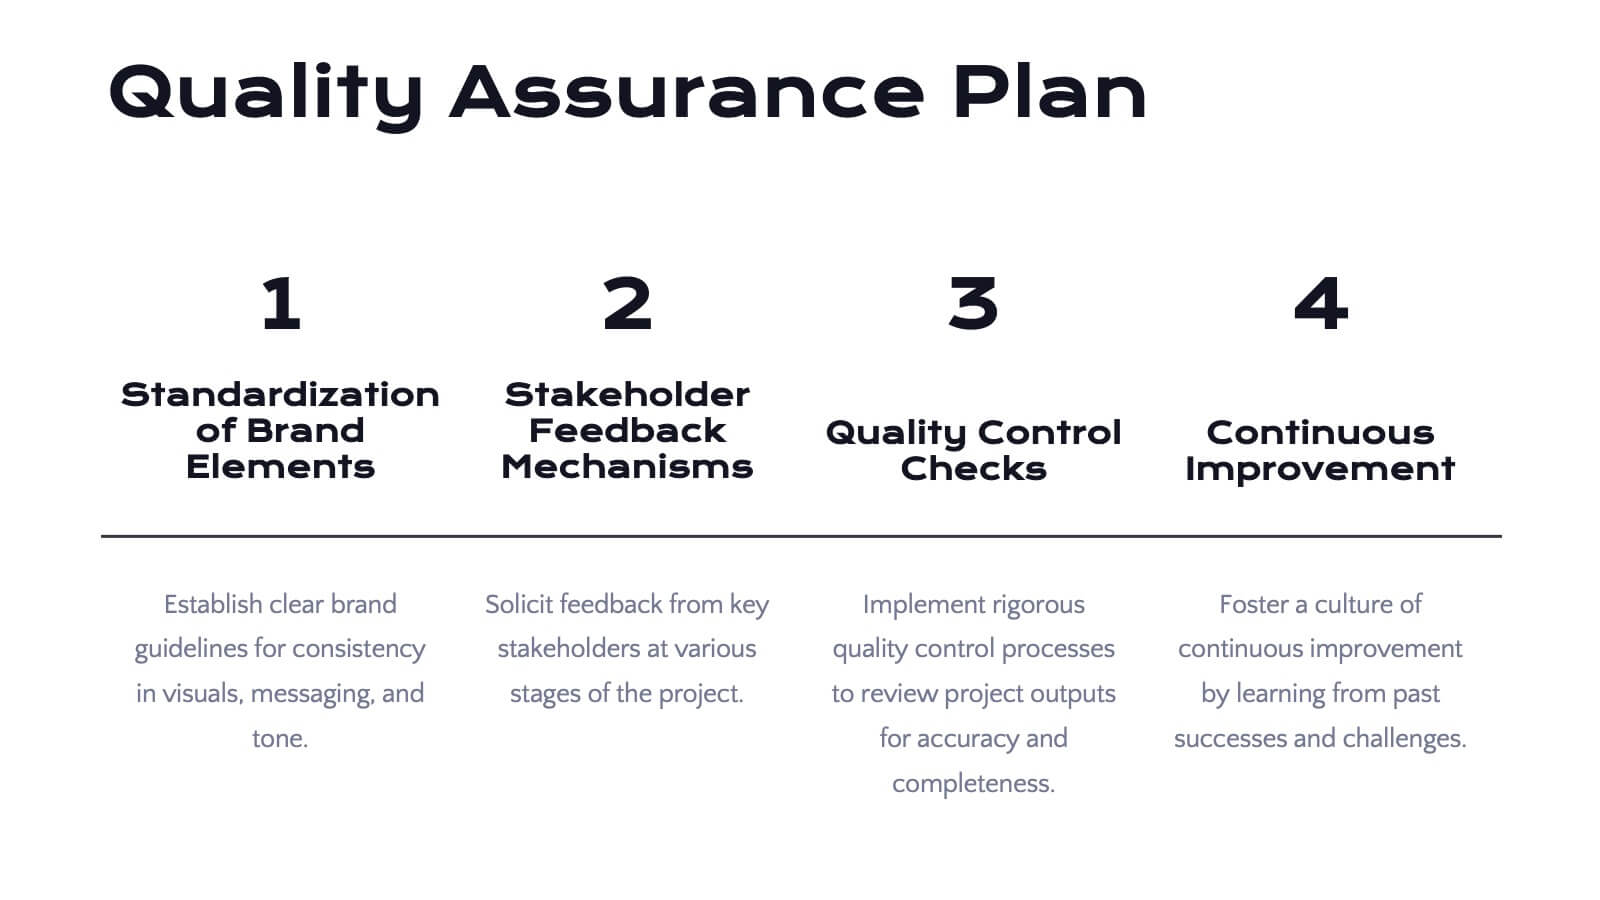
Briarfall Rebranding Project Plan Presentation
This Brand Presentation Template offers a modern and structured approach to showcasing your brand identity, values, and strategic direction. Covering essential elements like audience personas, brand positioning, touchpoints, and performance metrics, it's fully customizable and perfect for businesses looking to strengthen their brand presence. Compatible with PowerPoint, Keynote, and Google Slides.


7 diapositivas
Student Progress Infographic Presentation
Progress infographics are visual representations that show progress or improvement over time, often with the use of charts, graphs, and other visual elements. Visualize your progress with this infographic template that includes tips, illustrations and a variety of charts. Use this progress template to create a visual story of your goals and accomplishments in an engaging style. This includes helpful illustrations, colors and allows you to add your text, notes and other valuable information. This template was designed for progress, but can be used for presentations on various topics.
21 diapositivas
Radiance Detailed Project Execution Plan Presentation
Elevate your project execution presentations with this sleek template, covering everything from objectives to timelines and budget breakdowns. It's perfect for aligning your team and stakeholders. Compatible with PowerPoint, Keynote, and Google Slides, it ensures professionalism and clarity in showcasing your project plans.


21 diapositivas
Rakshasa Project Status Report Presentation
This detailed status report template helps track progress with clarity and precision. Featuring sections on financial summaries, operational updates, key achievements, and market trend analysis, it ensures seamless reporting and decision-making. Perfect for reviewing team productivity, challenges, and upcoming priorities, this template offers easy customization in PowerPoint, Keynote, or Google Slides.


7 diapositivas
Pyramid Infographic Presentation Template
A Pyramid Infographic is a type of representation that uses a pyramid shape to organize and present information in a hierarchical manner. The top of the pyramid represents the most important or main idea and the levels below it represent sub-ideas or details that support the main idea. With this template you can show the relationship between different levels of information or to illustrate the main points of a topic in a simple and easy way, perfect for business, education, and marketing. This template will help you organize your information and make it more understandable.


4 diapositivas
Goal Breakdown and Success Metrics Presentation
Visualize achievement metrics with the Goal Breakdown and Success Metrics Presentation. This dynamic template features global maps, KPIs, and segment analysis to track progress and highlight results. Ideal for executives, project leads, or analysts. Fully customizable in PowerPoint, Keynote, and Google Slides for polished and insightful business presentations.
8 diapositivas
OKR Strategy Tracker Presentation
Bring your goals to life with a dynamic, structured layout that tracks objectives, measures results, and keeps teams aligned from start to finish. Ideal for strategic planning, quarterly reviews, or business updates, this presentation makes performance tracking effortless. Compatible with PowerPoint, Keynote, and Google Slides for full customization.


6 diapositivas
Business Sustainability Performance Report Presentation
Showcase your company’s sustainability efforts with this modern infinity-loop infographic. Perfect for environmental reports, CSR metrics, or circular economy overviews. Highlight key percentages and goals across three impact areas. Fully editable and compatible with PowerPoint, Keynote, and Google Slides—ideal for presenting performance results in a clear, engaging, and professional format.


7 diapositivas
Environmental Planning Infographic Presentation
Environmental infographics are an essential tool in raising awareness about the state of the environment and the impact of human activities on the planet. This template presents a broad range of data text on the environment for you to input. Use this eye-catching infographic design to educate and raise awareness about the environment. This template is ideal to give an overview of the topic, its importance and the main issues. Stay on track using facts and figures, good visuals and data visualizations. This presentation is easy to use and can be edited in Powerpoint, Keynote or Google Slides.


5 diapositivas
Easy 4-Stage Development Process Presentation
Simplify complex processes with this clean, 4-step development diagram. Ideal for product lifecycles, workflows, or phased planning, this slide uses connected blocks and clear numbering to illustrate each stage. Fully editable in PowerPoint, Keynote, and Google Slides—perfect for project managers, engineers, and teams needing to communicate clear development strategies.


5 diapositivas
Cybersecurity Risk Management Presentation
Simplify your security strategy with this clean, lock-themed visual. This layout organizes five key points with corresponding icons, perfect for presenting IT safeguards, data protection plans, or risk response actions. The vertical structure ensures clarity, while the design remains professional and editable in PowerPoint, Keynote, and Google Slides.