


Características


¿Tienes alguna pregunta?
Recomendar


22 diapositivas
Crystal Business Plan Presentation
This business plan template is ideal for presenting strategies, conference overviews, and session details. With slides for keynote speakers, breakout sessions, and networking breaks, it offers a dynamic and professional layout. Compatible with PowerPoint, Keynote, and Google Slides, it ensures a clear and organized flow for any business presentation.


26 diapositivas
Thadd Presentation Template
Thadd presents your business in a professional light. The bold fonts and colors make for a clean, professional aesthetic that won't distract from your message. It features a strong horizontal identity that instantly communicates your brand. Charts, timelines and easy to edit text give this template an edge over the competition. It comes with easy to edit text and images, making changing content a breeze. It makes for a great business tool for companies who want to get their message across without wasting time on graphics and design. Invest in your future and download this template today.


6 diapositivas
Organizational Mind Mapping Slide Presentation
Bright ideas deserve a space to grow, and this presentation turns complex thoughts into a clean, organized visual map. It helps teams outline processes, connect concepts, and structure information with clarity and flow. Perfect for planning or strategy sessions. Fully compatible with PowerPoint, Keynote, and Google Slides.


6 diapositivas
Modern Business Strategy Presentation
Bring your ideas to life with a sleek, forward-thinking presentation designed to communicate business growth and strategic planning. Ideal for outlining goals, performance steps, and innovation roadmaps, this clean and modern layout ensures every concept stands out. Fully compatible with PowerPoint, Keynote, and Google Slides for easy customization.
24 diapositivas
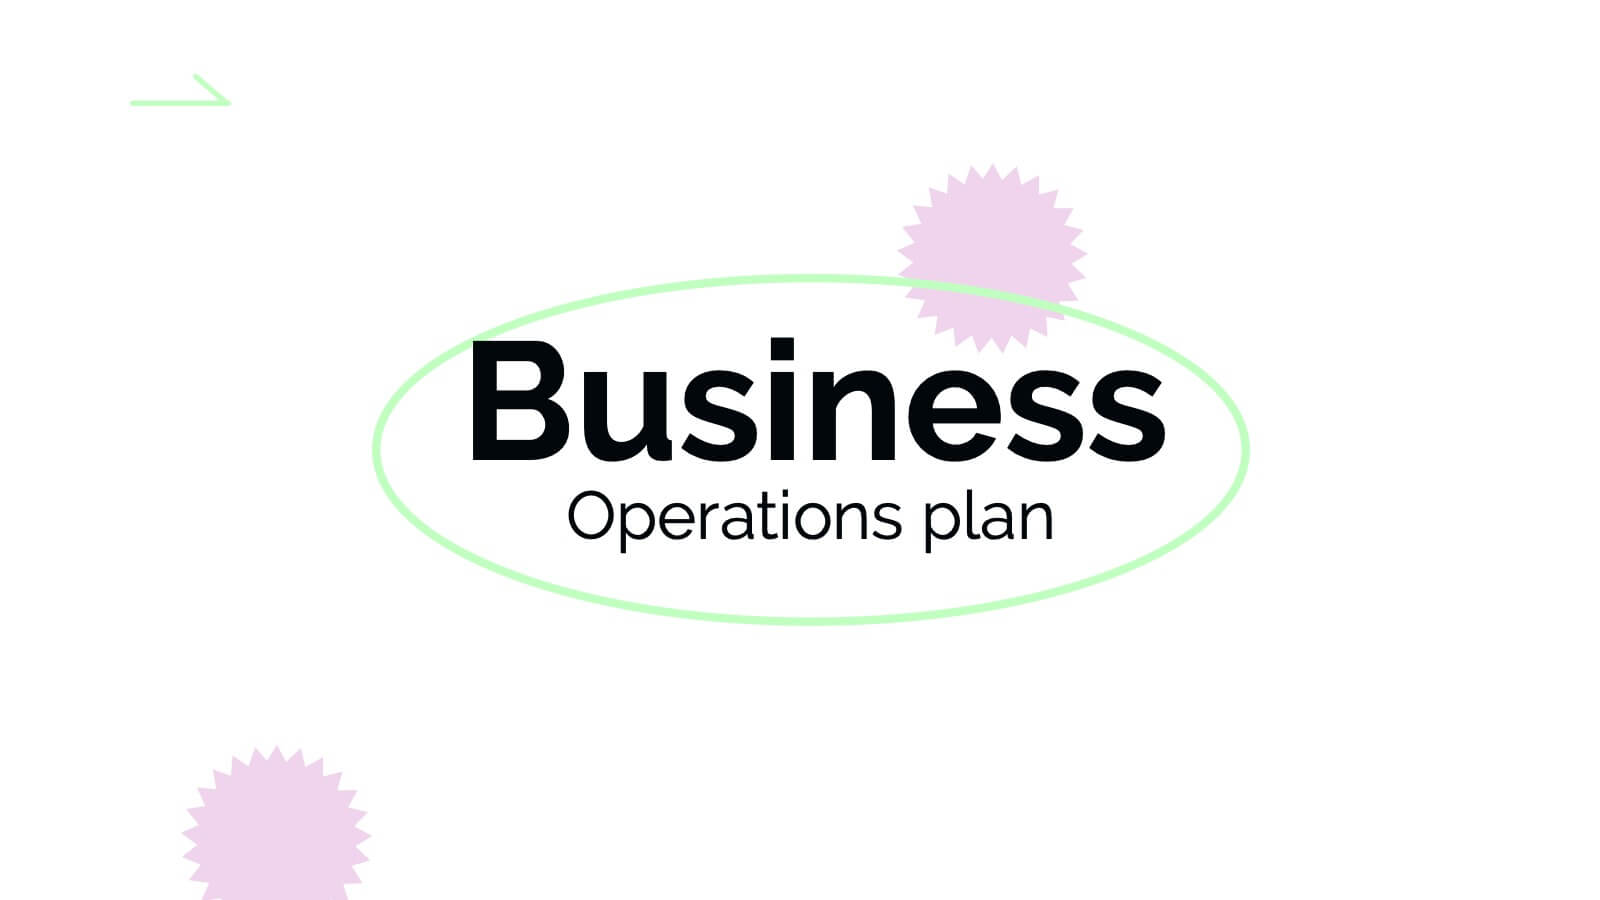
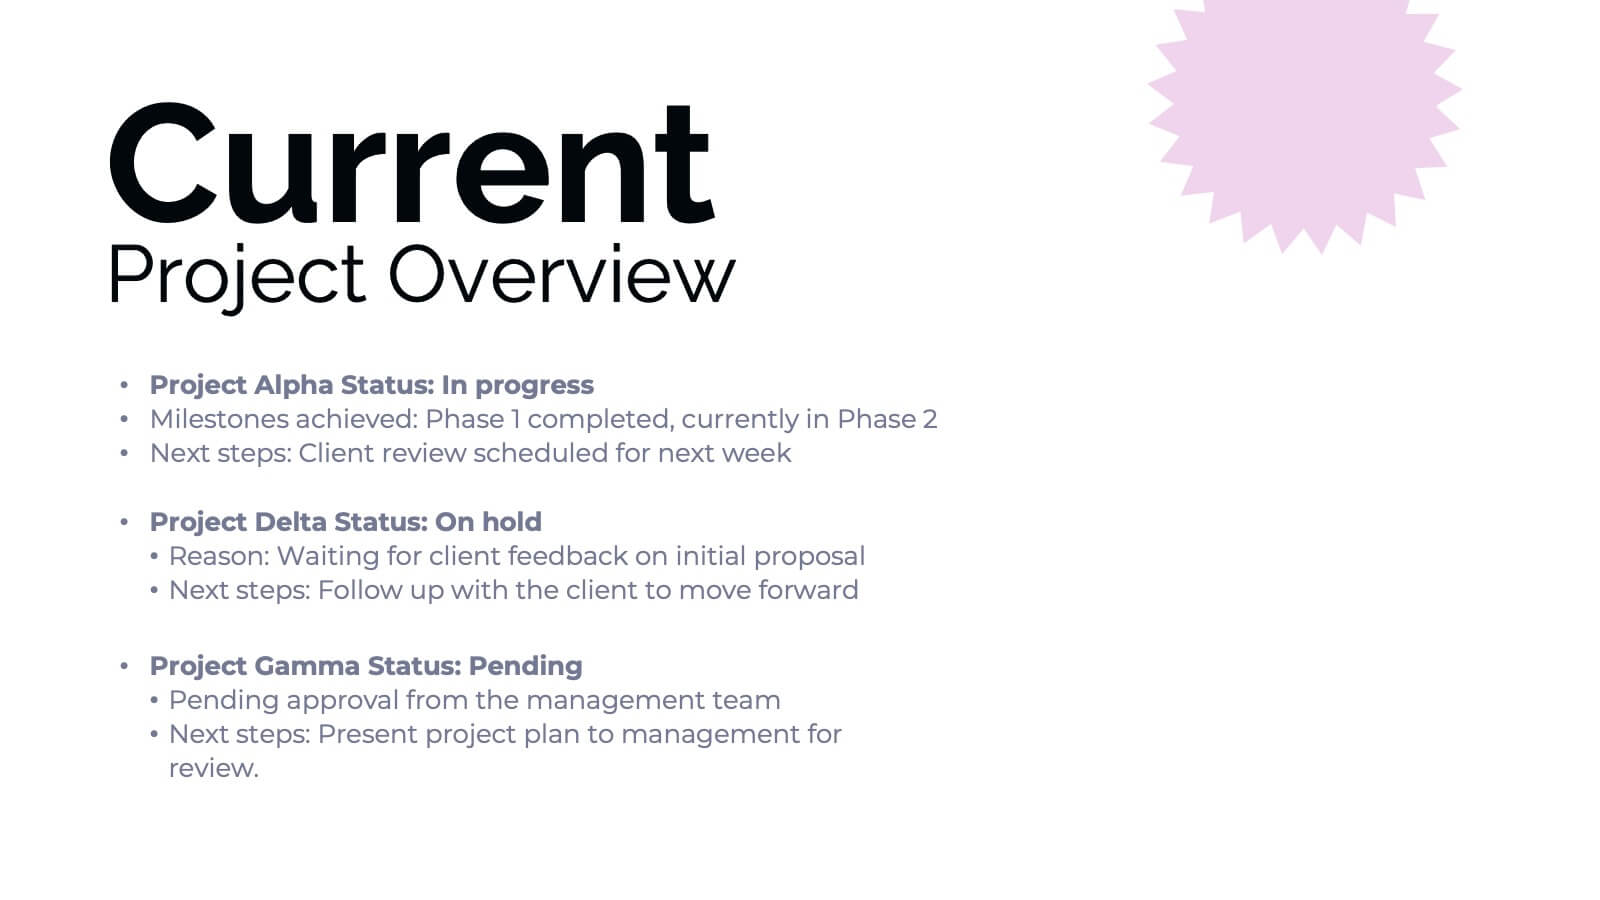
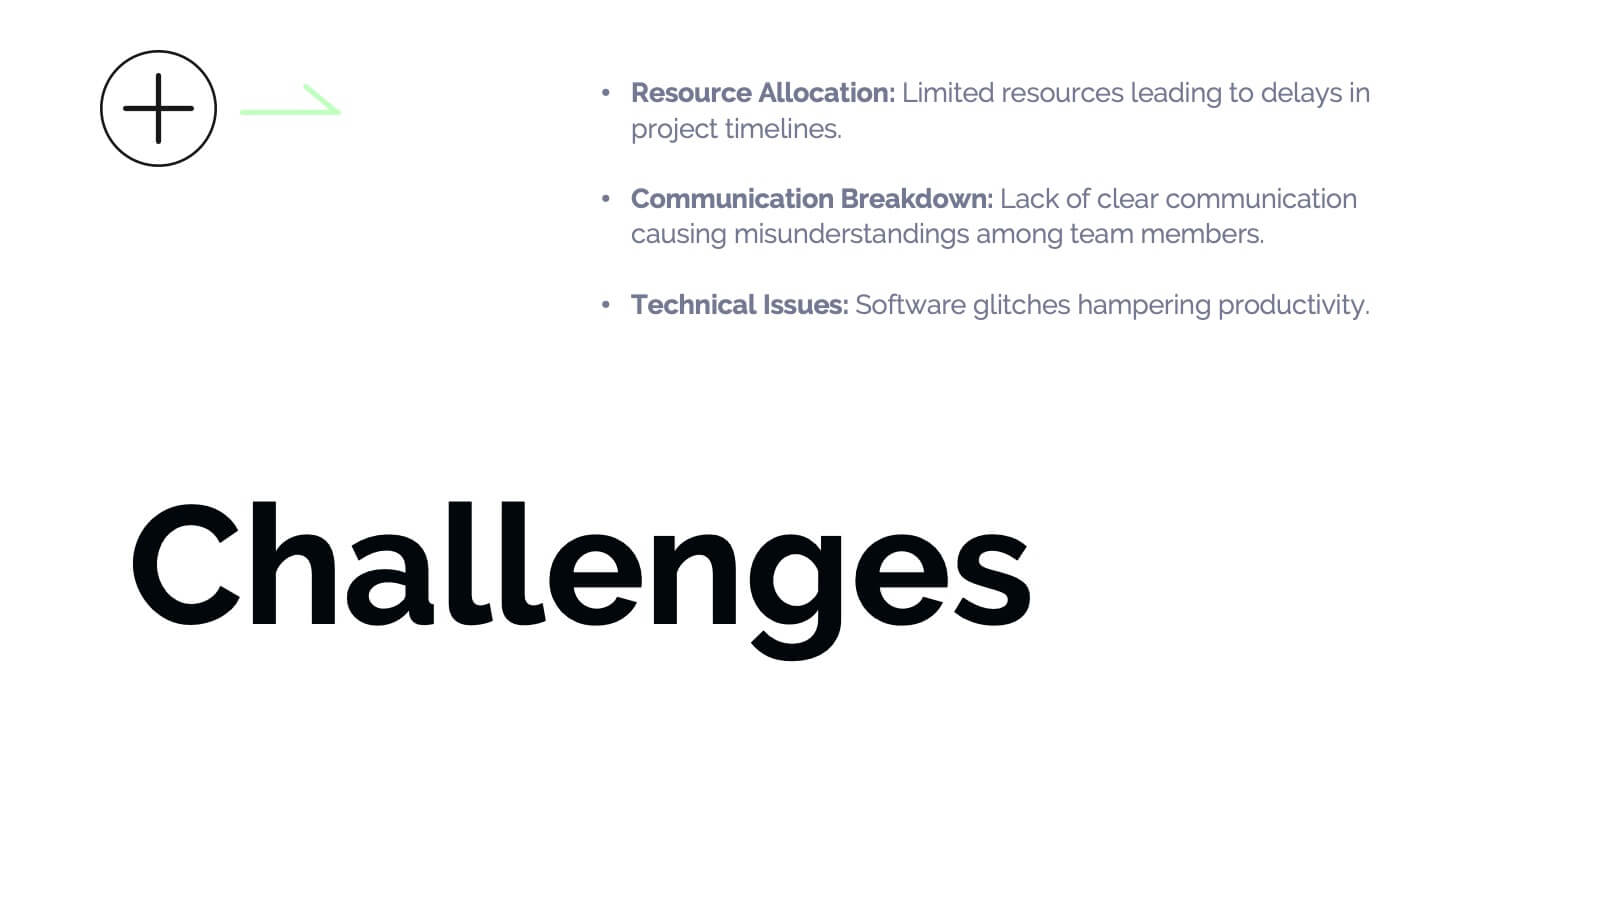
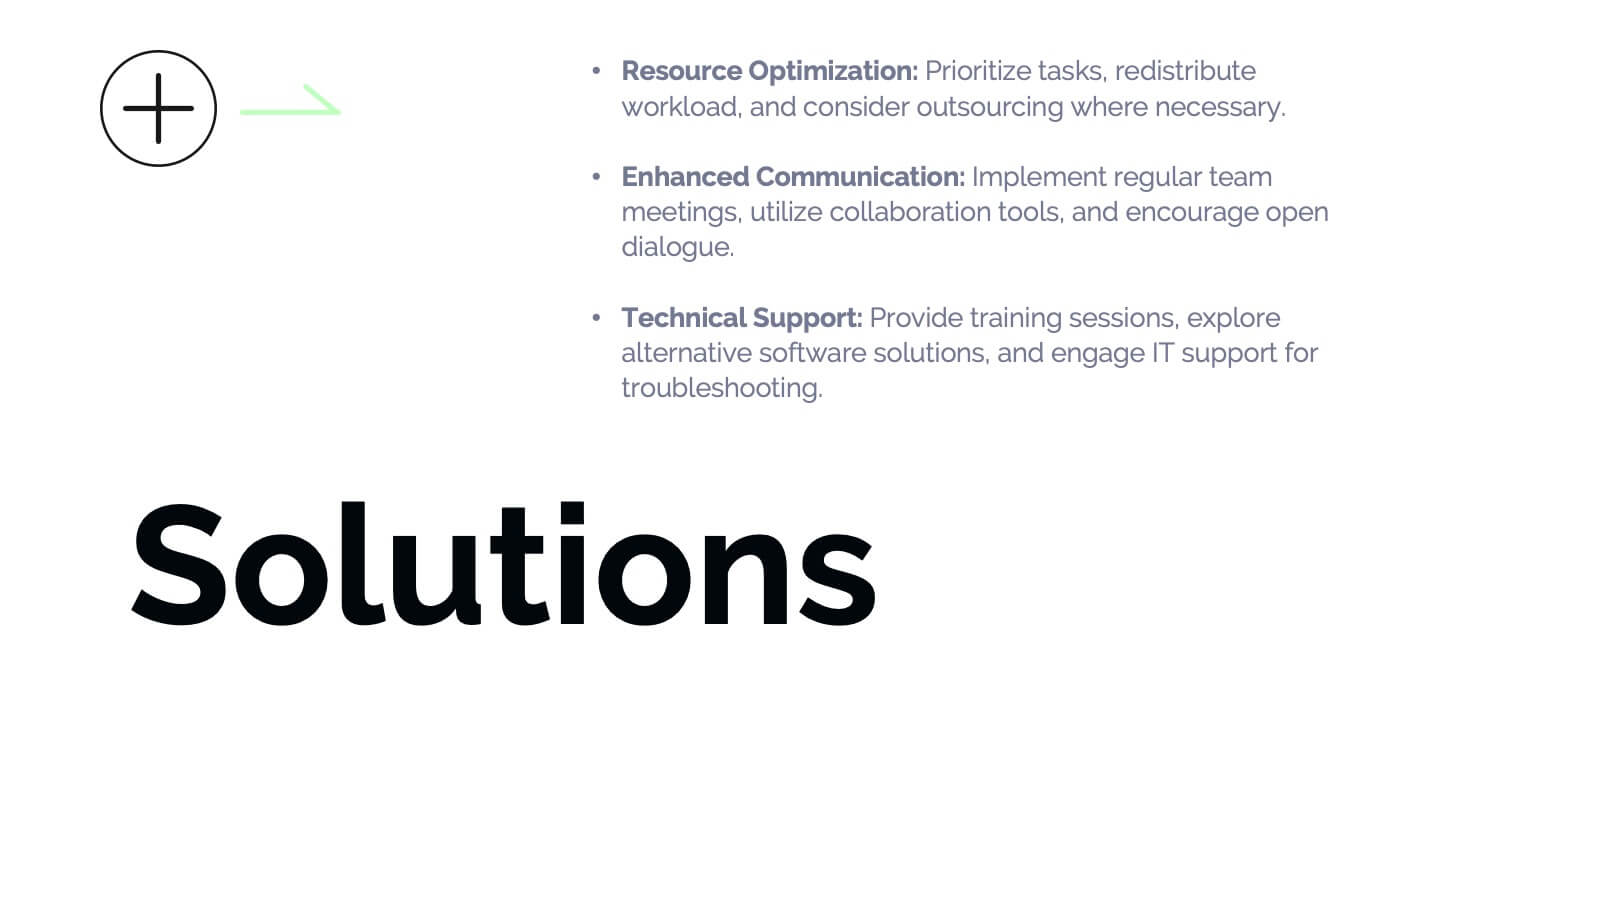
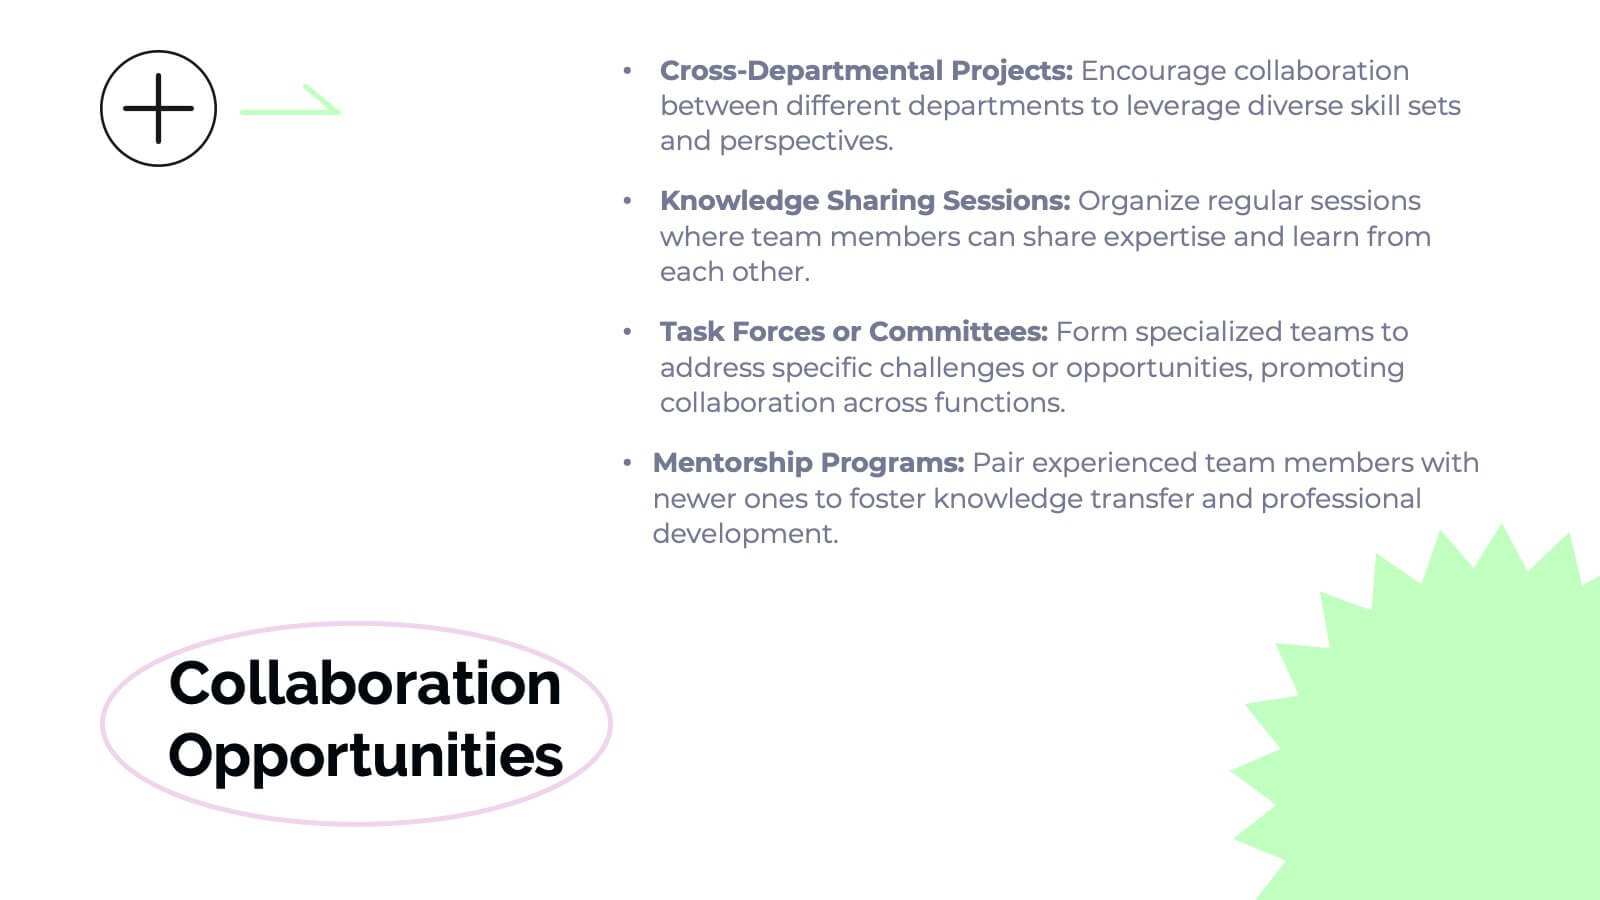
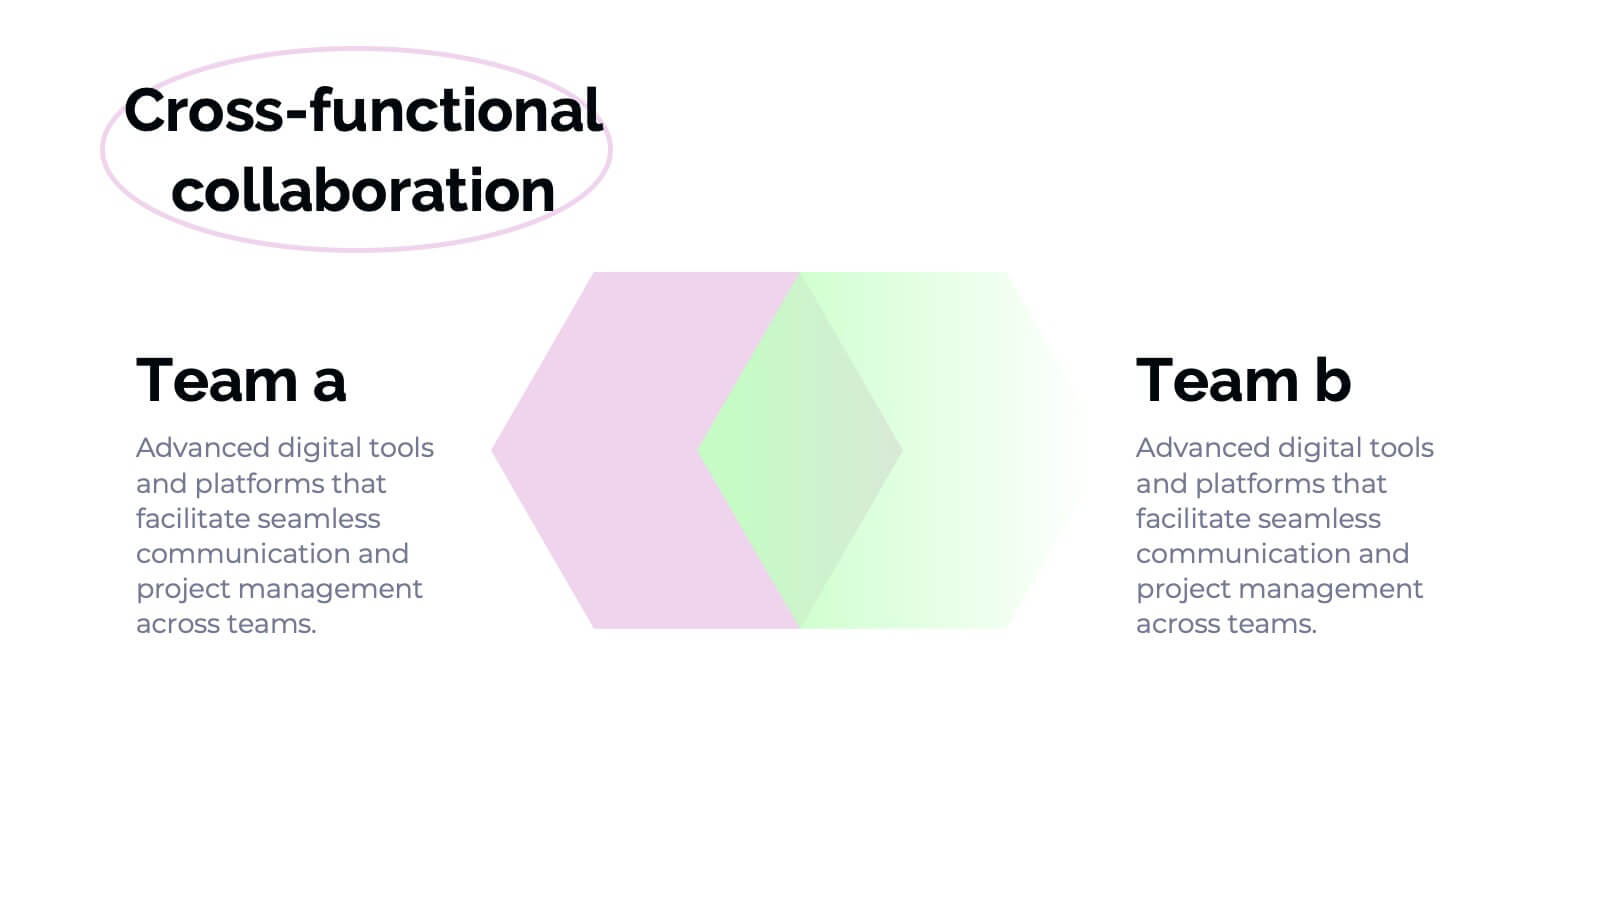
Banshee Business Operations Plan Presentation
Streamline your business operations with this comprehensive presentation template! From team updates and key achievements to challenges and solutions, every aspect of your business plan is covered. Ideal for tracking performance metrics, resource allocation, and upcoming events, this design keeps your operations organized and efficient. Compatible with PowerPoint, Keynote, and Google Slides for seamless integration.


25 diapositivas
Draco Photography Portfolio Template Presentation
Showcase your photography portfolio with this dynamic template! Highlight your projects, style, client testimonials, and awards. Includes sections for pricing, services offered, and social media links. Ideal for photographers to create impactful presentations. Compatible with PowerPoint, Keynote, and Google Slides.


6 diapositivas
Business Project Proposal Template
Showcase your strategy with clarity and confidence using this sleek Business Project Proposal slide. Designed to highlight three core ideas or phases, it's perfect for pitching initiatives, presenting goals, or structuring deliverables. Compatible with PowerPoint, Google Slides, and Keynote for seamless editing and customization.


26 diapositivas
Simplified Home Decor Presentation
Bring a breath of fresh air to interior design with this elegant presentation template, perfect for unveiling the beauty of simplified home decor. The template's clean lines and soft color palette evoke the minimalist charm and serene ambiance of modern living spaces. Each slide offers a harmonious blend of imagery and text, showcasing tranquil interiors that speak volumes about the less-is-more philosophy. From showcasing key principles of minimalist design to offering tips on decluttering and organizing, this template guides viewers through the transformative process of creating a peaceful home environment. Infographics lend themselves to discussing color schemes, space functionality, and the impact of natural light, making this a comprehensive tool for interior designers, home organizers, or decor enthusiasts. Fully compatible with PowerPoint, Keynote, and Google Slides, this template is a canvas for creativity, ready to inspire and engage audiences in the art of living simply and stylishly.


8 diapositivas
Cycle of Continuous Improvement Deck Presentation
Highlight iterative progress and strategic refinement with the Cycle of Continuous Improvement Deck. This template is ideal for quality management, agile planning, or operational excellence sessions. Fully editable and visually dynamic, it presents circular workflows in clean layouts. Compatible with PowerPoint, Keynote, and Google Slides—great for teams and consultants.


5 diapositivas
Innovative Business Solutions Presentation
Elevate your strategy discussions with the Innovative Business Solutions template, providing a visually engaging framework designed to present complex business solutions clearly and effectively. It features a unique puzzle design that integrates up to five key business insights, ensuring each piece contributes to a holistic understanding of strategies or solutions. It is compatible with PowerPoint, Keynote and Google Slides, providing flexibility and ease of use across different platforms.


5 diapositivas
Data-Driven Statistics Slide Presentation
Turn your numbers into a story that’s clear, bold, and easy to follow. This modern layout is perfect for presenting metrics, comparisons, or performance insights with precision and style. Customize colors, data, and text effortlessly—compatible with PowerPoint, Keynote, and Google Slides for seamless editing and presentation flexibility.


26 diapositivas
E-commerce Presentation
Venture into the digital marketplace with a presentation template that embodies the innovative spirit of e-commerce. This template, with its vibrant colors and modern design elements, is tailored to highlight the fast-paced world of online retail. The slides offer a digital storefront for your ideas, from introducing the creative minds behind the operation to showcasing the latest trends in online shopping. Utilize engaging layouts to compare products, outline sales strategies, or highlight consumer behavior with clear, concise infographics. With promotional slide options to announce special deals and a design that captures the convenience and excitement of shopping with a click, this collection is an essential tool for marketers, online retailers, and startups. It’s optimized for conveying complex data in a user-friendly format, ensuring your audience stays engaged and informed. Compatible with PowerPoint, Keynote, and Google Slides, it’s the perfect cart to carry your message in the bustling online marketplace.


34 diapositivas
Validation Pitch Deck
A Validation Pitch Deck, is a visual presentation that provides an overview of a startup company's business idea, market opportunity, value proposition, and progress towards validation of its concept or product. This template consists of a series of slides that are designed to convey the key elements of your business model in a concise and persuasive manner. Use this template as a tool to communicate your vision, market opportunity, and progress to potential investors or other stakeholders. Compatible with PowerPoint, Keynote, and Google Slides. The color scheme and design elements can be easily customized to match your brand or business.


8 diapositivas
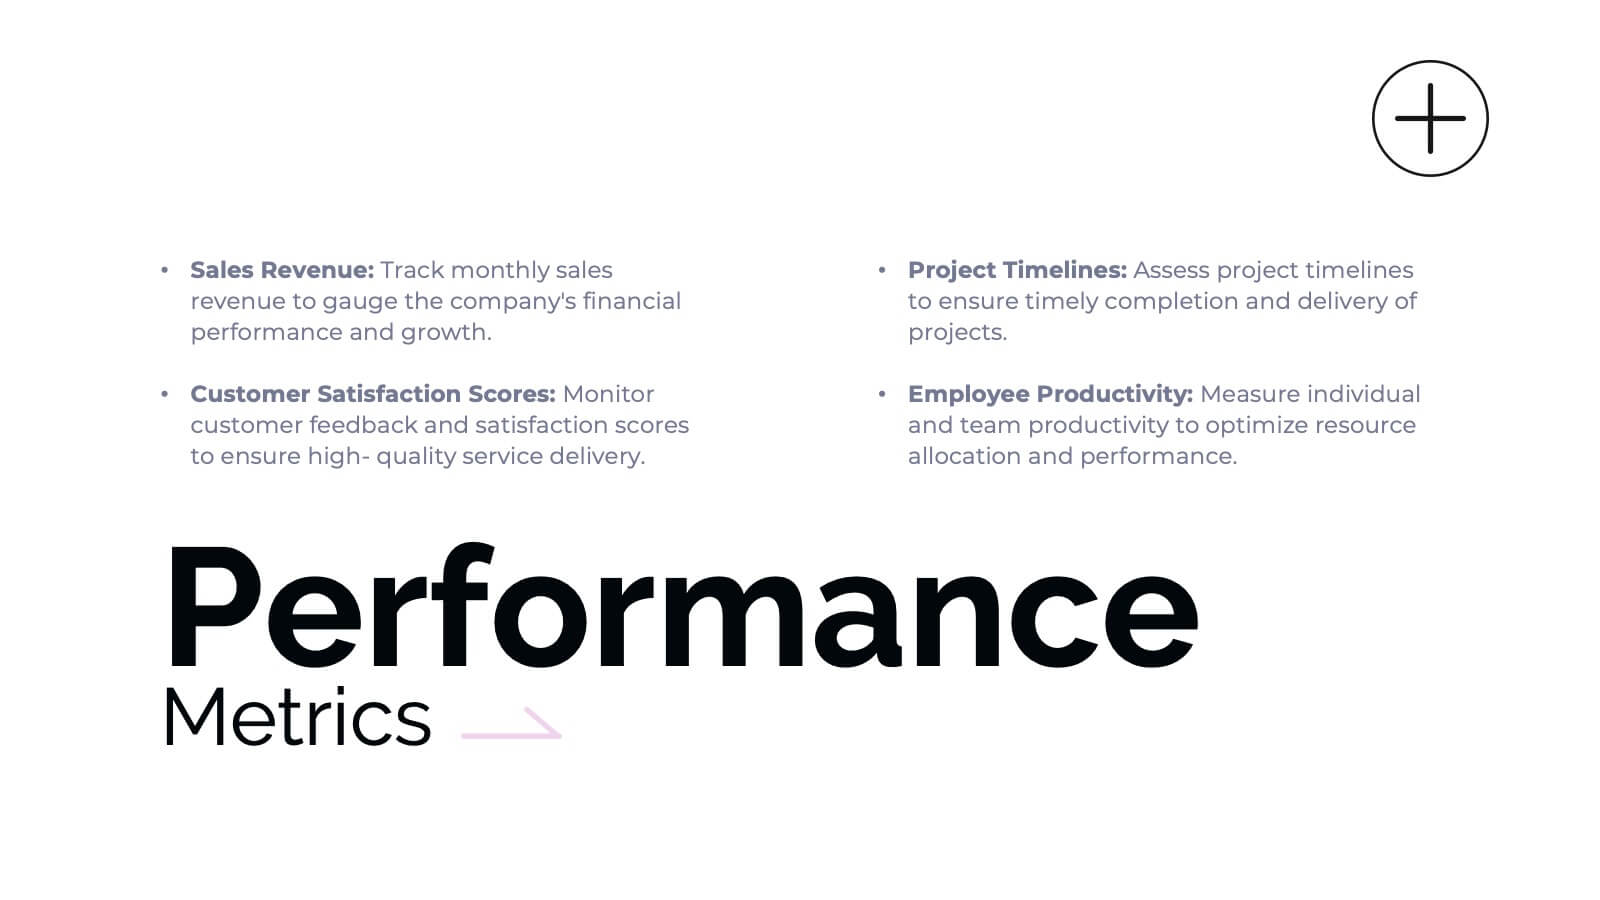
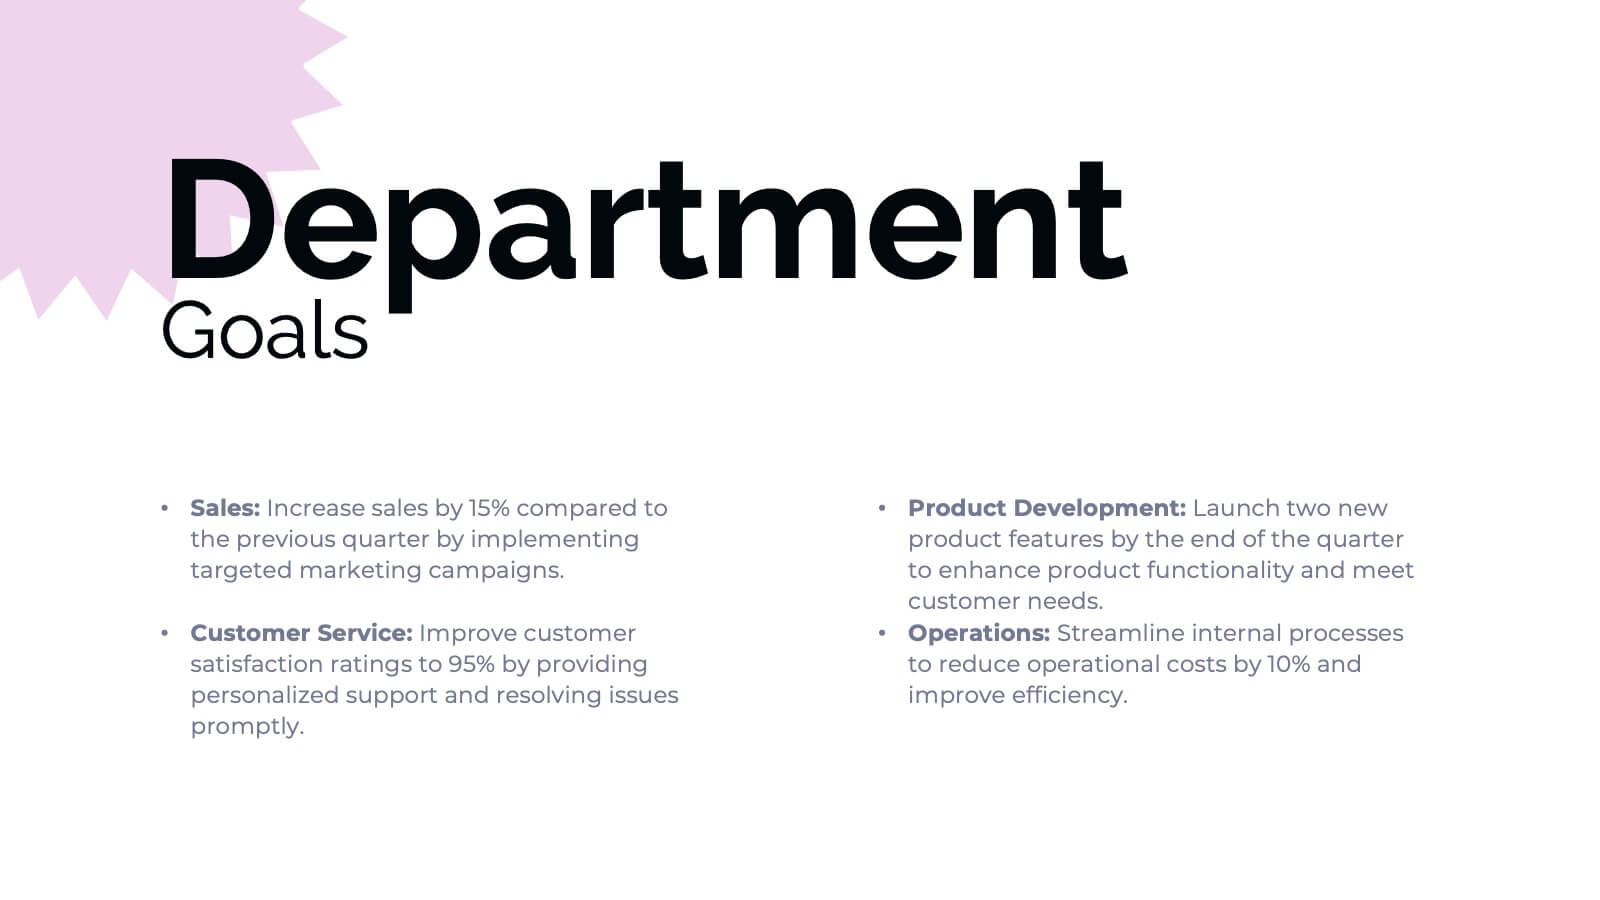
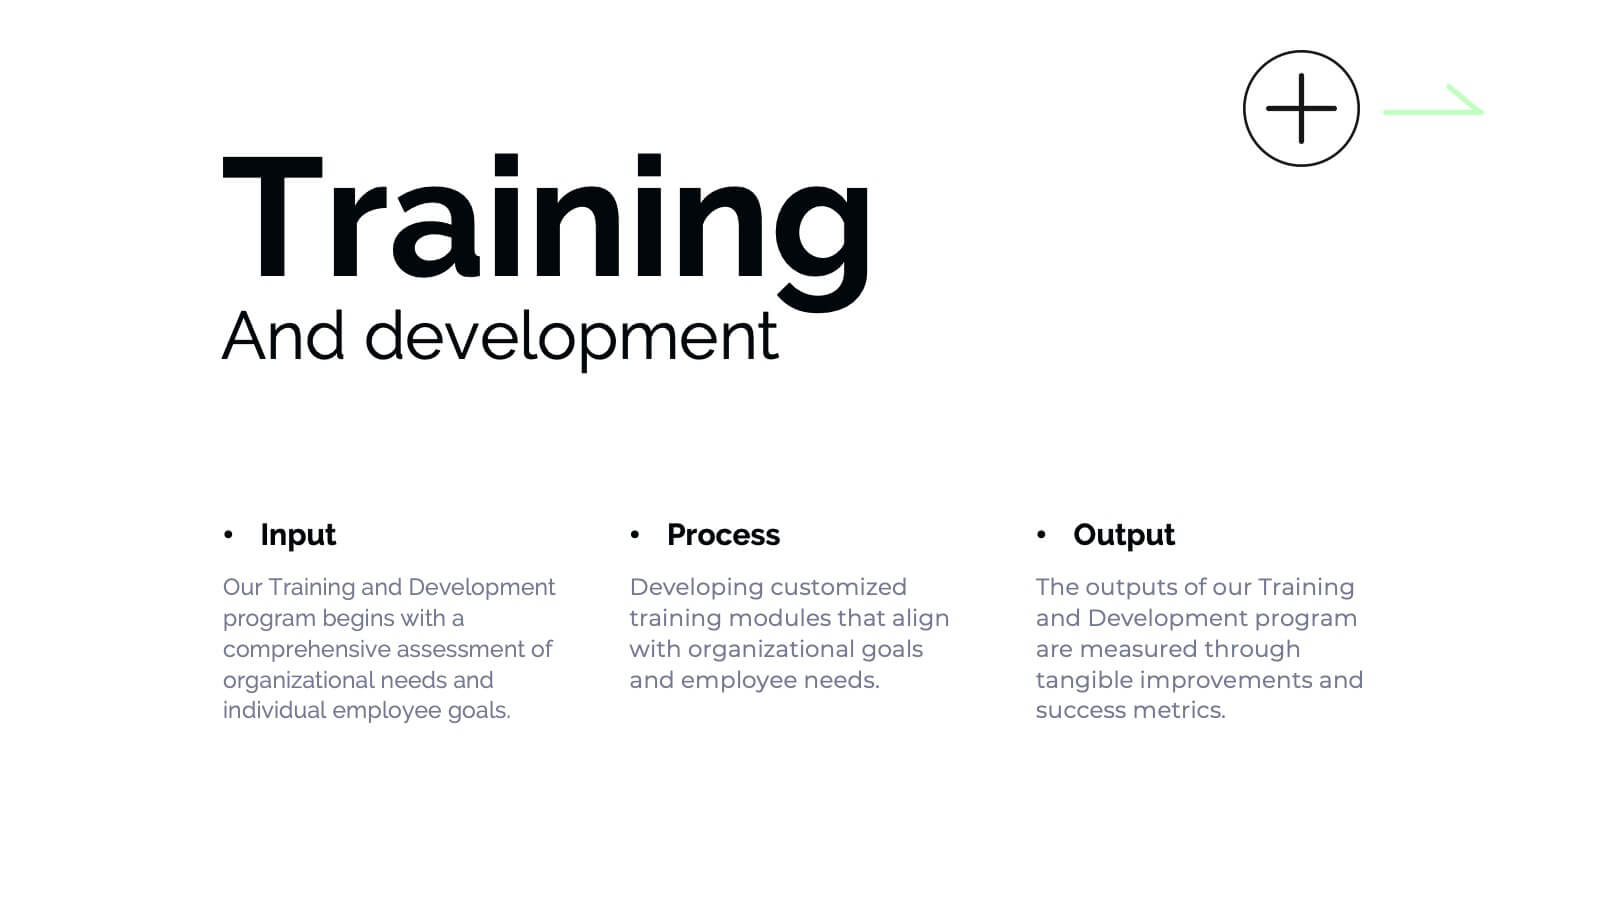
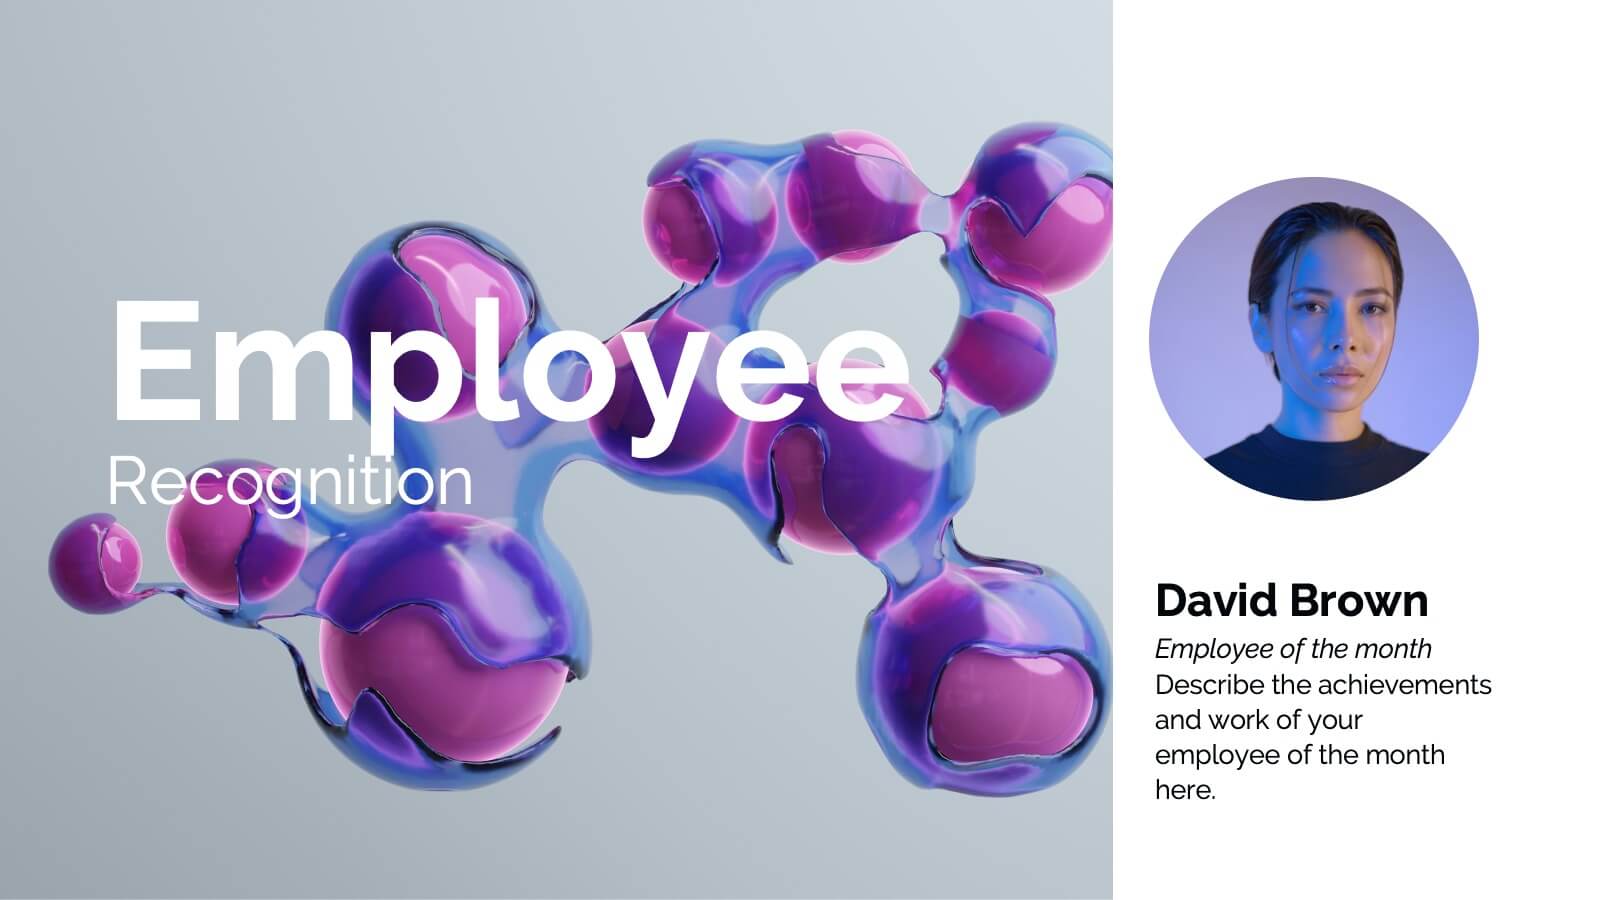
Employee Training and Development Presentation
Optimize your team's growth with the 'Employee Training and Development' presentation template. This layout strategically organizes training modules, showcasing clear pathways for skills enhancement and career progression. Compatible with PowerPoint, Keynote, and Google Slides, it's ideal for delivering engaging and instructional corporate training sessions.


4 diapositivas
Healthcare Medical Infographic Presentation
Bring your healthcare insights to life with a clean, calming design that makes complex medical data easy to follow. This presentation highlights key health metrics, patient information, and wellness topics using simple visuals and structured layouts for clarity. Fully compatible with PowerPoint, Keynote, and Google Slides.


22 diapositivas
Etherwind Advertising Agency Proposal Presentation
This Advertising Agency Proposal Presentation Template offers a sleek and professional layout, perfect for showcasing your agency's capabilities, services, and success stories. Covering essential sections such as market analysis, strategy development, campaign execution, and client testimonials, it ensures a compelling pitch to potential clients. Designed for easy customization in PowerPoint, Keynote, and Google Slides, making it a versatile choice for agencies looking to impress their audience.


6 diapositivas
Big Data Analytics Business Presentation
Analyze and visualize data-driven insights with the Big Data Analytics Business infographic. Designed with a central magnifying glass layout, this template highlights key metrics, trends, and processes in data analytics. Fully customizable and compatible with PowerPoint, Keynote, and Google Slides.