


Características


¿Tienes alguna pregunta?
Recomendar


6 diapositivas
Human Resources Job Infographic
Human Resources (HR) refers to the department or function within an organization that is responsible for managing the human capital, workforce, and related processes. This infographic template serves as a helpful guide for individuals interested in pursuing a career in HR or for HR professionals looking to understand the different career paths and opportunities available in their field. This infographic uses visuals, icons, and graphics to make the content more engaging and easily understandable. The layout of the infographic is organized and easy to navigate, allowing viewers to quickly find information about different HR job roles.


6 diapositivas
South America Biome Map Infographics
Explore our adaptable South America Biome Map infographic template, a powerful resource for visualizing the diverse ecosystems found across the South American continent. This template is fully compatible with popular presentation software such as PowerPoint, Keynote, and Google Slides, enabling you to easily customize it to suit your specific needs. The South America Biome Map infographic template serves as a flexible canvas for illustrating information about various biomes, including rainforests, grasslands, deserts, and more. Whether you're an educator, environmental enthusiast, or simply intrigued by South America's ecology, this template offers an intuitive platform to create informative presentations and educational materials. Impress your audience with this SEO-optimized South America Biome Map infographic template, expertly designed for clarity and user-friendliness. Customize it to showcase the unique features and biodiversity of South America's biomes, making it an invaluable tool for your projects and presentations. Get started on crafting your personalized infographic today!


6 diapositivas
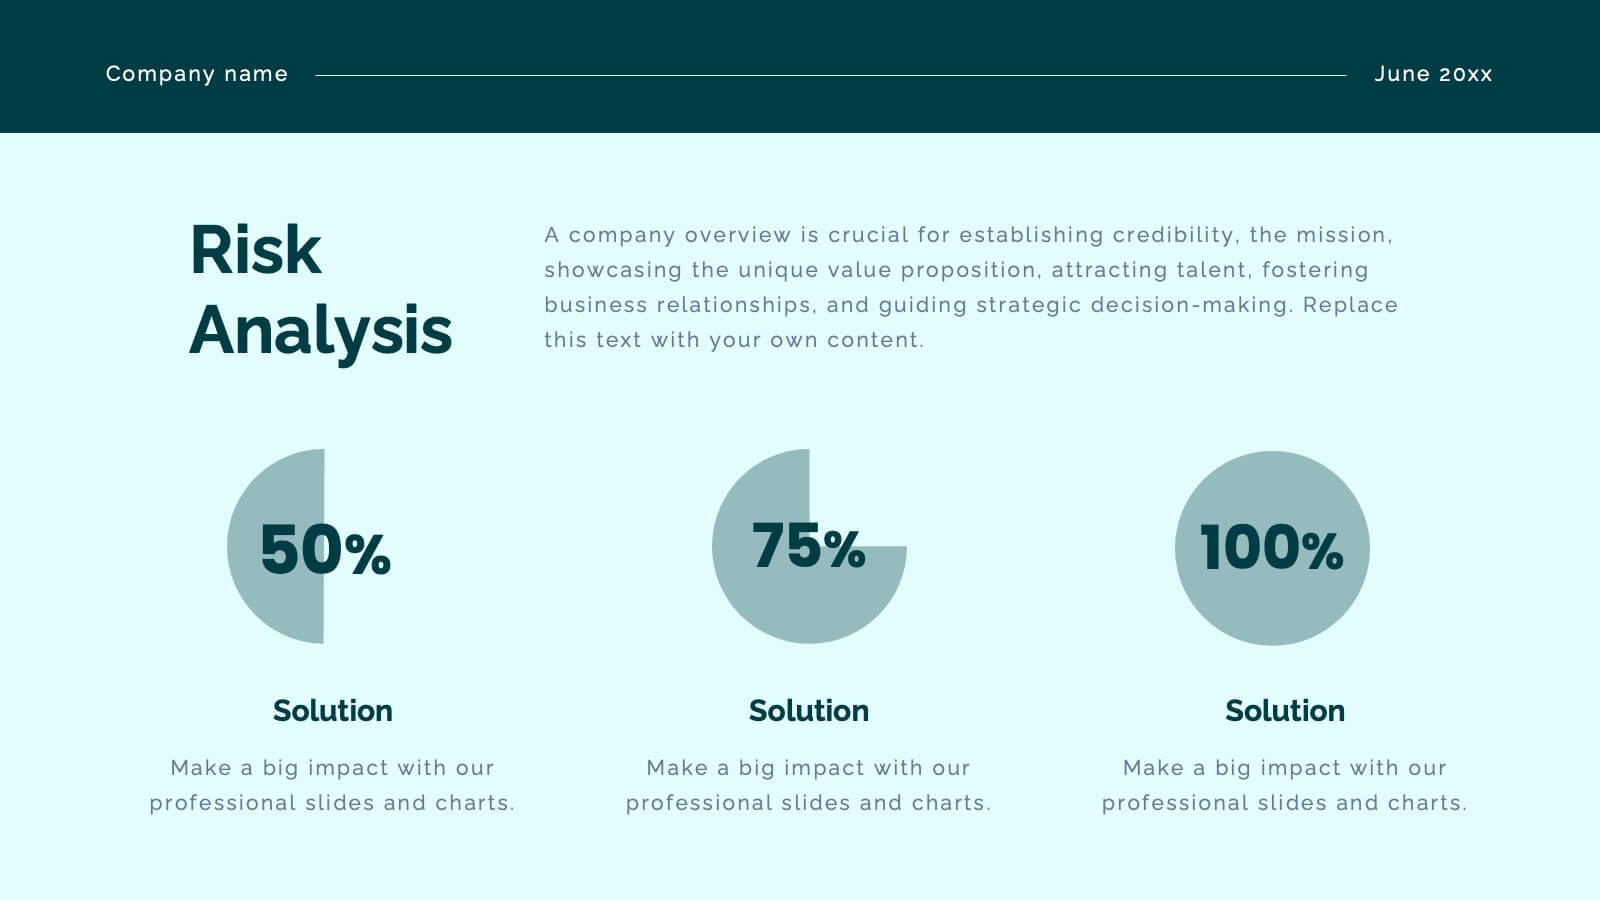
Business Risk Mitigation Framework Presentation
Visualize and communicate your risk management strategies with this two-part puzzle-style framework. Ideal for showcasing problems and solutions, action plans, or risk-response workflows. Clean and modern layout enhances clarity. Fully editable in PowerPoint, Keynote, and Google Slides—perfect for business continuity planning, operational strategy, and stakeholder presentations.


5 diapositivas
Employee Feedback Survey Report Presentation
Deliver clear insights into team sentiment with this employee rating slide. Designed with star rating visuals and thumbs-up iconography, it's perfect for showcasing staff satisfaction, engagement, and performance reviews. Easy to customize in PowerPoint, Keynote, and Google Slides.


4 diapositivas
Meeting Agenda Slide Presentation
Start your presentation with structure and clarity using this sleek, professional layout designed to outline key discussion points with style. Perfect for business meetings, workshops, or team updates, it keeps information clear and visually balanced. Fully compatible with PowerPoint, Keynote, and Google Slides for effortless editing and customization.


5 diapositivas
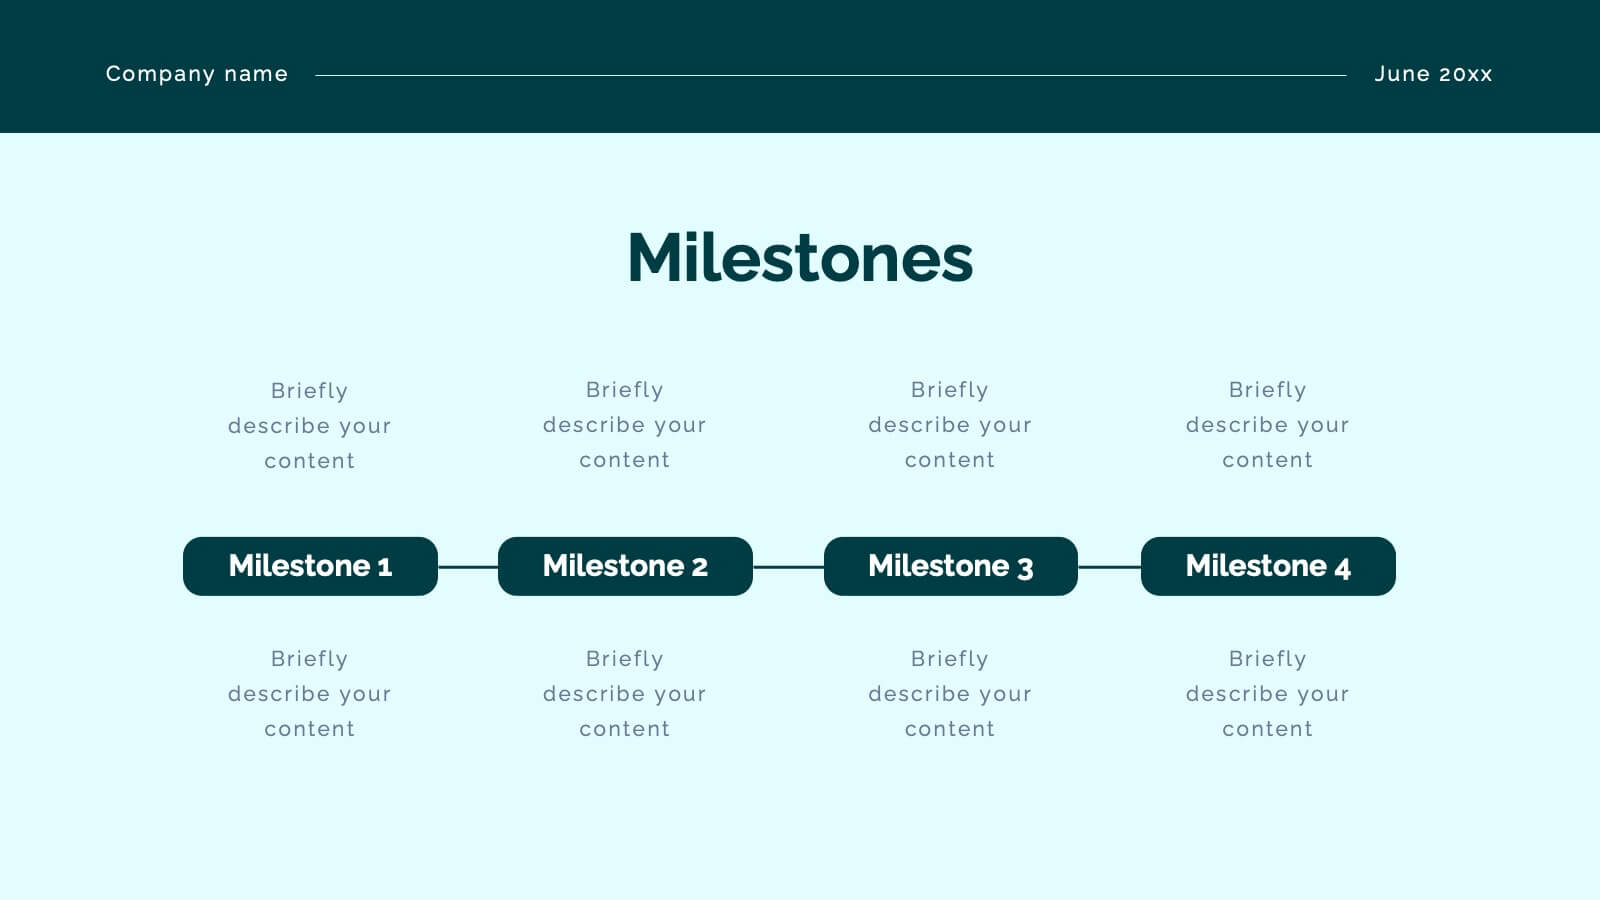
Project Milestone Timeline Presentation
Bring your project’s journey to life with this vibrant and organized presentation layout. Designed to showcase milestones, releases, and key phases clearly, it helps teams stay aligned and focused on goals. Fully editable and compatible with PowerPoint, Keynote, and Google Slides for smooth, professional presentations every time.


9 diapositivas
Business Dashboard Infographics
A business dashboard, often referred to as a business intelligence dashboard, is a visual representation of an organization's key performance indicators and critical business metrics. Empower your business analysis and strategy with our Infographic. This dynamic template enables you to present key business metrics, performance indicators, and trends in a clear and impactful manner. Compatible with Powerpoint, Keynote, and Google Slides. This template is a powerful tool to visualize your business progress, identify opportunities, and communicate your success story to viewers, clients, or team members.


5 diapositivas
Cyber Security Risk Management Presentation
Effectively visualize your digital defense strategy with this cyber security-themed presentation layout. Featuring a sleek laptop illustration and circular infographic design, this template helps you outline five critical areas of risk management with matching icons and editable text sections. Ideal for IT teams, consultants, or training sessions. Fully customizable and compatible with PowerPoint, Keynote, and Google Slides.


6 diapositivas
Fishbone Concept Infographic
Dissect complex issues with our Fishbone Concept Infographic, ideal for Powerpoint, Google Slides, and Keynote. This infographic, also known as the Ishikawa or cause-and-effect diagram, is designed for problem-solving and root cause analysis. This template features a series of branching arrows leading to a central spine, enabling you to map out multiple cause-and-effect relationships. Each ‘bone’ represents a category of causes that you can customize to fit your specific analysis needs. With this fishbone infographic, you can effectively organize and present complex data, making it easier for your audience to understand and engage with the content of your presentation.

23 diapositivas
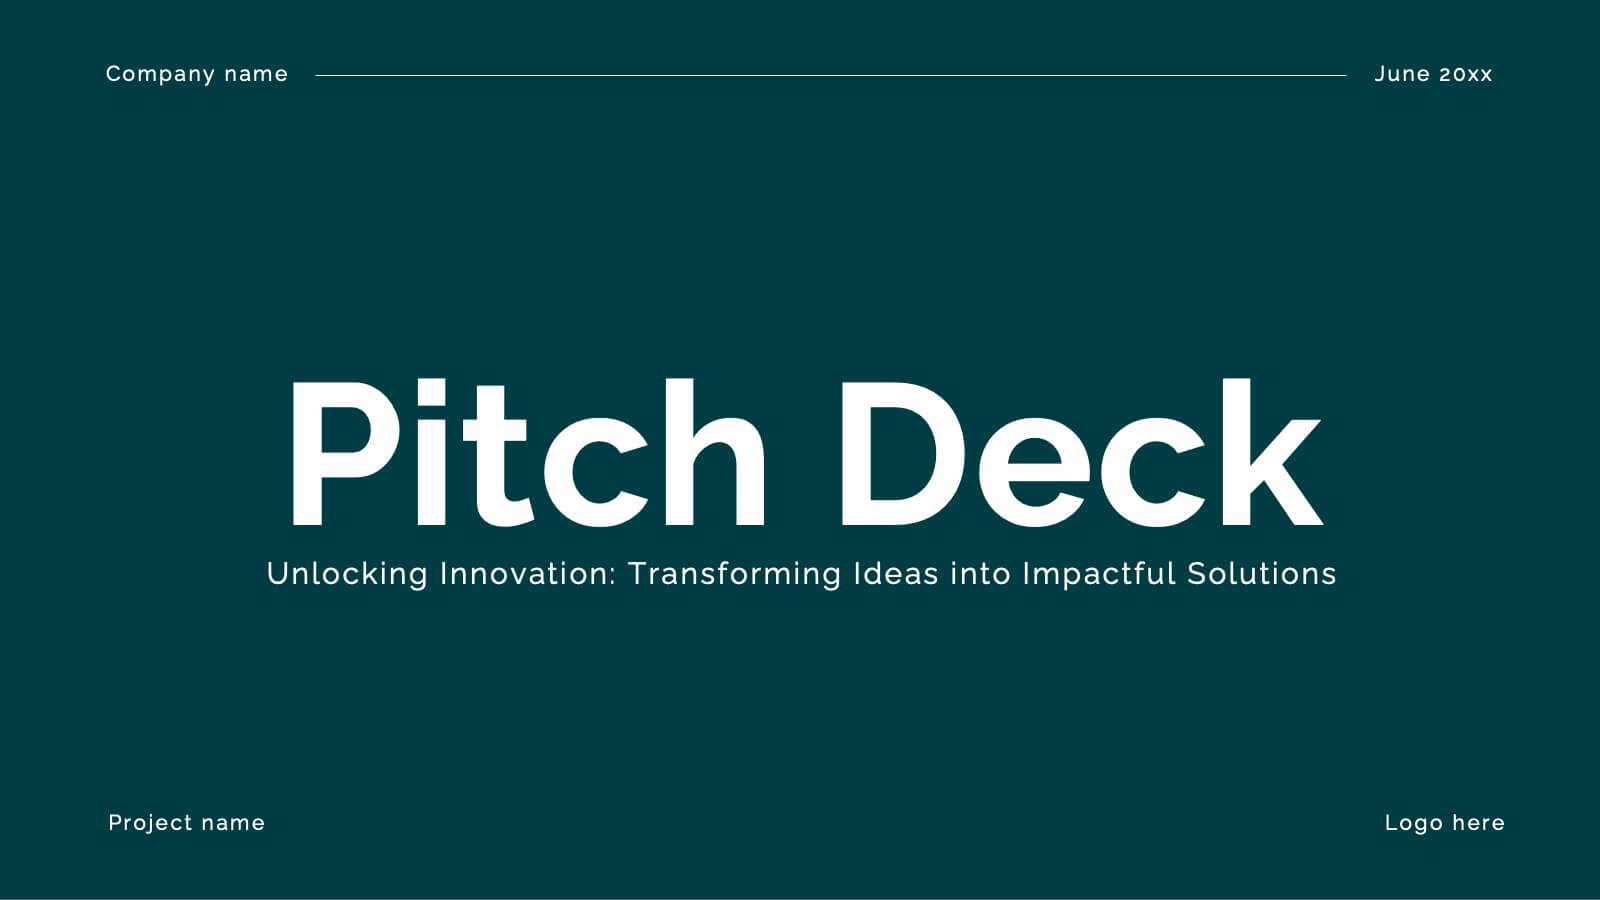
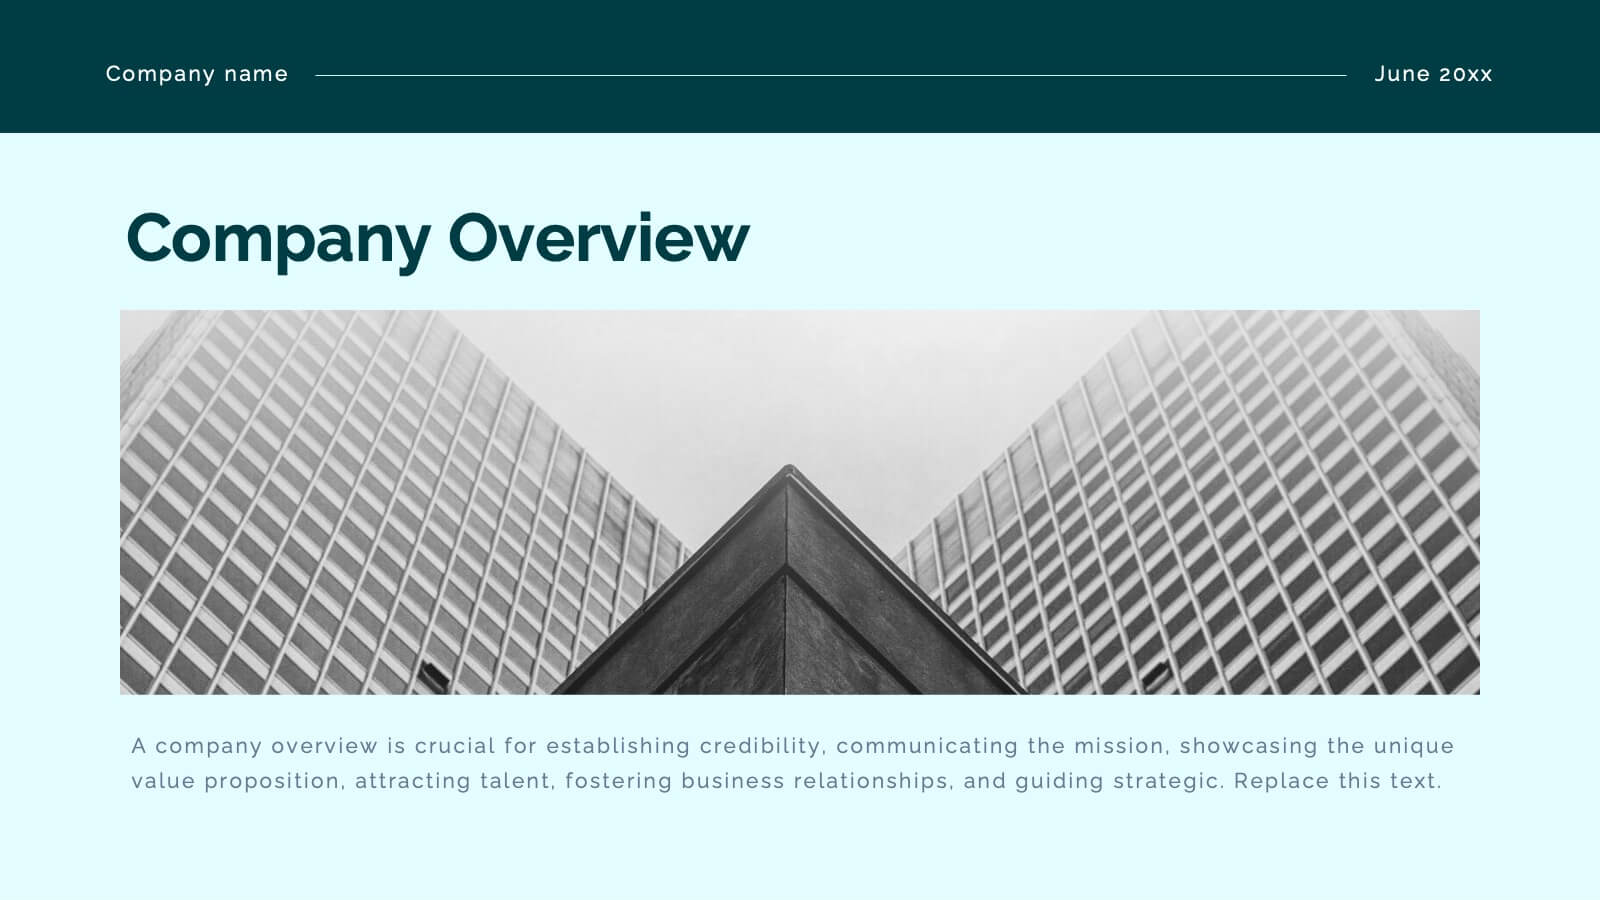
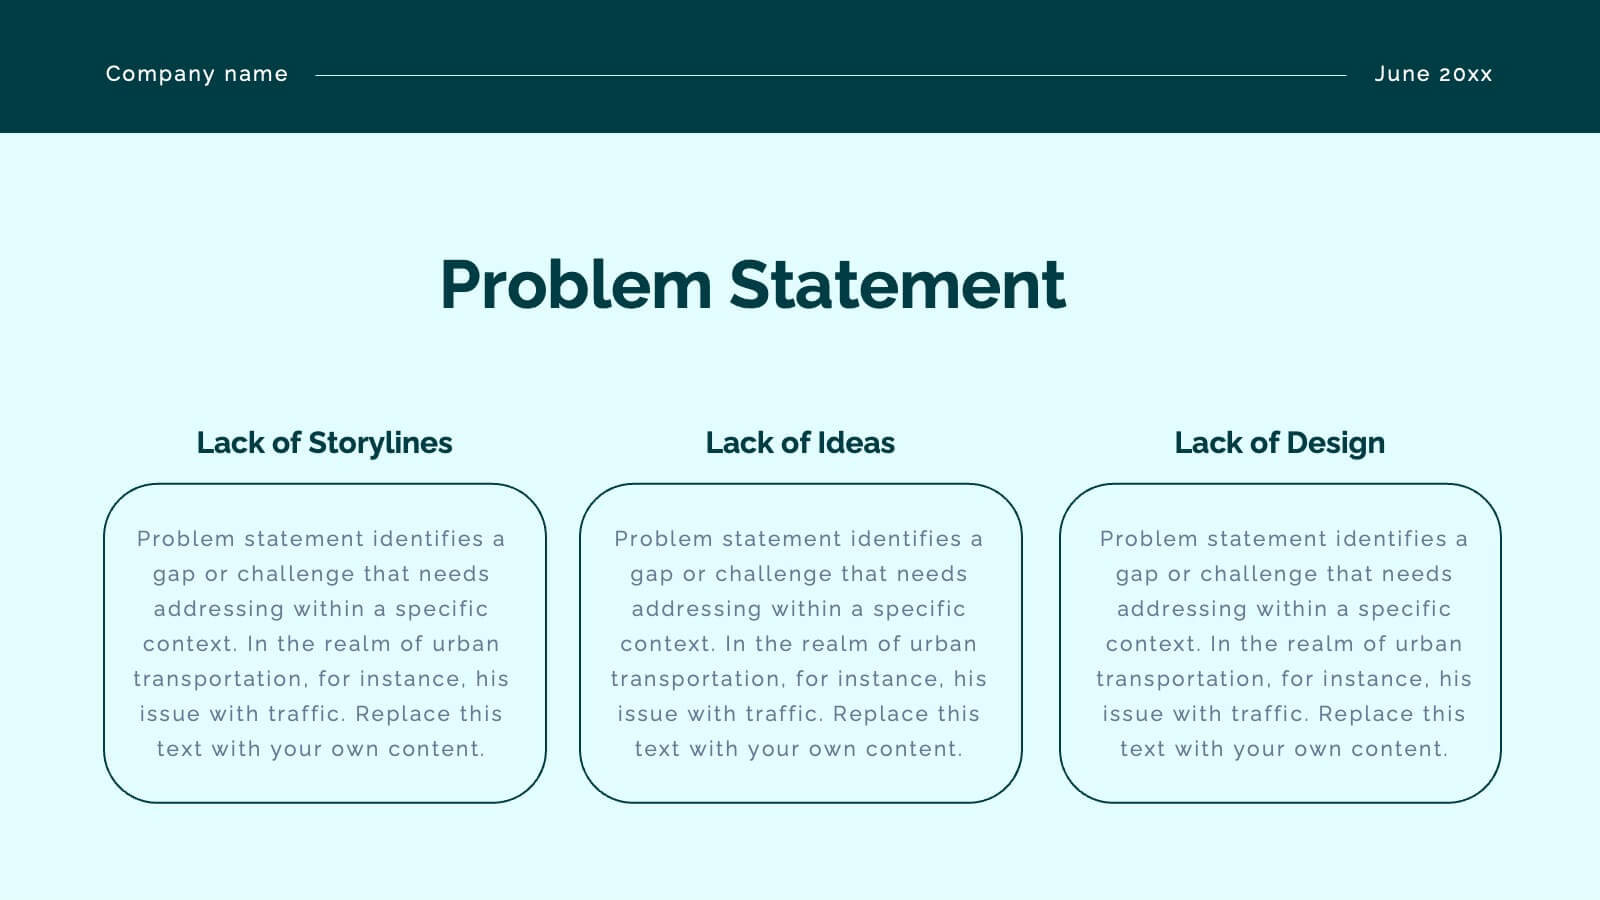
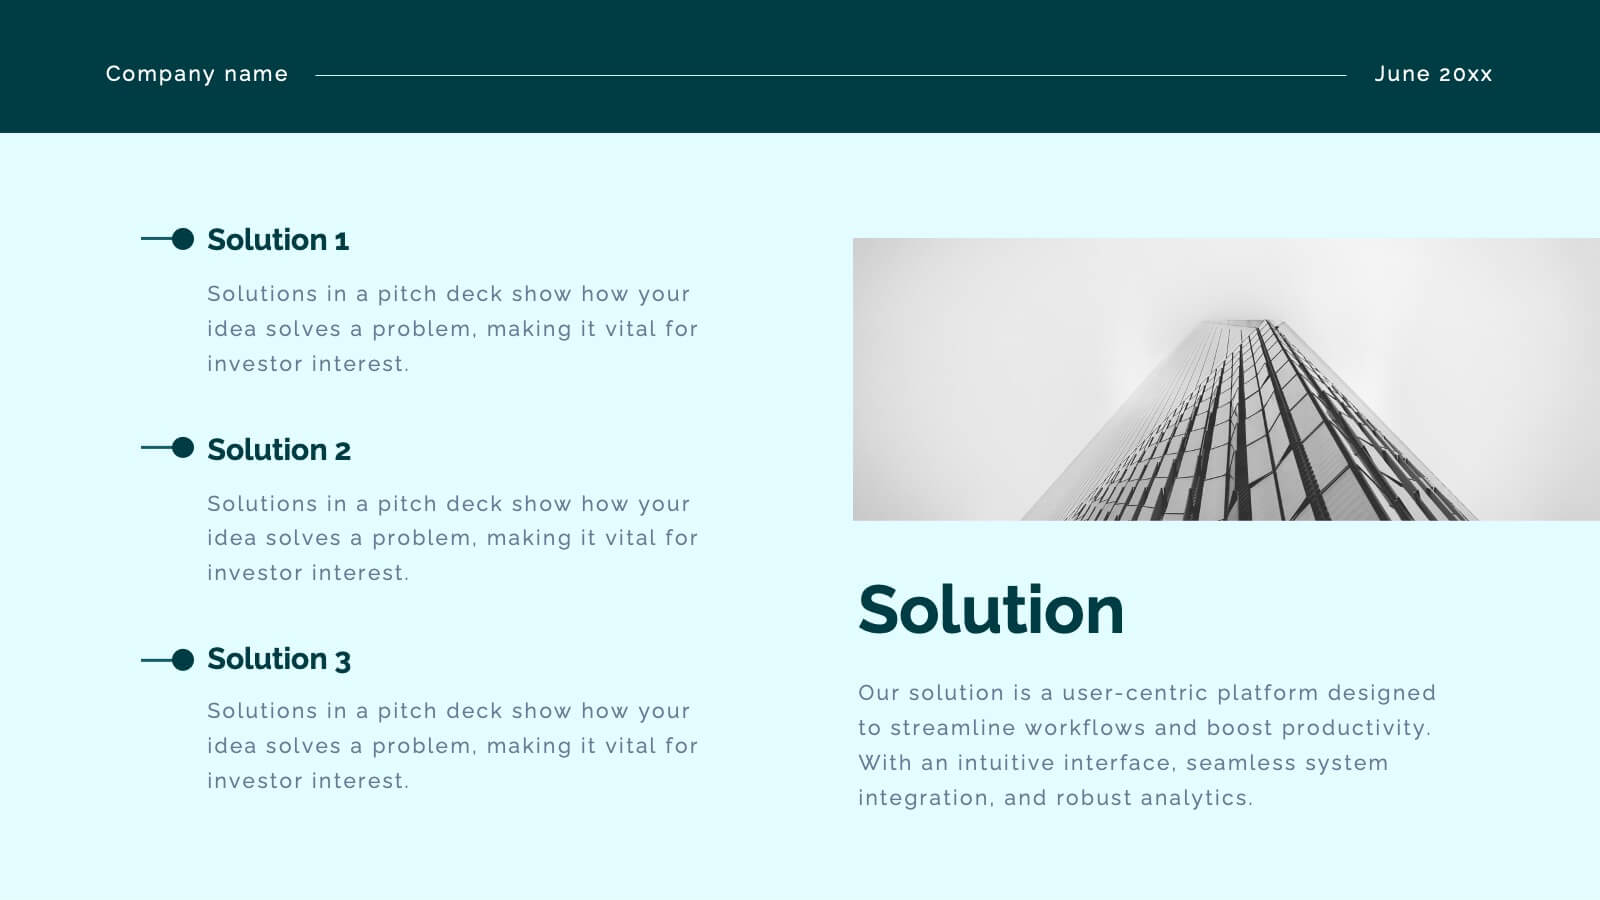
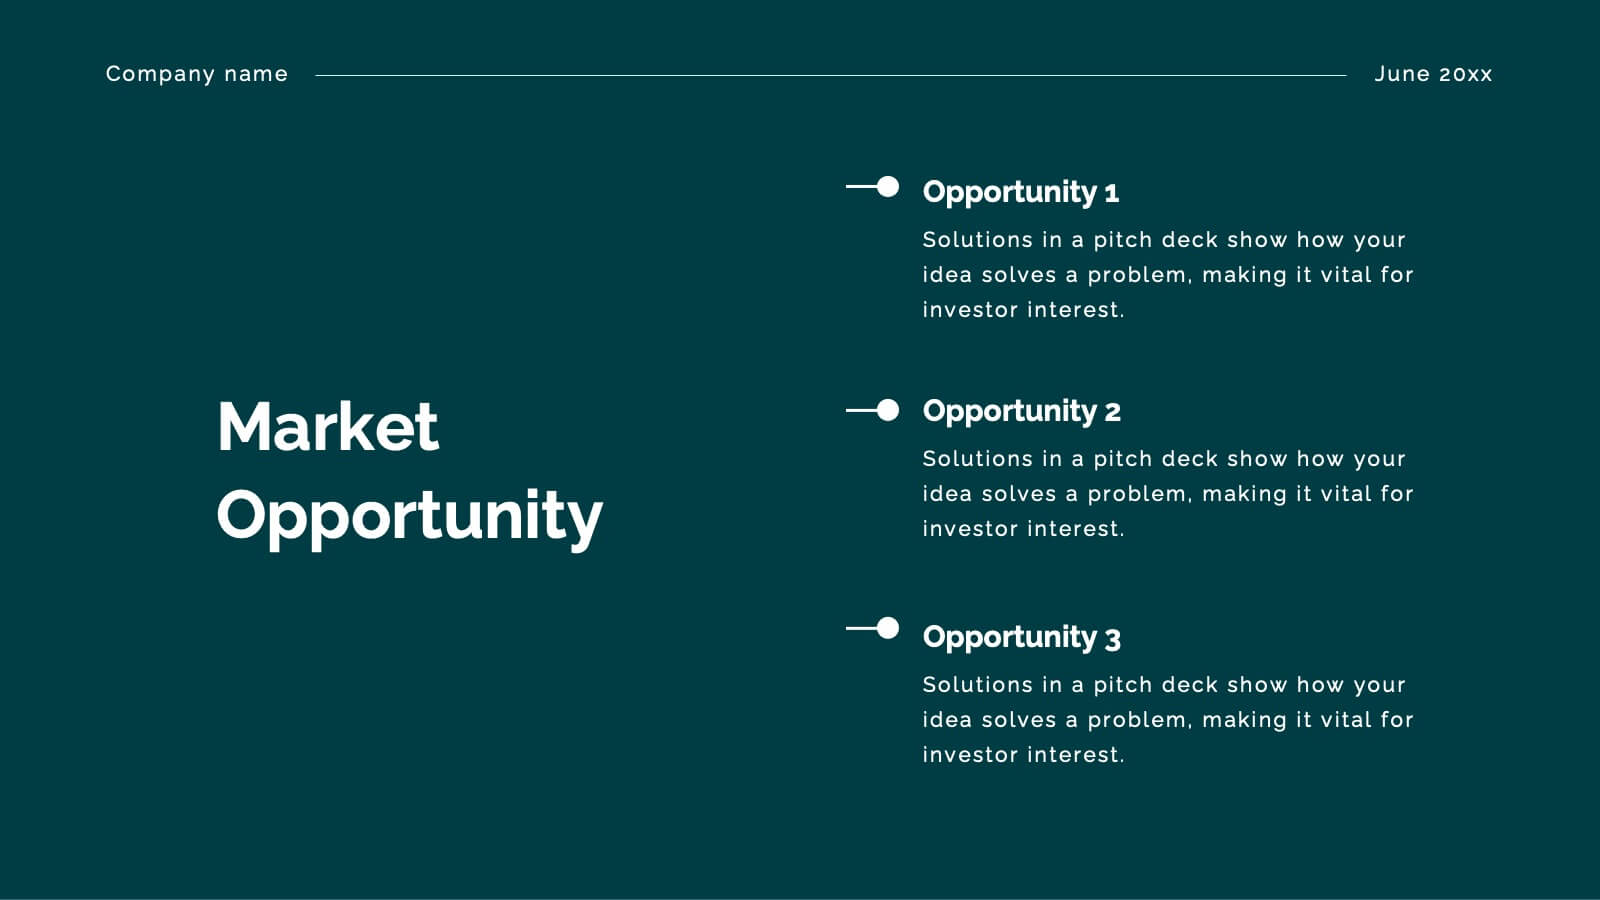
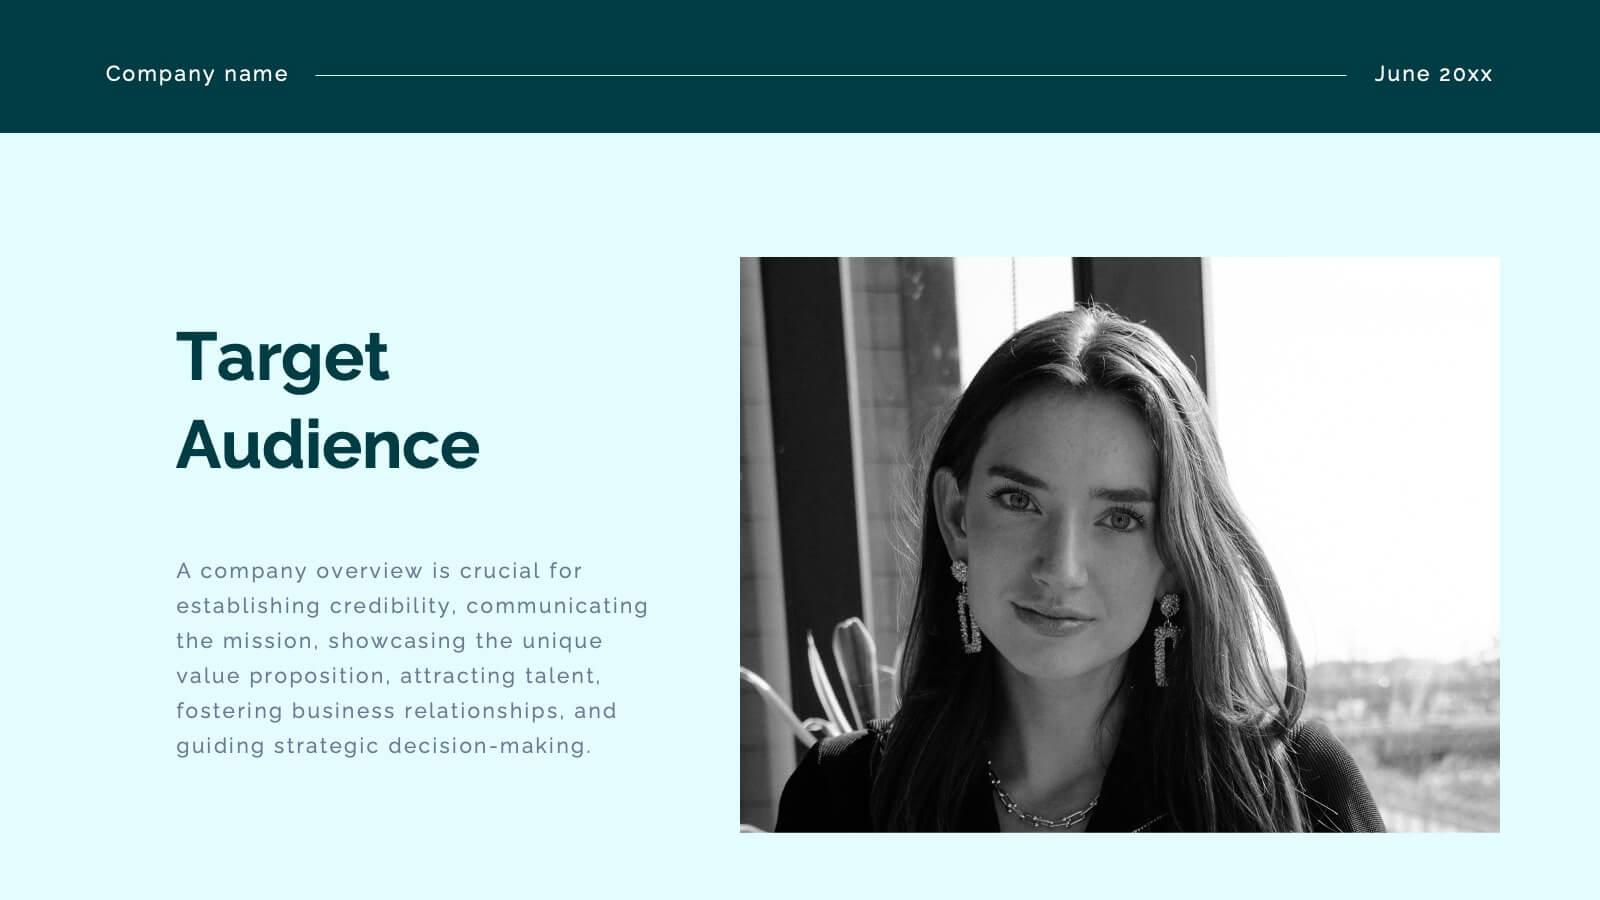
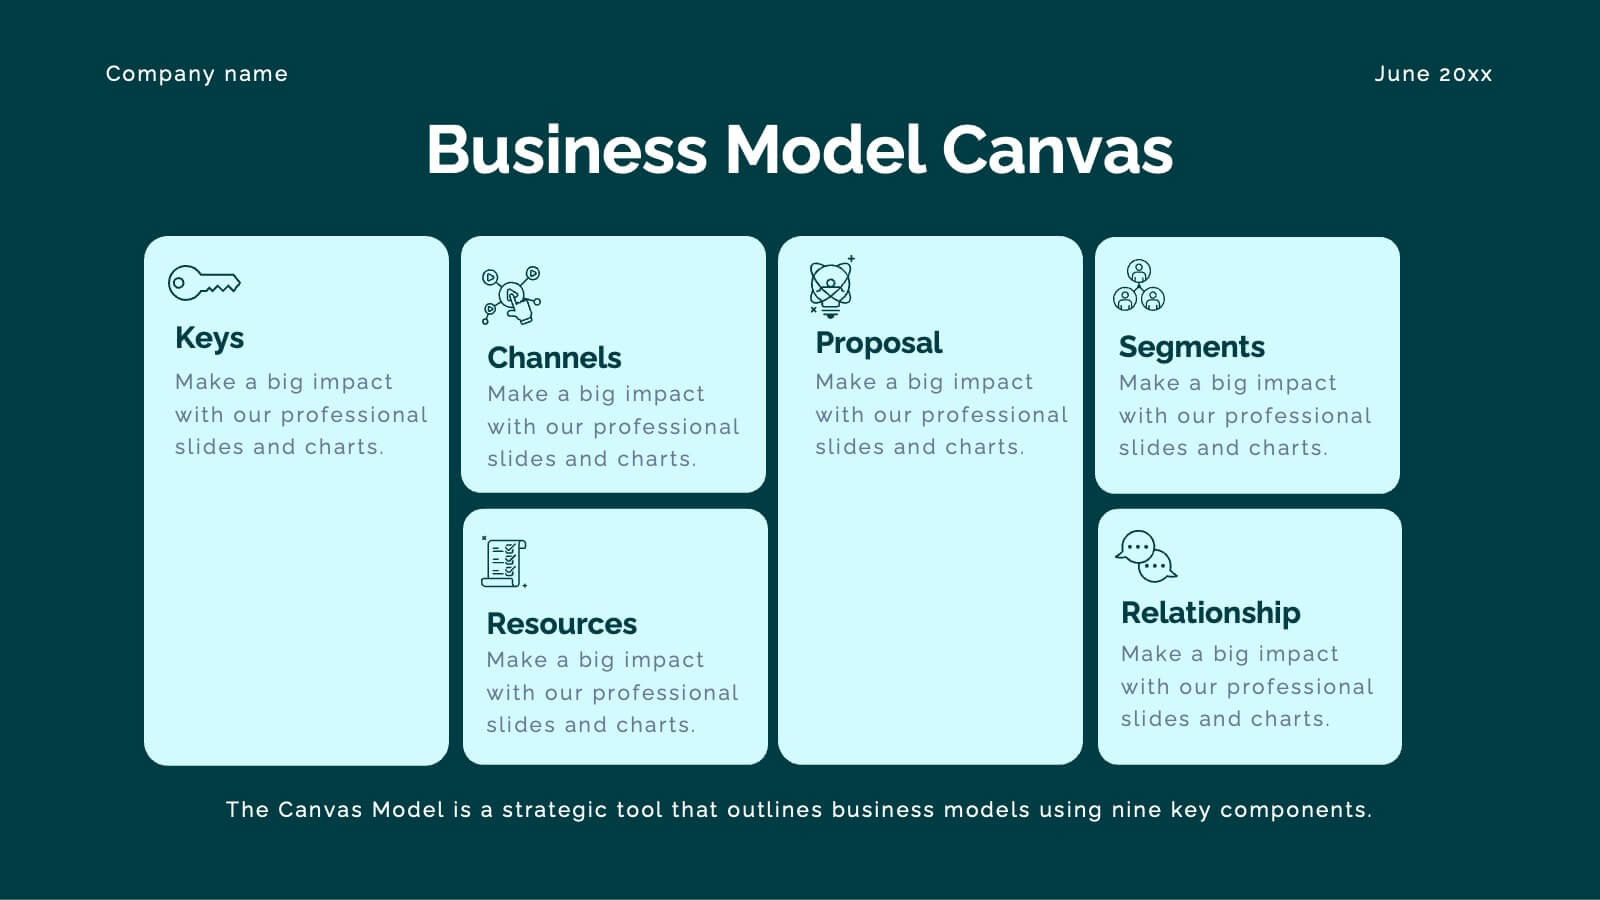
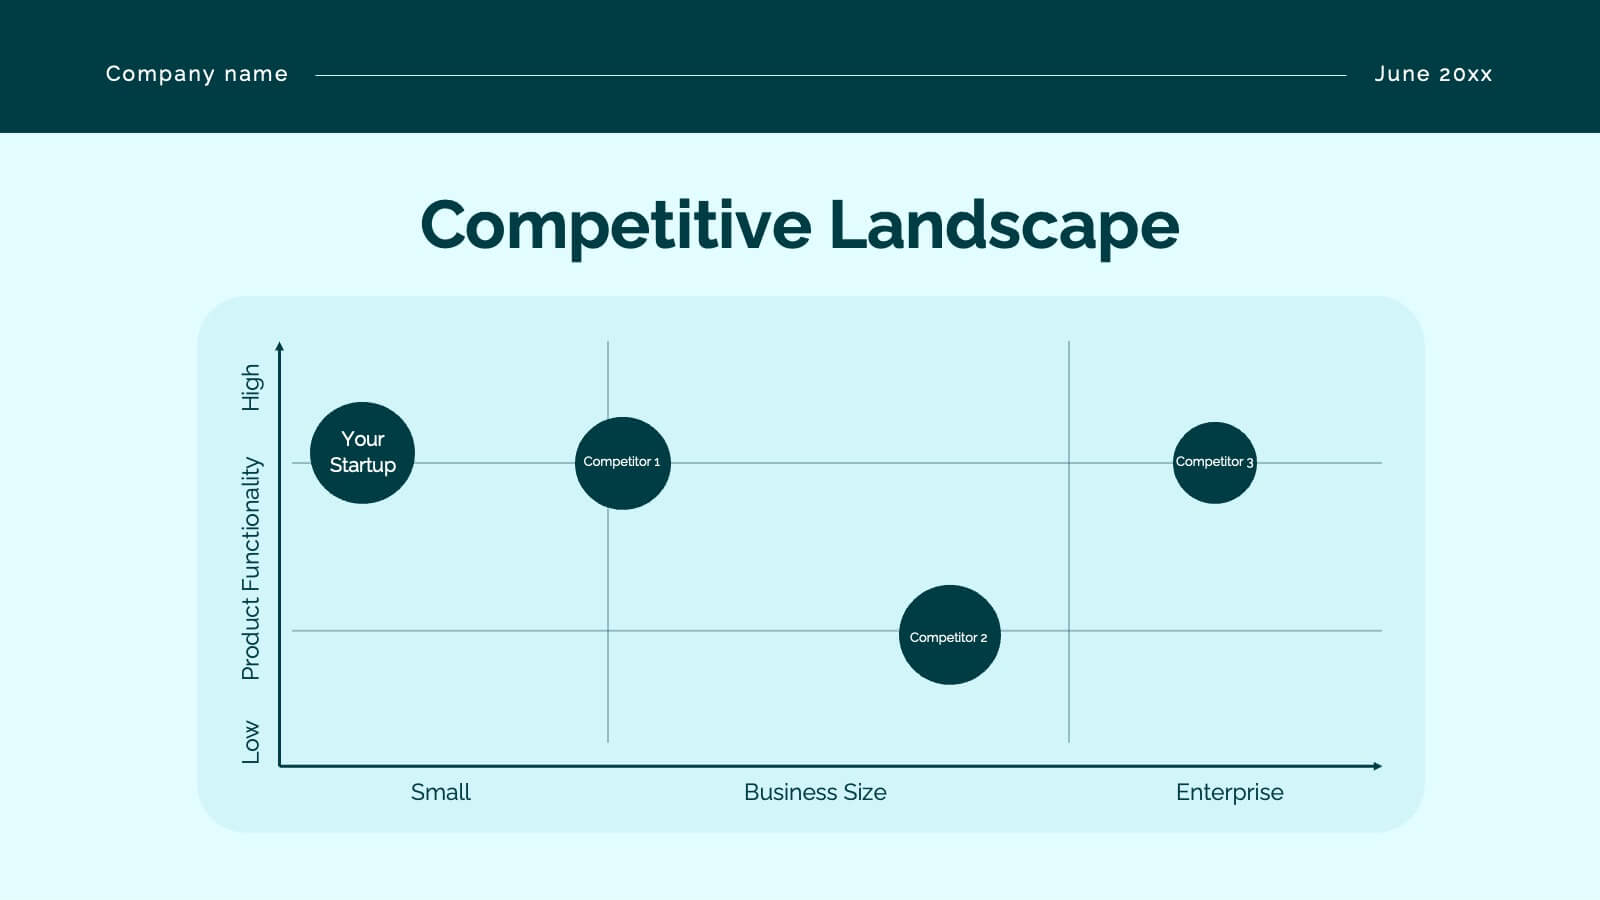
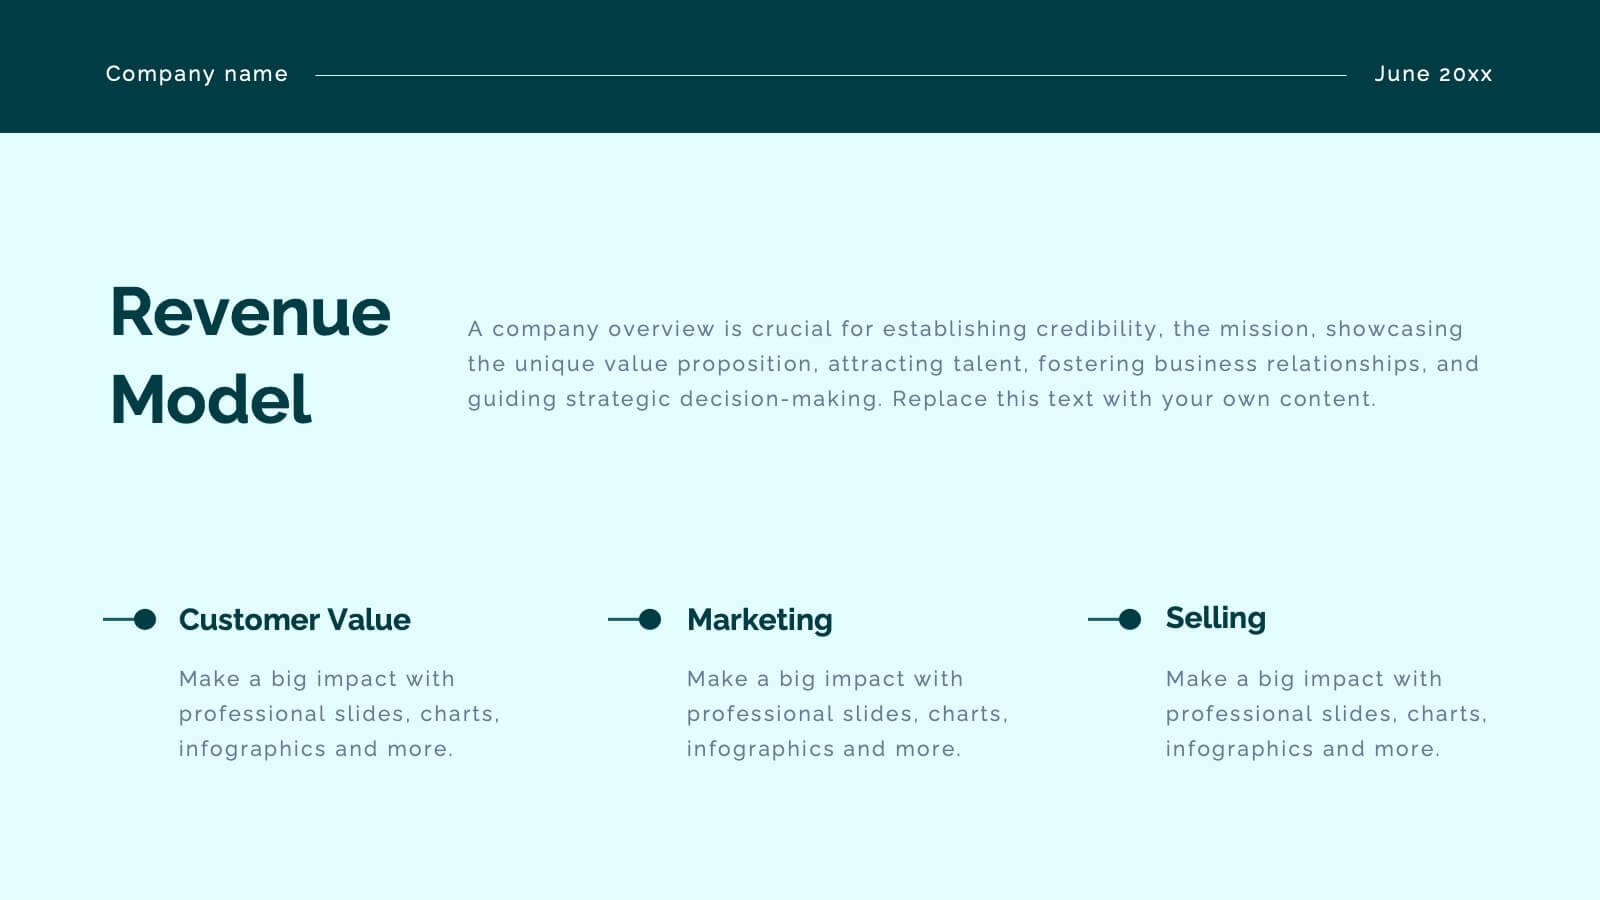
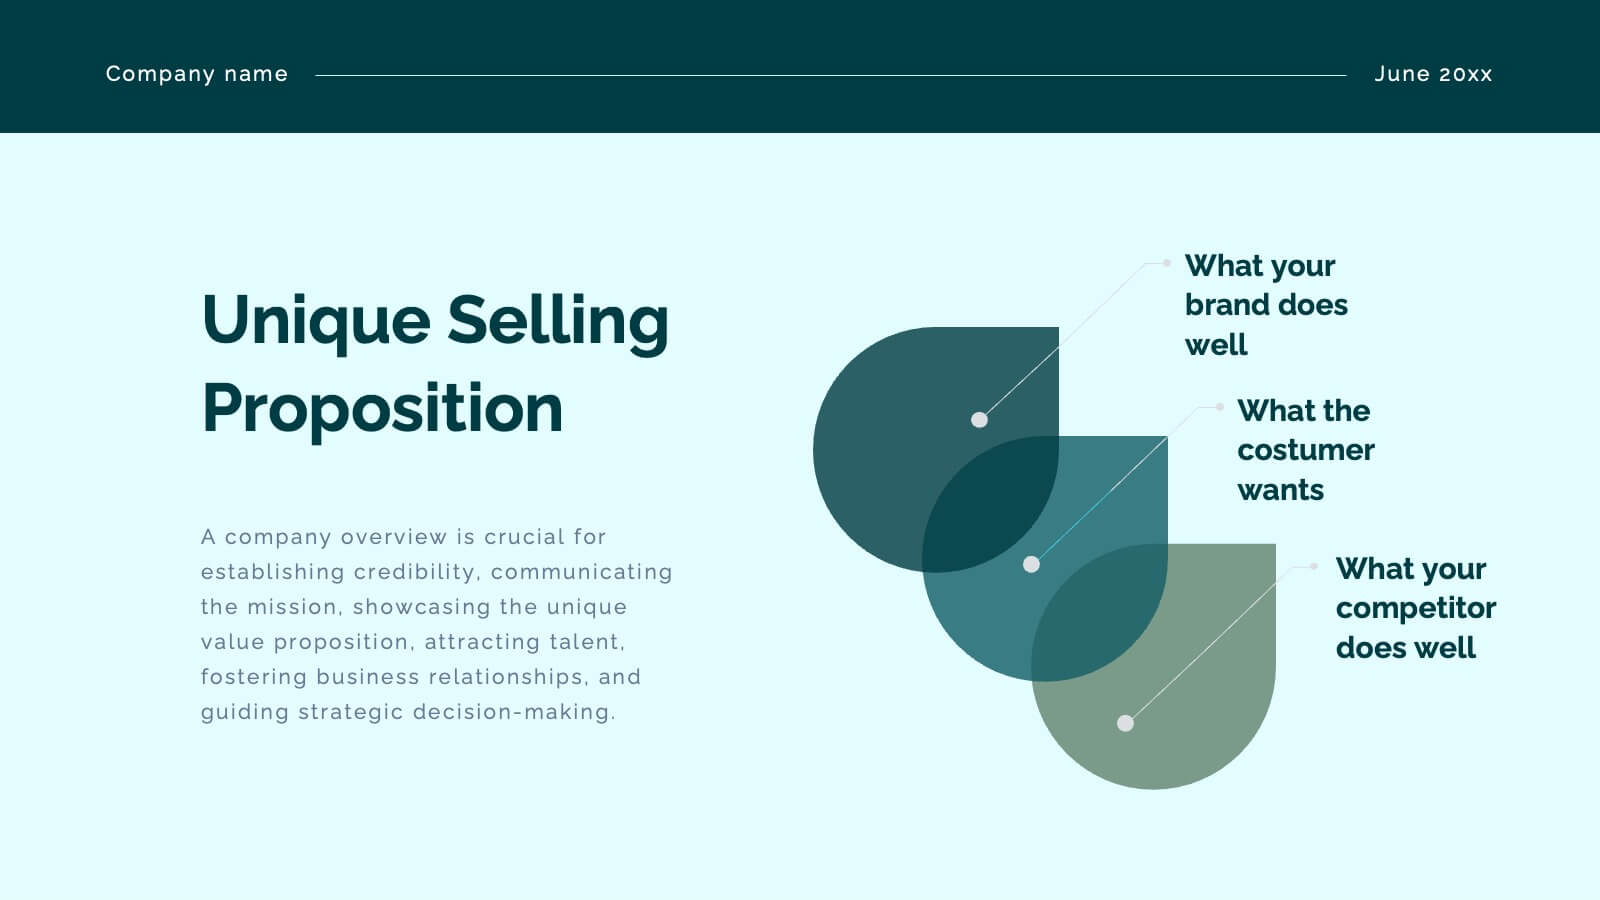
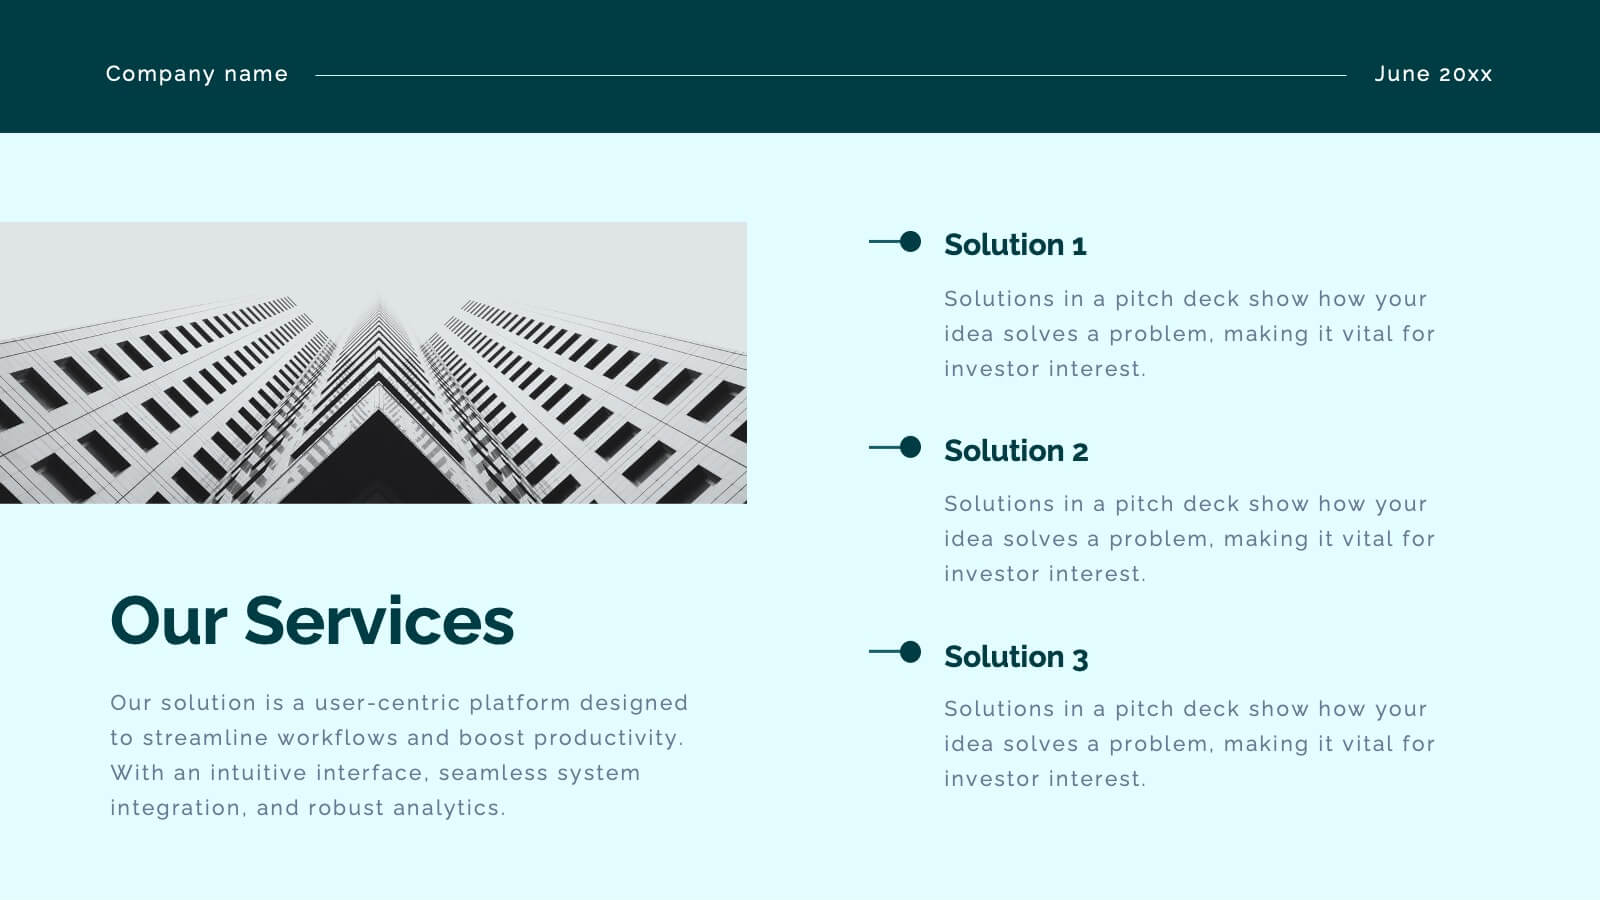
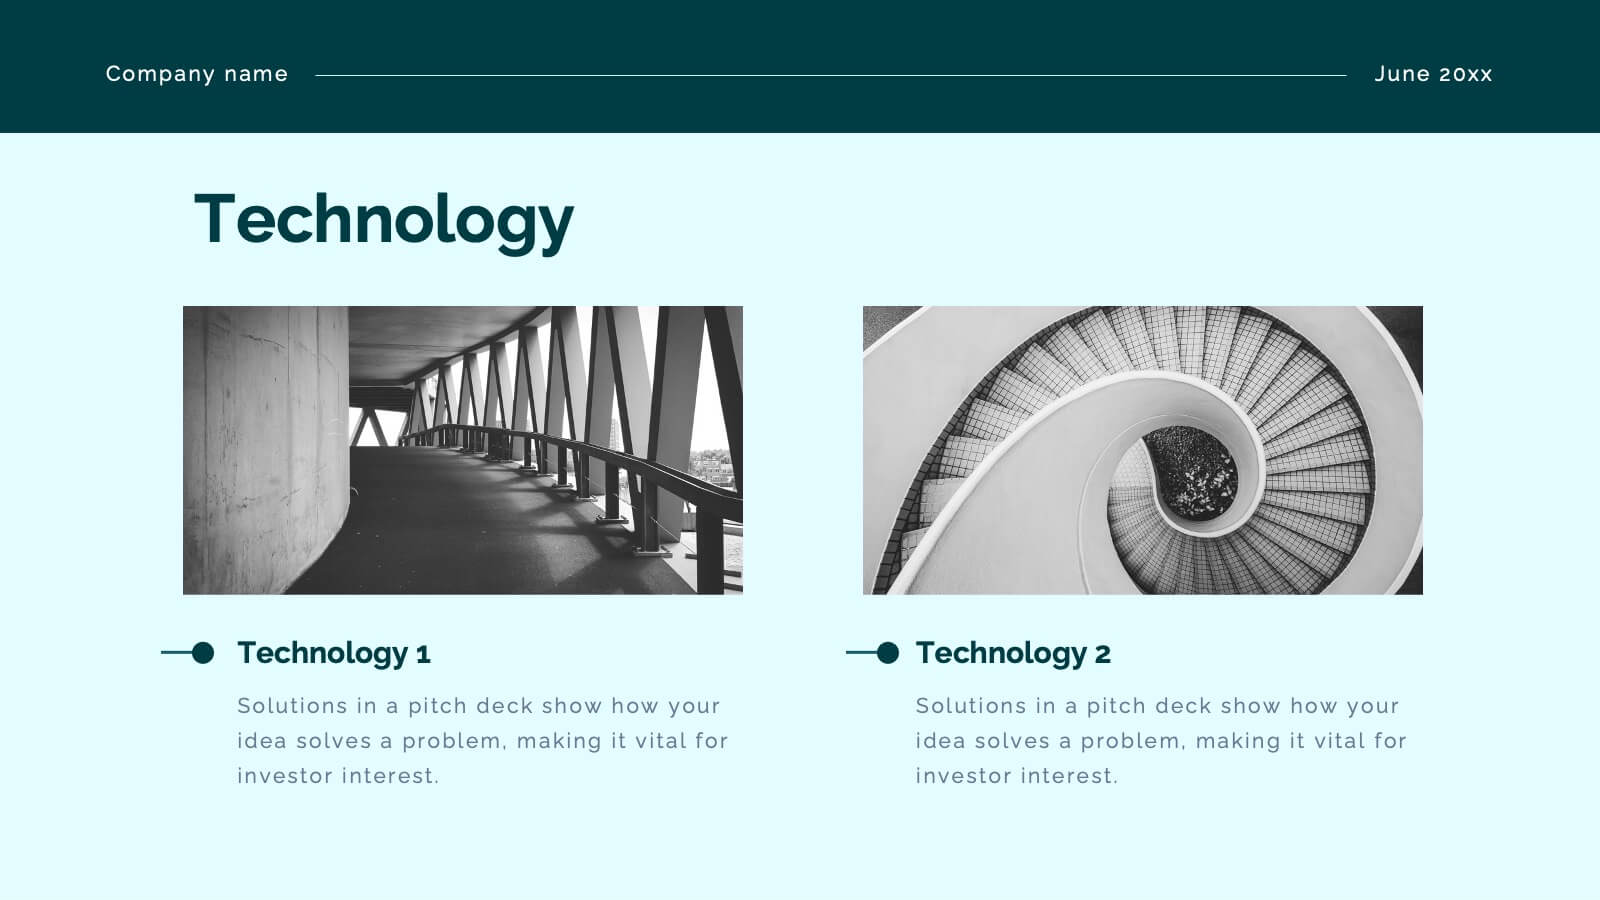
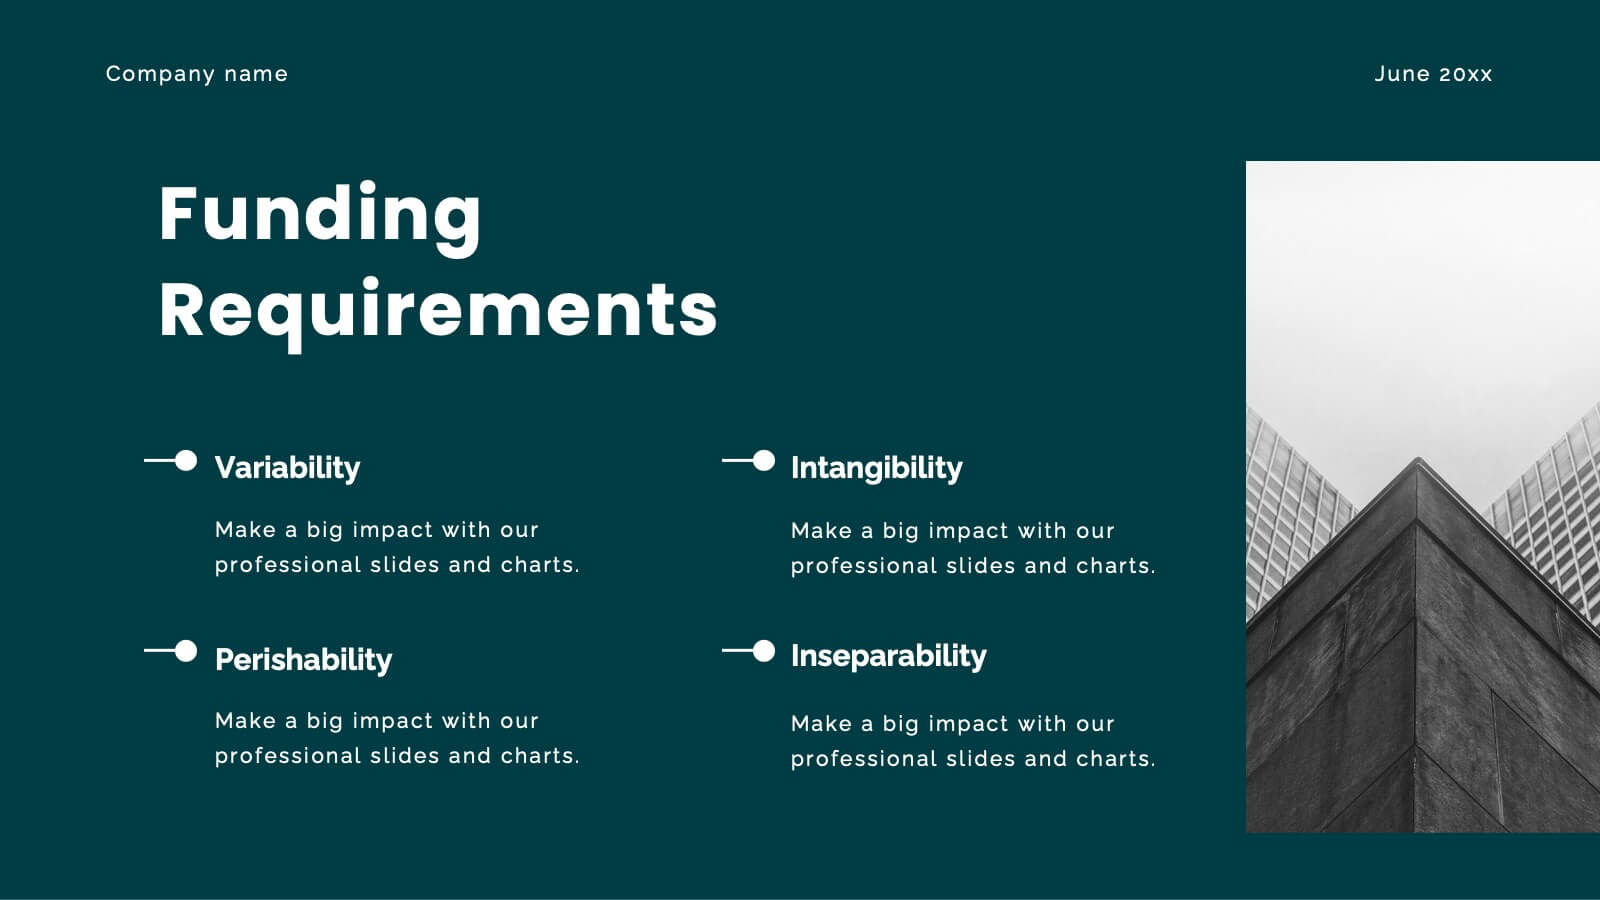
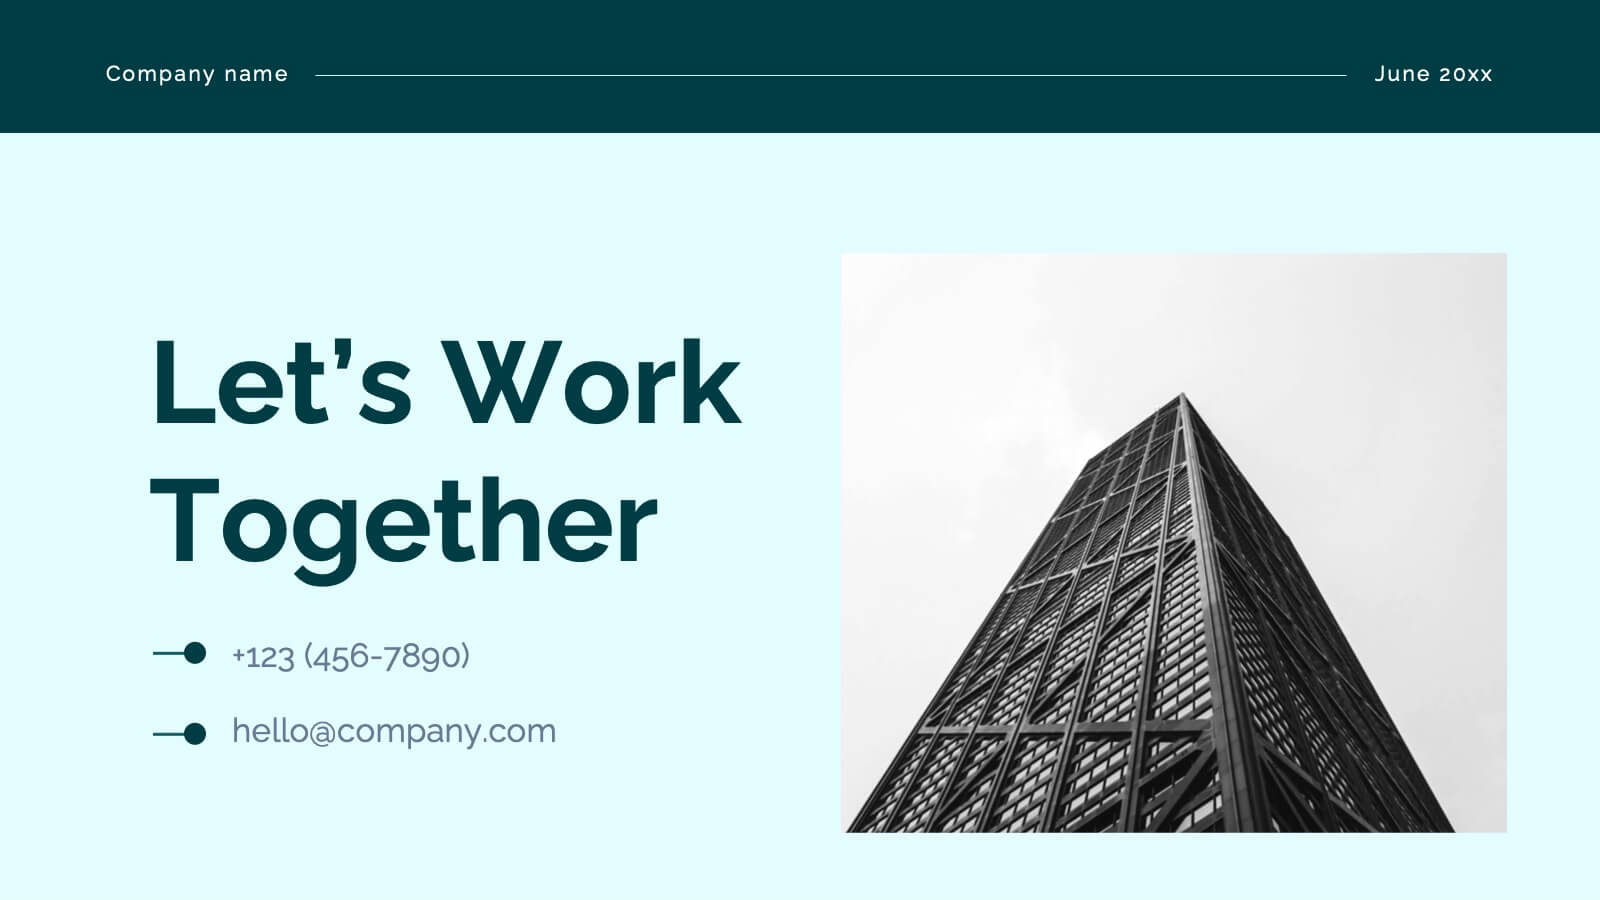
Crest Investor Pitch Presentation Presentation
Unleash your potential with this powerful pitch deck template! Tailored for presenting innovative business ideas, it features slides for company overview, market opportunity, competitive landscape, and financial projections. Clearly communicate your value proposition and impress investors with professional design and concise content. Compatible with PowerPoint, Keynote, and Google Slides for seamless presentations on any platform.


26 diapositivas
Ander Presentation Template
We are proud to present Ander a unique, creative and professional template that's perfect for creating inspiring presentations, portfolios and business documents. With this business presentation template, you can easily share your ideas, company identity, and other information more closely with the public in an easy-to-understand way. With light earthy tones, peaceful aesthetic, clean and aesthetically pleasing design you’ll be sure to make your business stand out from the rest of the competition.


5 diapositivas
Scientific Process and Research Framework Presentation
Present each stage of your scientific research with clarity using this linear flow diagram. Ideal for breaking down experiments, protocols, or academic processes into structured phases. Features labeled sections, icons, and directional arrows to guide your audience. Fully editable in PowerPoint, Keynote, and Google Slides to match your content needs.
10 diapositivas
Professional Business People Icons Presentation
The "Professional Business People Icons" presentation template offers a range of icons designed to represent business roles or activities visually. These slides are structured to incorporate iconography alongside text placeholders, allowing for easy customization to describe specific business functions or departments. The use of simple, clean icons ensures that the content is accessible and straightforward, suitable for professional presentations that require a blend of visual appeal and clarity. This template can effectively communicate various aspects of business operations or team roles in corporate presentations.


6 diapositivas
Project Management Responsibility Assignment Matrix Infographics
Effectively assign responsibilities in your projects with our Project Management Responsibility Assignment Matrix (RAM) infographic template. This template is fully compatible with popular presentation software like PowerPoint, Keynote, and Google Slides, allowing you to easily customize it to illustrate and communicate the roles and responsibilities of team members in your project. The Project Management RAM infographic template offers a visually engaging platform to outline the key tasks, deliverables, and responsibilities of project team members. Whether you're a project manager, team leader, or involved in project planning, this template provides a user-friendly canvas to create informative presentations and project management materials. Optimize your project management processes with this SEO-optimized Project Management RAM infographic template, thoughtfully designed for clarity and ease of use. Customize it to showcase the matrix structure, define roles (RACI), and ensure that everyone on the team understands their responsibilities, ensuring efficient project execution. Start crafting your personalized infographic today to excel in project management responsibility assignment.


6 diapositivas
Business Growth Metrics Butterfly Chart
Highlight performance patterns and opportunities with the Business Growth Metrics Butterfly Chart Presentation. This engaging layout uses mirrored radial segments to present six growth indicators—ideal for tracking progress across two categories, departments, or timeframes. The butterfly-shaped curves draw the viewer’s attention to the center, making comparisons intuitive and visually balanced. Fully customizable in PowerPoint, Keynote, and Google Slides, this template is perfect for showcasing KPI trends, sales metrics, or marketing performance.


6 diapositivas
Market Segmentation by Demographics
Visually break down consumer behavior by gender with this clean, gender-split demographic chart. Ideal for marketing analysts and business strategists, this slide highlights key audience insights, purchasing trends, or engagement metrics. Fully editable in PowerPoint, Keynote, and Google Slides.


7 diapositivas
Business Decision-Making Questions Presentation
Streamline your decision-making process with this engaging and structured presentation slide. Featuring a lightbulb and question mark design, this template effectively illustrates problem-solving and strategic choices in a professional and visually appealing way. Ideal for business strategy, consulting, and brainstorming sessions, it is fully editable, allowing you to customize text, colors, and layout to fit your needs. Compatible with PowerPoint, Keynote, and Google Slides for seamless use.