


Características


¿Tienes alguna pregunta?
Recomendar


8 diapositivas
Economic Improvement in South America Map Presentation
Highlight regional performance with this South America economic growth map. Featuring 3D bar charts and country-specific markers, it’s ideal for visualizing financial progress, investments, or development trends. Fully editable in PowerPoint, Google Slides, and Keynote, this layout is perfect for reports, forecasts, and business reviews with a geographic focus.


6 diapositivas
Agile Development Process Presentation
Bring your process to life with a bold circular workflow that makes each development stage easy to explain and visually engaging. This presentation helps teams outline steps, refine tasks, and communicate progress with clarity and flow. Fully editable and compatible with PowerPoint, Keynote, and Google Slides.


5 diapositivas
Team Role Distribution Matrix Presentation
Clarify responsibilities and improve collaboration with the Team Role Distribution Matrix Presentation. This RACI-style slide helps visualize team accountability across multiple tasks, making it ideal for project management, cross-functional teams, or workflow planning. Each layout option includes clearly labeled roles and color-coded responsibilities: Responsible, Accountable, Consulted, and Informed. Fully editable in Canva, PowerPoint, Keynote, and Google Slides.


7 diapositivas
Break Even Analysis Formula Infographic
Simplify financial planning with our Break-Even Analysis Formula Infographic, a must-have for financial analysts, business owners, and entrepreneurs. This infographic visually demonstrates the break-even point, where total costs and total revenue are equal, meaning no net loss or gain. Our infographic illustrates how to calculate the break-even point with variables such as fixed costs, variable costs, price per unit, and the number of units sold. By clearly delineating these components, the infographic aids in understanding the dynamics of profit and loss and assists in strategic pricing and cost management. You can customize this infographic to reflect your own data, making it an integral part of business plans, financial reports, and investor presentations. This SEO-optimized tool is designed to be easily understandable and shareable, ensuring your financial analysis reaches a wider audience. Utilize our Break-Even Analysis Formula Infographic for a clear, concise depiction of your financial threshold, helping to inform decisions on product pricing, cost control, and sales targets.


2 diapositivas
Professional Cover and Title Layout
Make a bold first impression with this stylish and modern cover slide template. Featuring a balanced design of imagery and typography, it's perfect for business reports, marketing decks, or strategic plans. Fully editable in PowerPoint, Keynote, and Google Slides for effortless customization.


4 diapositivas
Economic Trends and Analysis of North America Map Presentation
Present key regional insights with this North America economic analysis map. Compare up to four locations using percentage stats and customizable titles. Ideal for showcasing market trends, financial metrics, or growth data. Fully editable in PowerPoint, Keynote, and Google Slides—perfect for economic forecasts, business reports, or strategy meetings.


21 diapositivas
Mystorin Market Analysis Report Presentation
Present your market analysis findings with this sleek and professional report presentation template. Covering essential sections such as key highlights, performance metrics, competitor insights, and strategic initiatives, it provides a comprehensive framework for data-driven decisions. Ideal for businesses and analysts. Compatible with PowerPoint, Keynote, and Google Slides for easy customization.


6 diapositivas
Demographic and Behavioral Customer Profile Presentation
Understand your audience better with the Demographic and Behavioral Customer Profile Presentation. This visually engaging template separates key demographic details from behavior-based insights to help you build more effective marketing strategies. Fully customizable in Canva, PowerPoint, or Google Slides—perfect for marketers, strategists, and sales teams targeting customer segmentation.


4 diapositivas
Strategic Planning Business Framework Presentation
Sharpen your strategic vision with the Strategic Planning Business Framework presentation. This modern, radial diagram slide uses a target-and-arrow layout to symbolize precision, focus, and goal alignment across four key business areas. Each quadrant features customizable sections for initiatives, insights, or performance metrics—ideal for planning sessions, quarterly reviews, or executive briefings. The clean design and visual balance make your content easy to understand at a glance. Fully editable and compatible with PowerPoint, Keynote, and Google Slides.


5 diapositivas
Strategic HR Planning with Skills Gap Analysis Presentation
Supercharge your strategic HR planning with our 'Skills Gap Analysis' presentation template. This tool is designed to help you visualize and address the skills gaps within your organization efficiently. Engage your team with clear, data-driven insights that foster targeted development plans. Compatible with PowerPoint, Keynote, and Google Slides, it's the perfect addition to your HR toolkit.


6 diapositivas
Company Profile Growth Infographic
The collection of templates presented offers a valuable resource for businesses aiming to articulate their growth and current market standing comprehensively. These templates are designed to deliver essential information through a well-structured and visually appealing format, ideal for engaging stakeholders effectively. Each design is tailored to showcase various aspects of company progress, including detailed financial growth, strategic direction, and key achievements. Features such as timelines, growth charts, and key performance indicators are seamlessly integrated, providing a clear snapshot of the company's journey and ambitions. The templates are adaptable to various corporate needs, making them suitable for annual reports, investor presentations, and internal reviews across different industries. The chosen color schemes and layouts ensure that information is presented clearly and attractively, enhancing readability and projecting a professional corporate image. By facilitating customization to reflect the unique characteristics of any business, these templates serve as indispensable tools for companies eager to communicate their success stories and future prospects in a compelling manner.


3 diapositivas
Event Agenda Layout Presentation
Bring structure and clarity to any event with a clean, modern layout that highlights key sessions, speakers, and timing at a glance. This presentation helps audiences follow the flow effortlessly while keeping information visually balanced. Perfect for workshops, conferences, and meetings. Fully compatible with PowerPoint, Keynote, and Google Slides.


5 diapositivas
Construction Budgeting and Resource Allocation Presentation
Visualize your construction budget layer by layer with the Construction Budgeting and Resource Allocation Presentation. This pyramid-style infographic breaks down costs and resources—from materials and labor to safety infrastructure—making it easy to communicate project allocations. Fully editable in PowerPoint, Keynote, and Google Slides.


6 diapositivas
Orientation Plan for New Employees Presentation
Welcome your new team members with confidence using a visually clear, step-based layout that streamlines the introduction process. This presentation helps HR leaders outline company values, roles, and expectations with ease and professionalism. Fully compatible with PowerPoint, Keynote, and Google Slides for effortless editing and presentation across any platform.


6 diapositivas
Digital Marketing Agency Infographic
Digital marketing refers to the use of digital channels, platforms, and technologies to promote products, services, or brands to a target audience. This infographic can help showcase the services your agency offers, your expertise, and the benefits of choosing your agency for digital marketing needs. This template is fully customizable and compatible with Powerpoint, Keynote, and Google Slides. Use icons, illustrations, and images to represent different digital marketing services and concepts. Create sections that detail the various digital marketing services your agency provides.


8 diapositivas
Process Flowchart Presentation
Visualize your workflows effortlessly with this Process Flowchart template. Designed for business presentations, it helps map out key steps with a structured, gear-based design. Fully editable with customizable colors, icons, and text for seamless adaptation. Compatible with PowerPoint, Keynote, and Google Slides for maximum flexibility and ease of use.


21 diapositivas
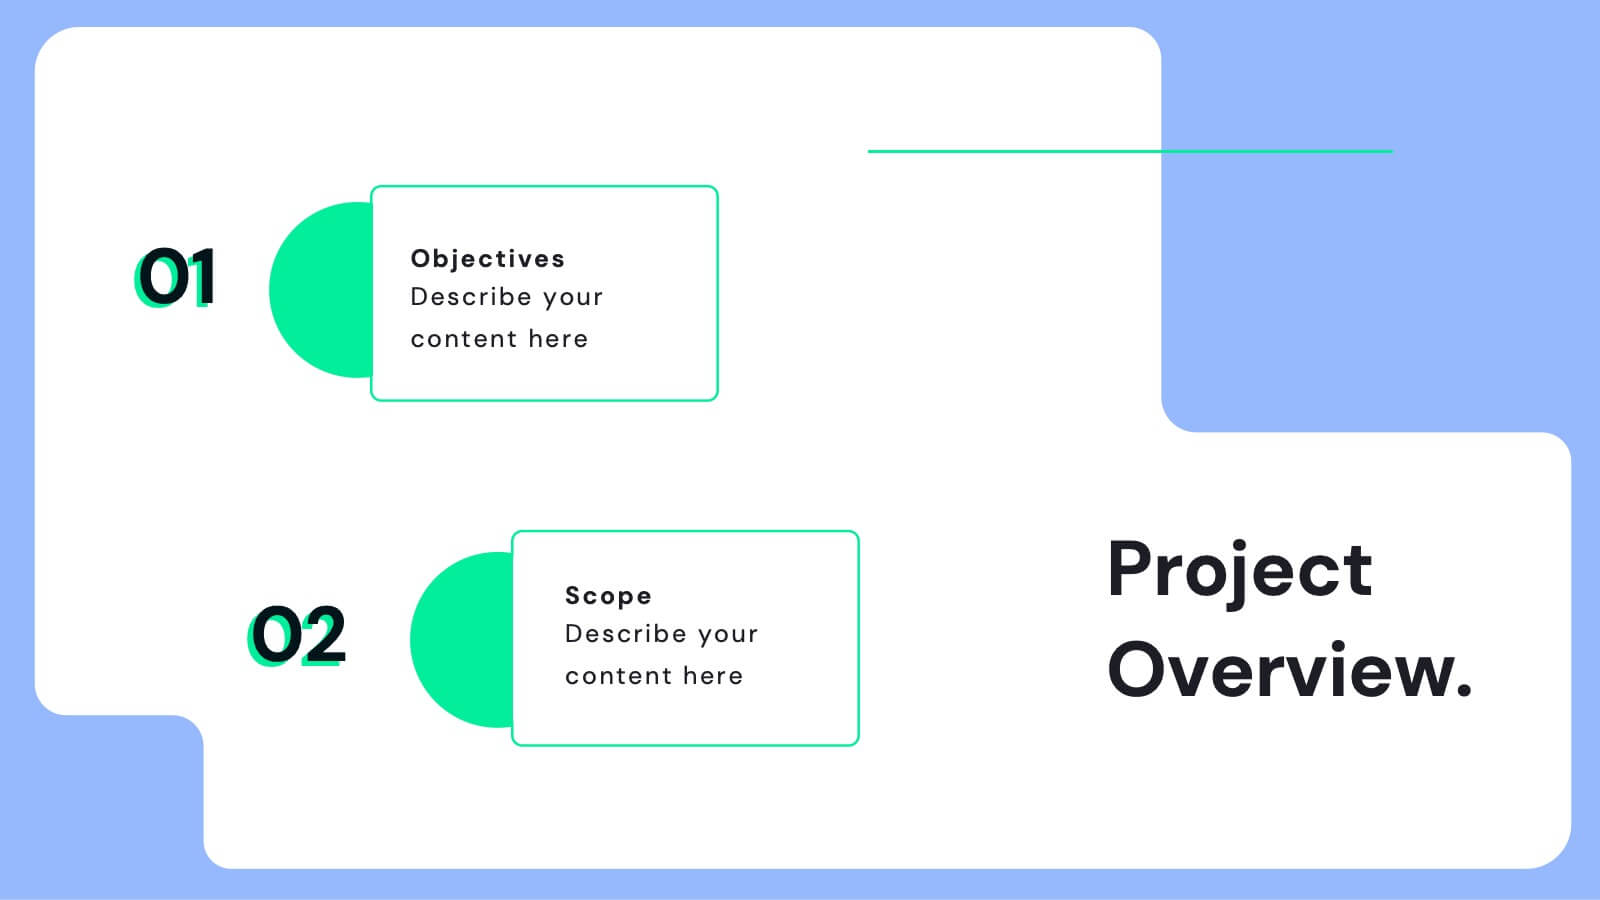
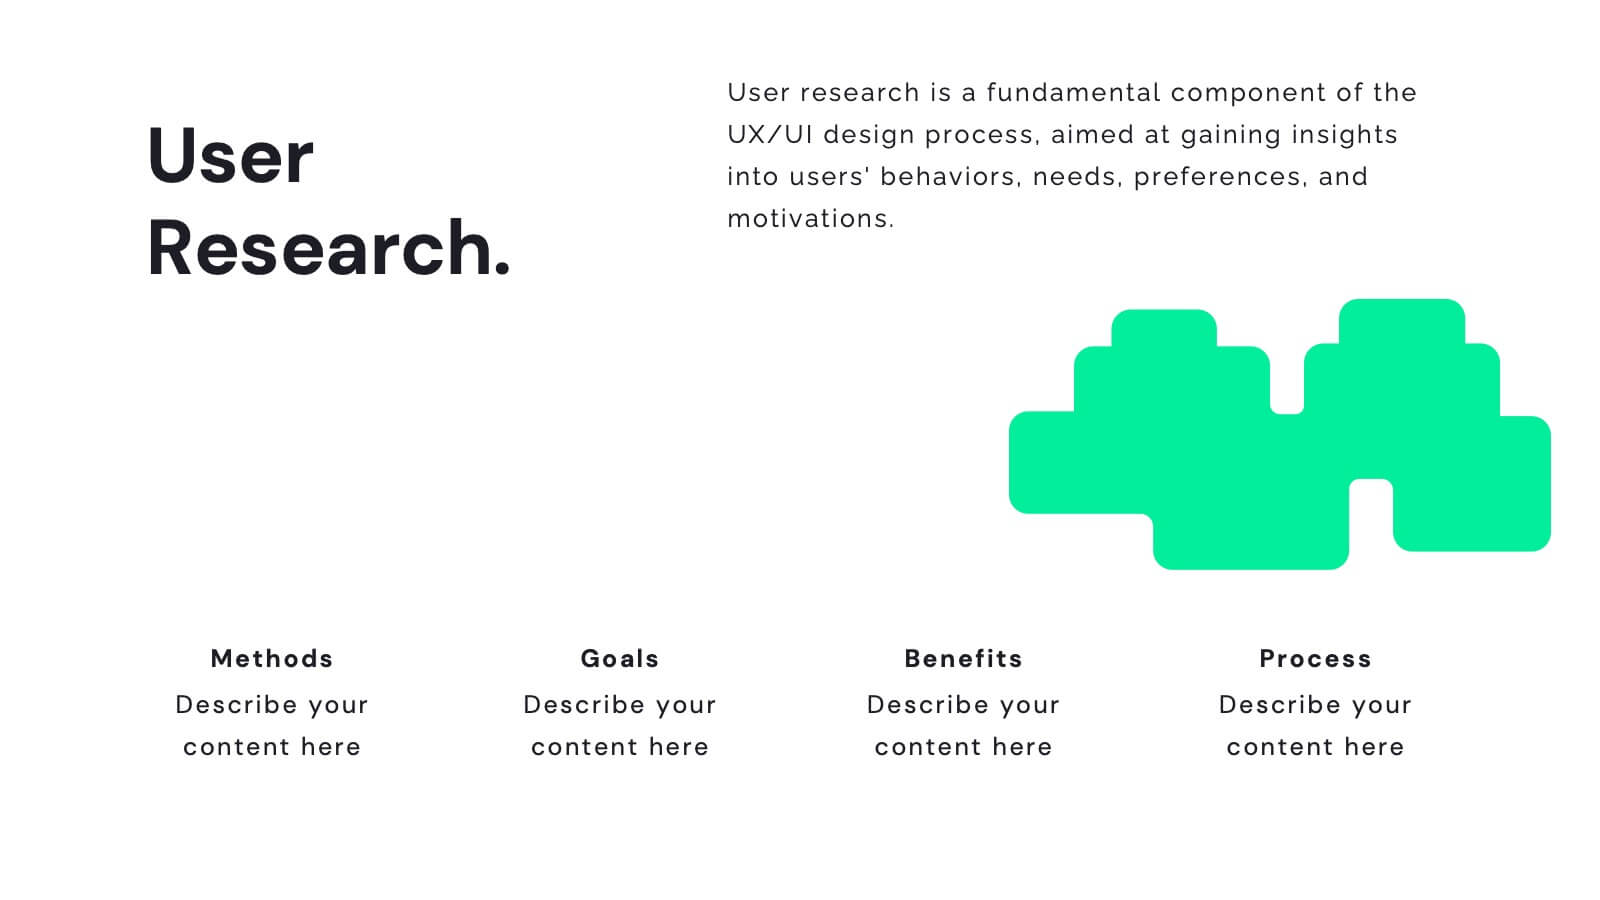
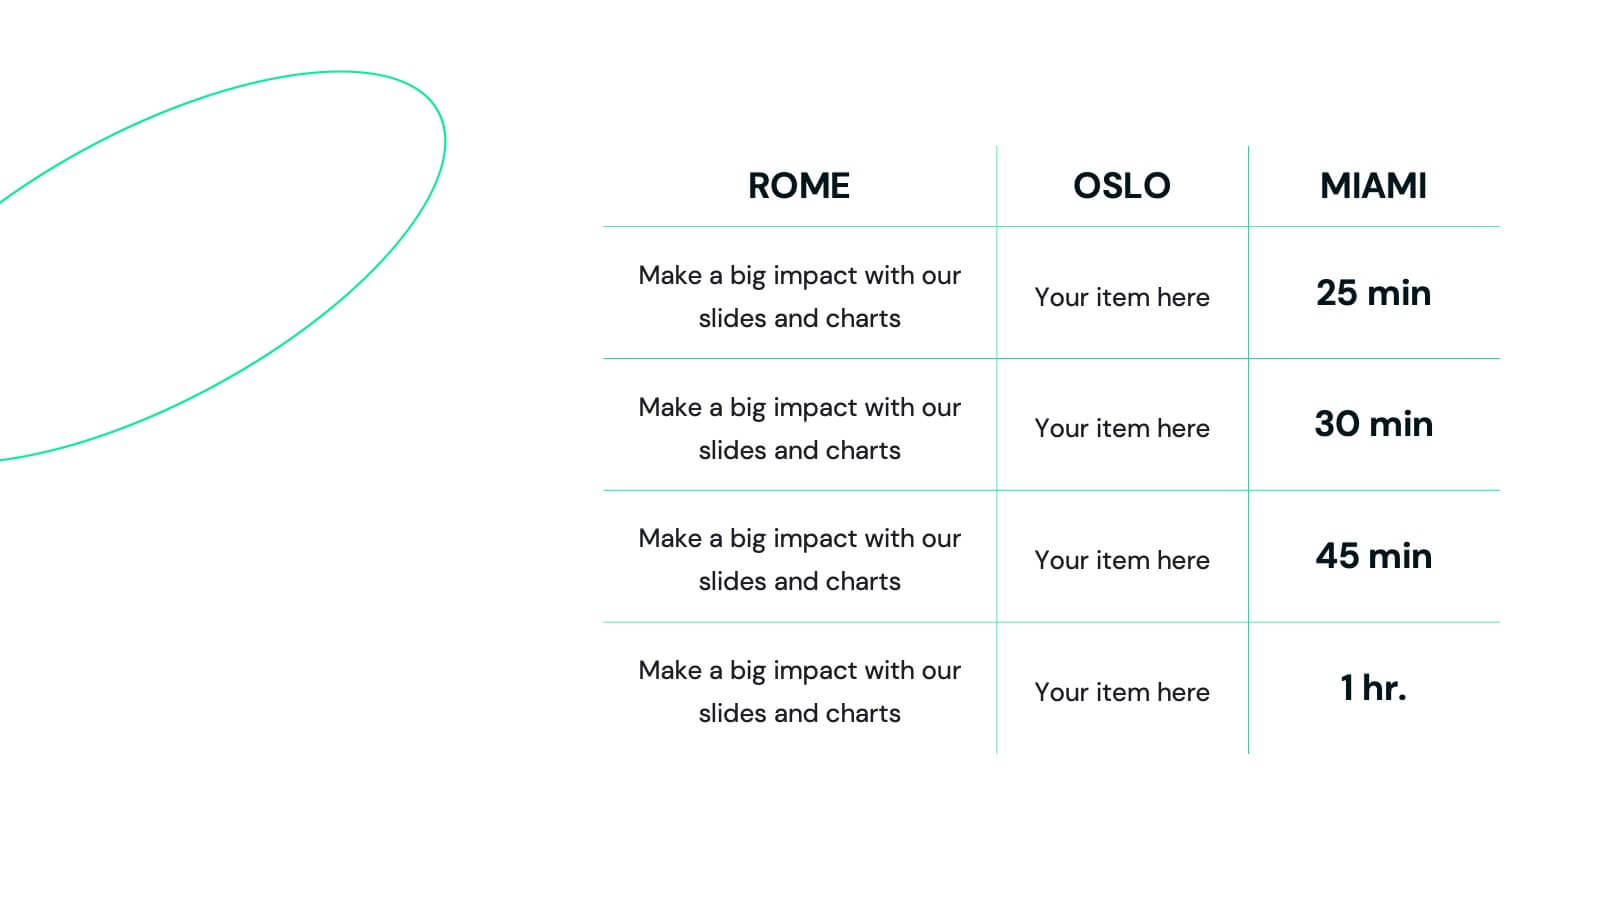
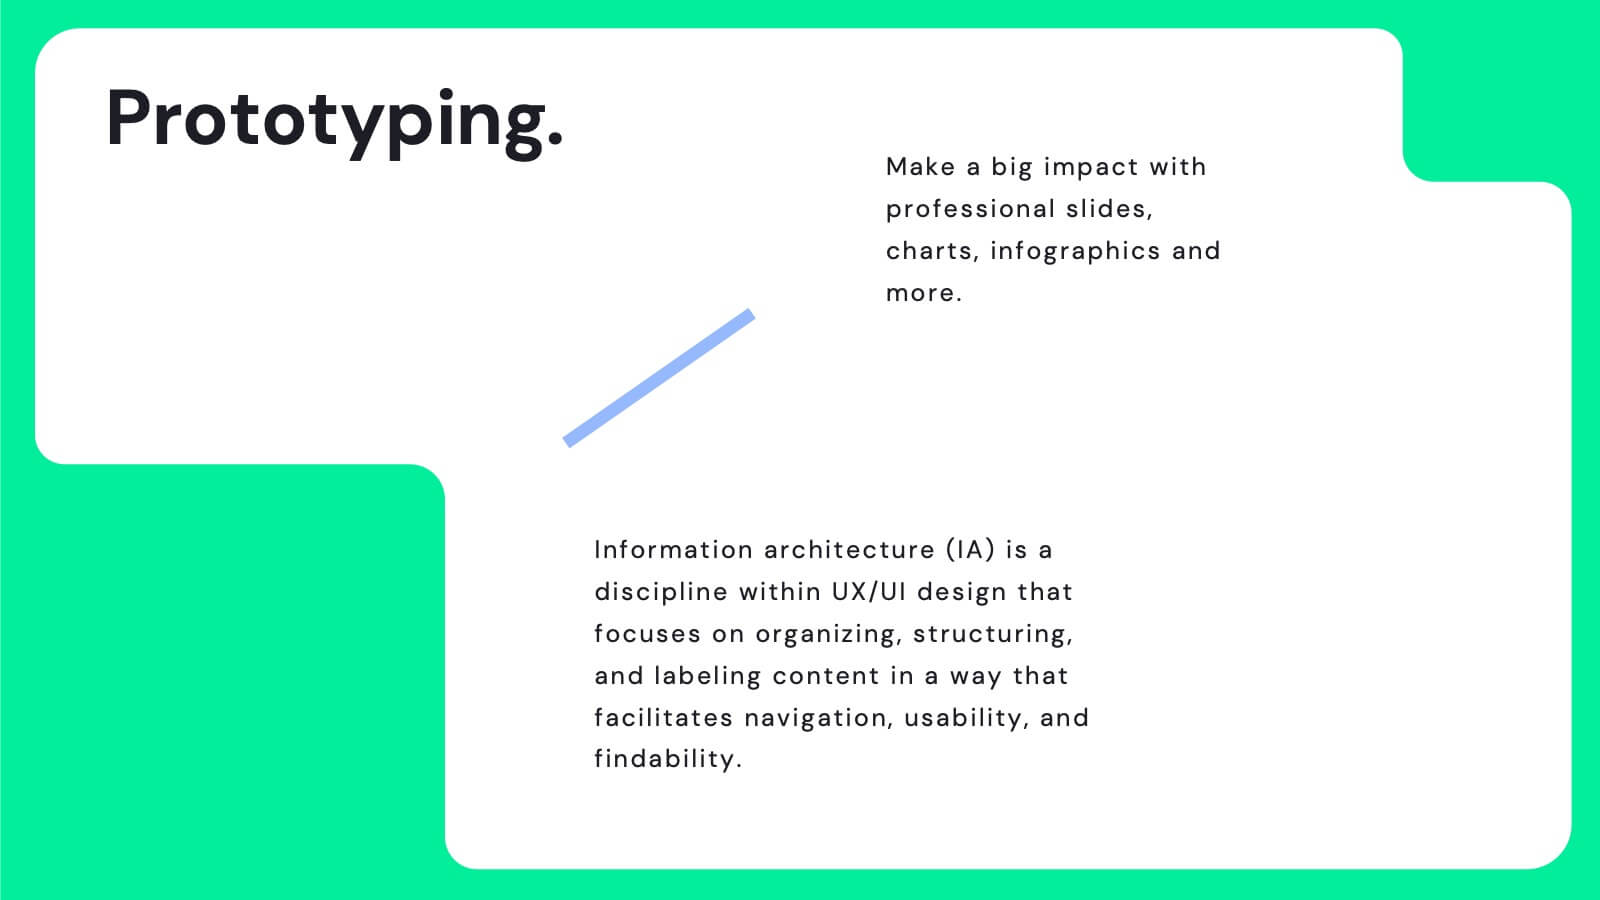
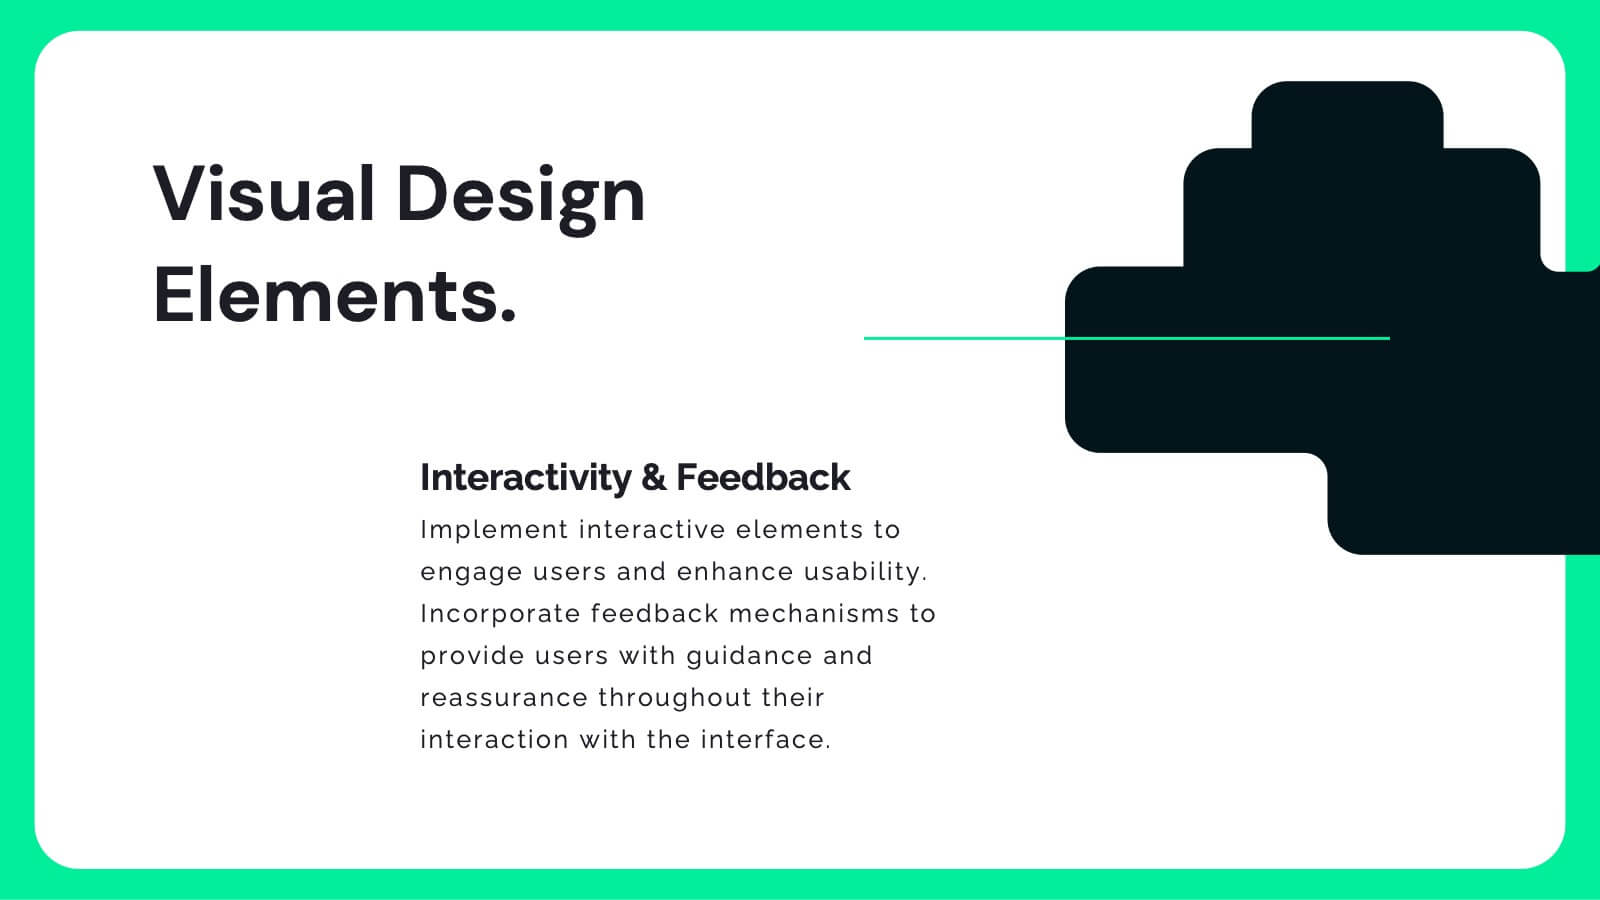
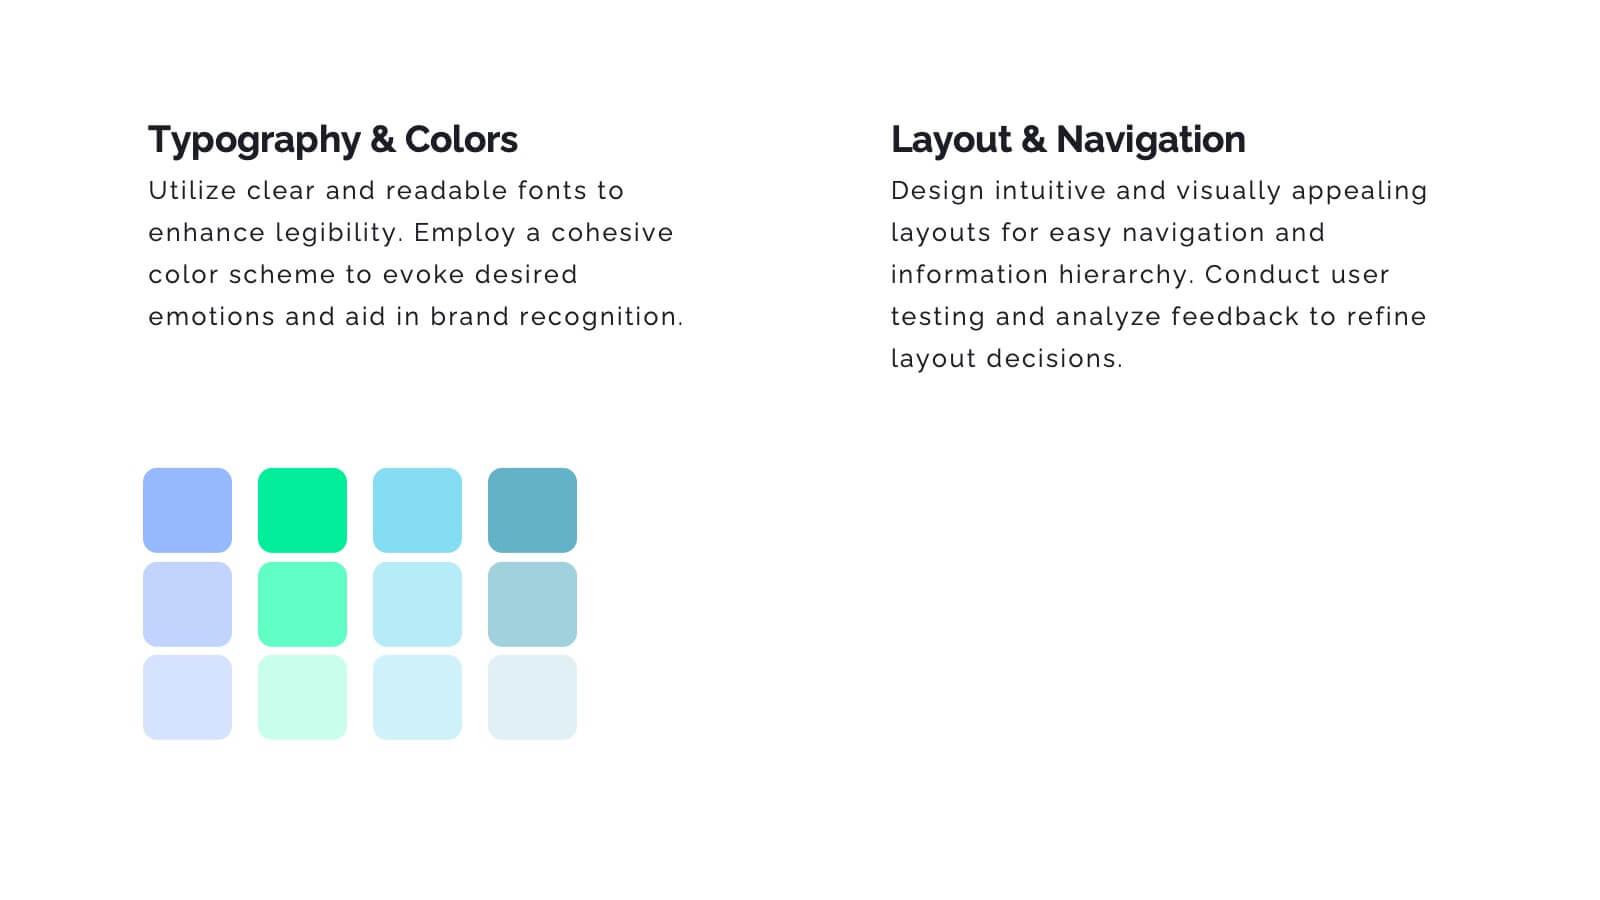
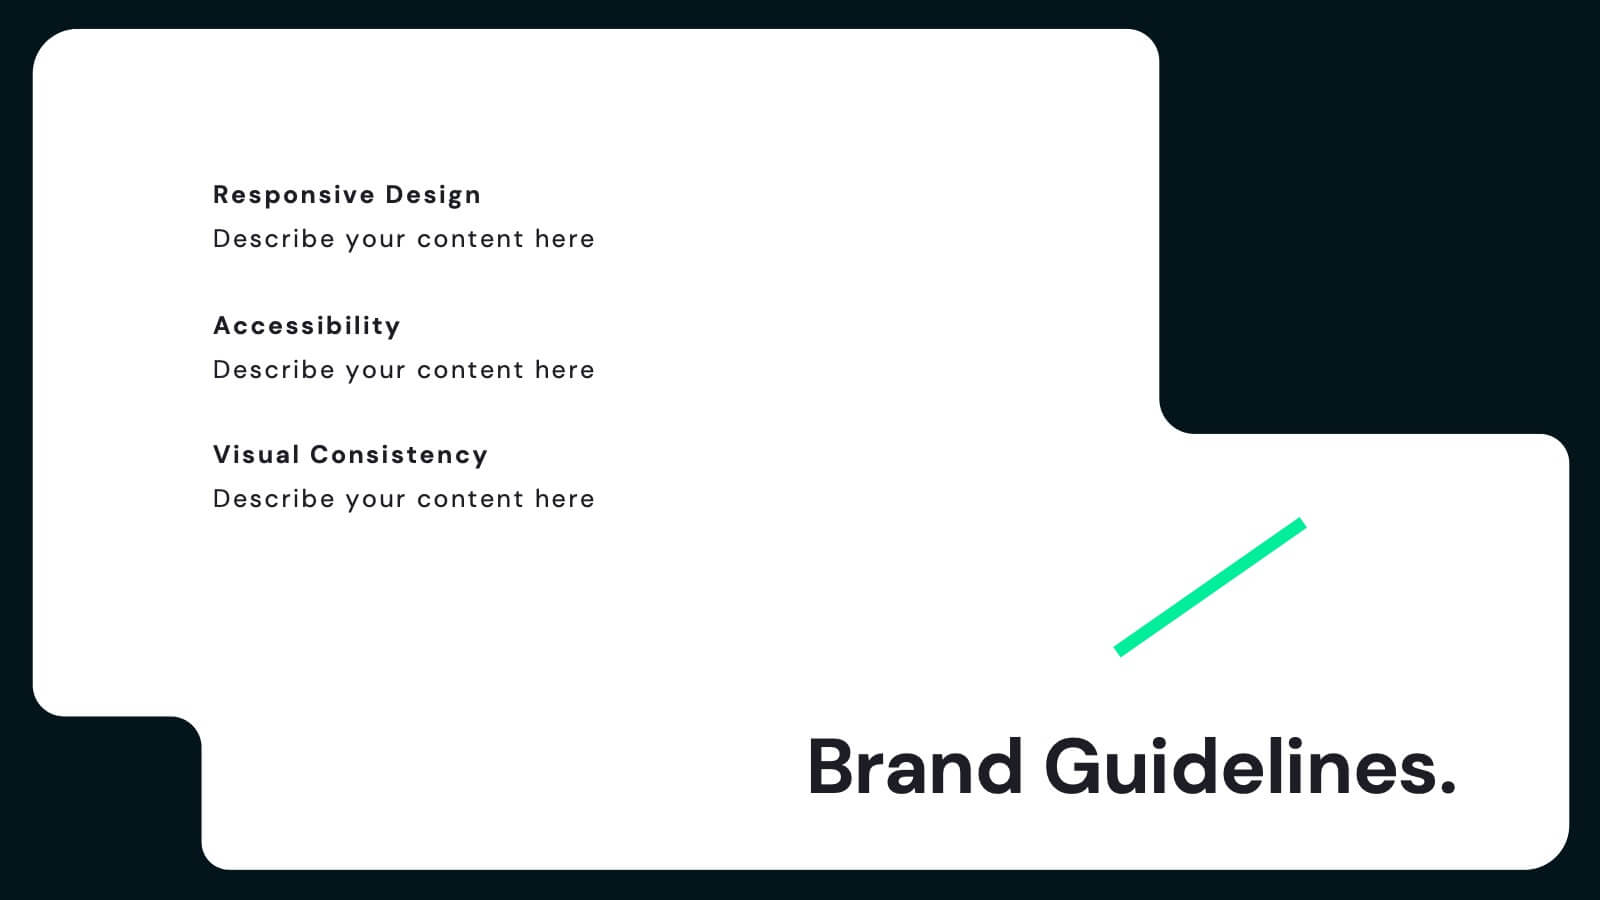
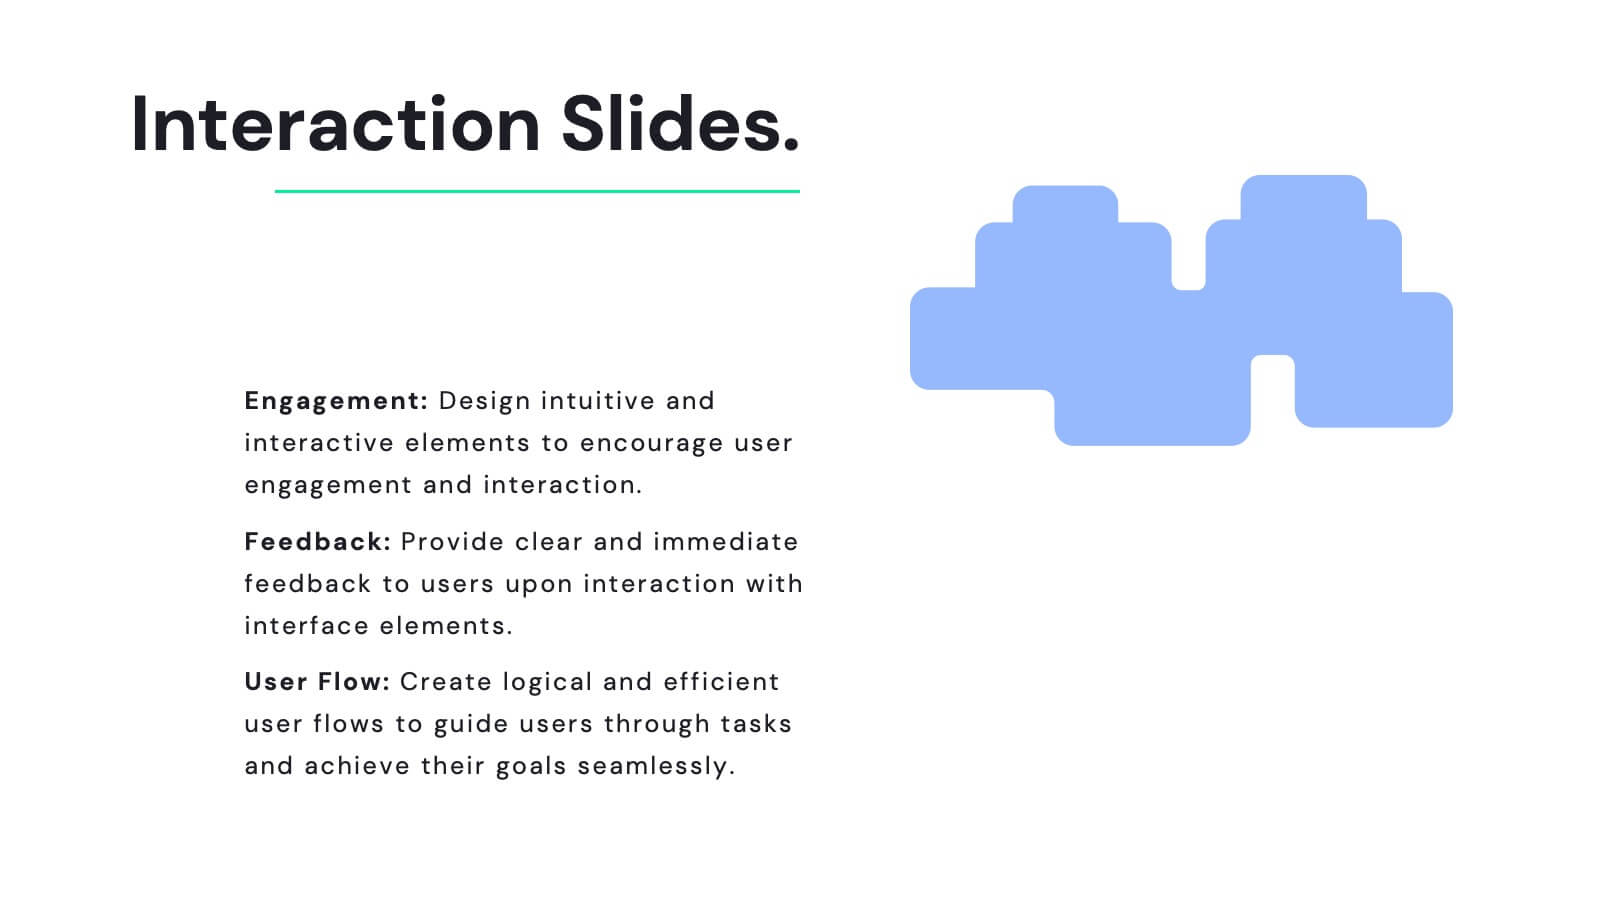
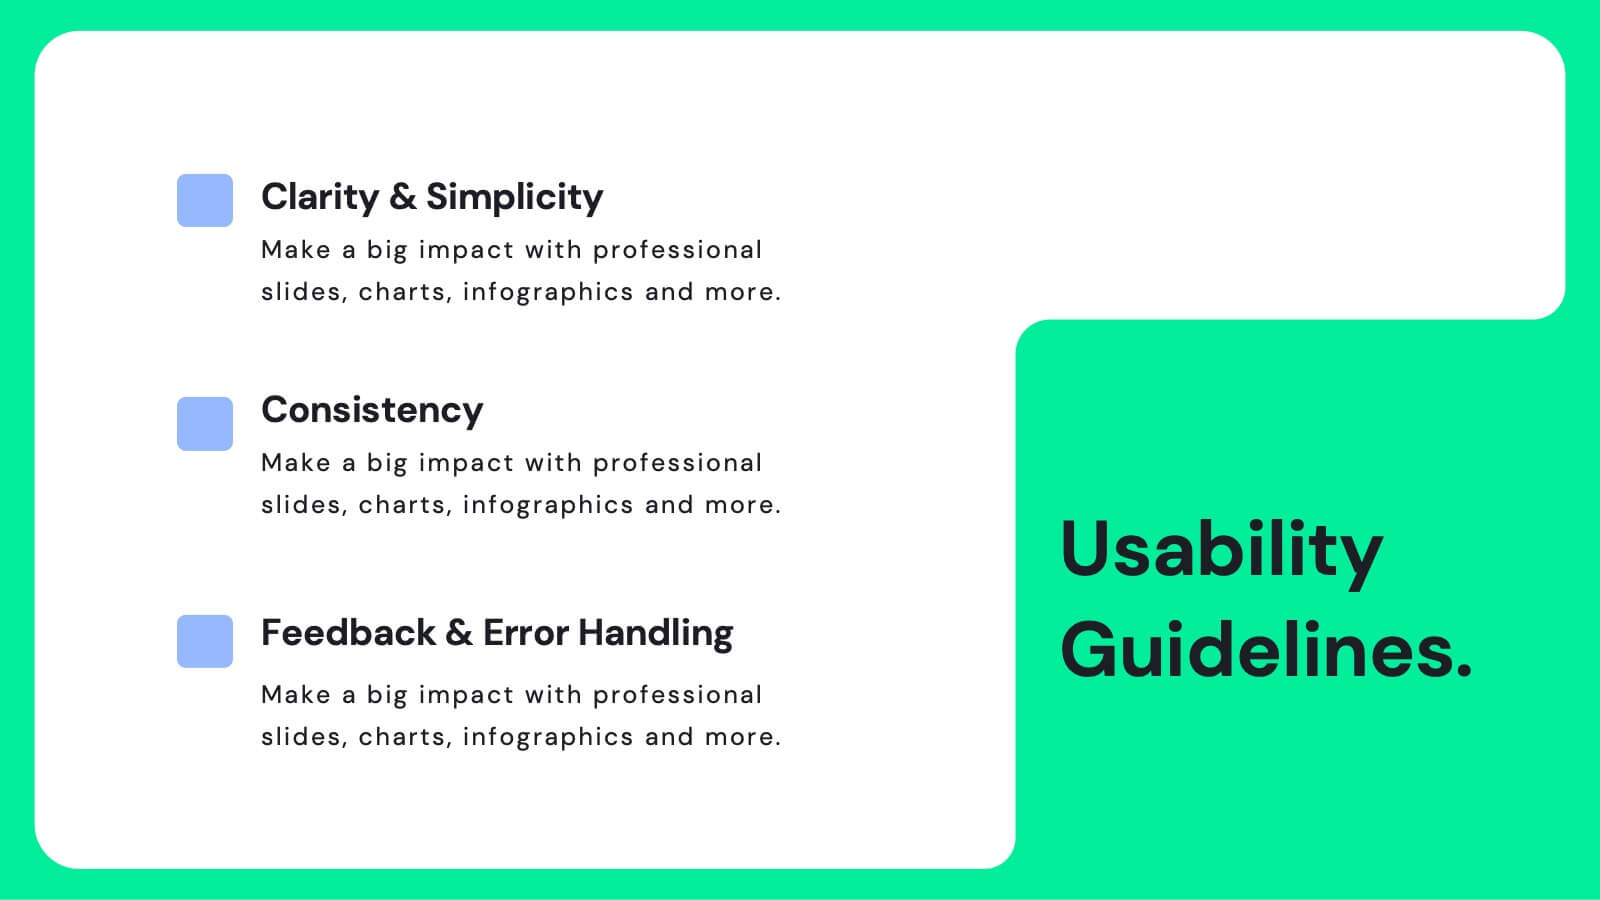
Juno UX Case Study Presentation
Enhance your UX presentations with this sleek, user-friendly template designed for showcasing detailed case studies and user research. With a modern layout and clear sections for user journey mapping, prototyping, and usability guidelines, this template ensures a professional and engaging presentation. Compatible with PowerPoint, Keynote, and Google Slides, it's perfect for any platform.