


Características


¿Tienes alguna pregunta?
Recomendar


7 diapositivas
Risk Prevention and Safety Management Presentation
Elevate your organization's approach to hazard awareness with our 'Risk Prevention and Safety Management' presentation template. Designed to aid in illustrating essential safety measures and risk management tactics, this template is a must-have for training sessions and workshops. Fully compatible with PowerPoint, Keynote, and Google Slides, it's ideal for ensuring workplace safety and compliance.


5 diapositivas
Process Improvement Infographics
Introducing our Process Improvement Infographics, these are visual representations of the steps involved in enhancing the efficiency of a process. This template is designed to help businesses identify bottlenecks and areas of improvement in their operations. These infographics consist of vertically arranged sections or columns that outline the different stages of the process improvement journey. Each section provides a brief explanation of the stage along with relevant icons, illustrations, or diagrams to enhance understanding. The layout is designed to showcase the sequential flow of activities involved in the improvement process.


6 diapositivas
Child Development Psychology Presentation
Bright colors and geometric birds bring this slide to life, making complex concepts easy to follow. This presentation template simplifies the key stages of emotional and psychological growth in children, helping you explain theories and behaviors clearly. Compatible with PowerPoint, Keynote, and Google Slides for seamless use across platforms.


6 diapositivas
USA Market Reach Heatmap Presentation
Showcase your geographic impact with this USA Market Reach Heatmap template. Ideal for visualizing regional data, customer density, or sales performance. Features pinpoint markers, editable callouts, and a clean U.S. map layout. Fully customizable in PowerPoint, Keynote, and Google Slides—perfect for marketing, sales, or expansion strategy presentations.


26 diapositivas
Fitness Company Profile Dark Presentation
Dive into the pulsating realm of fitness, where every sweat drop carves the path to chiseled abs. Imbued in shades of black with electrifying neon accents, our template captures the dark, motivating ambiance of late-night gym sessions. Featuring dynamic graphics, empowering icons, and inspiring image placeholders, it's a testament to determination and grit. Flawlessly curated for Powerpoint, Keynote, or Google Slides. The ultimate asset for fitness trainers, gym enthusiasts, health bloggers, or anyone aiming to inspire a journey towards physical excellence. Push your limits; let every rep ignite your passion.


6 diapositivas
Enterprise Loyalty Program Infographic
A loyalty program is a structured marketing strategy designed to encourage customers to continue doing business with a company or brand by offering various incentives, rewards, and benefits for their ongoing loyalty and repeat purchases. This infographic template is a visual representation of the key components, benefits, and features of a loyalty program designed for a large-scale business or enterprise. This template visually conveys the value of the program, encourages participation, and showcases the benefits that customers can enjoy by becoming loyal members. This is compatible with Powerpoint, Keynote, and Google Slides.


6 diapositivas
Food Market Infographic
The food market refers to the industry and marketplace where various food products are produced, processed, distributed, and sold to consumers. This infographic template is designed to provide insights into the food market industry. This aims to showcase key trends, statistics, and market dynamics related to the global food market. Whether used in presentations, reports, or educational material, this infographic will help your audience gain insights into the market, identify growth opportunities, and make informed decisions in the food industry. Compatible with Powerpoint, Keynote, and Google Slides.


20 diapositivas
Fire Spin Startup Pitch Deck Presentation
Ignite your pitch with this bold, fire-inspired presentation template, perfect for showcasing your startup’s potential! This deck helps you present key business elements like market research, revenue models, and growth strategies in a dynamic, visually engaging format. Stand out from the competition. Compatible with PowerPoint, Keynote, and Google Slides.


5 diapositivas
Hidden Layers Iceberg Presentation
Reveal what lies beneath the surface with this Hidden Layers Iceberg Presentation. Ideal for explaining visible outcomes versus underlying causes, it’s perfect for business, psychology, or education topics. Clearly segmented layers with labeled callouts enhance clarity. Fully customizable in PowerPoint, Keynote, and Google Slides for effortless professional use.


6 diapositivas
Business Growth with TAM SAM SOM Framework
Fuel your next big idea with a clear, structured breakdown of market potential. This easy-to-follow visual helps explain the TAM, SAM, and SOM layers of business growth—ideal for investors, strategy teams, or product managers. Fully editable in PowerPoint, Keynote, and Google Slides for fast, seamless presentation design.


5 diapositivas
Data Entry Infographics
Dive into the intricate world of information management with our data entry infographics. Cast in shades of blue, warm orange, and an array of inviting colors, this vertically styled template is a boon for business analysts, administrative assistants, and database managers. The design, punctuated with relevant graphics, icons, and strategic image placeholders, simplifies complex data narratives. It serves as a visual anchor, ensuring information accuracy and efficiency. This essential tool is instrumental for professionals striving to maintain data integrity while elucidating critical entry processes, thereby fostering a streamlined workflow.


5 diapositivas
Water Usage and Resource Efficiency Presentation
Convey environmental impact clearly with the Water Usage and Resource Efficiency Presentation. This clean, drop-shaped infographic design visualizes resource distribution in four balanced sections—ideal for sustainability, conservation, or utility reports. Fully editable in Canva, PowerPoint, Keynote, and Google Slides to customize data and align with your brand or project.


6 diapositivas
Legal Policy Overview Presentation
Make your legal and compliance reports look polished and professional with this clean, organized layout. Designed to simplify complex information, it’s ideal for presenting policies, frameworks, and regulations with clarity. Easily customize the content and visuals—fully compatible with PowerPoint, Keynote, and Google Slides for effortless editing and use.


5 diapositivas
Causes of Poaching Infographics
Poaching refers to the illegal hunting, capturing, or killing of wildlife, typically for commercial or personal gain. These infographic templates are designed to raise awareness about the underlying drivers of poaching activities and the need for concerted efforts to combat this illegal and harmful practice. The text boxes and illustrations included can be used to highlight the causes and factors contributing to the issue of poaching. Present the complex factors driving this issue, and empower your audience to support conservation efforts, advocate for stricter regulations, and contribute to the protection of wildlife.


26 diapositivas
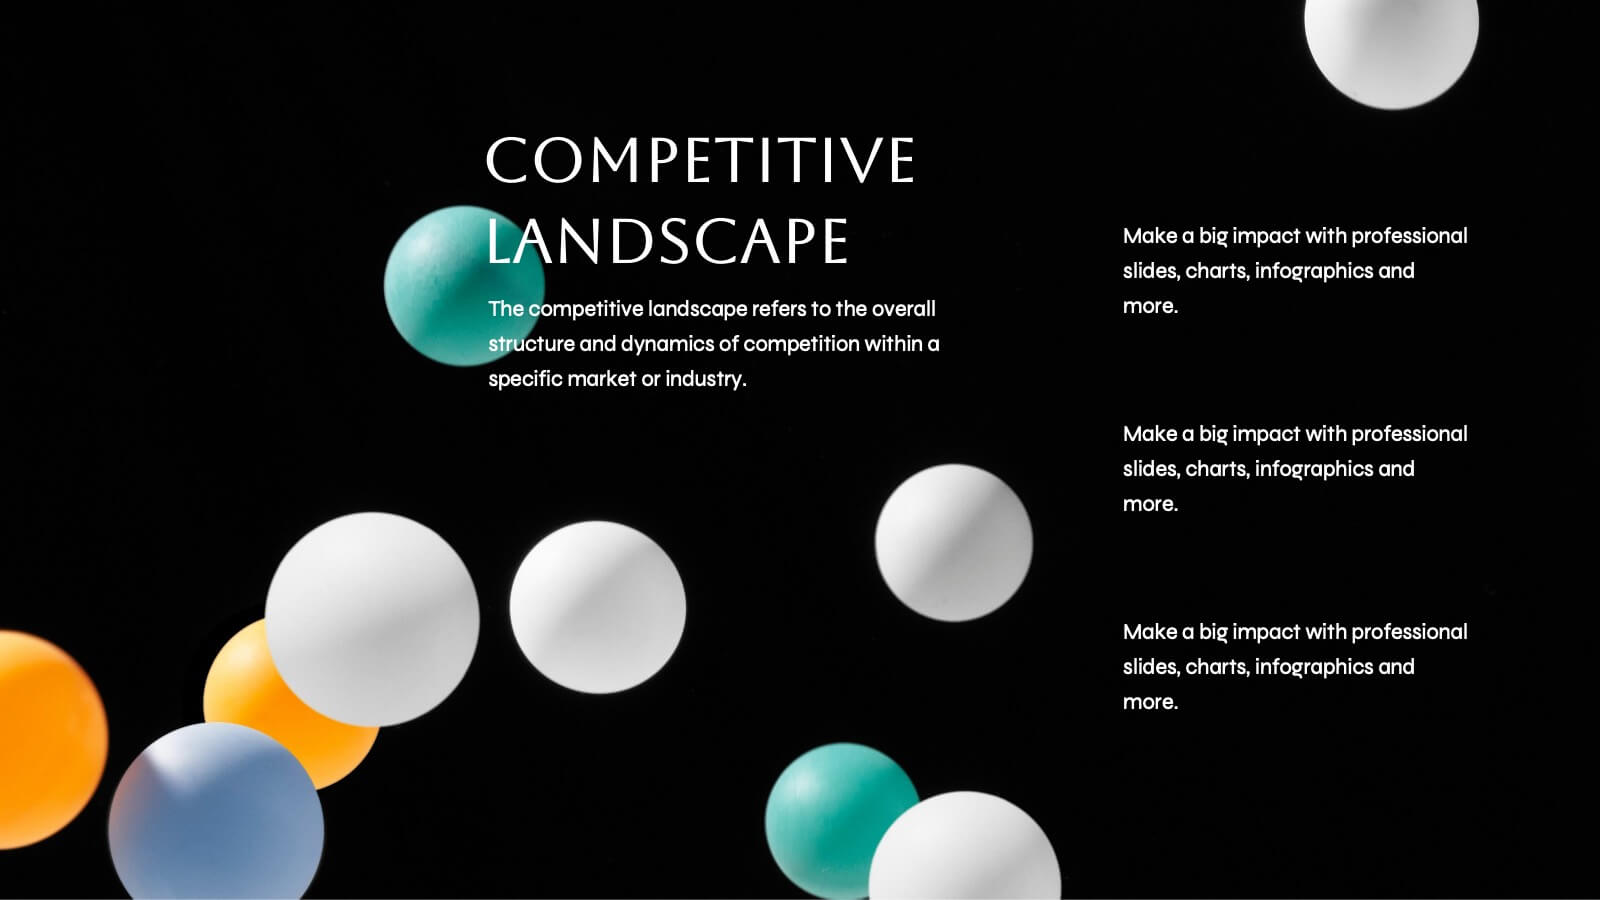
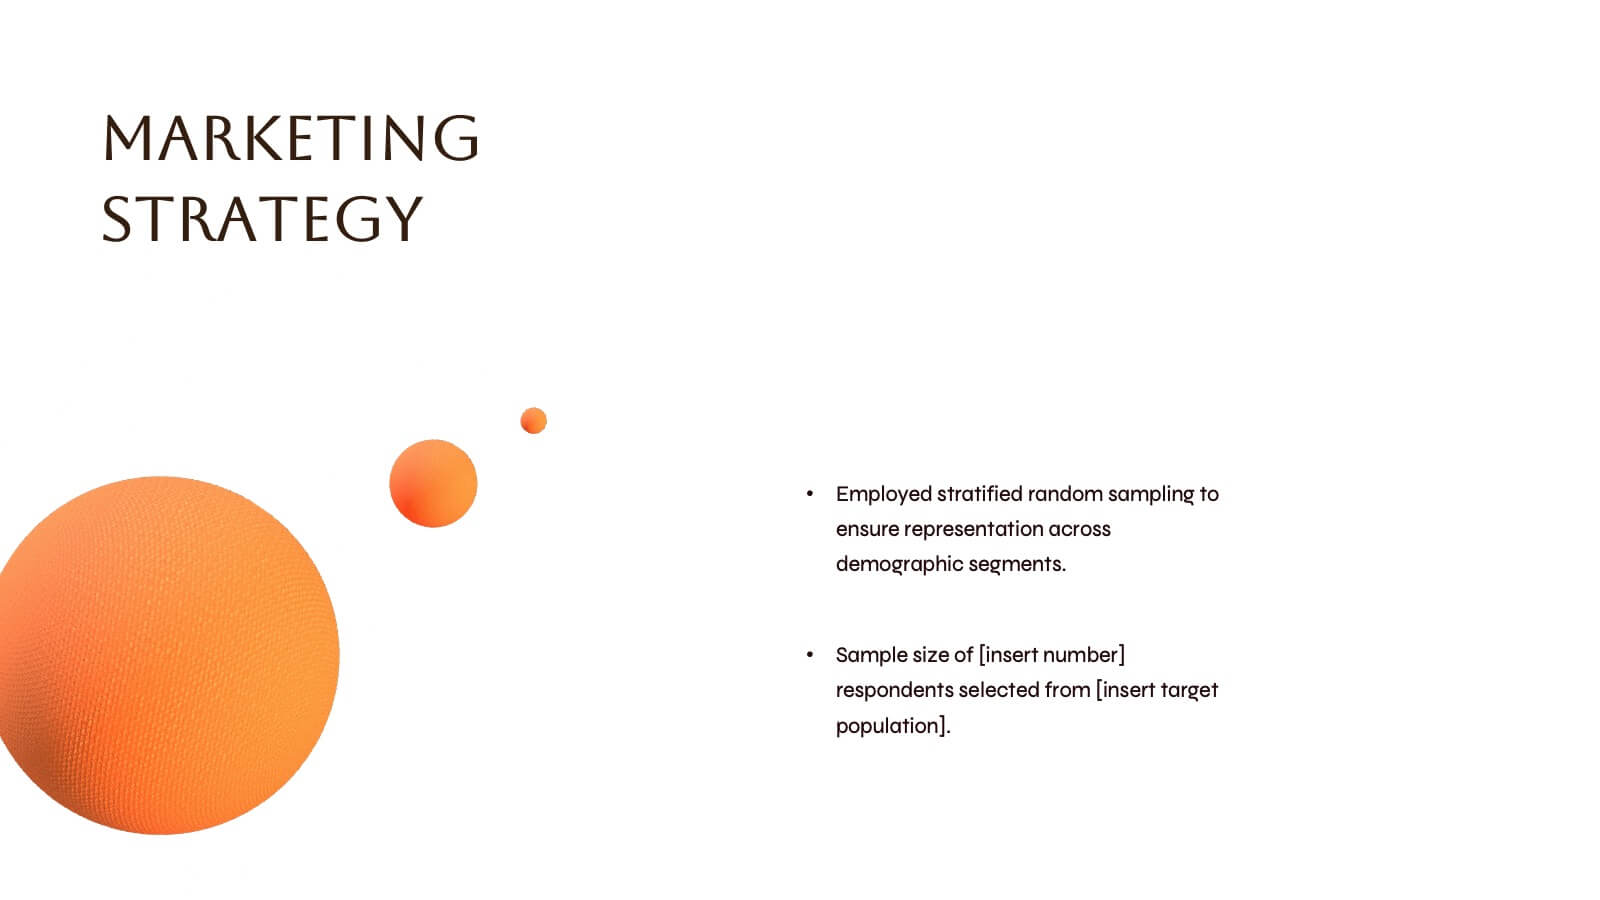
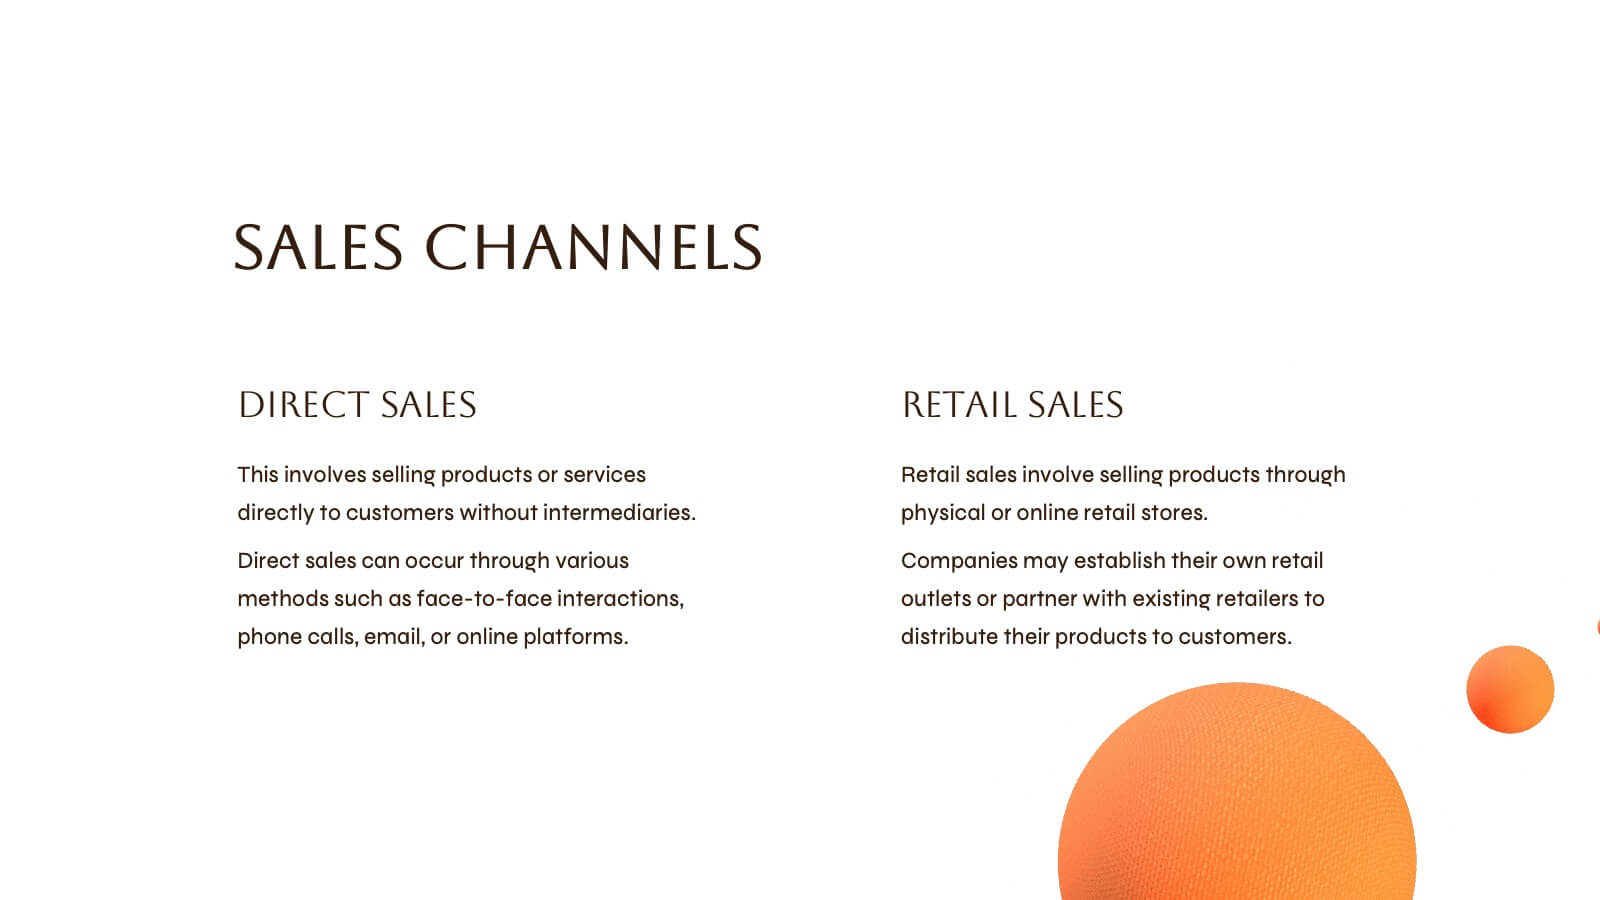
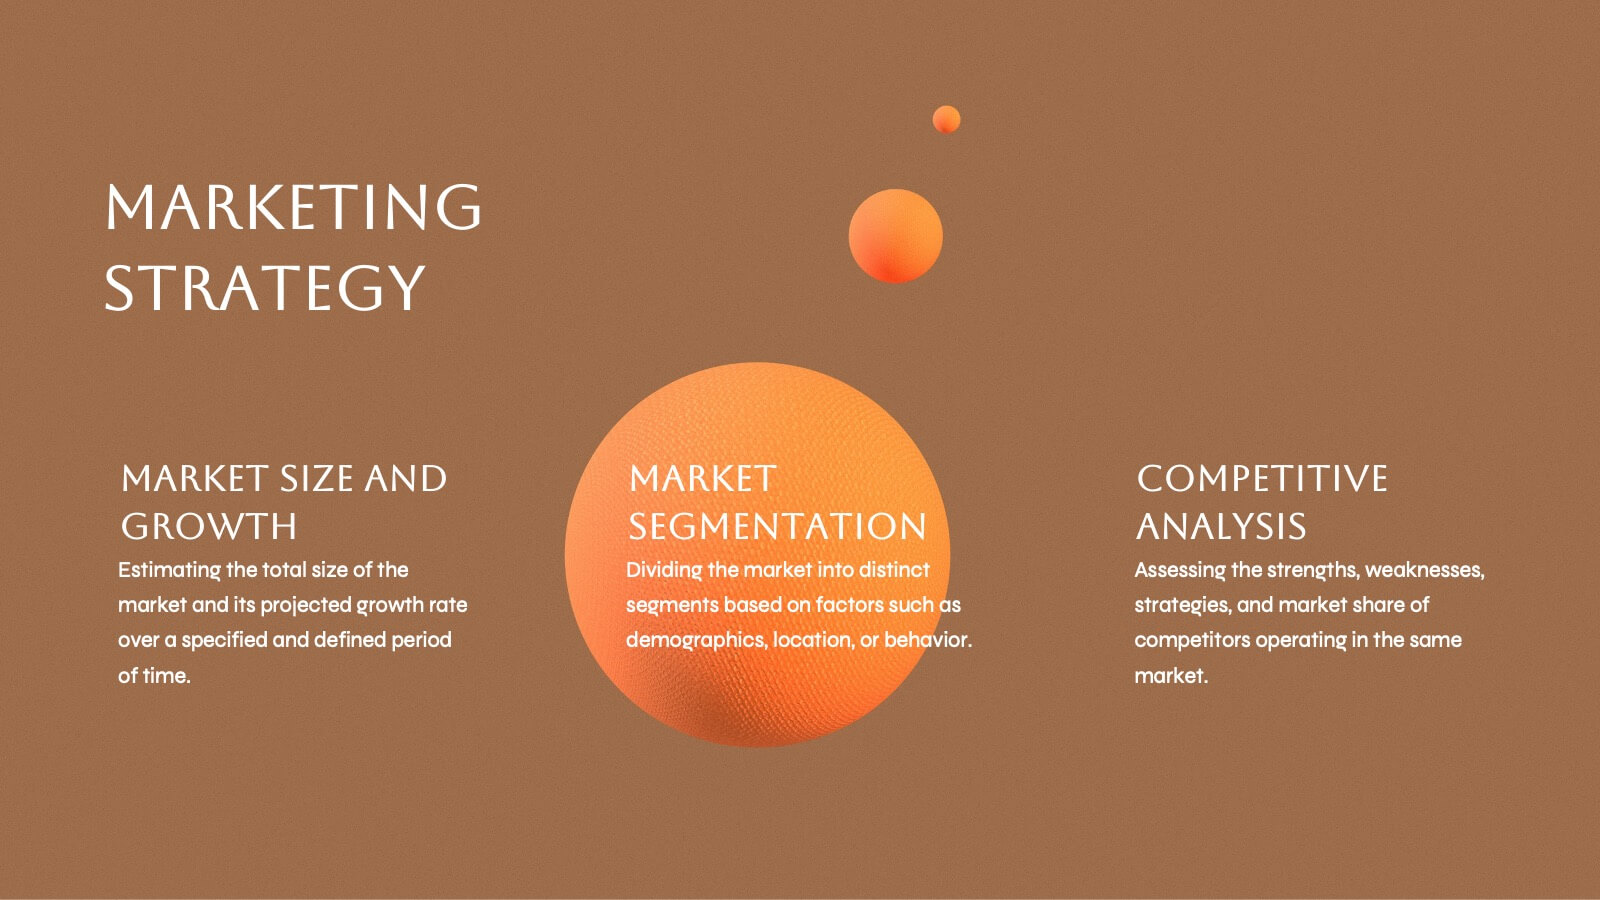
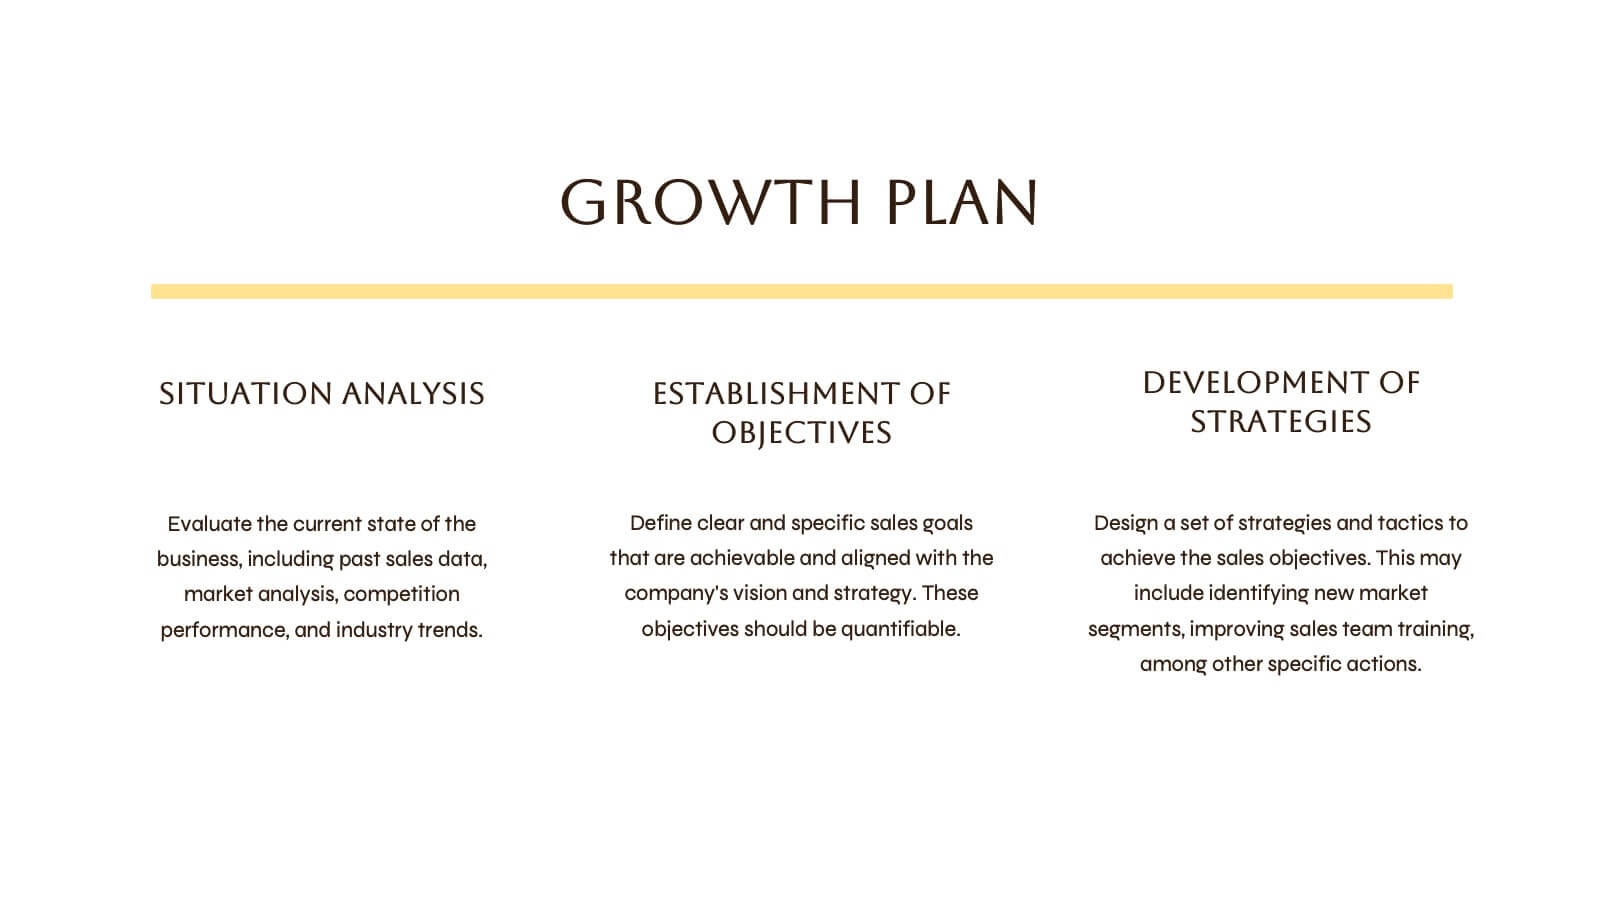
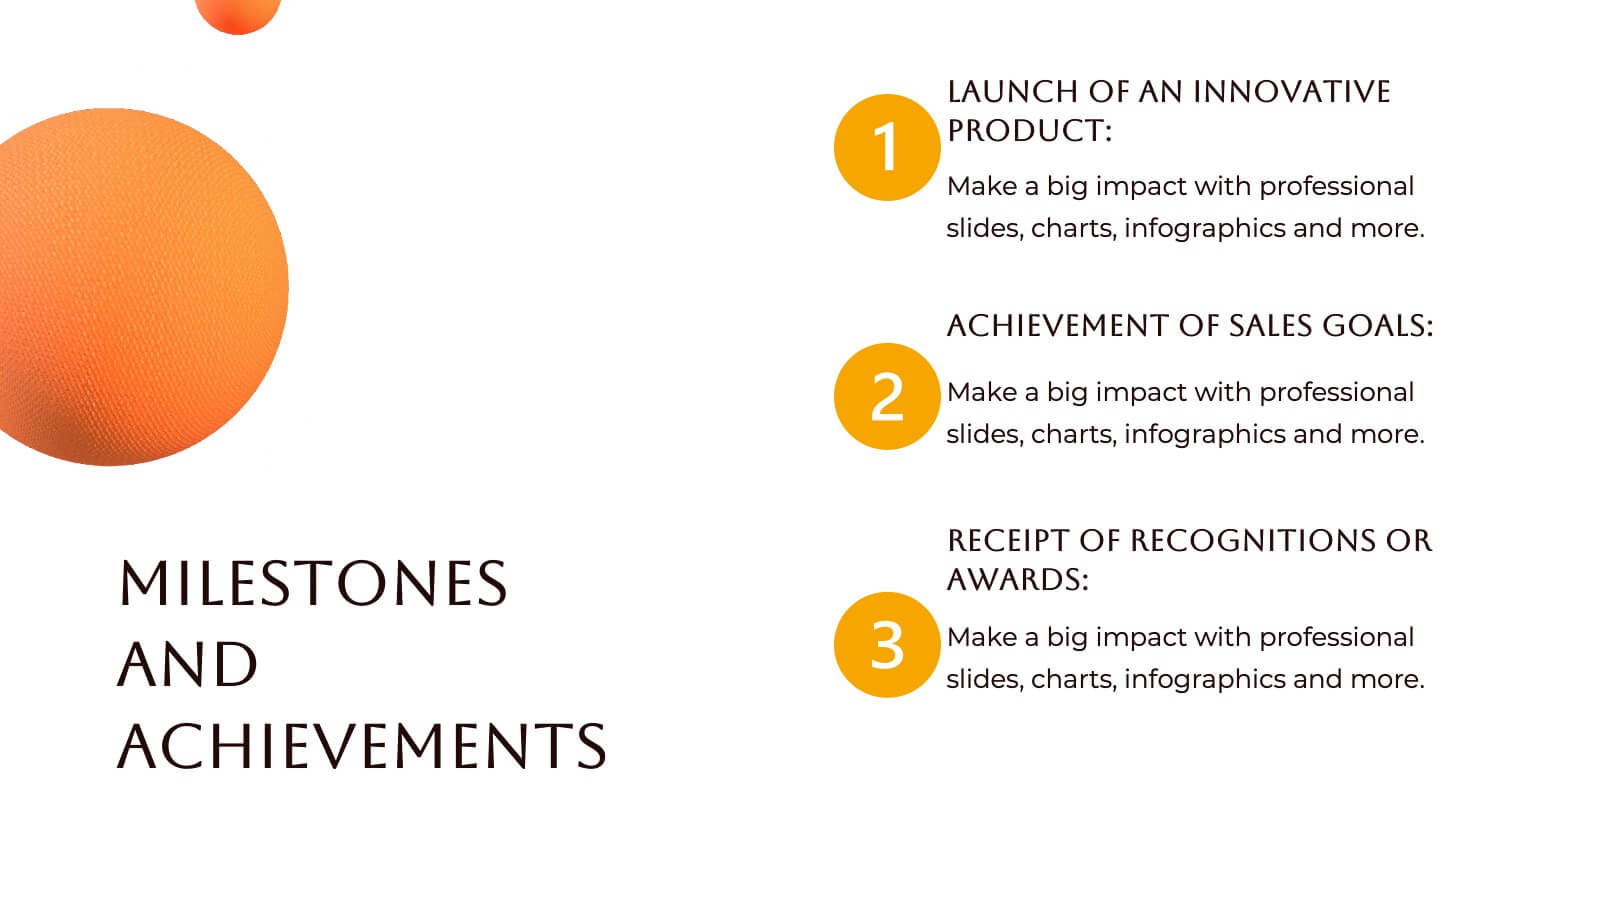
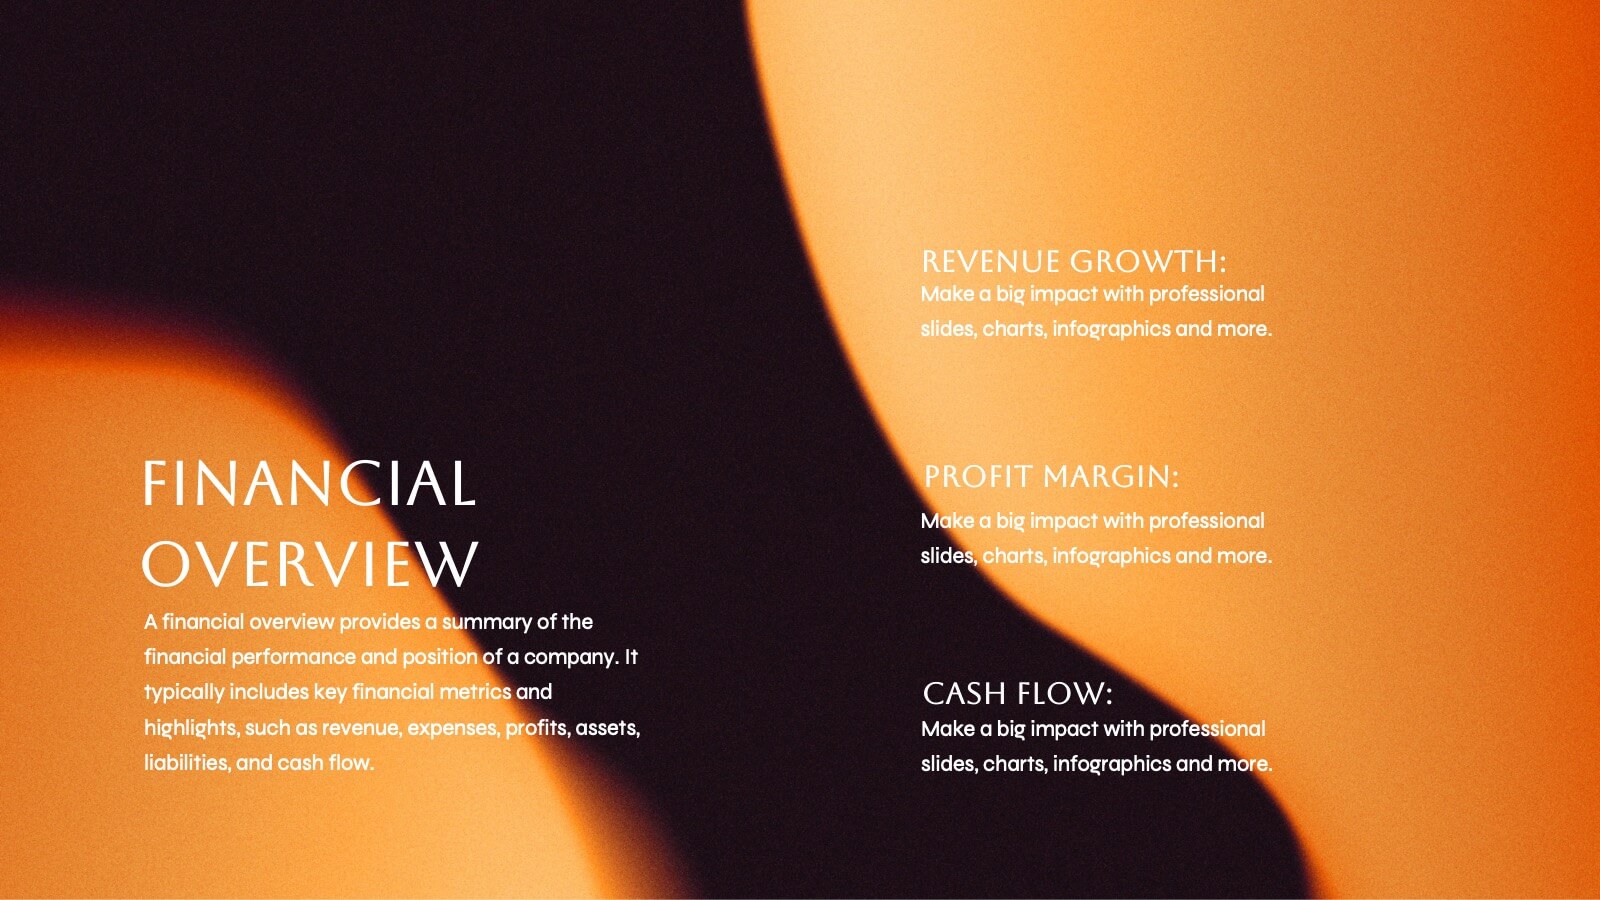
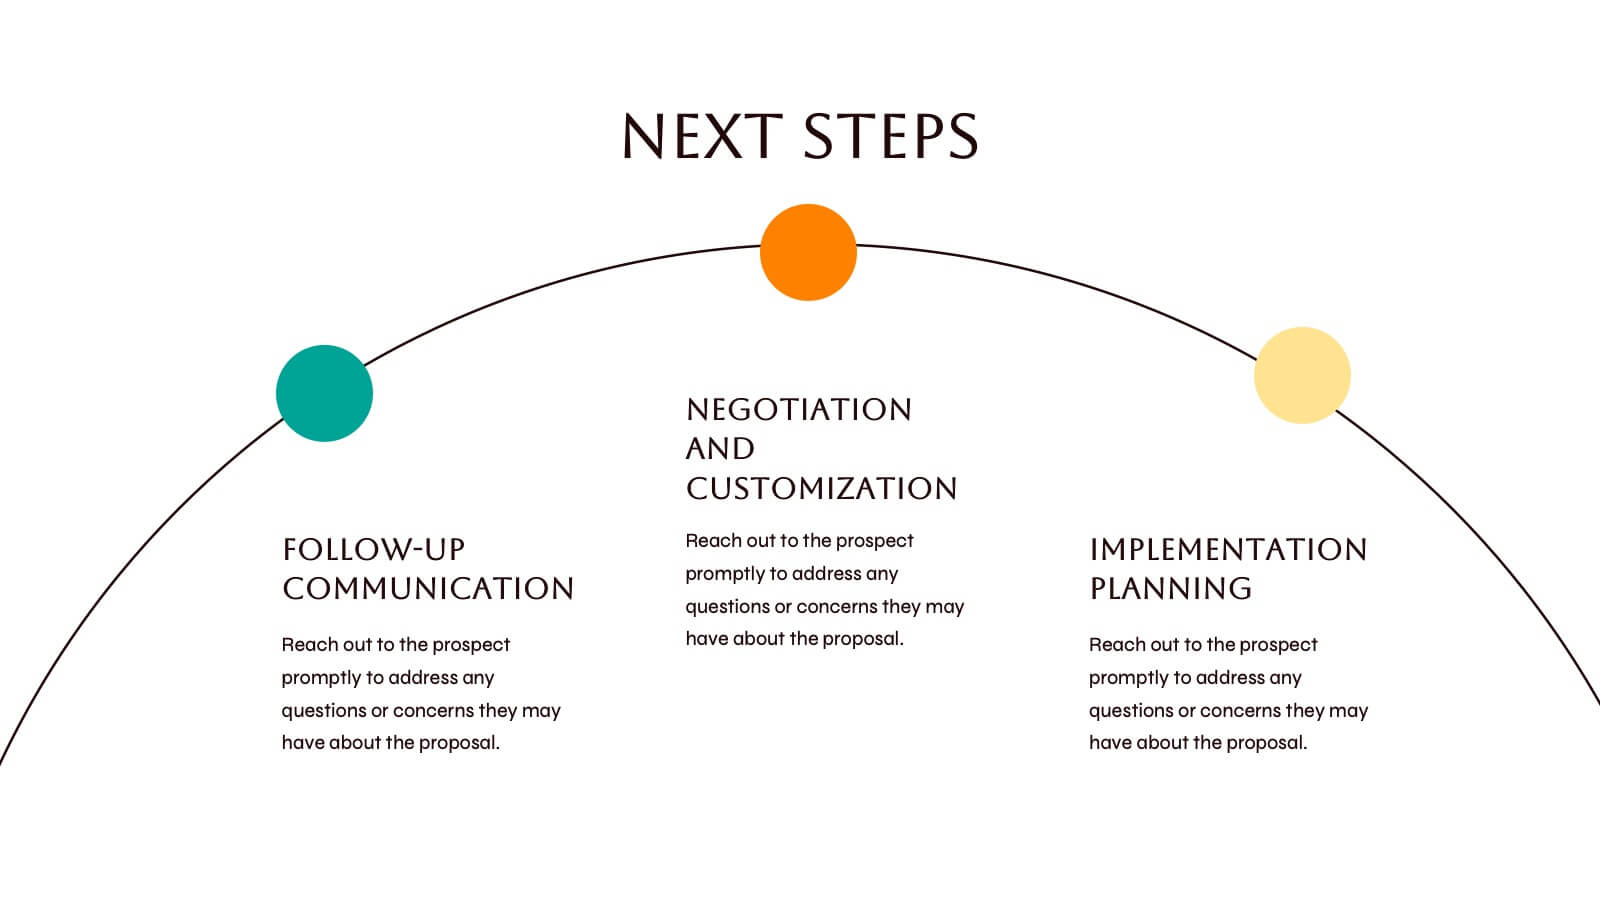
Jenzen Presentation Template
Jenzen is a modern multi-purpose template with warm tones for coaching and investing. Jenzen is suitable for all types of businesses Its slide designs can be used in conjunction with each other, making it perfect for sharing information about the various services available to customers. It's easy to use, resulting in high quality presentations. Its slide designs can be used with each other to create more elaborate presentations complete with charts, images and text boxes. It's simple yet stylish design makes it easy for anyone to use and is for both personal use as well as professional use.


6 diapositivas
Market Sizing with TAM SAM SOM Strategy Presentation
Clearly define your market opportunity using the Market Sizing with TAM SAM SOM Strategy Presentation. This template breaks down Total Addressable Market, Serviceable Available Market, and Serviceable Obtainable Market with a visual bullseye format that’s intuitive and persuasive. Easily editable in PowerPoint, Keynote, and Google Slides.


6 diapositivas
Time Management Skills Infographic
Time Management refers to the process of planning and organizing your time effectively to accomplish tasks, achieve goals, and maximize productivity. This infographic template aims to help individuals improve their time management abilities. It provides practical tips, techniques, and strategies to effectively manage time and increase productivity. This template provides practical guidance on setting goals, prioritizing tasks, managing distractions, and optimizing productivity. This infographic will help your audience develop effective time management skills and make the most of their valuable time.