


Características


¿Tienes alguna pregunta?
Recomendar


6 diapositivas
Business Concepts Using Geometric Layouts Presentation
Present your key business ideas with this structured, modern layout featuring six colorful geometric segments. Ideal for showcasing strategies, goals, or processes with visual clarity. Each section allows for brief insights with clean iconography. Fully editable in PowerPoint, Google Slides, Keynote, and Canva—perfect for professional, client-facing presentations.


4 diapositivas
Risk and Reality Iceberg Diagram Presentation
Reveal underlying threats with this Risk and Reality Iceberg Diagram presentation. Ideal for risk analysis, strategic planning, or operations mapping, this slide visualizes visible vs. hidden challenges in a business or project. Fully editable in Canva, PowerPoint, and Google Slides—perfect for impactful and professional presentations.


5 diapositivas
Fitness Benefits Infographics
Fitness Benefits refer to the positive effects that physical activity and exercise can have on a person's health and well-being. This Infographic is a visual representation of the benefits that people can derive from regular exercise and physical activity. It is a great tool to educate people about the importance of staying fit and active, as well as inspire them to start or continue their fitness journey. Include additional information, such as tips for staying motivated, ideas for different types of exercise, and resources for further learning or support. This template can be a powerful tool to promote the importance of fitness and motivate people.


2 diapositivas
Professional Cover Slide Design Presentation
Make a bold first impression with this clean and modern cover slide layout. Featuring a split design with customizable photo space and a vibrant call-to-action label, this slide balances professionalism with creativity. Perfect for proposals, company overviews, or keynote introductions. Easily personalize the title, color palette, and image. Fully compatible with PowerPoint, Keynote, and Google Slides.


7 diapositivas
RACI Matrix Manufacturing Infographic
The RACI matrix, an essential tool for defining roles and responsibilities, finds vital applications in the realm of manufacturing. Our RACI matrix manufacturing infographic, bathed in shades of blue against a clean white canvas with tasteful black accents, simplifies the complex choreography of tasks, roles, and accountabilities in manufacturing processes. Designed particularly for manufacturing managers, team leaders, and project coordinators, this template vividly illustrates how tasks are assigned and to whom, ensuring clarity and streamlining operations. Ready-to-use, it integrates seamlessly with PowerPoint, Keynote, and Google Slides.


5 diapositivas
Business Matrix Model Presentation
Clearly define your strategy with this Business Matrix Model Presentation. This slide visualizes four key segments in a grid layout, perfect for mapping business priorities, comparing performance, or identifying growth opportunities. Each quadrant is color-coded and labeled, making it easy to explain complex concepts. Ideal for business planning, SWOT analysis, or strategy workshops. Fully editable in PowerPoint, Keynote, and Google Slides.


6 diapositivas
Stakeholder Analysis and Engagement
Effectively map out internal and external stakeholders with this structured hexagon-based layout. This presentation highlights six key groups—Employee, Manager, Shareholder, Society, Media, and Customer—centered around your company. Ideal for corporate strategy, stakeholder engagement, or CSR planning. Fully customizable in PowerPoint, Keynote, and Google Slides.


6 diapositivas
Human Anatomy Structure Diagram Presentation
Explore human body systems visually with this anatomy diagram slide. Highlight up to five organs or regions using numbered callouts connected to a central graphic. Ideal for healthcare, education, or medical presentations. Easily customizable in PowerPoint, Keynote, or Google Slides for labeling body parts, explaining functions, or guiding patient education.


4 diapositivas
Options Comparison Chart Presentation
Make every decision crystal clear with a dynamic, easy-to-follow layout designed to compare options side by side. Perfect for presenting business strategies, pricing plans, or feature breakdowns, this presentation helps your audience see the value instantly. Fully compatible with PowerPoint, Keynote, and Google Slides for effortless editing.


5 diapositivas
RAPID Decision-Making Roles Overview Presentation
Clarify accountability and streamline decisions with the RAPID Decision-Making Roles Overview Presentation. This visual layout breaks down the five essential roles—Recommend, Agree, Perform, Input, and Decide—into a clear quadrant diagram. Ideal for project teams, leadership alignment, or decision-making workshops. Fully editable in PowerPoint, Google Slides, Keynote, and Canva.


21 diapositivas
Thunderbird Small Business Pitch Deck Presentation
Take flight with this dynamic Thunderbird-inspired presentation, perfect for pitching your small business! Designed to highlight your business model, market potential, and financial projections, this template ensures your pitch is clear, compelling, and professional. Its bold visuals will help you soar. Compatible with PowerPoint, Keynote, and Google Slides.


4 diapositivas
IT Security Infrastructure Overview Presentation
Lock in your audience's attention with a clean, modern visual that breaks down tech barriers. This presentation template offers a snapshot of critical IT security components—think firewalls, cloud infrastructure, and data safeguards—making it easier to explain complex systems. Fully editable and compatible with PowerPoint, Keynote, and Google Slides for effortless customization.


20 diapositivas
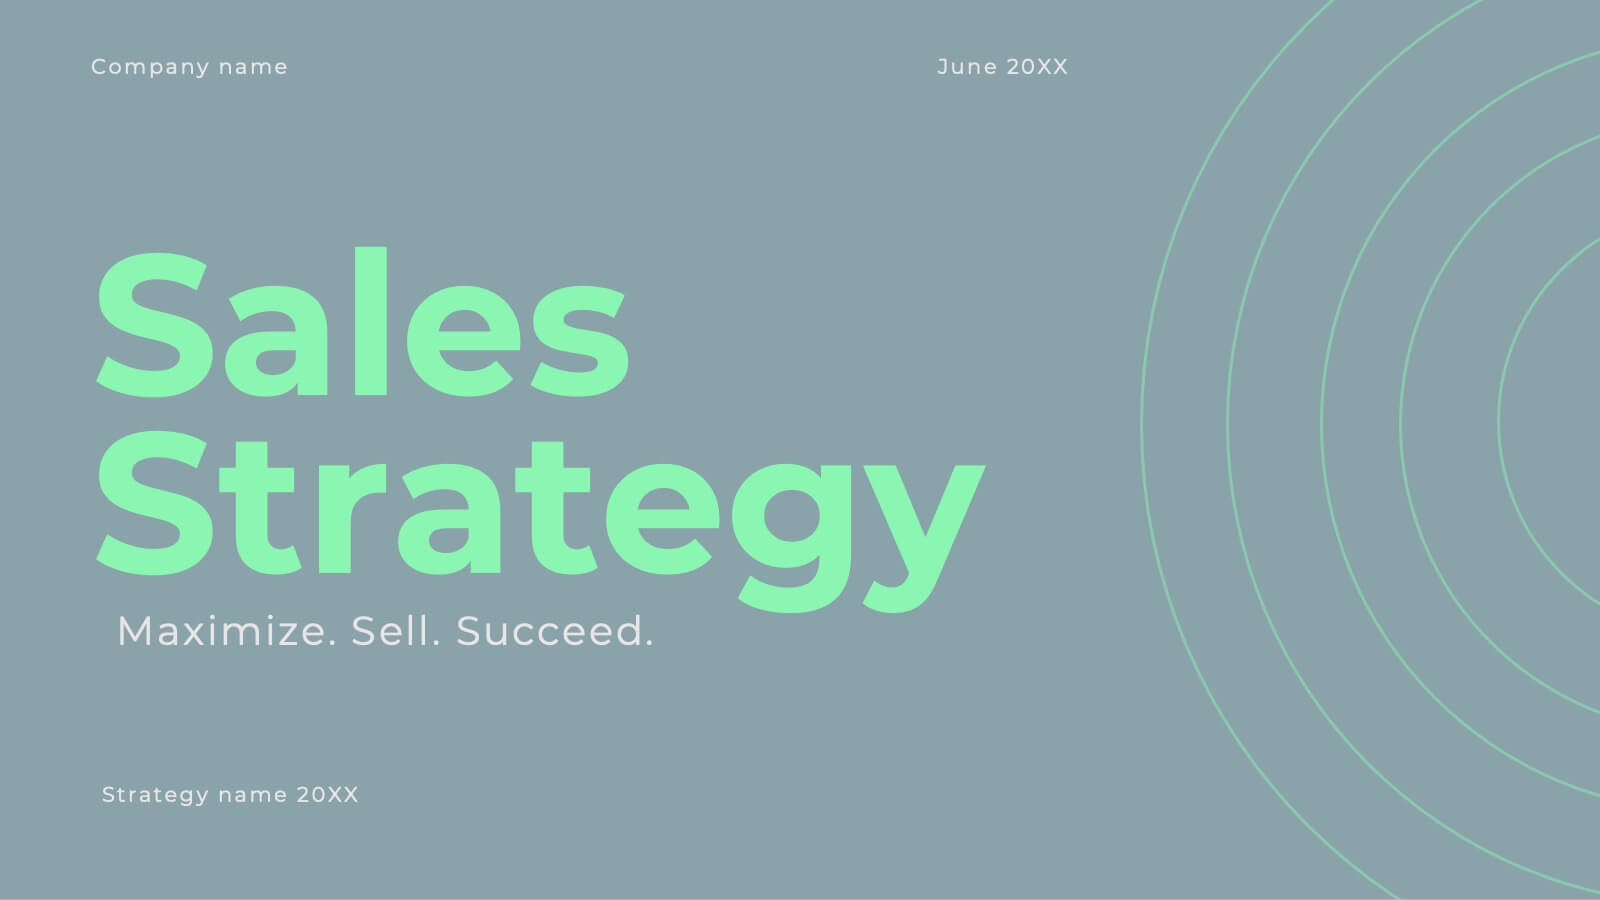
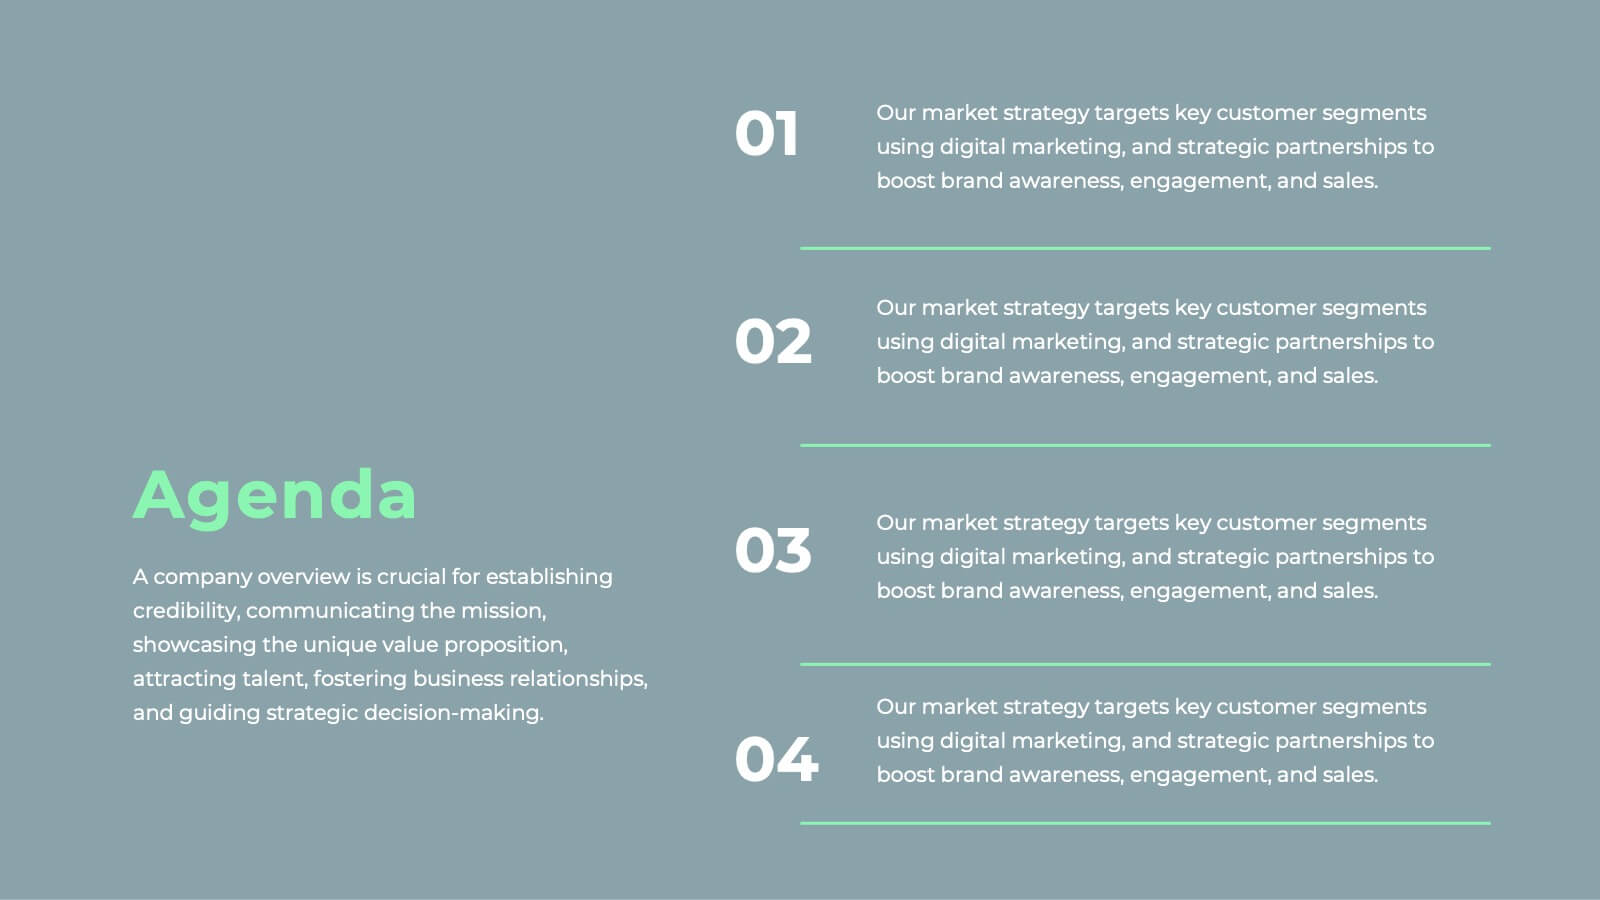
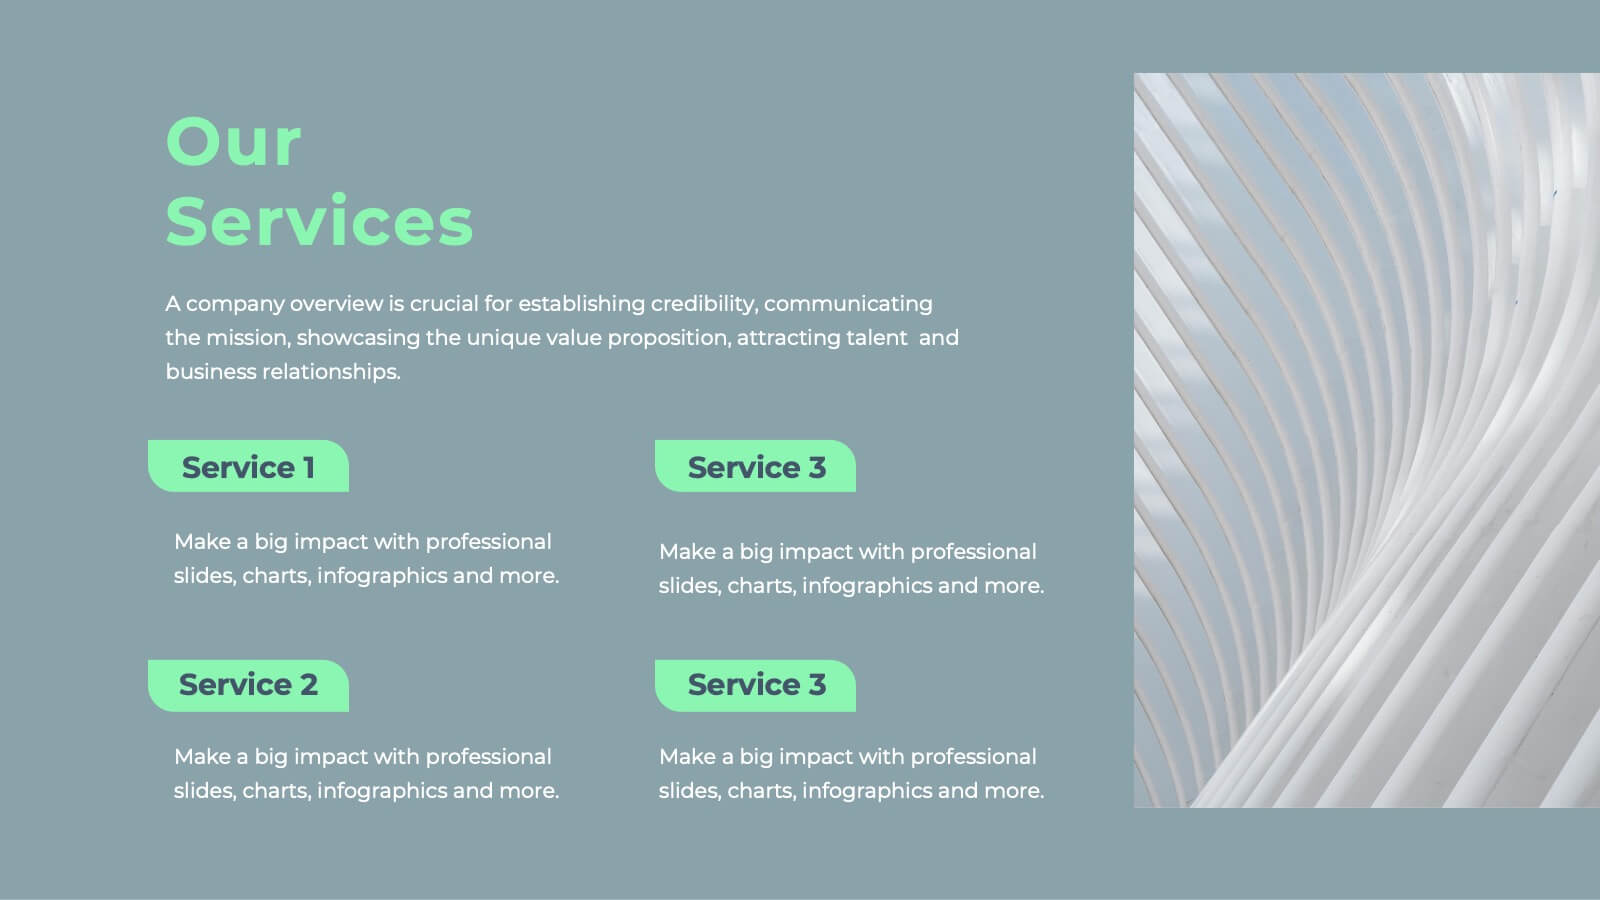
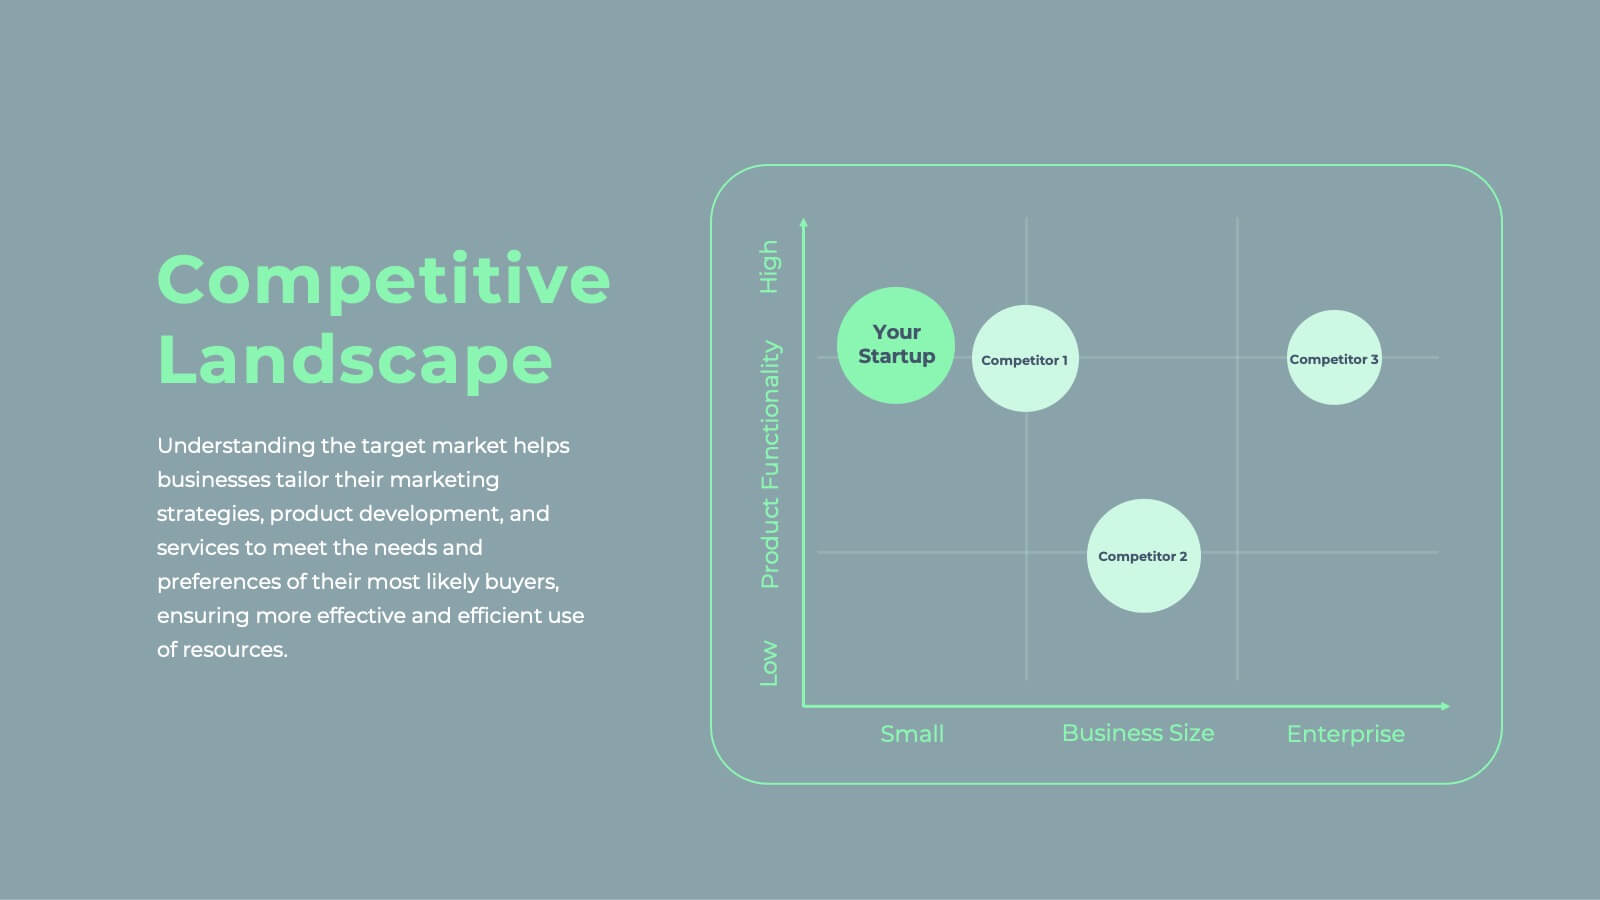
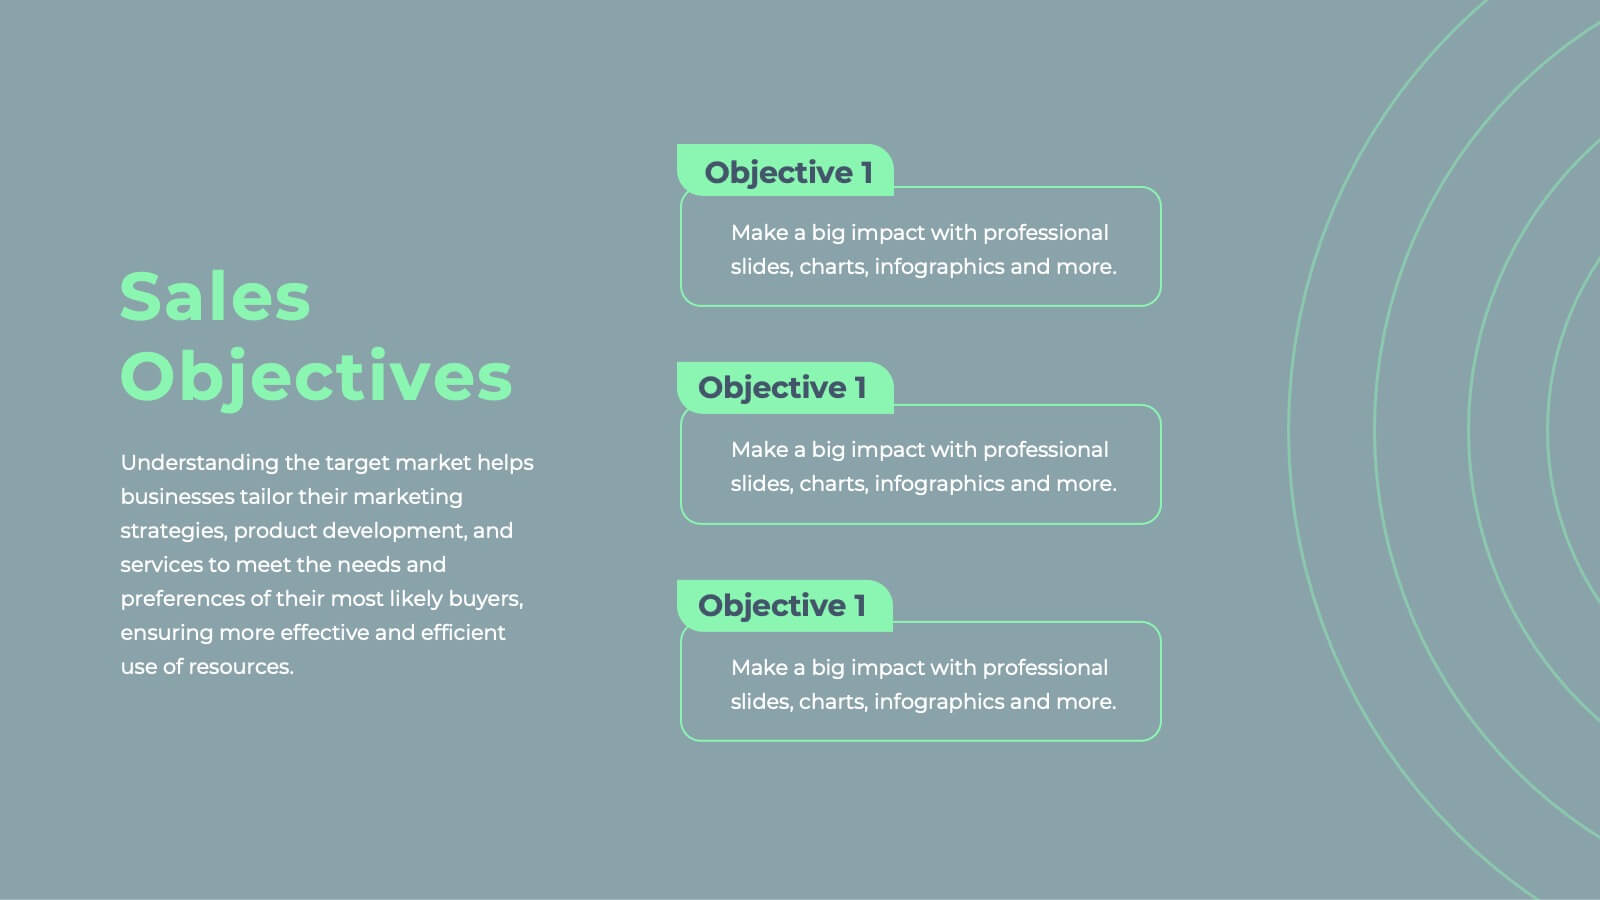
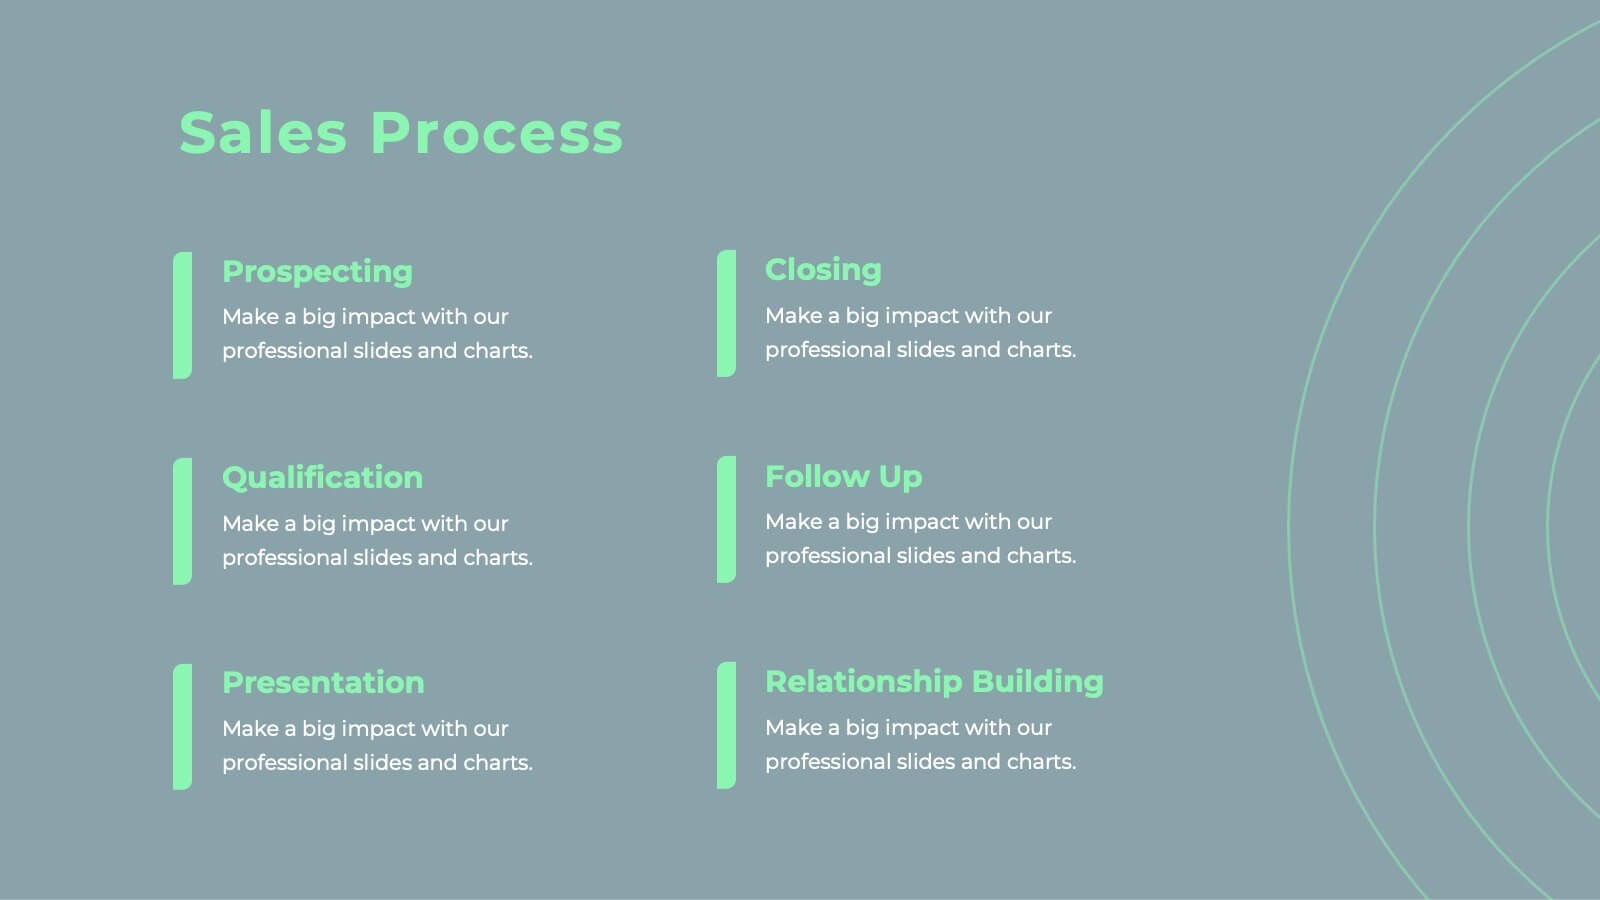
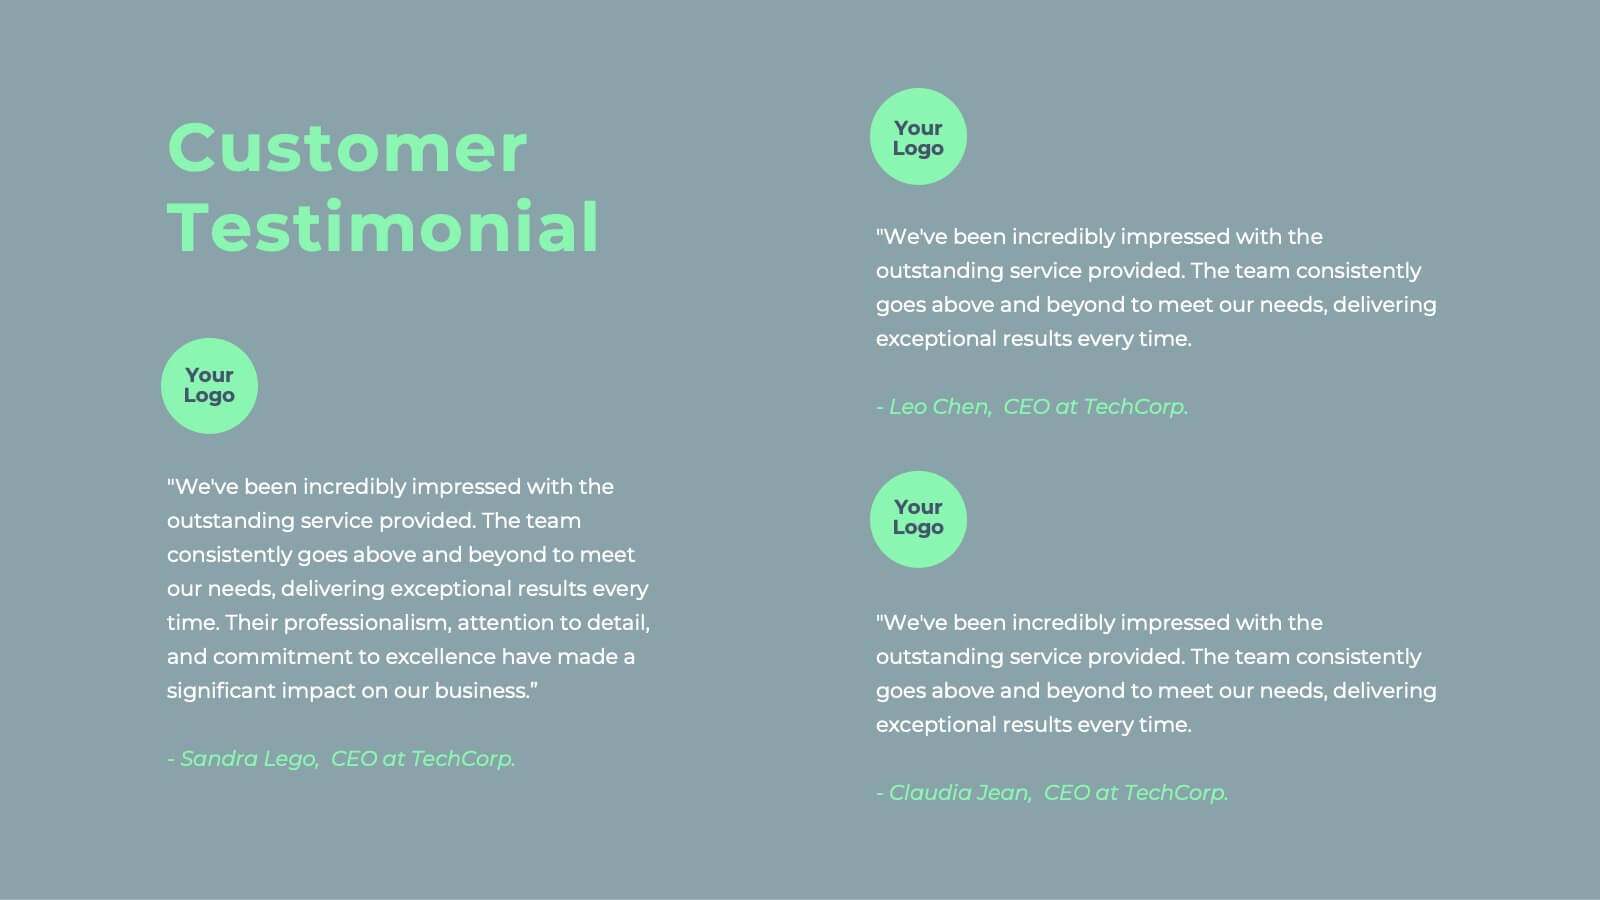
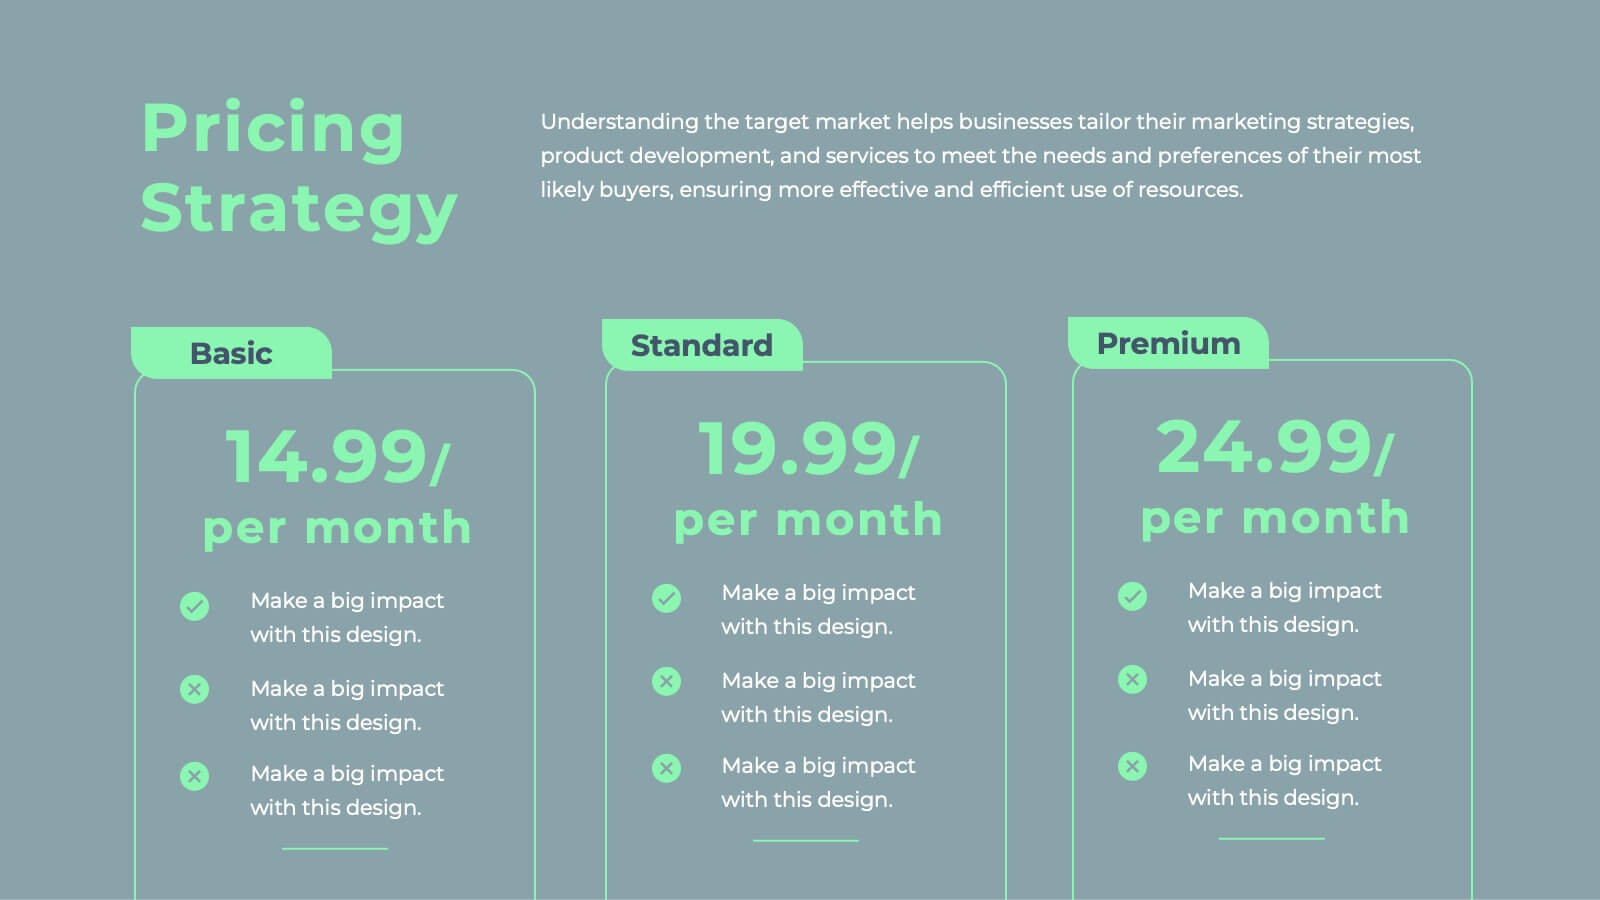
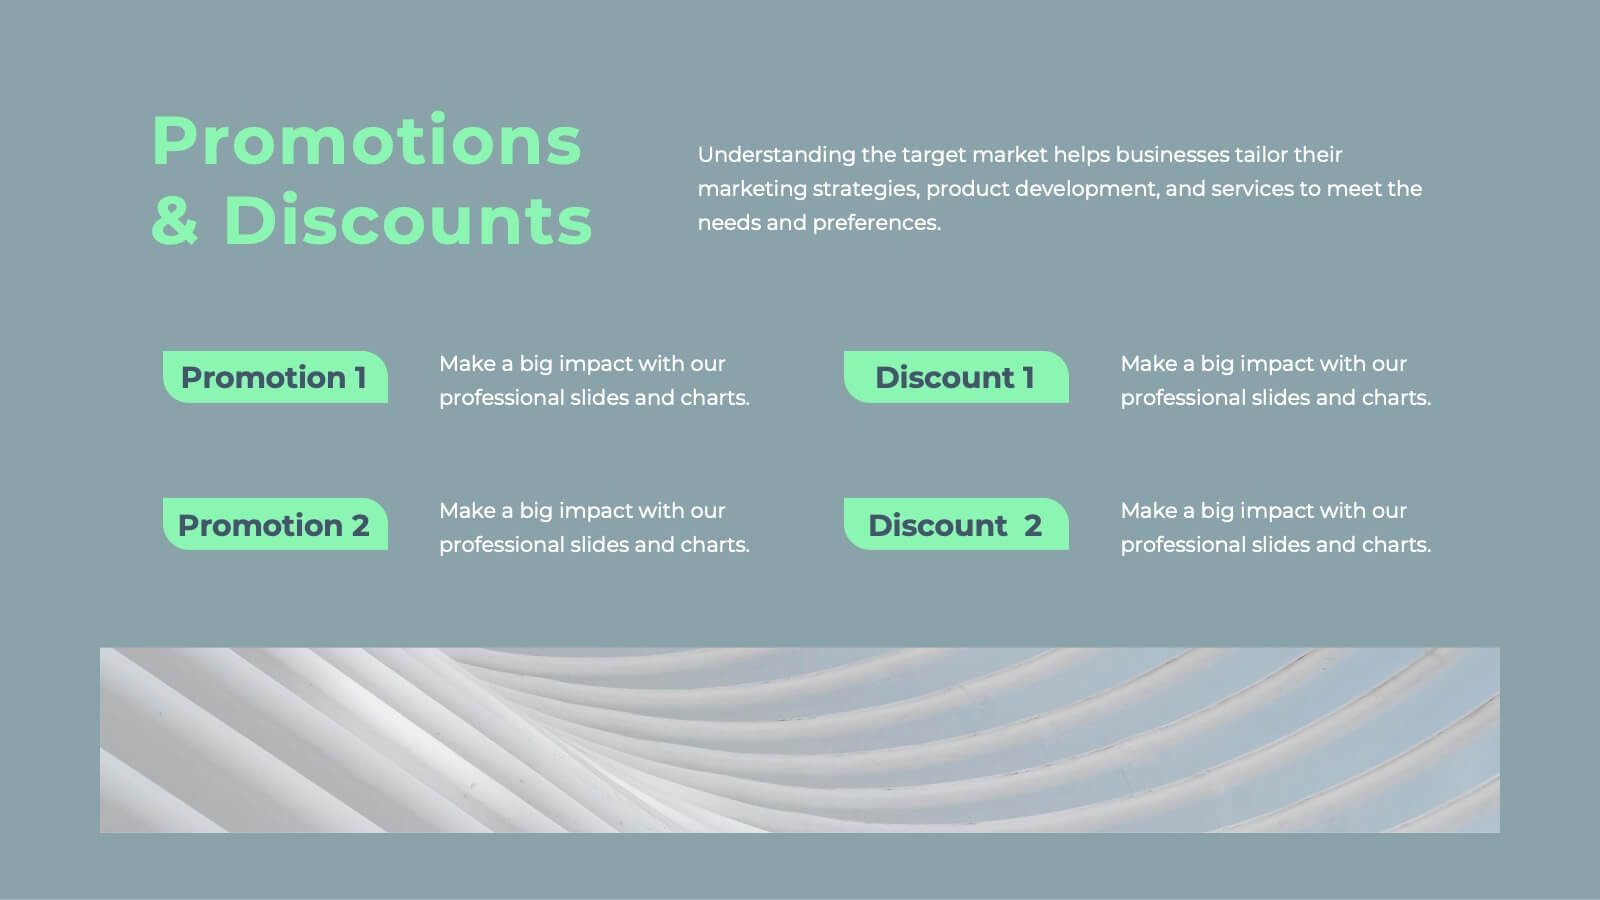
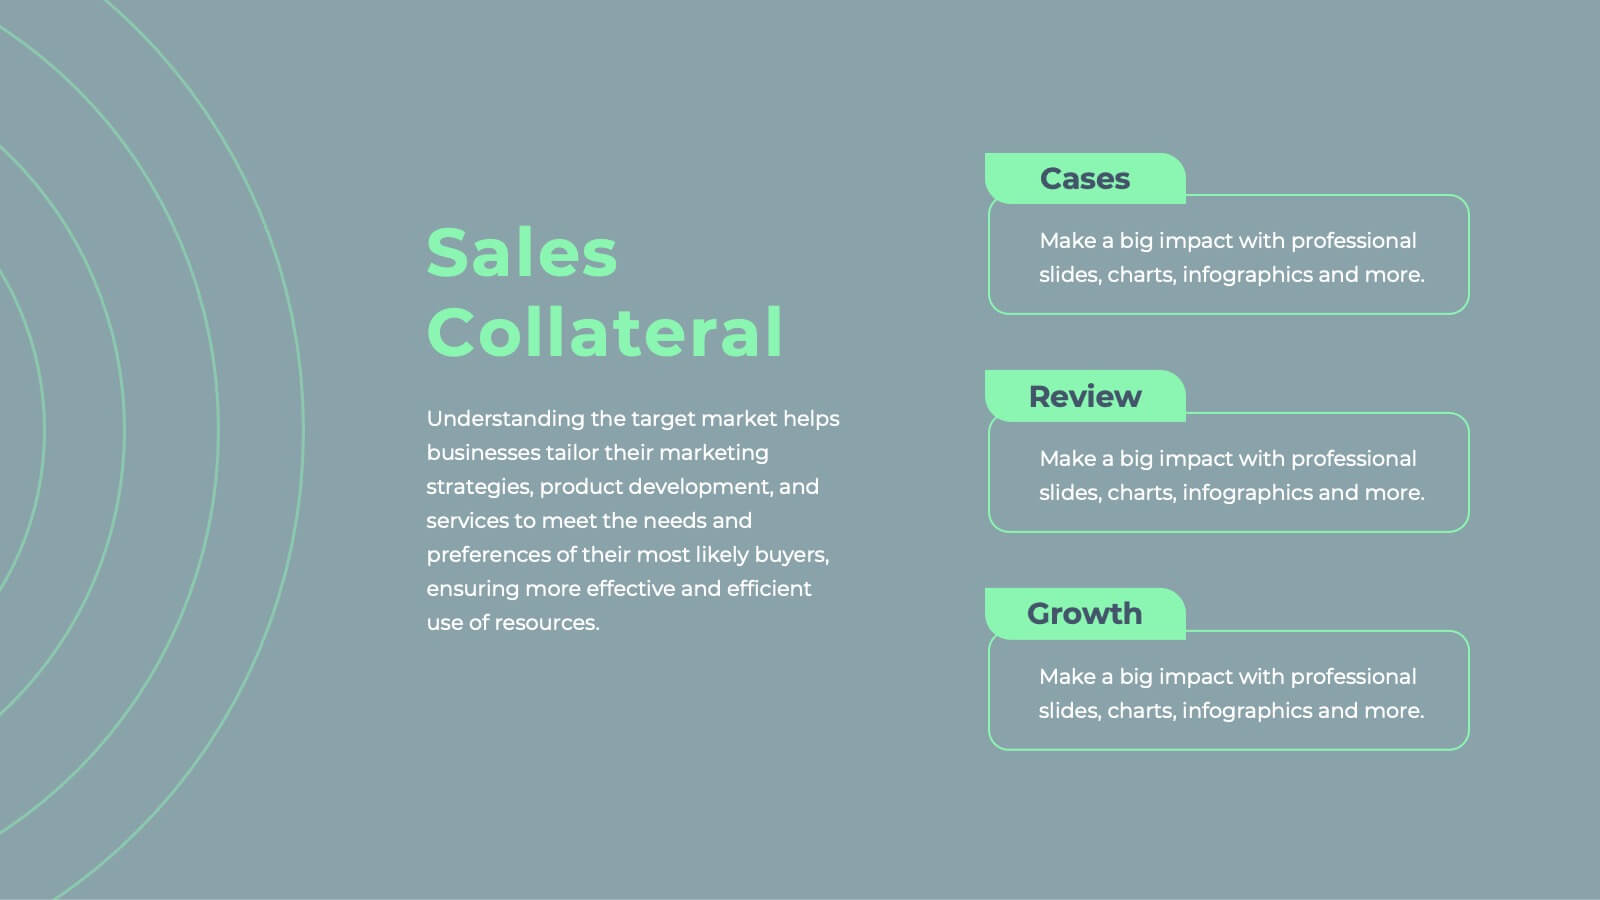
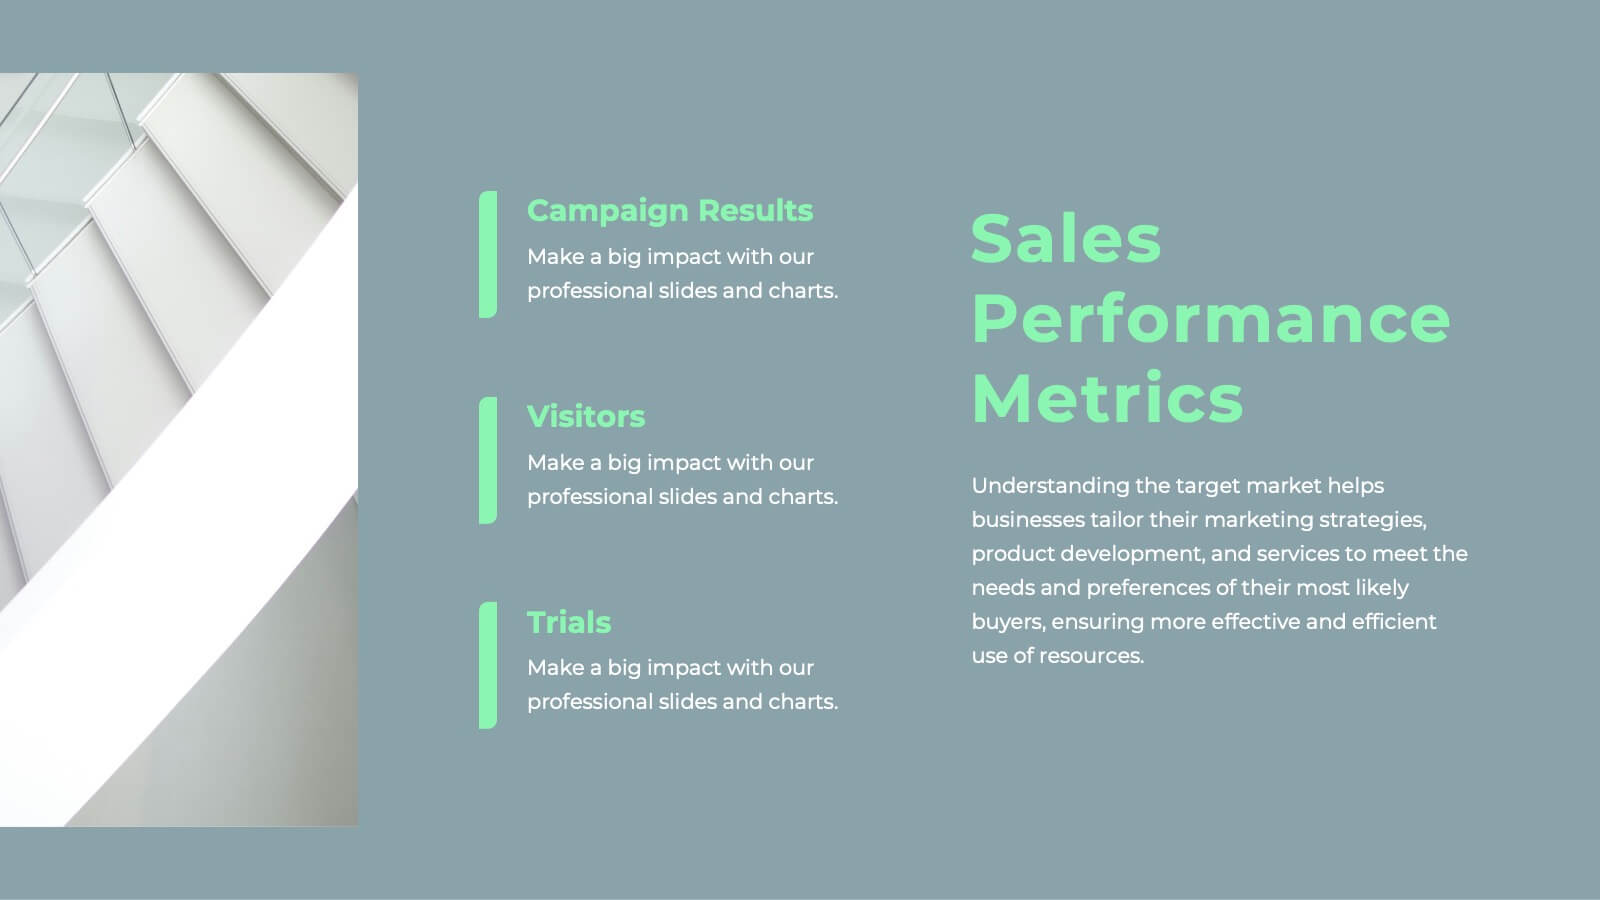
Javelin Sales Strategy Presentation
Boost your sales strategy with this sleek template! Perfect for outlining objectives, processes, performance metrics, and future opportunities. Tailored for impactful presentations to clients and teams. Fully customizable and compatible with PowerPoint, Keynote, and Google Slides.


6 diapositivas
Hexagon Infographic Diagram Presentation
Turn your data into a story worth seeing with a clean, geometric layout that connects six key ideas in one bold visual. This presentation is perfect for showcasing processes, strategies, or relationships in a modern, engaging way. Fully compatible with PowerPoint, Keynote, and Google Slides.


4 diapositivas
Leadership Training Framework Presentation
Inspire growth and guide your team toward success with this clear and modern presentation layout. Designed to illustrate leadership principles, development stages, and coaching strategies, it helps communicate training goals with professionalism and ease. Fully customizable and compatible with PowerPoint, Keynote, and Google Slides for seamless use across platforms.


7 diapositivas
Sustainability Management Infographics Presentation Template
Sustainability management is a management discipline that enables organizations to understand and integrate the environmental, social and economic aspects of sustainability in all their activities. A community will be more likely to reduce energy, water and waste if they have the management available to set goals for their business. This template is perfect if you are looking for sustainability and elements needed to meet your goals. This template is designed to support an organization's efforts to improve its performance, packed with illustrations you can customize and add your own tips too.


28 diapositivas
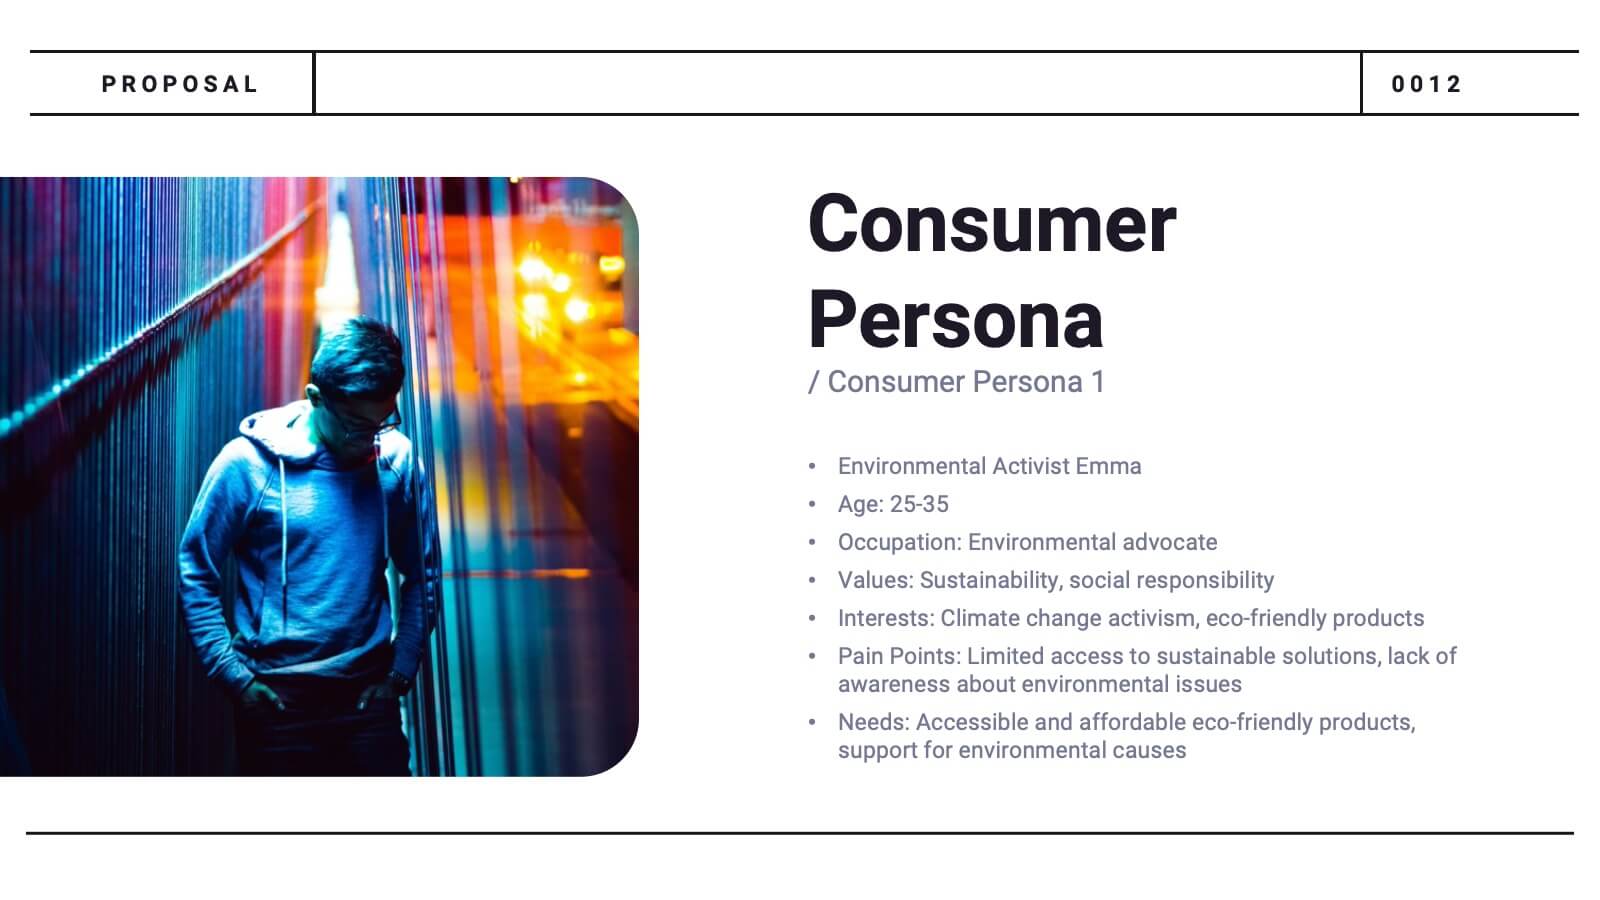
Glowspire Brand Guidelines Proposal Presentation
This brand identity template covers essential components: logo, imagery, color, typography, and voice & tone. It includes slides for consumer persona, market analysis, USP, brand positioning, and strategy. Ideal for establishing a cohesive brand, it highlights brand touchpoints across digital, print, packaging, and advertising mediums. Customizable for various platforms.