


Características


¿Tienes alguna pregunta?
Recomendar


20 diapositivas
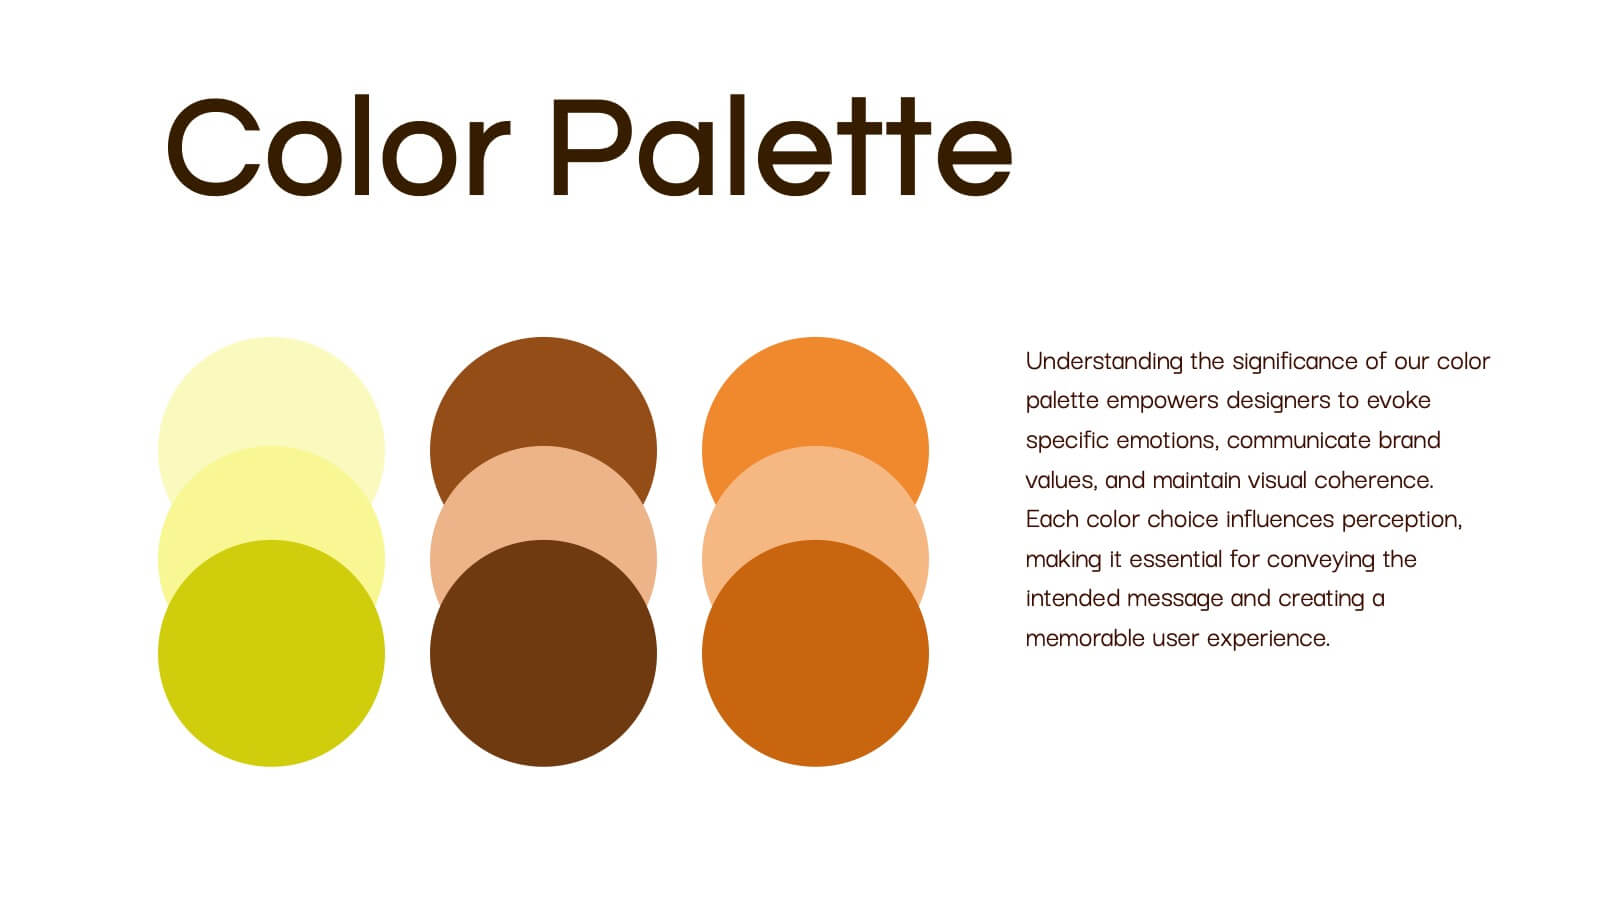
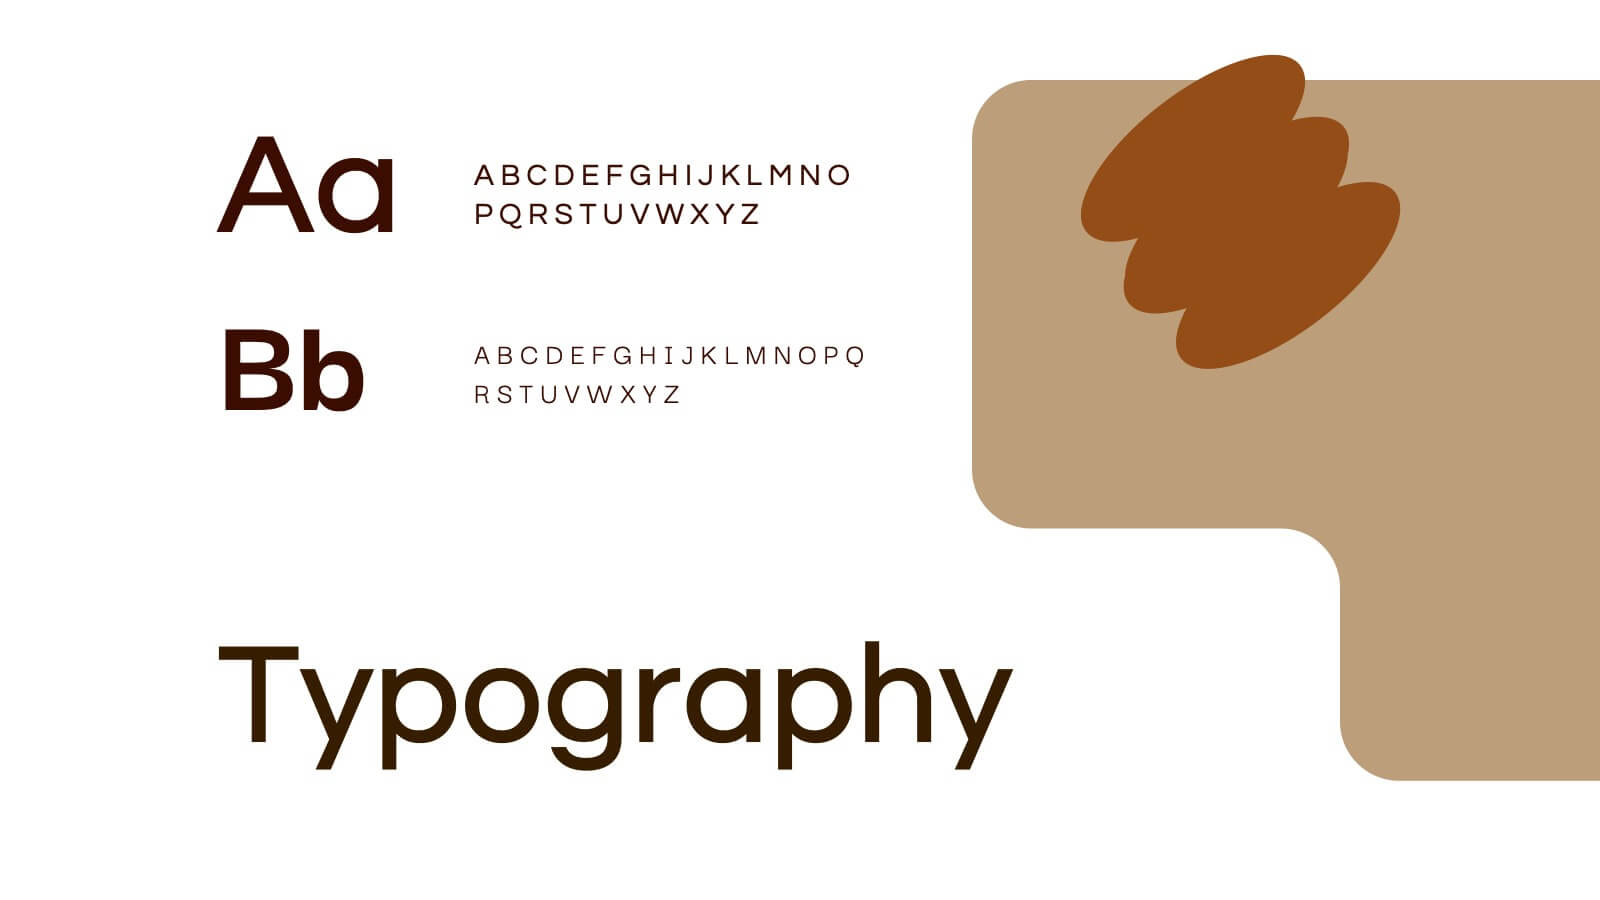
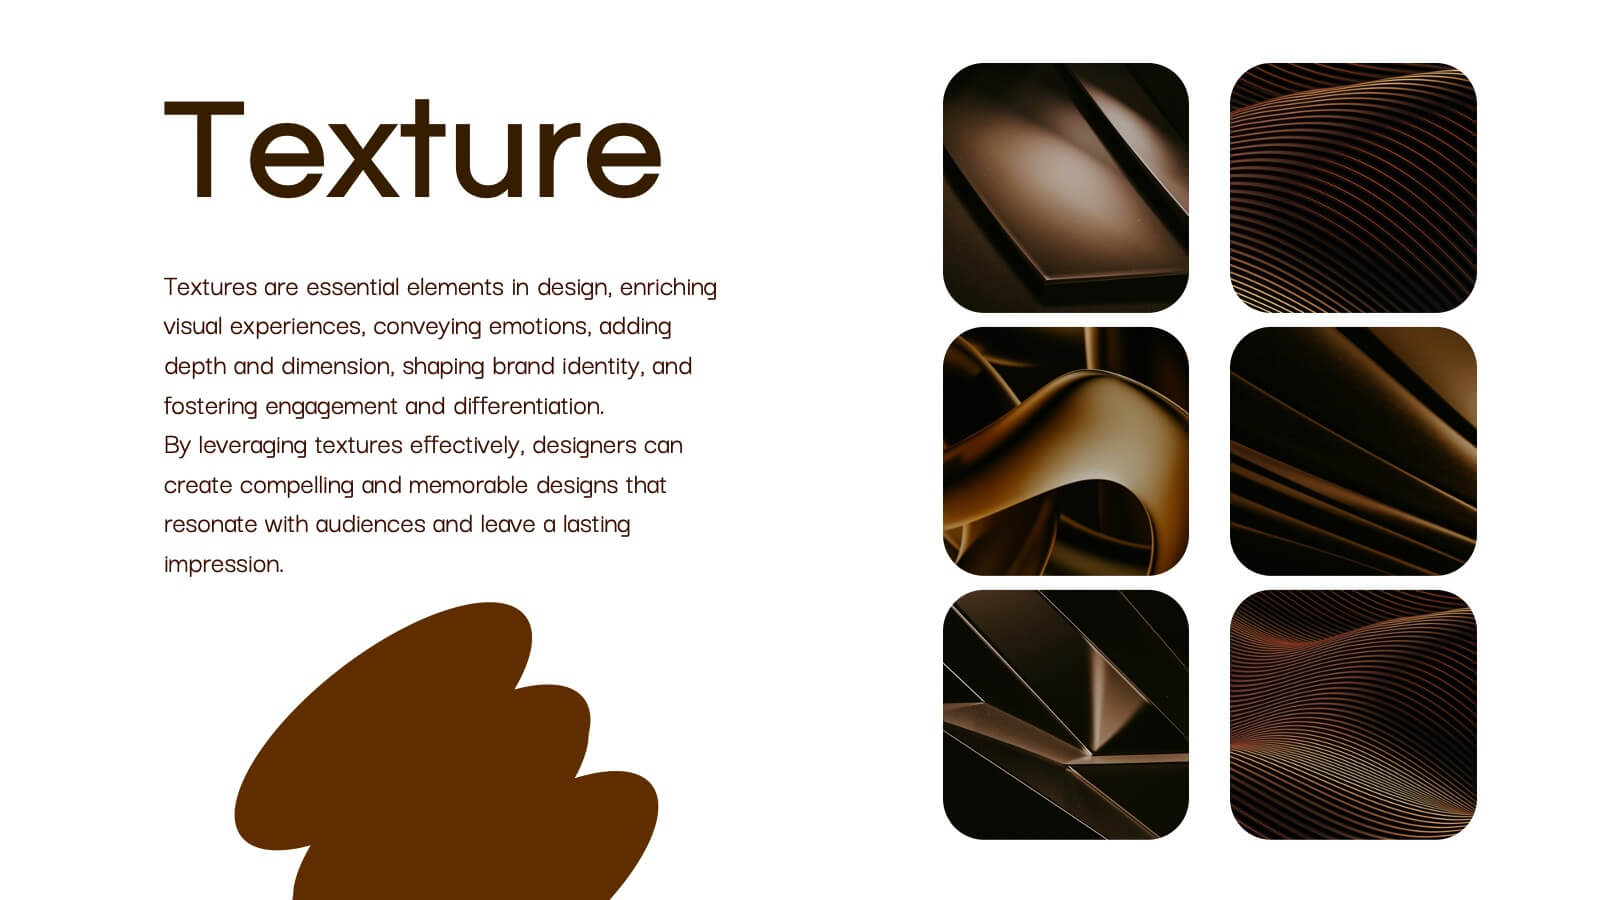
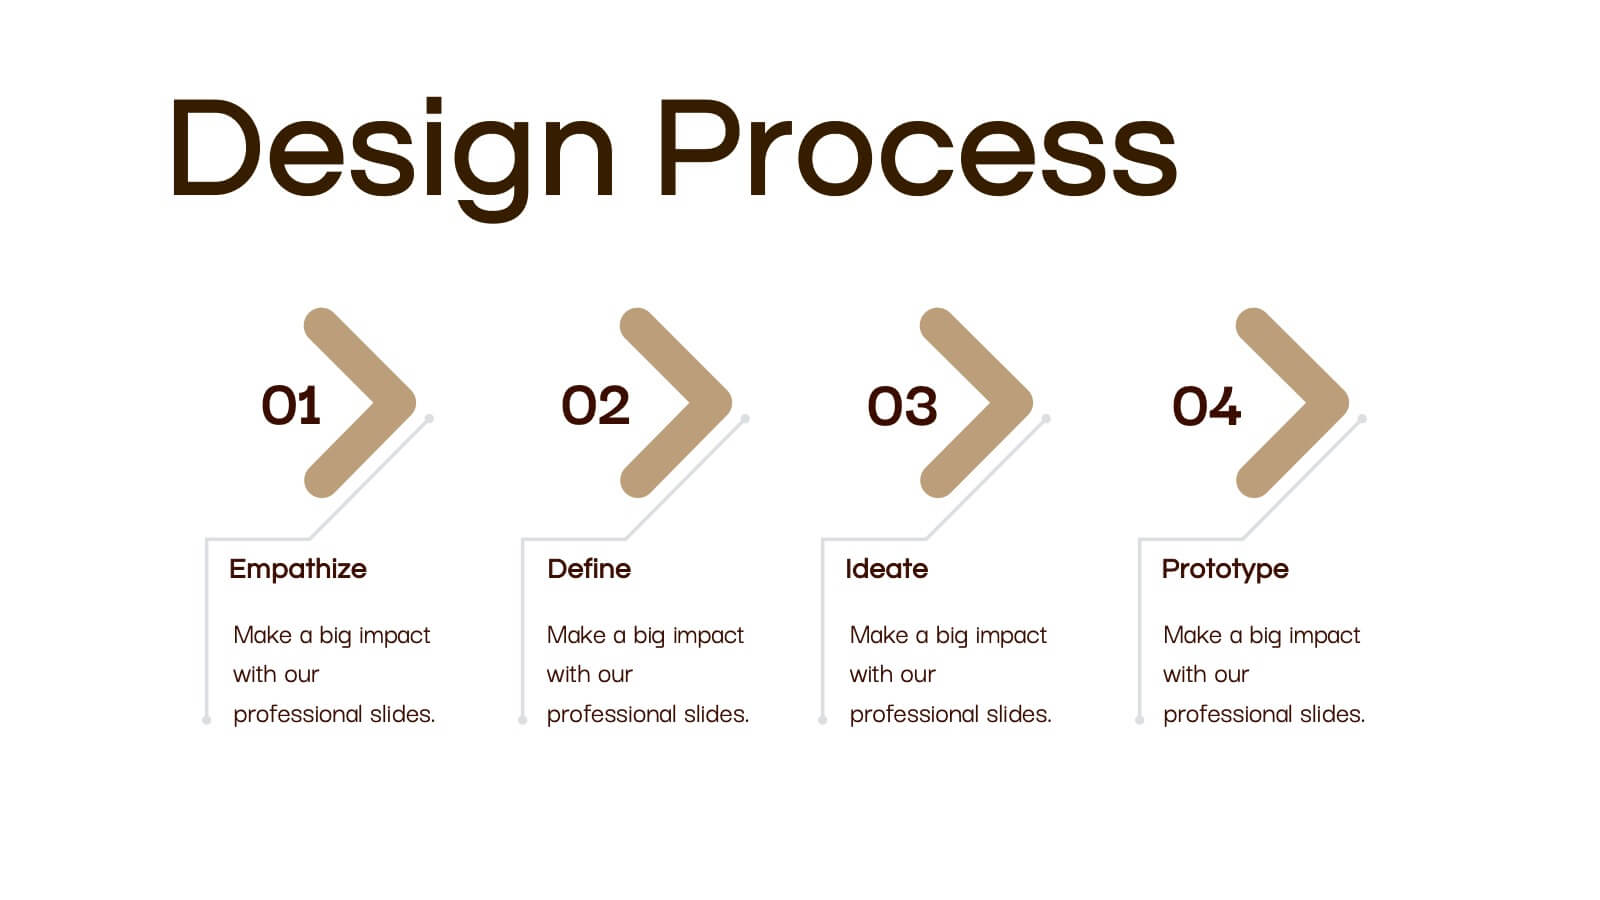
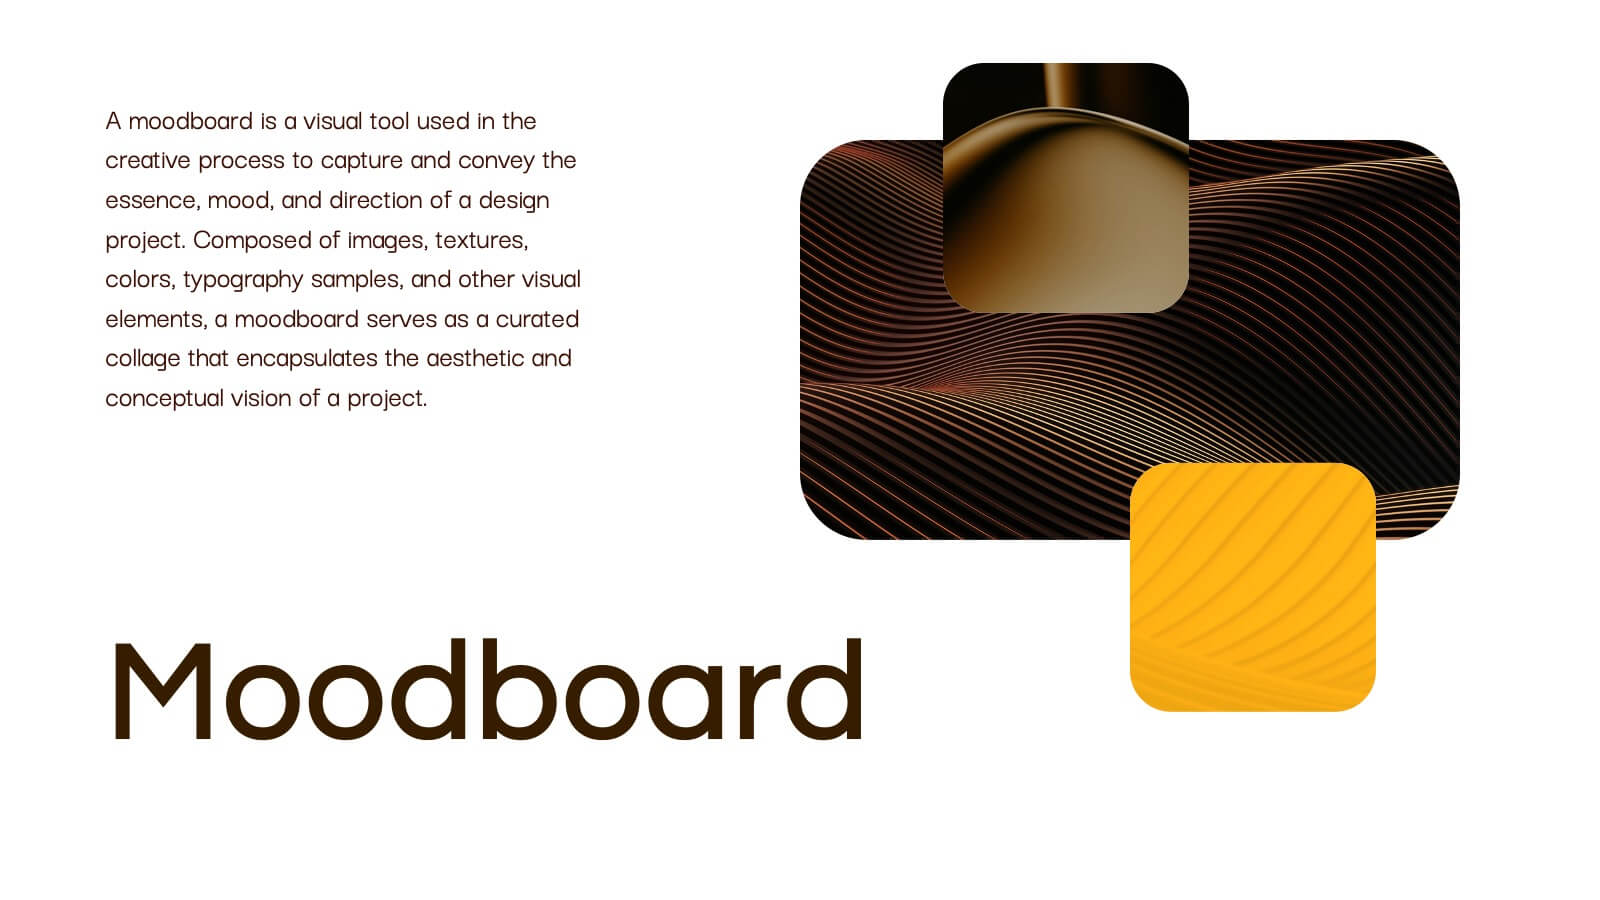
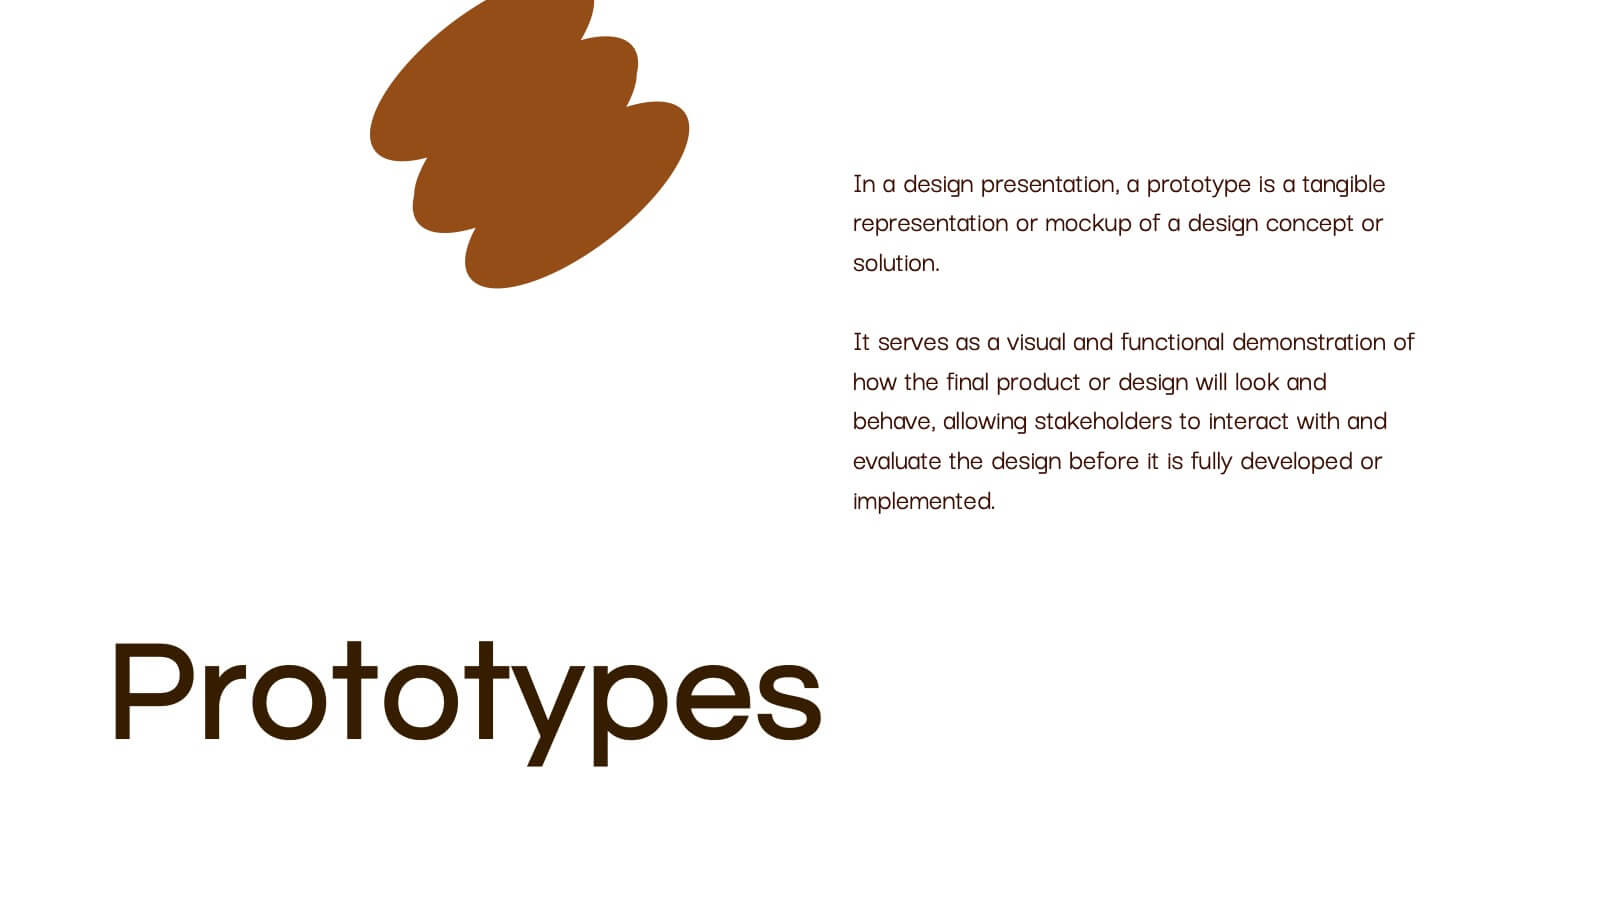
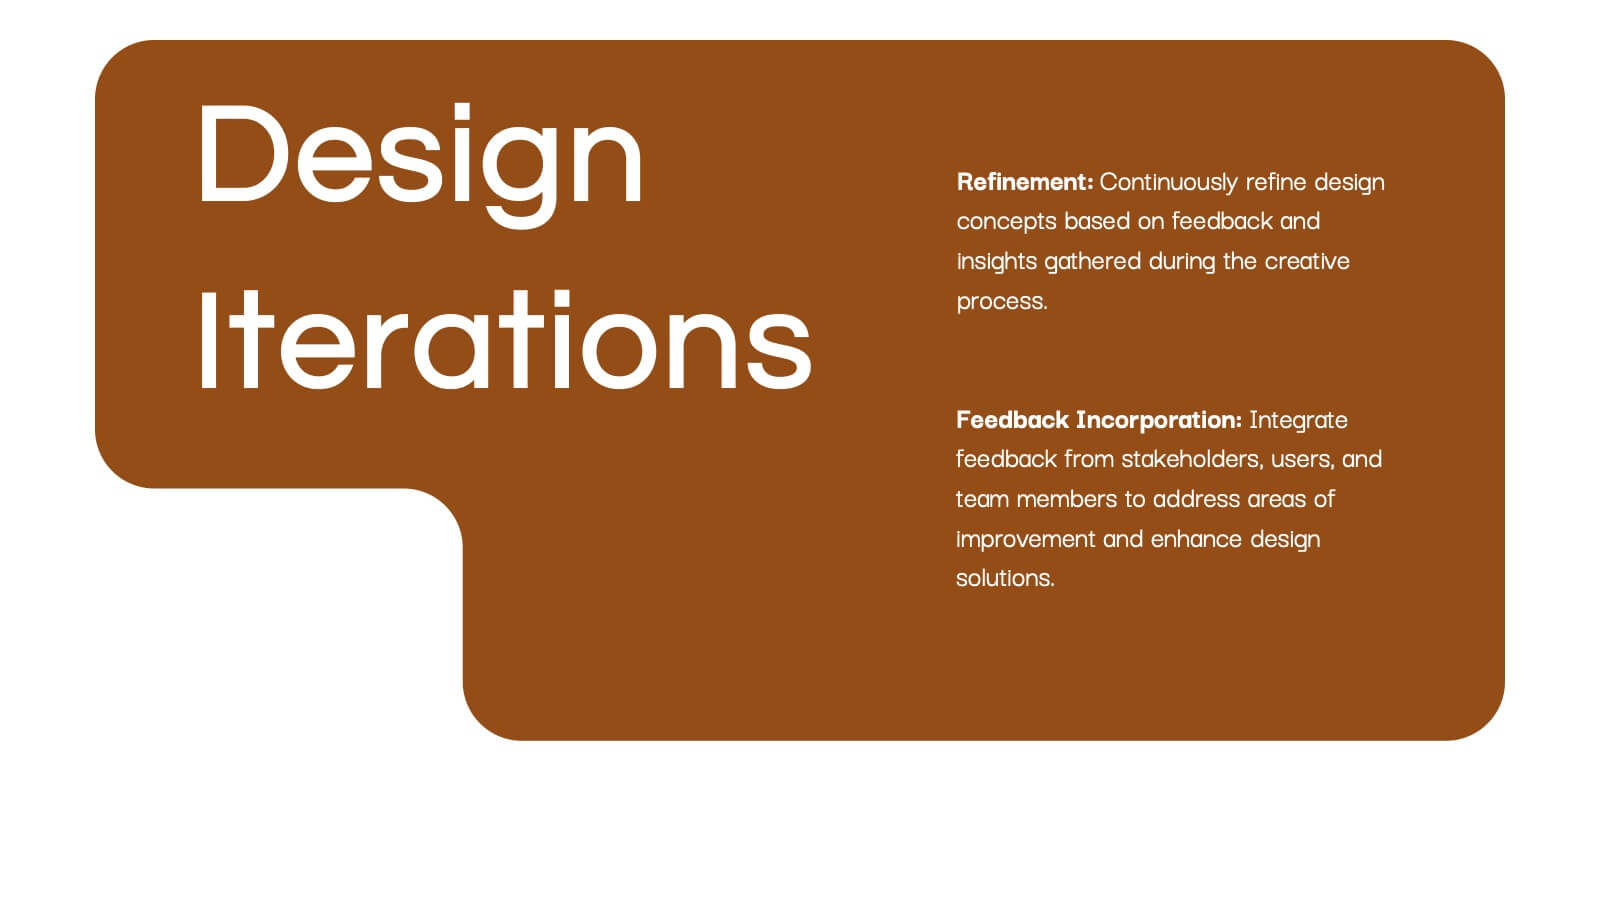
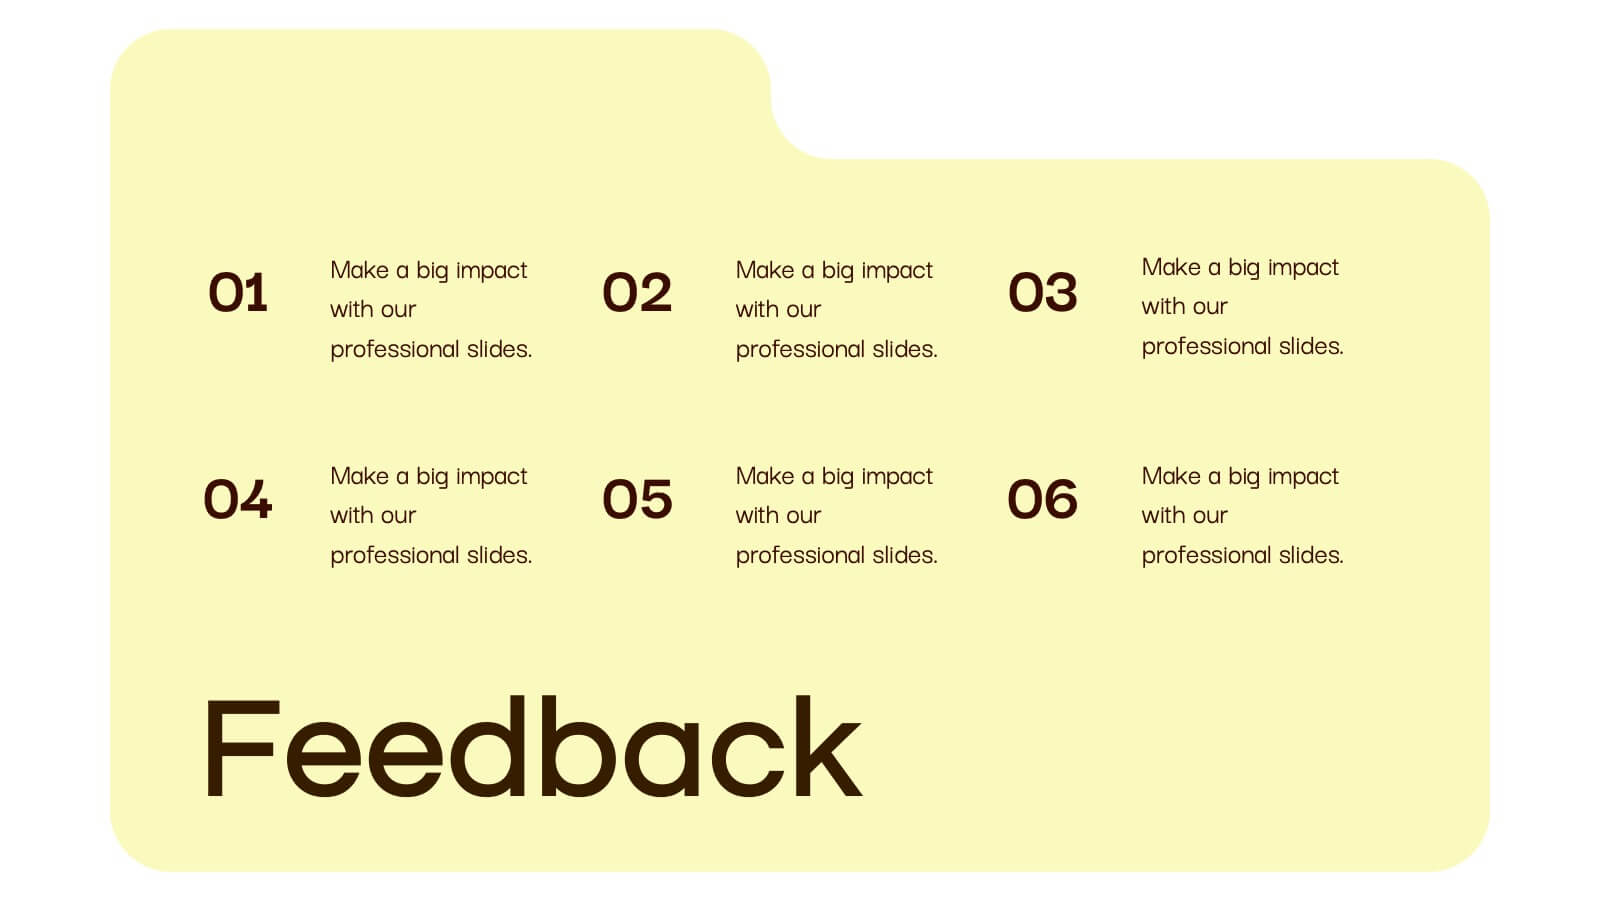
Obsidian Creative Design Report Presentation
Bring your creative vision to life with this stunning design presentation template! Perfect for showcasing your design process, from concept development and mood boards to typography and final assets. Ideal for creative professionals, this template offers clarity and style at every step. Compatible with PowerPoint, Keynote, and Google Slides, it’s your ultimate tool for design presentations.


20 diapositivas
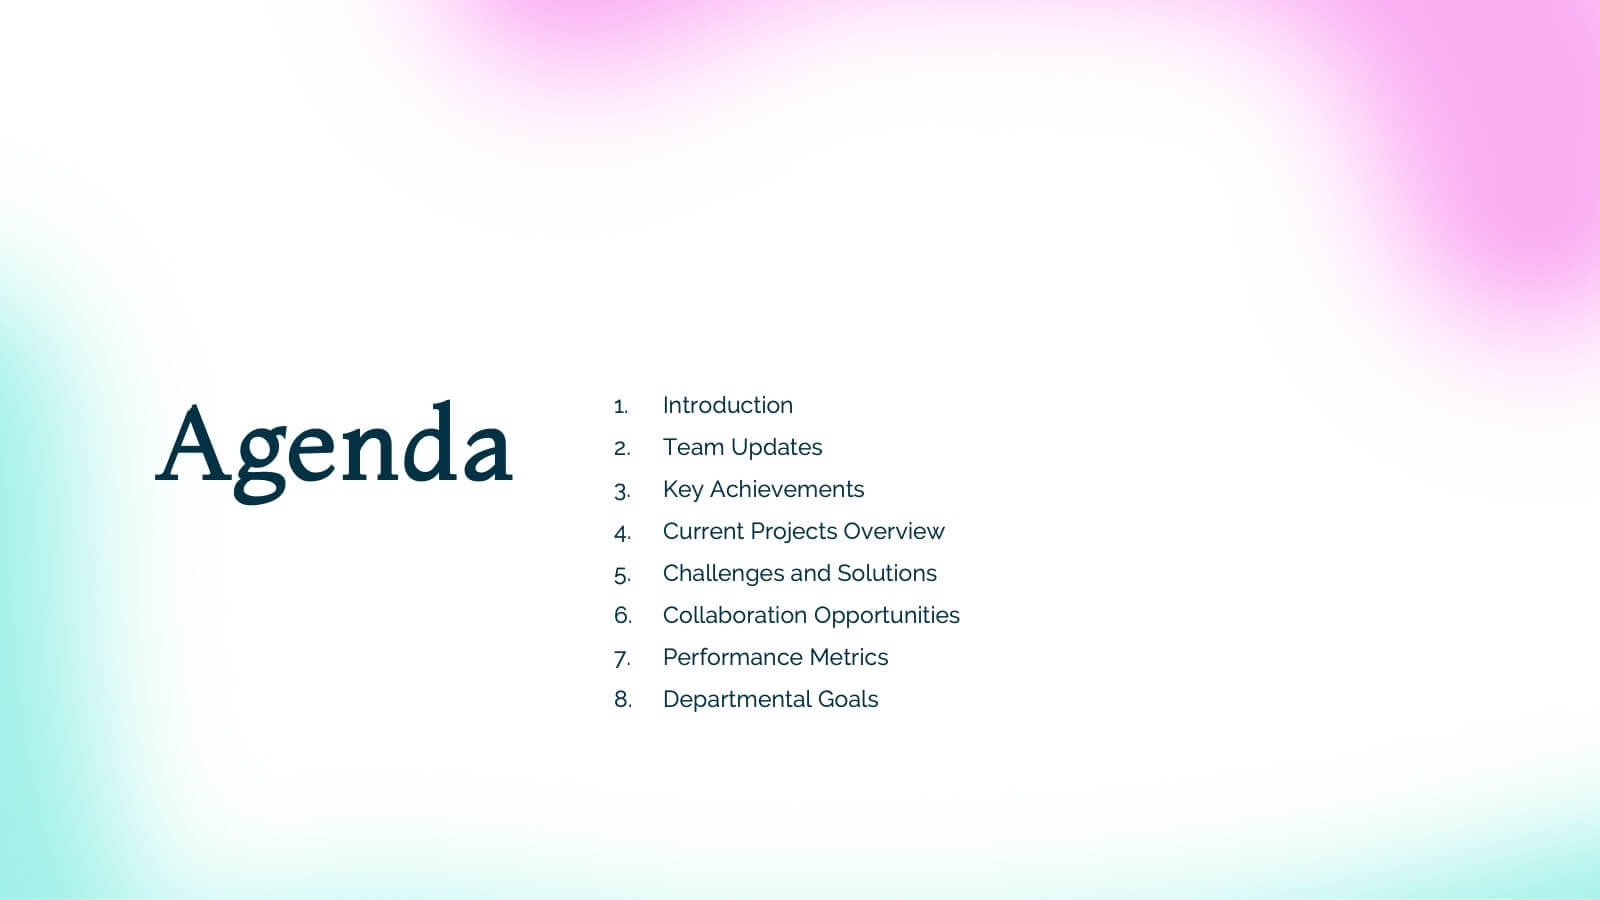
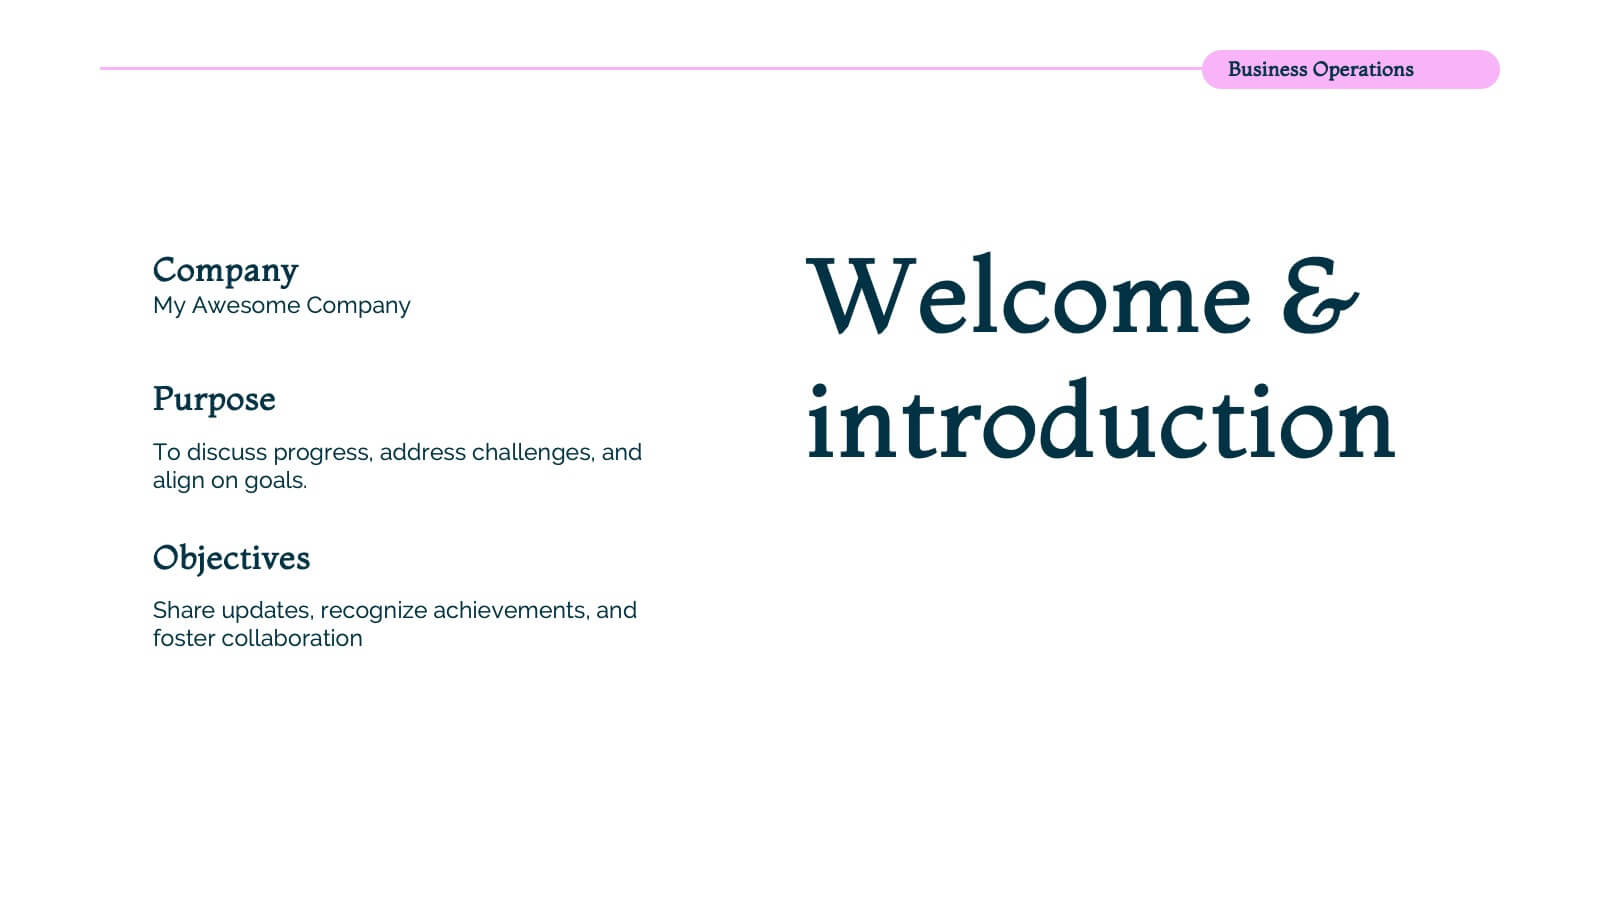
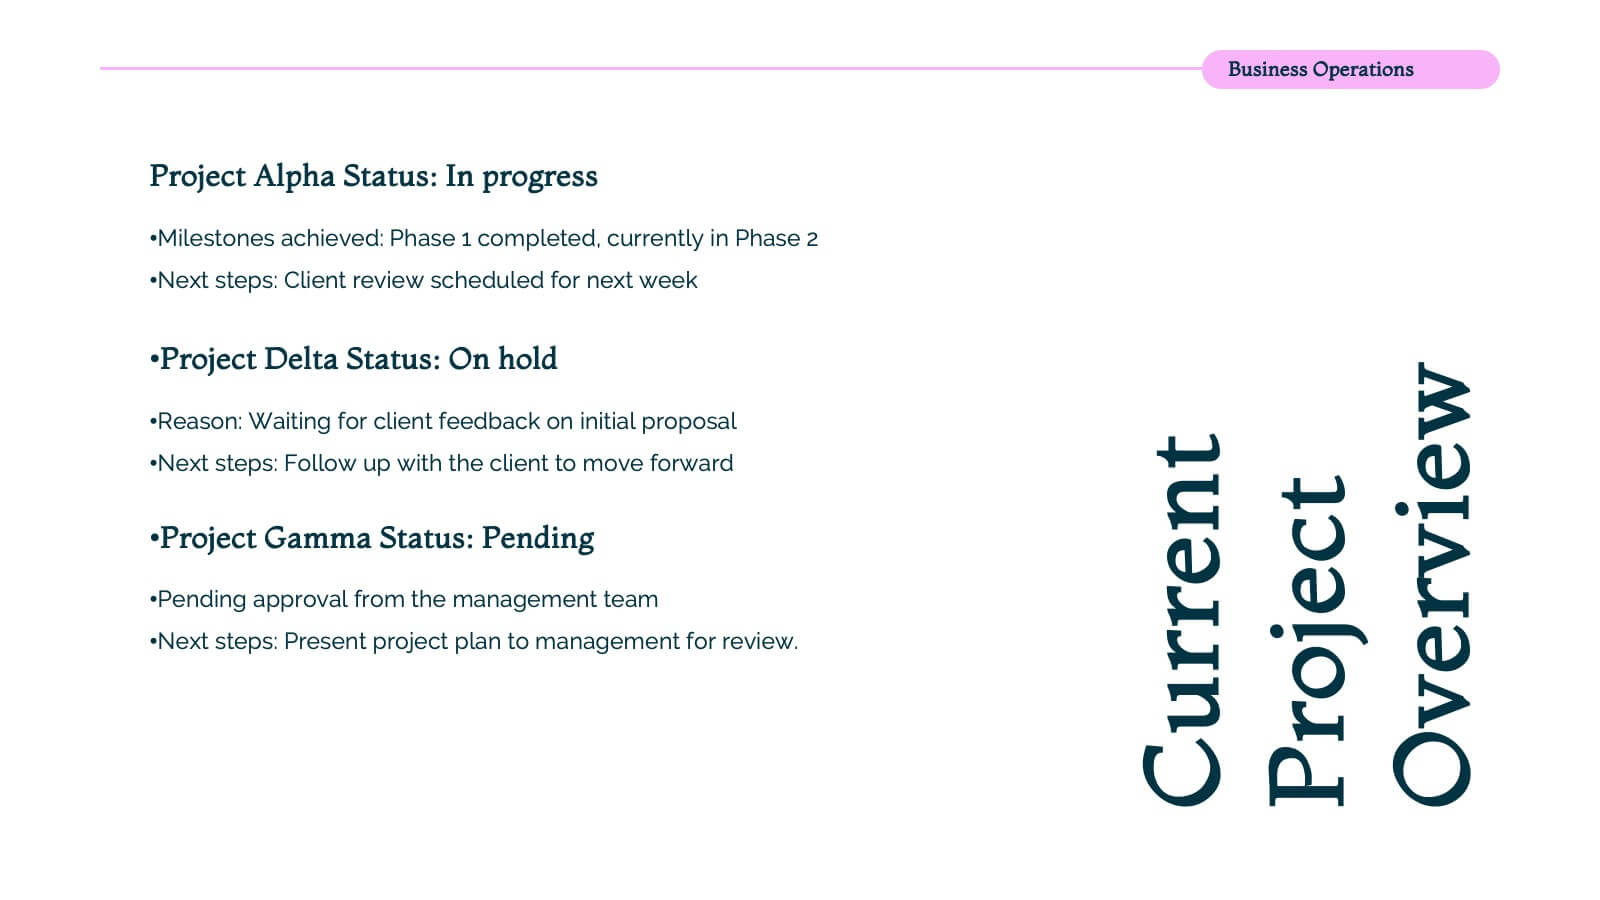
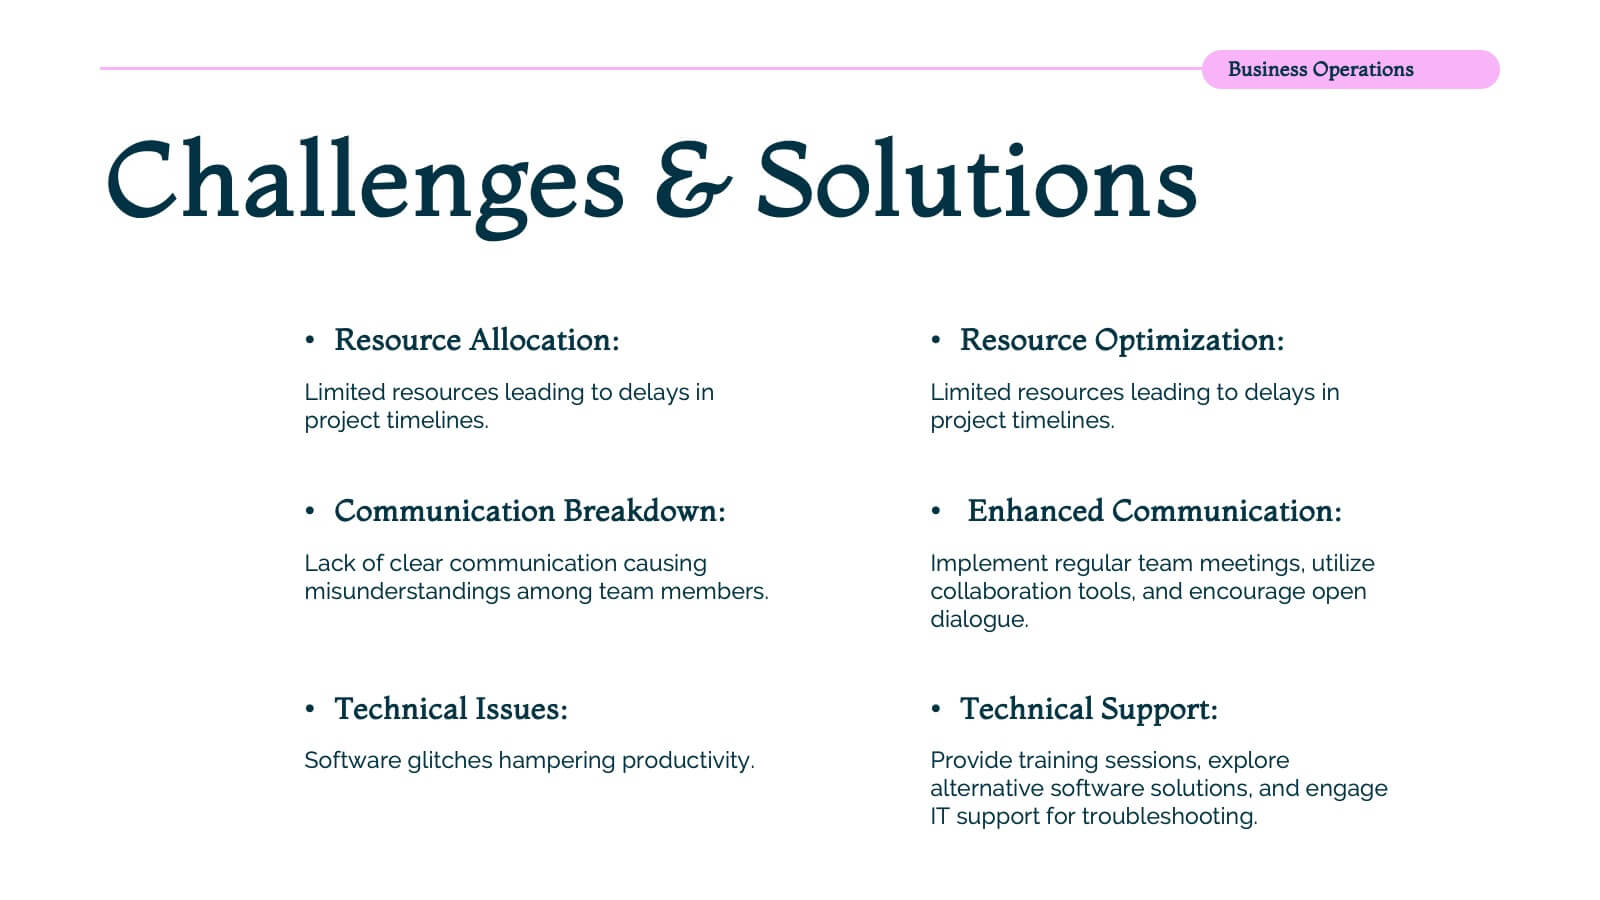
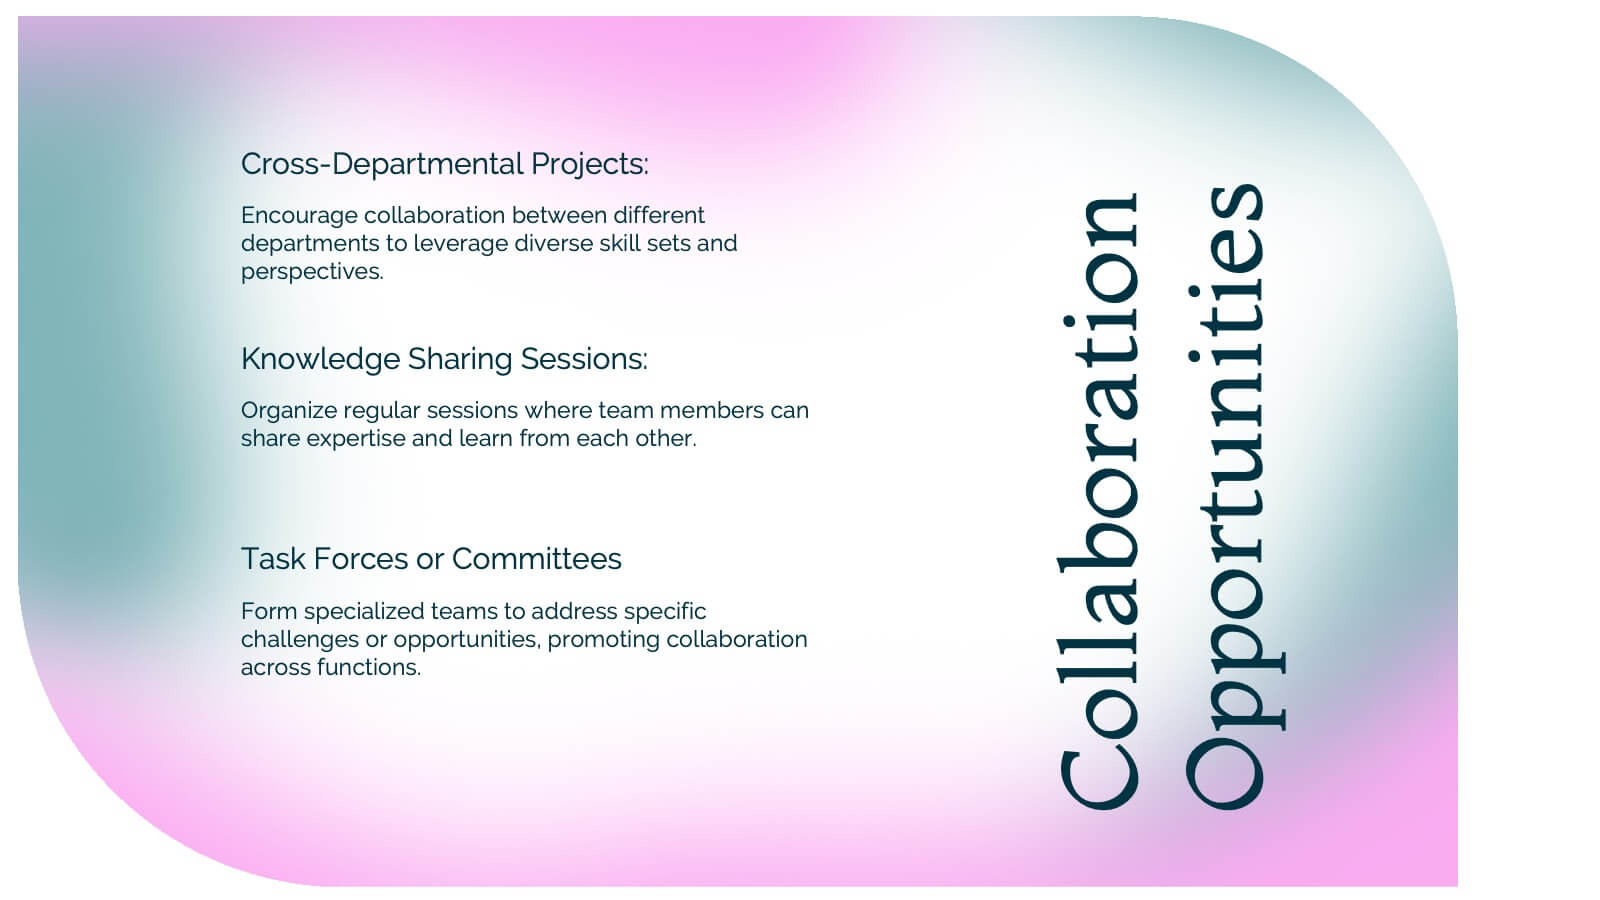
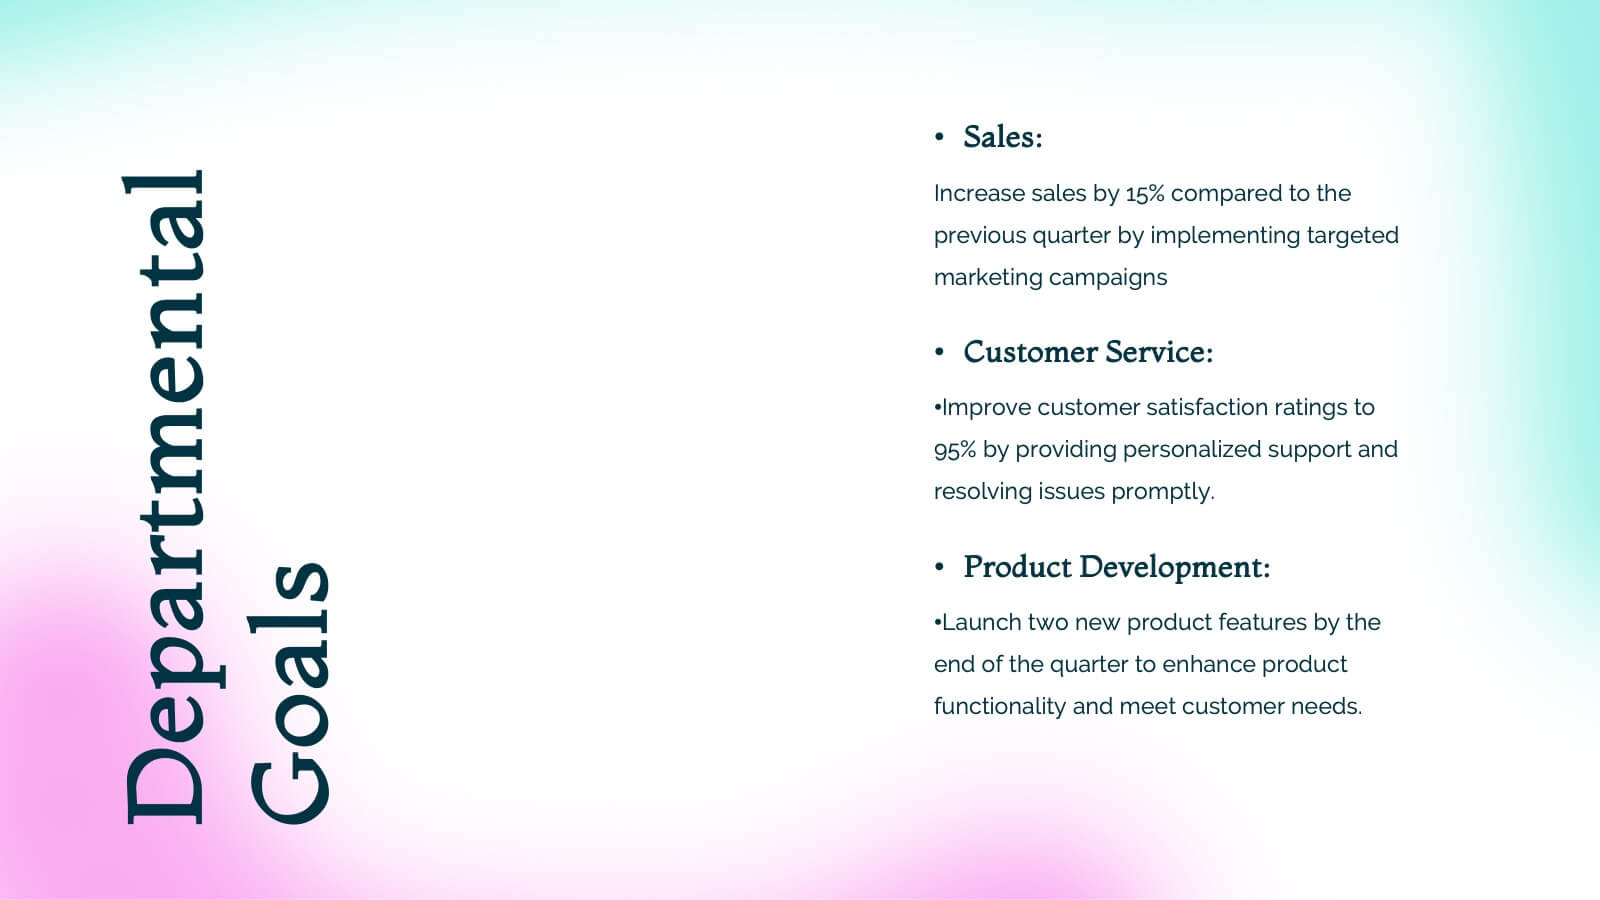
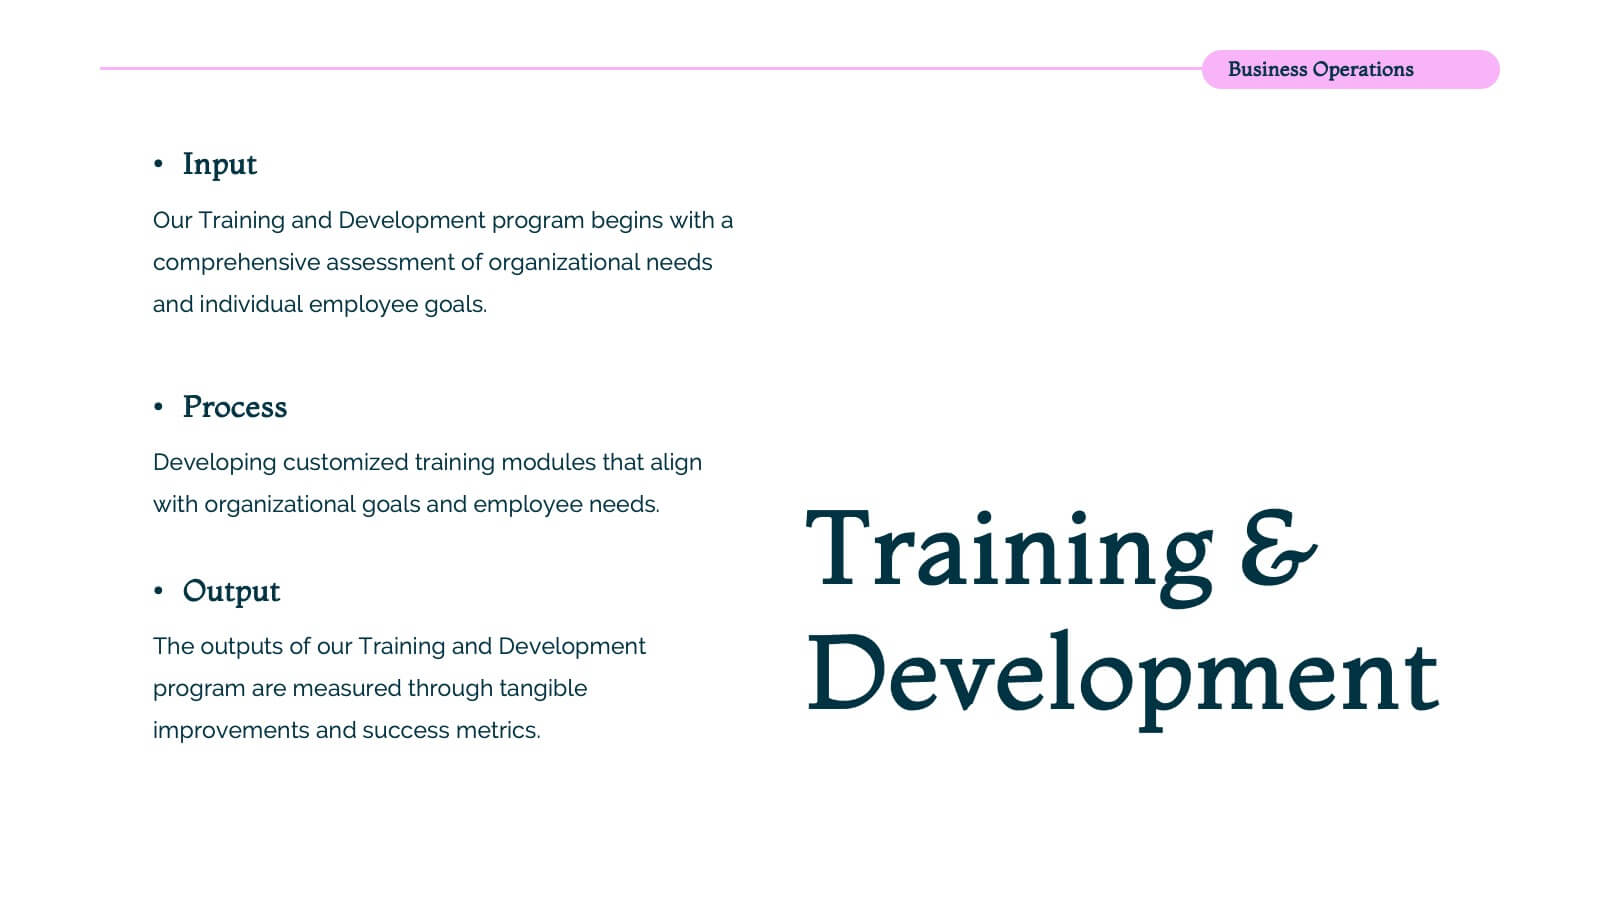
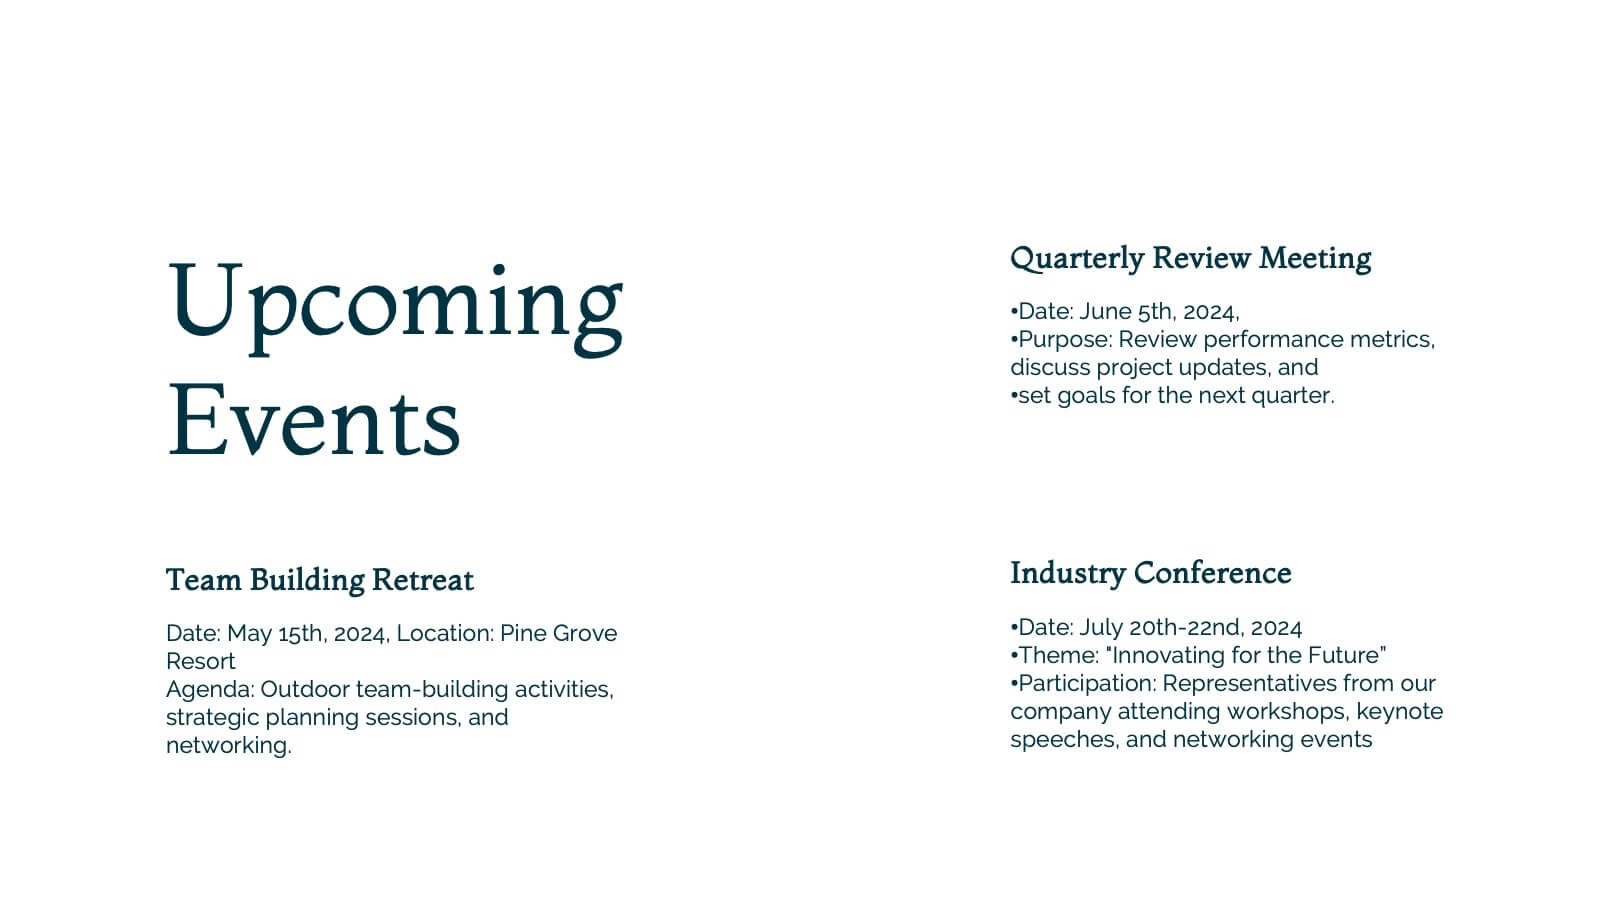
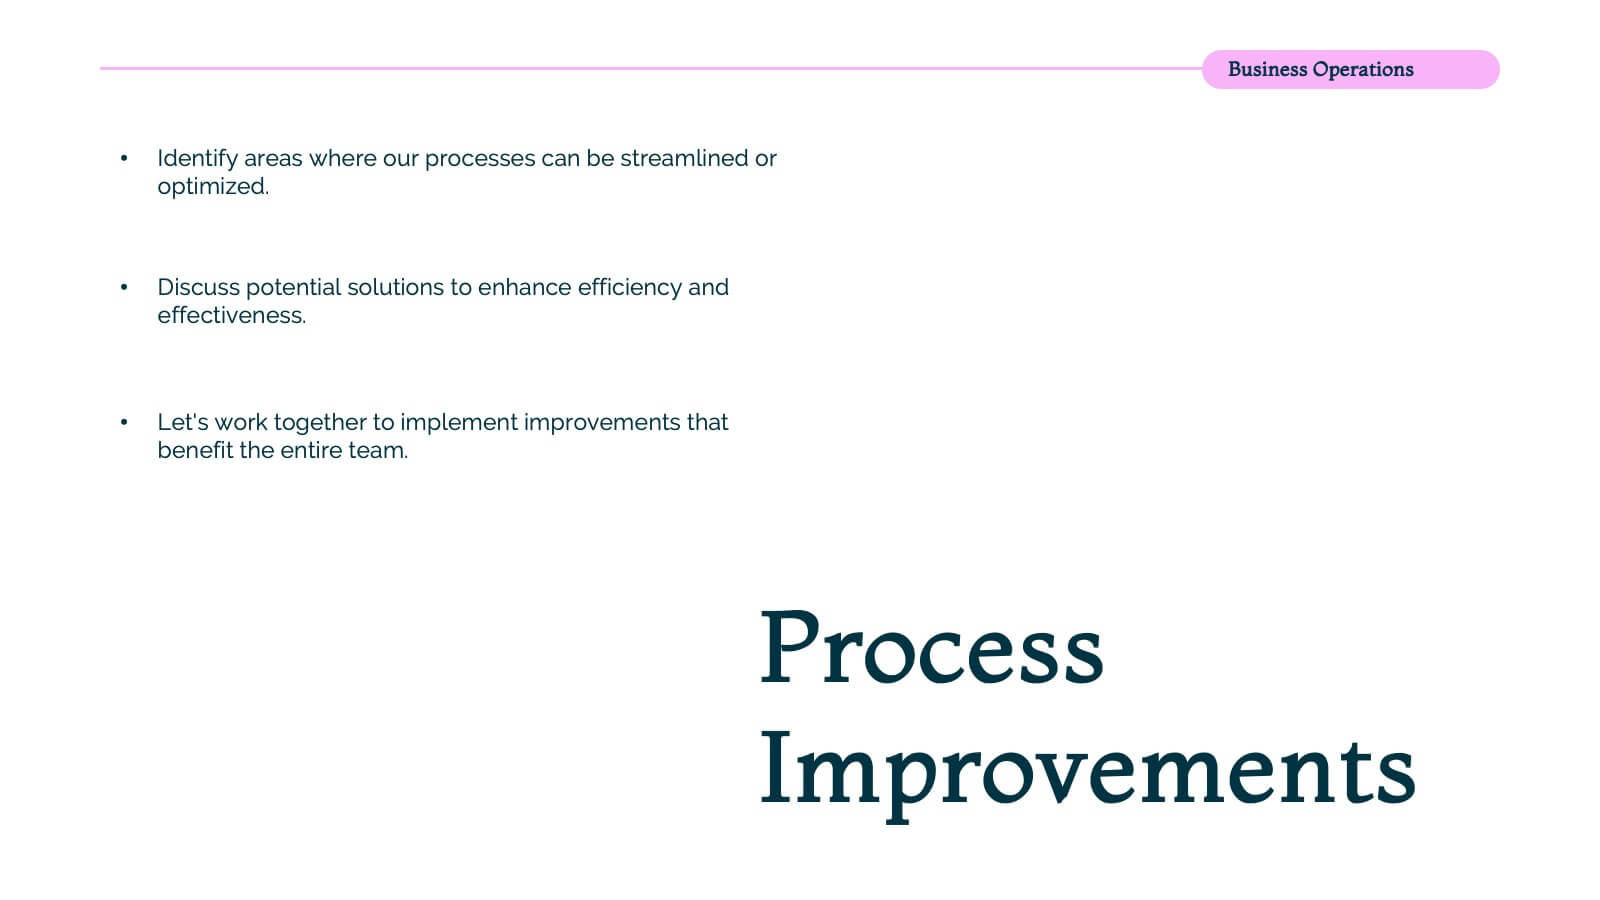
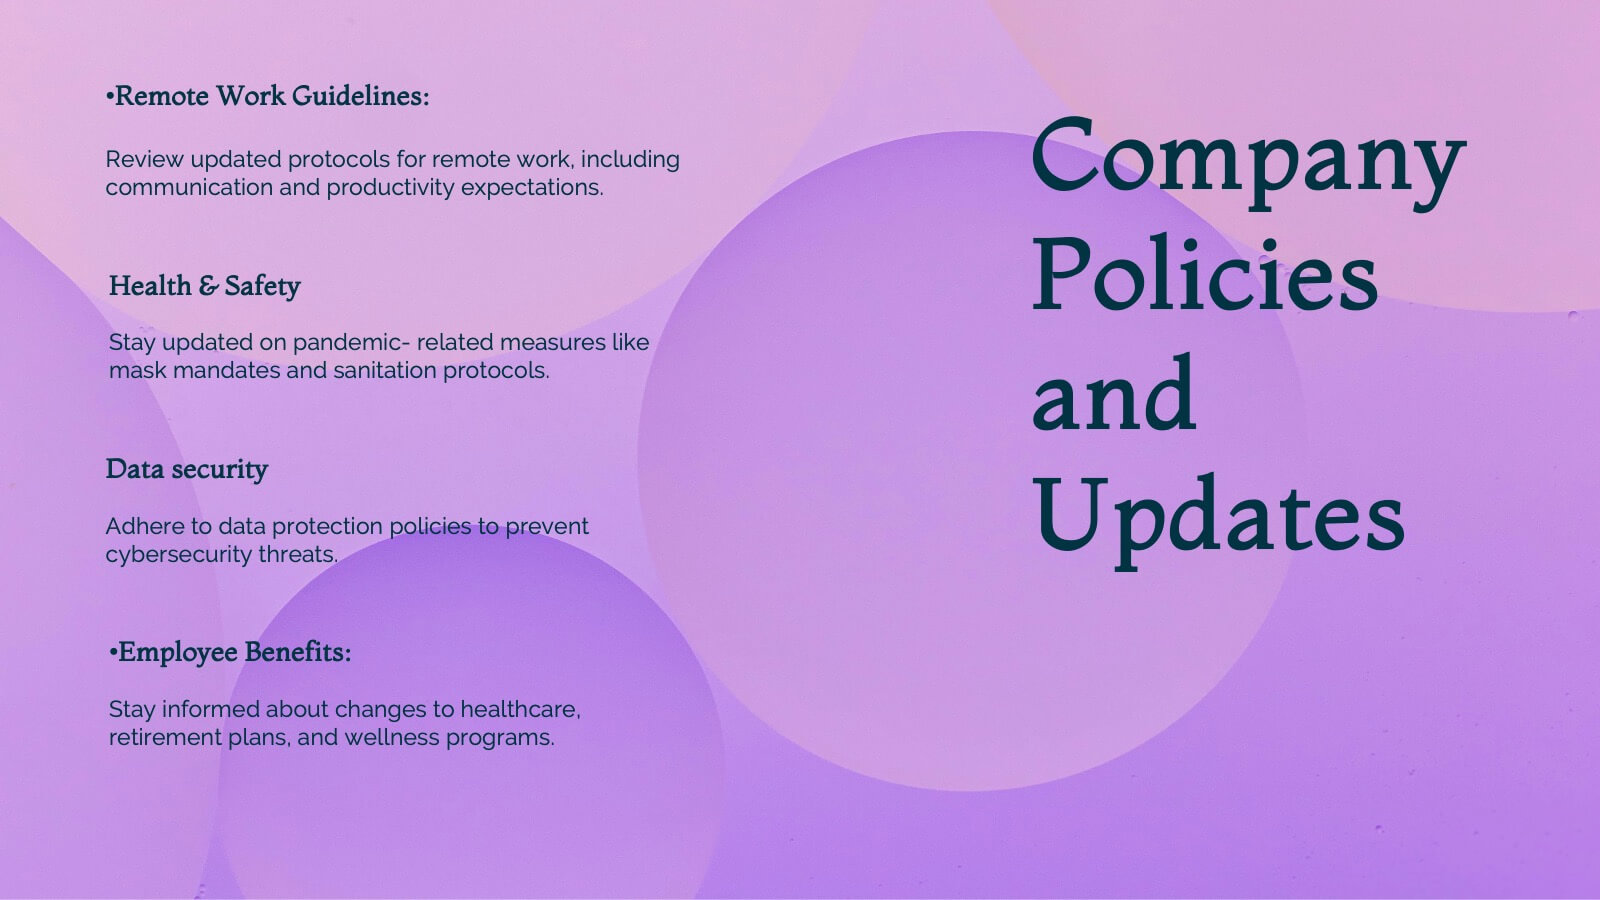
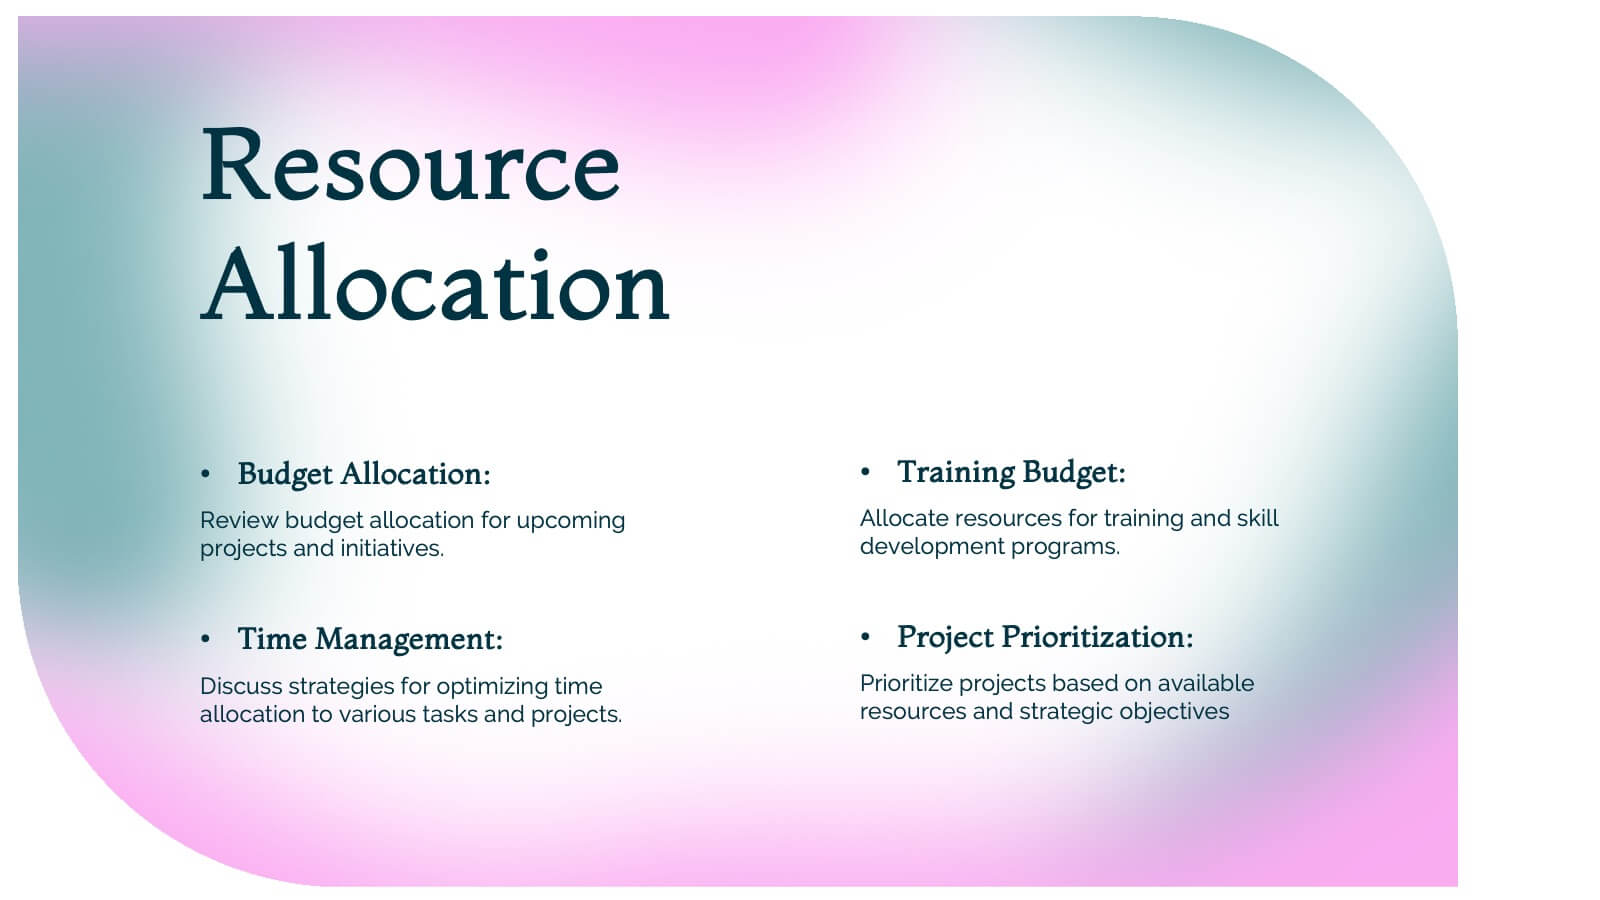
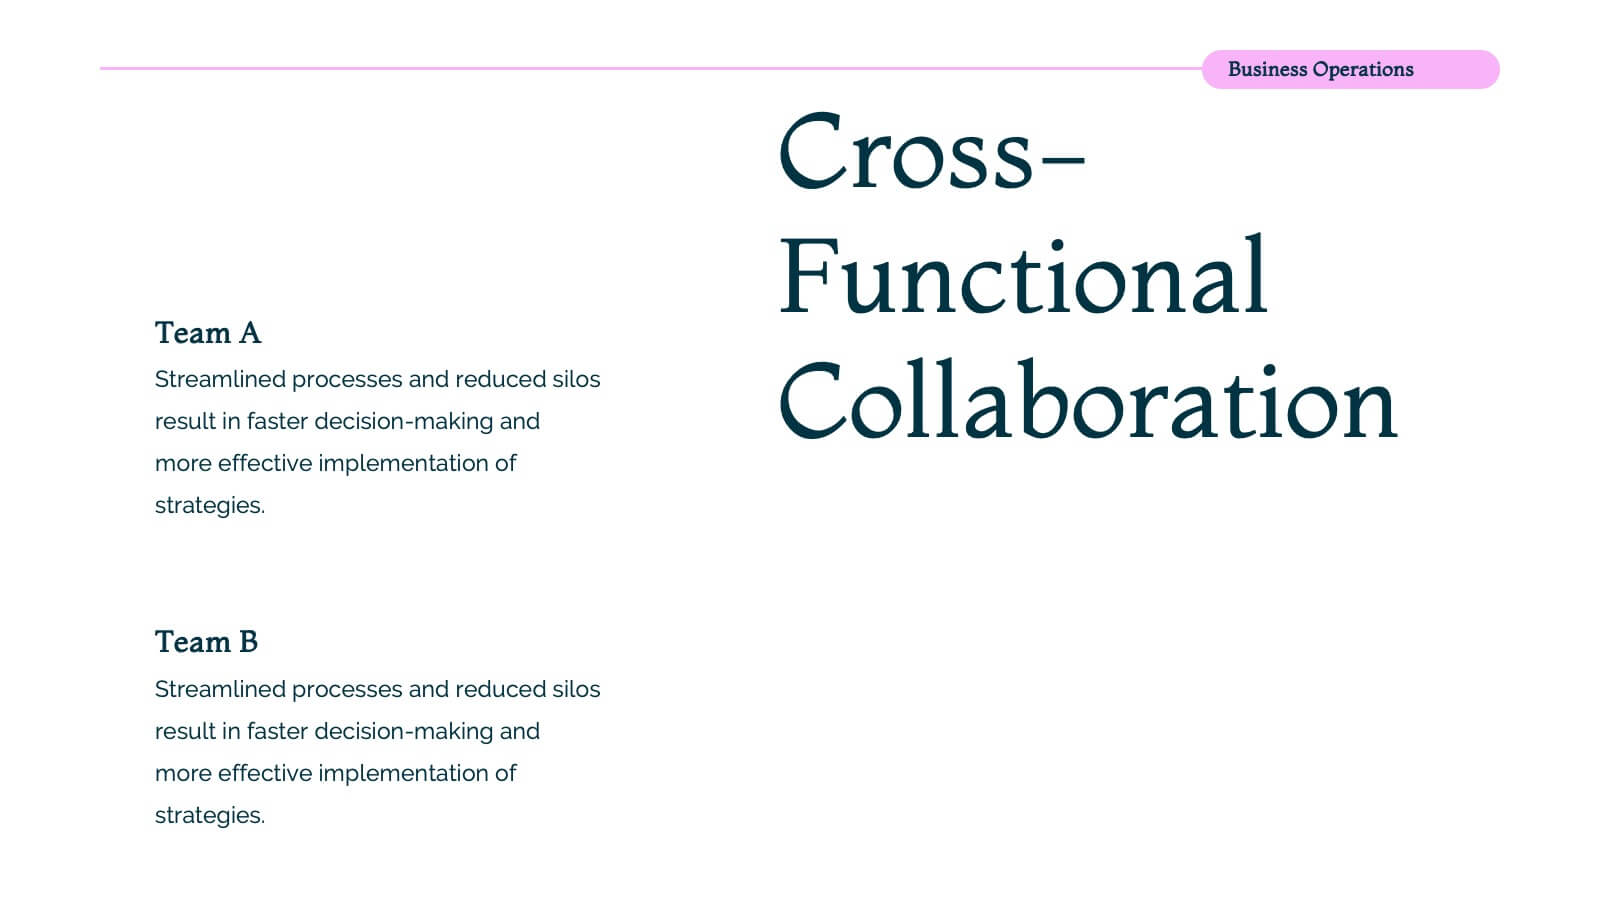
Nova Business Operations Plan Presentation
Create a polished business operations plan with this modern and organized template! It covers everything from team updates and project overviews to resource allocation and collaboration opportunities. Perfect for structuring departmental goals, process improvements, and employee recognition. Compatible with PowerPoint, Keynote, and Google Slides for a seamless, professional presentation.


5 diapositivas
Meeting Schedule and Agenda Layout Presentation
Plan, track, and communicate multi-day meetings with this Meeting Schedule and Agenda Layout presentation. Ideal for organizing conference sessions, workshops, or internal team agendas, this layout lets you present key topics by day and time. Clean, structured, and fully editable in Canva, PowerPoint, and Google Slides for easy customization.


6 diapositivas
Security Systems Infographic
Security systems refer to a combination of hardware and software designed to protect individuals, properties, and assets from various threats and unauthorized access. This infographic template provides an overview of different types of security systems and their components used to safeguard people, property, and data. The infographic aims to simplify complex information about security systems and present it in a visually engaging and easy-to-understand format. This template includes relevant statistics, trends, or case studies related to security breaches and the effectiveness of security systems.


7 diapositivas
Online Meeting Infographic
Online meetings, also known as virtual meetings or web meetings, are gatherings or discussions that take place over the internet, enabling participants to communicate, collaborate, and interact with each other remotely. This infographic template is a great way to streamline the process and enhance the efficiency of virtual meetings. This template aims to provide a comprehensive guide to conducting effective online meetings. Compatible with Powerpoint, Keynote, and Google Slides. Customize the content and design to suit your specific needs and ensure your online meetings are efficient, engaging, and productive.


26 diapositivas
Corporate Social Responsibility (CSR) Presentation
Reinforce your commitment to positive impact with our Corporate Social Responsibility (CSR) presentation template, compatible with PowerPoint, Keynote, and Google Slides. This template is expertly crafted for businesses and organizations looking to present their CSR initiatives, environmental efforts, and community engagements. It features a professional yet inviting design with green accents to symbolize the commitment to sustainability. The template offers a variety of slide types to cover all aspects of your CSR strategy. Use 'process infographics' to outline your sustainable practices, 'mind map infographics' to explore the impact of your activities, and 'chart slides' to present your social and environmental achievements quantitatively. Our CSR template is not just for presentations; it's a statement of your organization's values and dedication to making a difference. Download it now to communicate your CSR goals and actions with clarity and inspire your stakeholders to join you in driving change for a better world.


7 diapositivas
Customer Journey Analytics Infographic
Our Customer Journey Analytics infographic is a strategic asset for Powerpoint, Keynote, and Google Slides, crafted to assist marketers, UX designers, and customer experience strategists. This infographic is designed to depict the stages a customer goes through, from initial contact to final purchase, providing valuable insights into consumer behavior. The Customer Journey Analytics infographic captures the essence of the customer's experience with vibrant visuals that map out each touchpoint. It's an efficient way to communicate complex analytics data, ensuring your audience can visualize and understand customer interactions and preferences. This tool is perfect for presenting detailed analyses, highlighting areas for improvement, and showcasing how different stages of the journey are interconnected. By incorporating this infographic into your presentations, you can effectively narrate the story of your customer's path, backed by data-driven insights. It's an excellent way to illustrate the impact of various customer journey touchpoints on overall satisfaction and loyalty. Utilize this infographic to foster a customer-centric approach in your business strategies and to guide enhancements in the customer experience.


3 diapositivas
Persona Mapping for Target Audience Presentation
Get clear on who you're speaking to with this visual persona mapping slide. Ideal for marketing plans, customer research, or segmentation strategies, this layout helps you define and compare target audience types with clean icons and text space. Fully editable and works with PowerPoint, Keynote, and Google Slides.


8 diapositivas
AI Trends and Future Technology Presentation
Step into the future with this sleek, modern template designed to visualize cutting-edge concepts in artificial intelligence. Featuring futuristic robot graphics and a clean circular flow layout, this design is perfect for showcasing tech trends, automation strategies, or AI-driven innovations. Each section is color-coded and icon-supported for easy customization. Ideal for tech startups, AI researchers, and innovation consultants. Fully editable in PowerPoint, Keynote, and Google Slides.


12 diapositivas
Real Estate House Market Trends Presentation
Analyze Real Estate House Market Trends with this insightful presentation template. Featuring a house-shaped hexagonal layout, this design helps illustrate key factors such as market demand, property values, investment opportunities, and housing policies. Ideal for real estate professionals, investors, and analysts looking to present market insights with clarity and impact. Fully customizable and compatible with PowerPoint, Keynote, and Google Slides.


6 diapositivas
Puzzle Project Infographic
A puzzle infographic is a visual representation that combines the elements of a puzzle with informational content. This infographic template uses puzzle pieces or puzzle-related design elements to convey different sections or components of information. Each puzzle piece represents a specific section or element of the information being presented. The puzzle pieces act as sequential elements, guiding your viewer through the information in a logical and engaging manner. This infographic is visually appealing and use colors, illustrations, icons, and other design elements to enhance the overall presentation.


26 diapositivas
Flyx Presentation Template
Flyx is a perfect modern template for you that is very easy to use. This template has a simple, clean, and basic design with high quality illustrations. It can be used for small businesses to large corporate companies and personal use as well. The design is minimal with white and different colors giving it a fresh look. Flyx is easy to edit and is perfect for branding presentations, you can change the colors with just one simple click. Pictures and charts are also made for easy editing as well as easy readability without too much confusion on reading. This template is easy to use and high quality making it suitable for all types of businesses. It is easy to create this modern and bold presentation that will deliver your message with an impact.


5 diapositivas
5-Level Smile Rating Presentation
Give your audience a fun, visual way to understand sentiment with this colorful rating slide. Perfect for feedback summaries, project reviews, or performance insights, it displays five clear emotion levels in a simple, engaging format. Easy to customize and fully compatible with PowerPoint, Keynote, and Google Slides.


6 diapositivas
South America Biome Map Infographics
Explore our adaptable South America Biome Map infographic template, a powerful resource for visualizing the diverse ecosystems found across the South American continent. This template is fully compatible with popular presentation software such as PowerPoint, Keynote, and Google Slides, enabling you to easily customize it to suit your specific needs. The South America Biome Map infographic template serves as a flexible canvas for illustrating information about various biomes, including rainforests, grasslands, deserts, and more. Whether you're an educator, environmental enthusiast, or simply intrigued by South America's ecology, this template offers an intuitive platform to create informative presentations and educational materials. Impress your audience with this SEO-optimized South America Biome Map infographic template, expertly designed for clarity and user-friendliness. Customize it to showcase the unique features and biodiversity of South America's biomes, making it an invaluable tool for your projects and presentations. Get started on crafting your personalized infographic today!


7 diapositivas
Data Governance Infographic
Navigate the world of data management with our governance infographic. Painted in a thoughtful blend of orange, white, and blue, this template simplifies the multifaceted realm of data governance for its viewers. Perfectly tailored for IT professionals, data analysts, business strategists, and educators, it breaks down the key components of data governance in a visually compelling manner. Enriched with custom graphics, icons, and dedicated image placeholders, this tool can transform any presentation into a memorable one. And with compatibility spanning PowerPoint, Keynote, and Google Slides, it’s designed for universal appeal.


6 diapositivas
Stakeholder Analysis Chart Infographic
Stakeholder analysis is a process used by organizations to identify and assess the interests, concerns, expectations, and potential impact of various individuals, groups, or entities that have a stake in a particular project, decision, or initiative. The goal of this infographic is to better understand the perspectives and needs of different stakeholders and to use this information to inform decision-making and project planning. This template summarizes the importance of stakeholder analysis in project management or organizational decision-making. This compatible with Powerpoint, Keynote, and Google Slides.


7 diapositivas
Digital Marketing Strategies Infographic
The Digital Marketing Strategies Infographic provides a colorful and organized presentation of key performance indicators and metrics essential for evaluating the success of digital marketing campaigns. It covers various platforms and strategies, illustrating comparative engagement rates, follower counts, and other relevant data points. This infographic is an excellent resource for marketers looking to convey their campaign results in a clear, concise manner. It is suitable for use in PowerPoint, Google Slides, and Keynote presentations, ideal for illustrating progress, setting benchmarks, and sharing insights with team members, stakeholders, or clients.