


Características


¿Tienes alguna pregunta?
Recomendar


6 diapositivas
Risk Evaluation and Mitigation Plan Presentation
Take control of uncertainty with a clean, visual layout that helps you assess potential challenges and map out clear solutions. Ideal for project planning, operations, or corporate risk management, this presentation simplifies complex data into actionable insights. Compatible with PowerPoint, Keynote, and Google Slides for easy customization.


5 diapositivas
Visual Mind Connections Bubble Chart Presentation
Visualize interconnected concepts with clarity using the Visual Mind Connections Bubble Chart Presentation. This engaging layout centers around a core idea, surrounded by supporting points in a clean, circular flow. Ideal for mapping strategies, team roles, or processes. Fully editable in PowerPoint, Keynote, or Google Slides—perfect for business, education, or coaching.


5 diapositivas
Business Growth and Expansion
Visually communicate each stage of business development with this Business Growth and Expansion diagram. Featuring a dynamic circular flow, this editable slide is perfect for showcasing progress, scaling strategies, or roadmap milestones. Fully compatible with PowerPoint, Keynote, and Google Slides—ideal for business plans and strategic presentations.


26 diapositivas
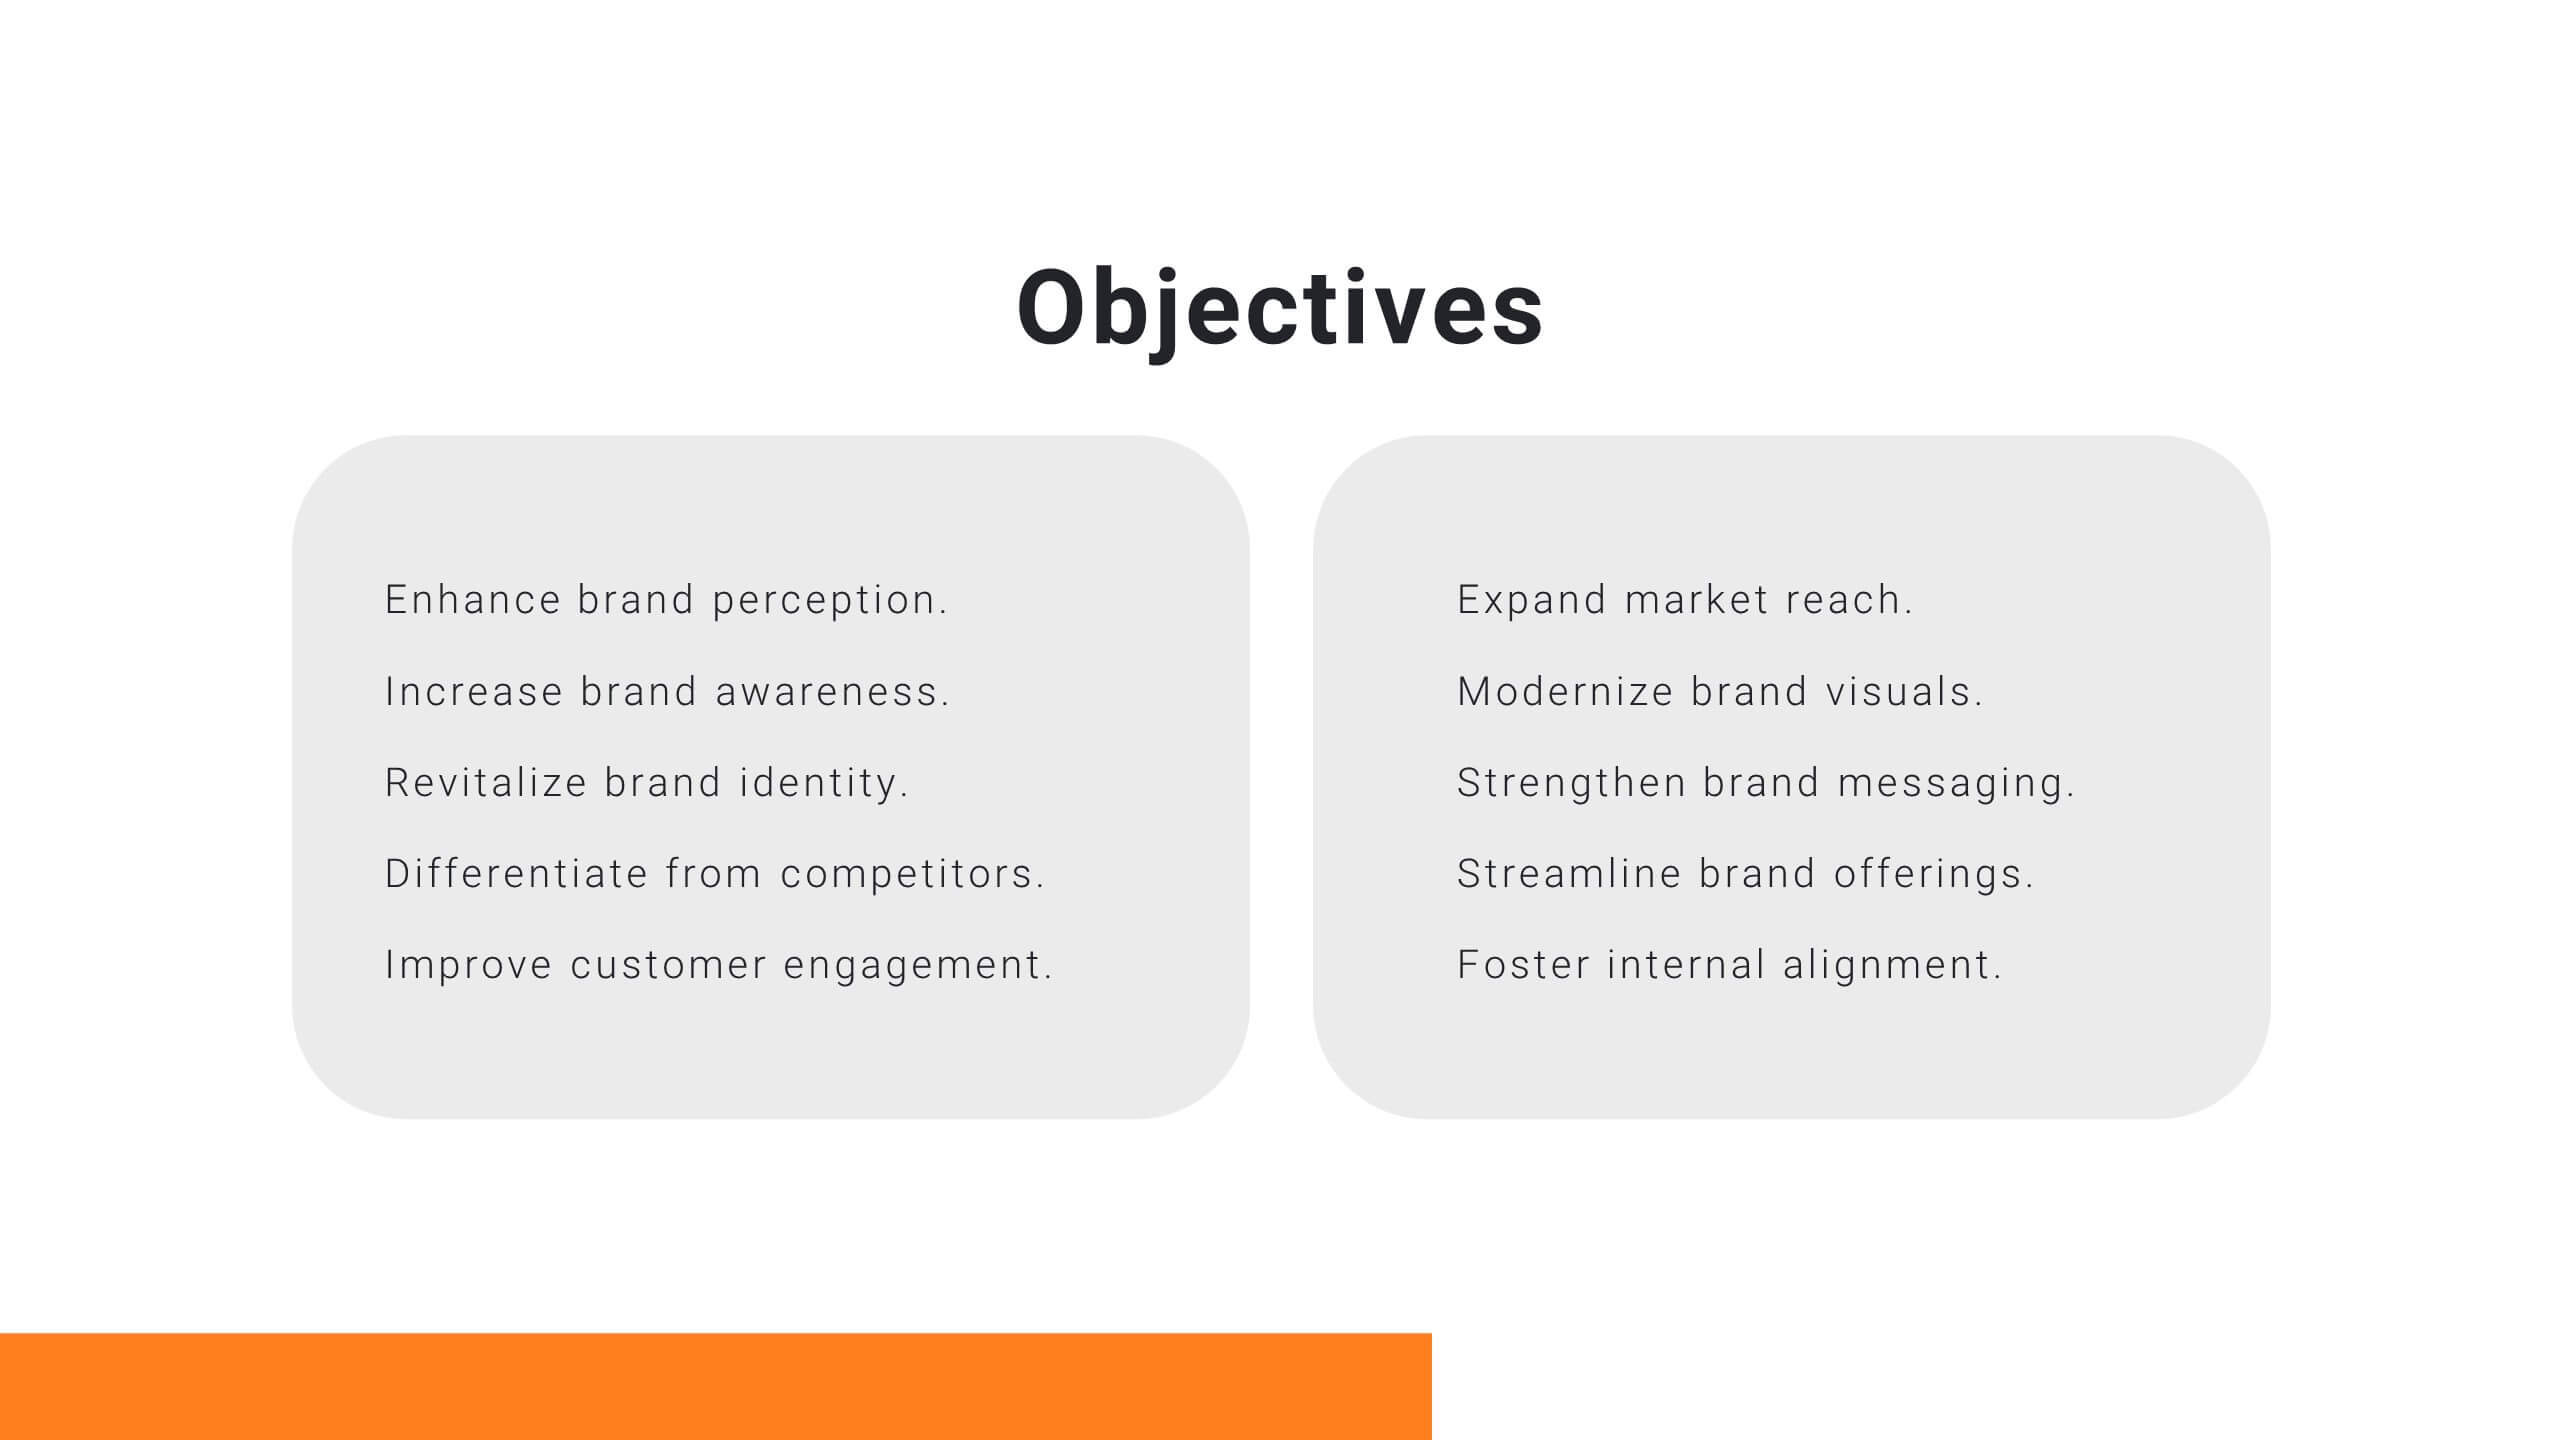
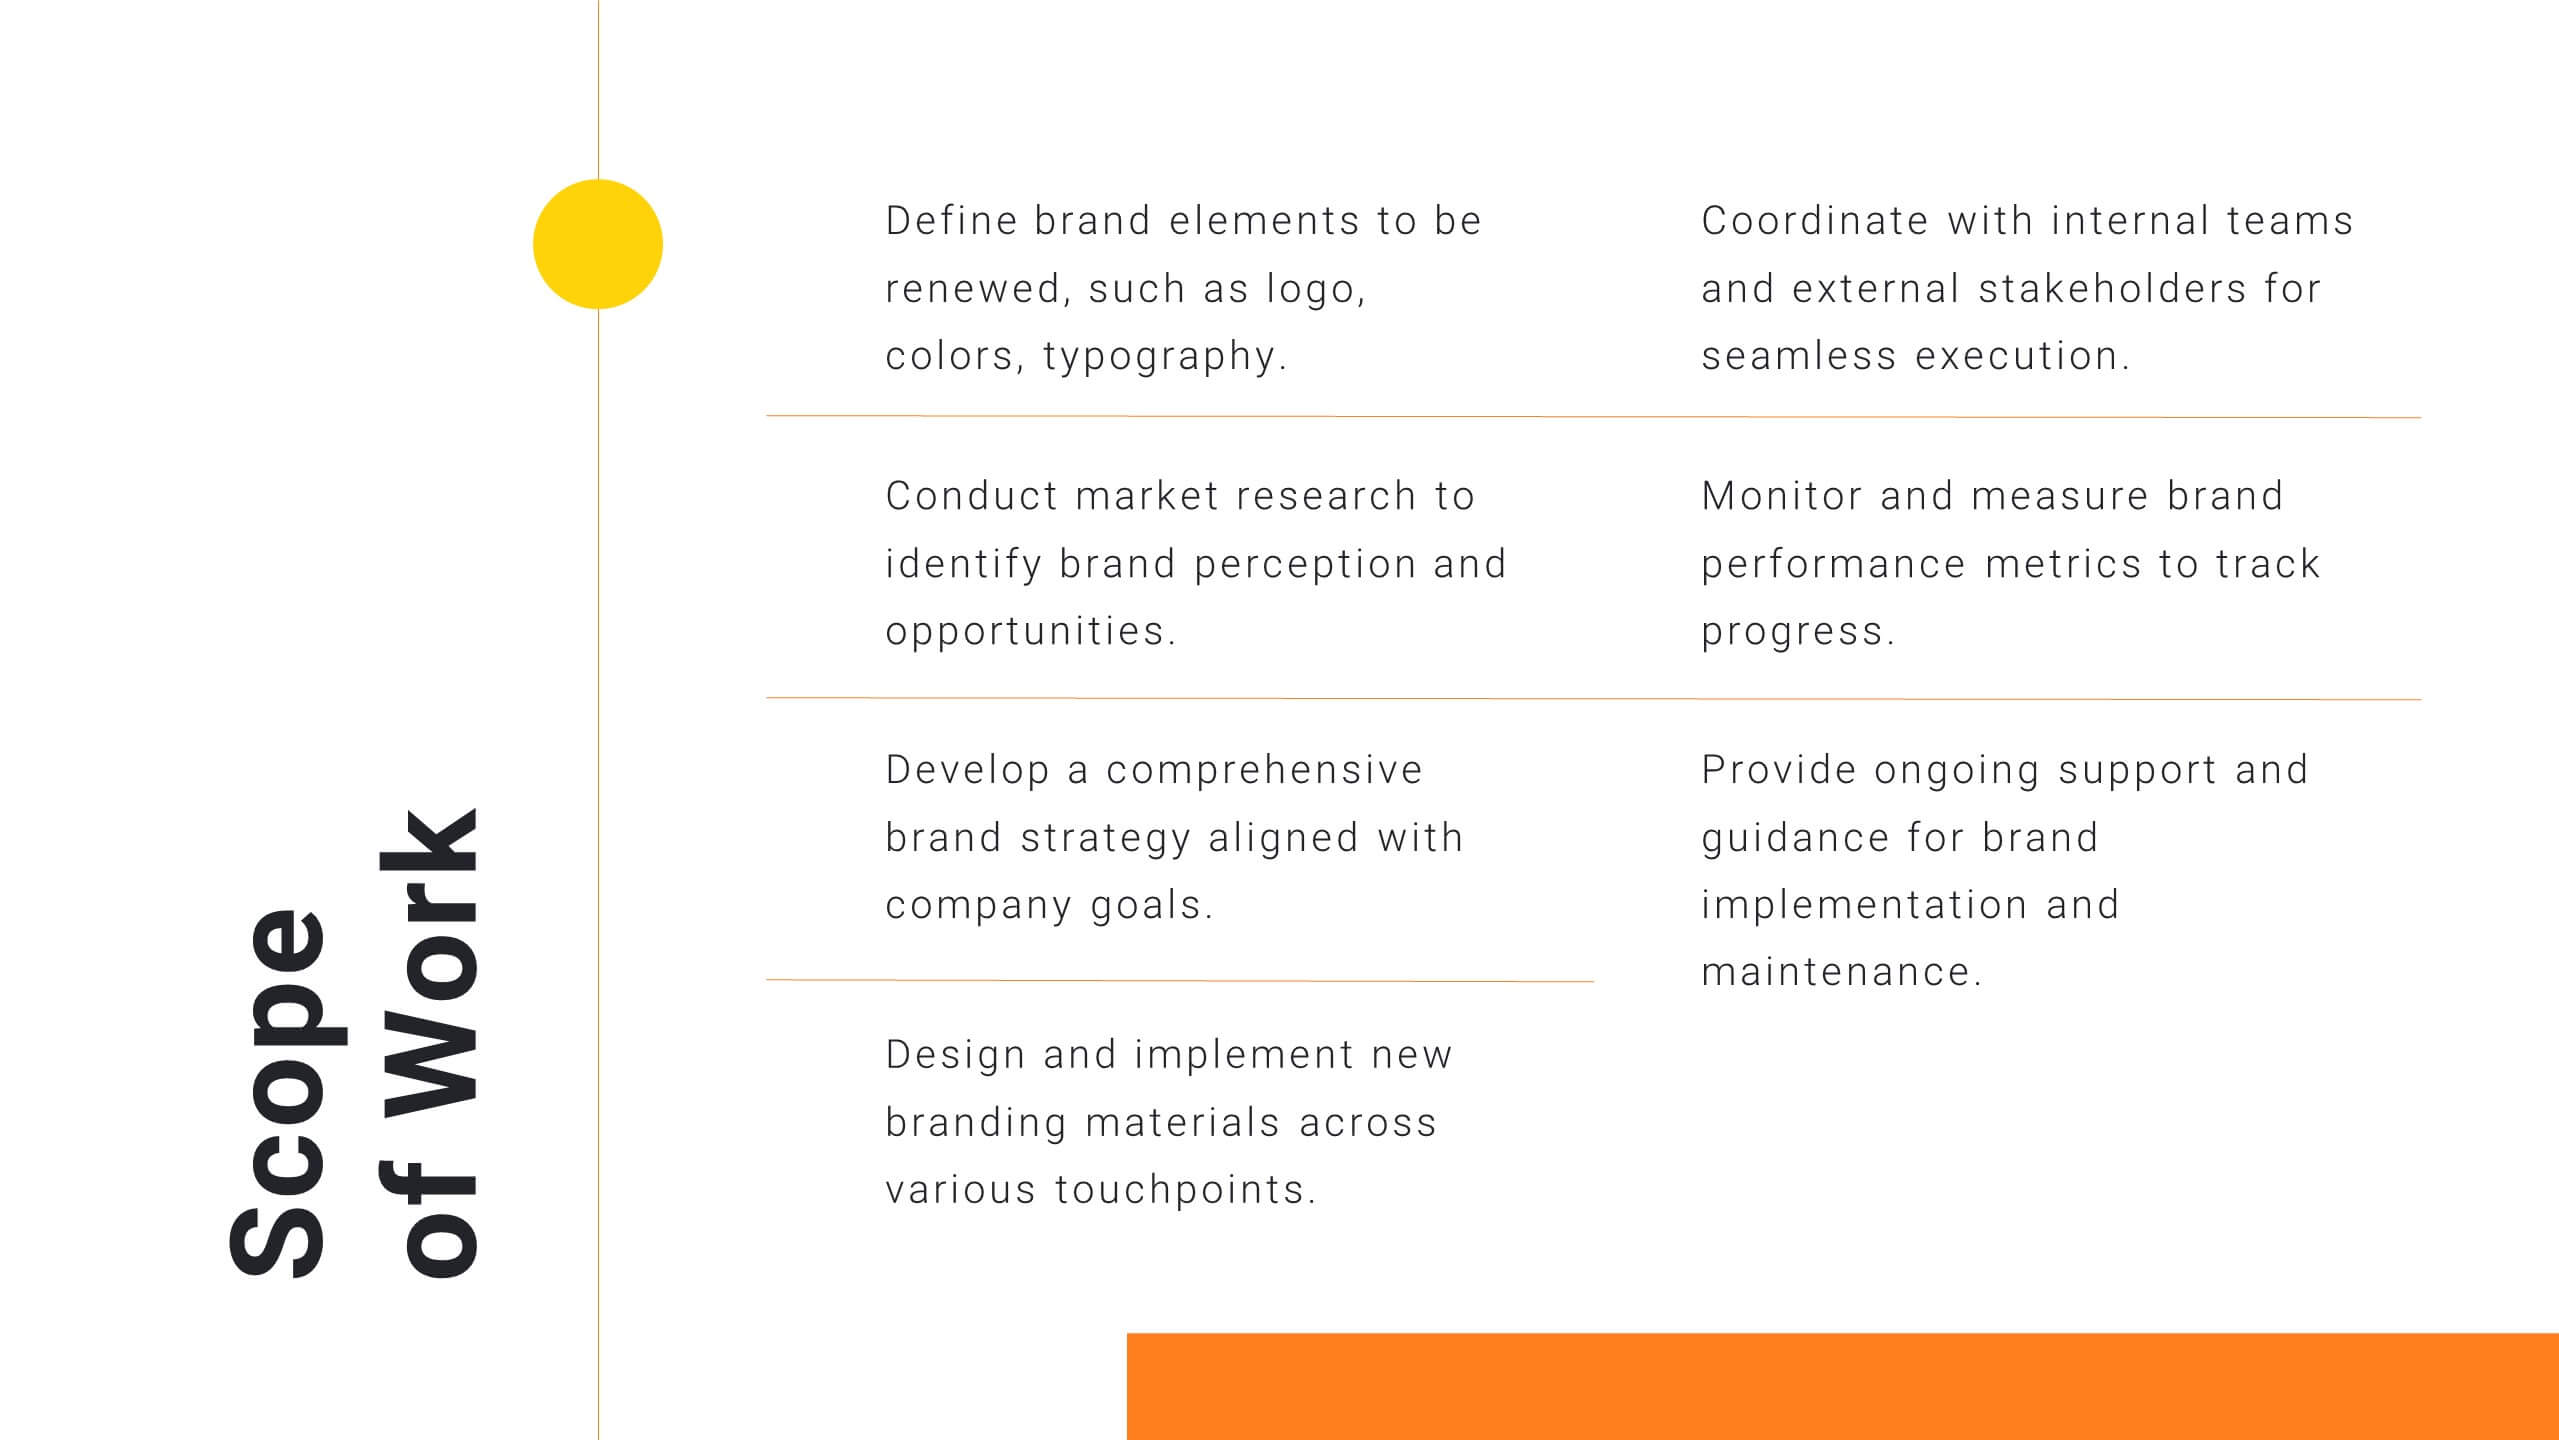
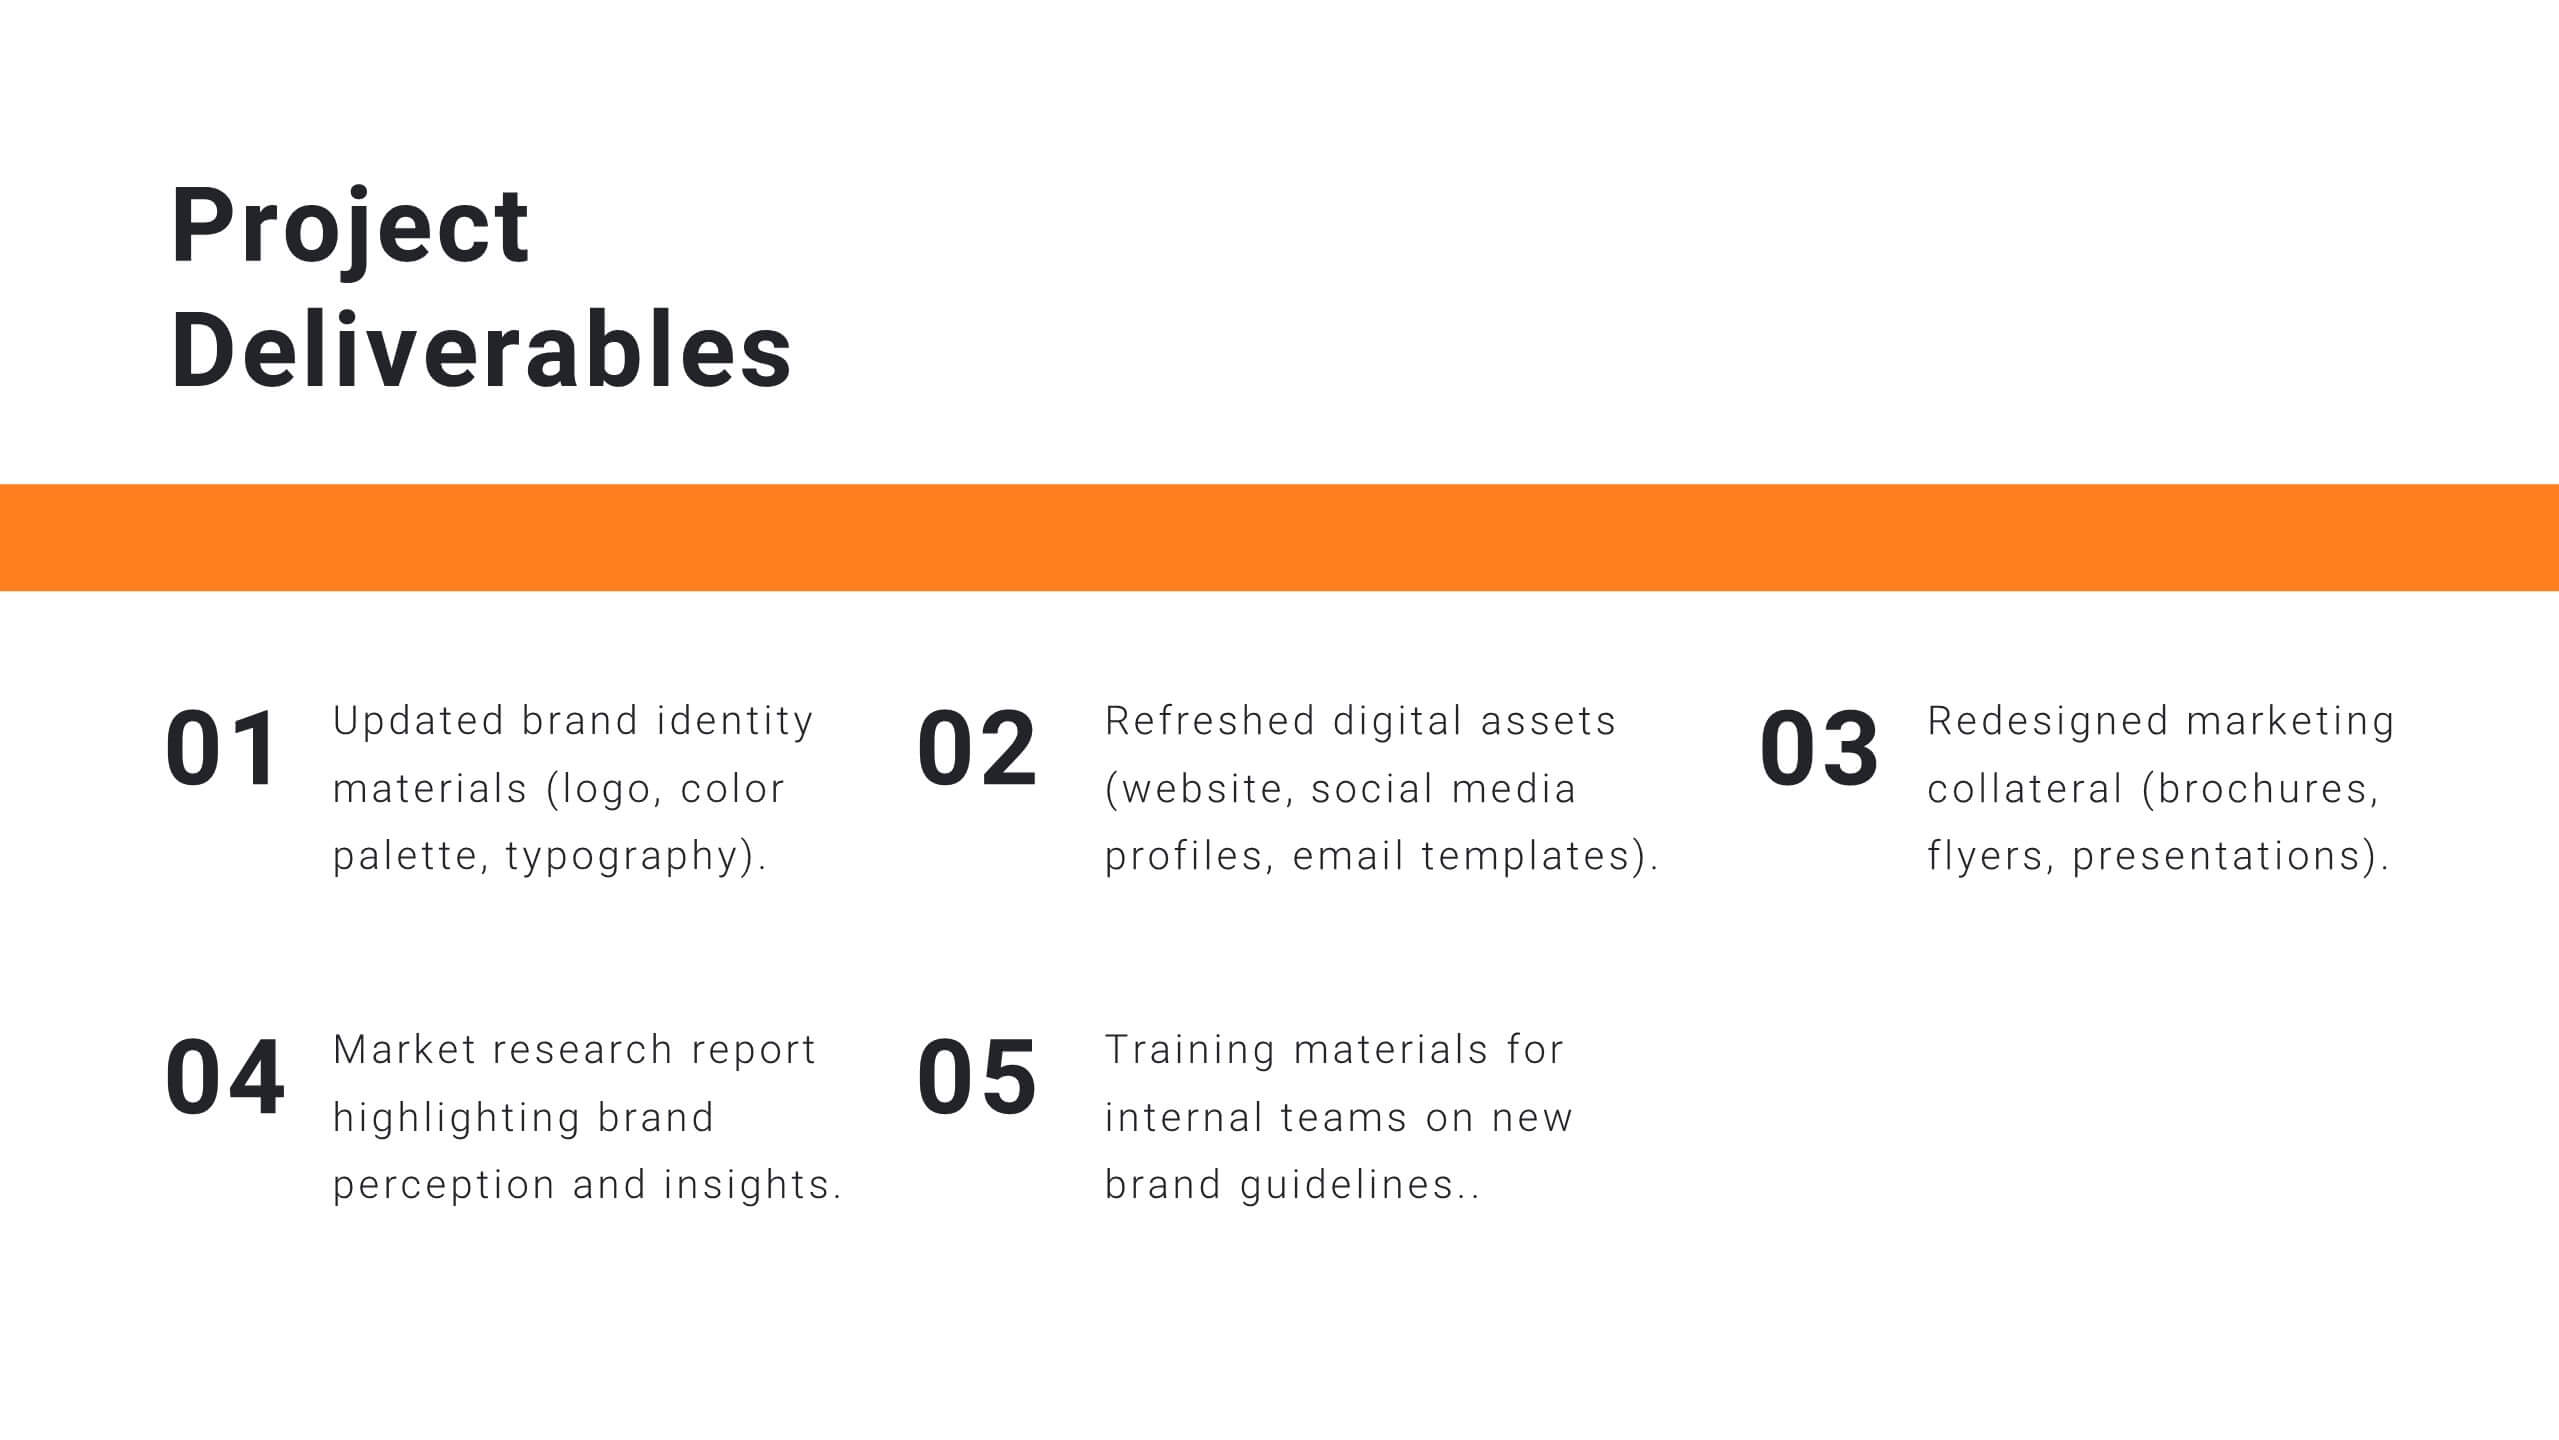
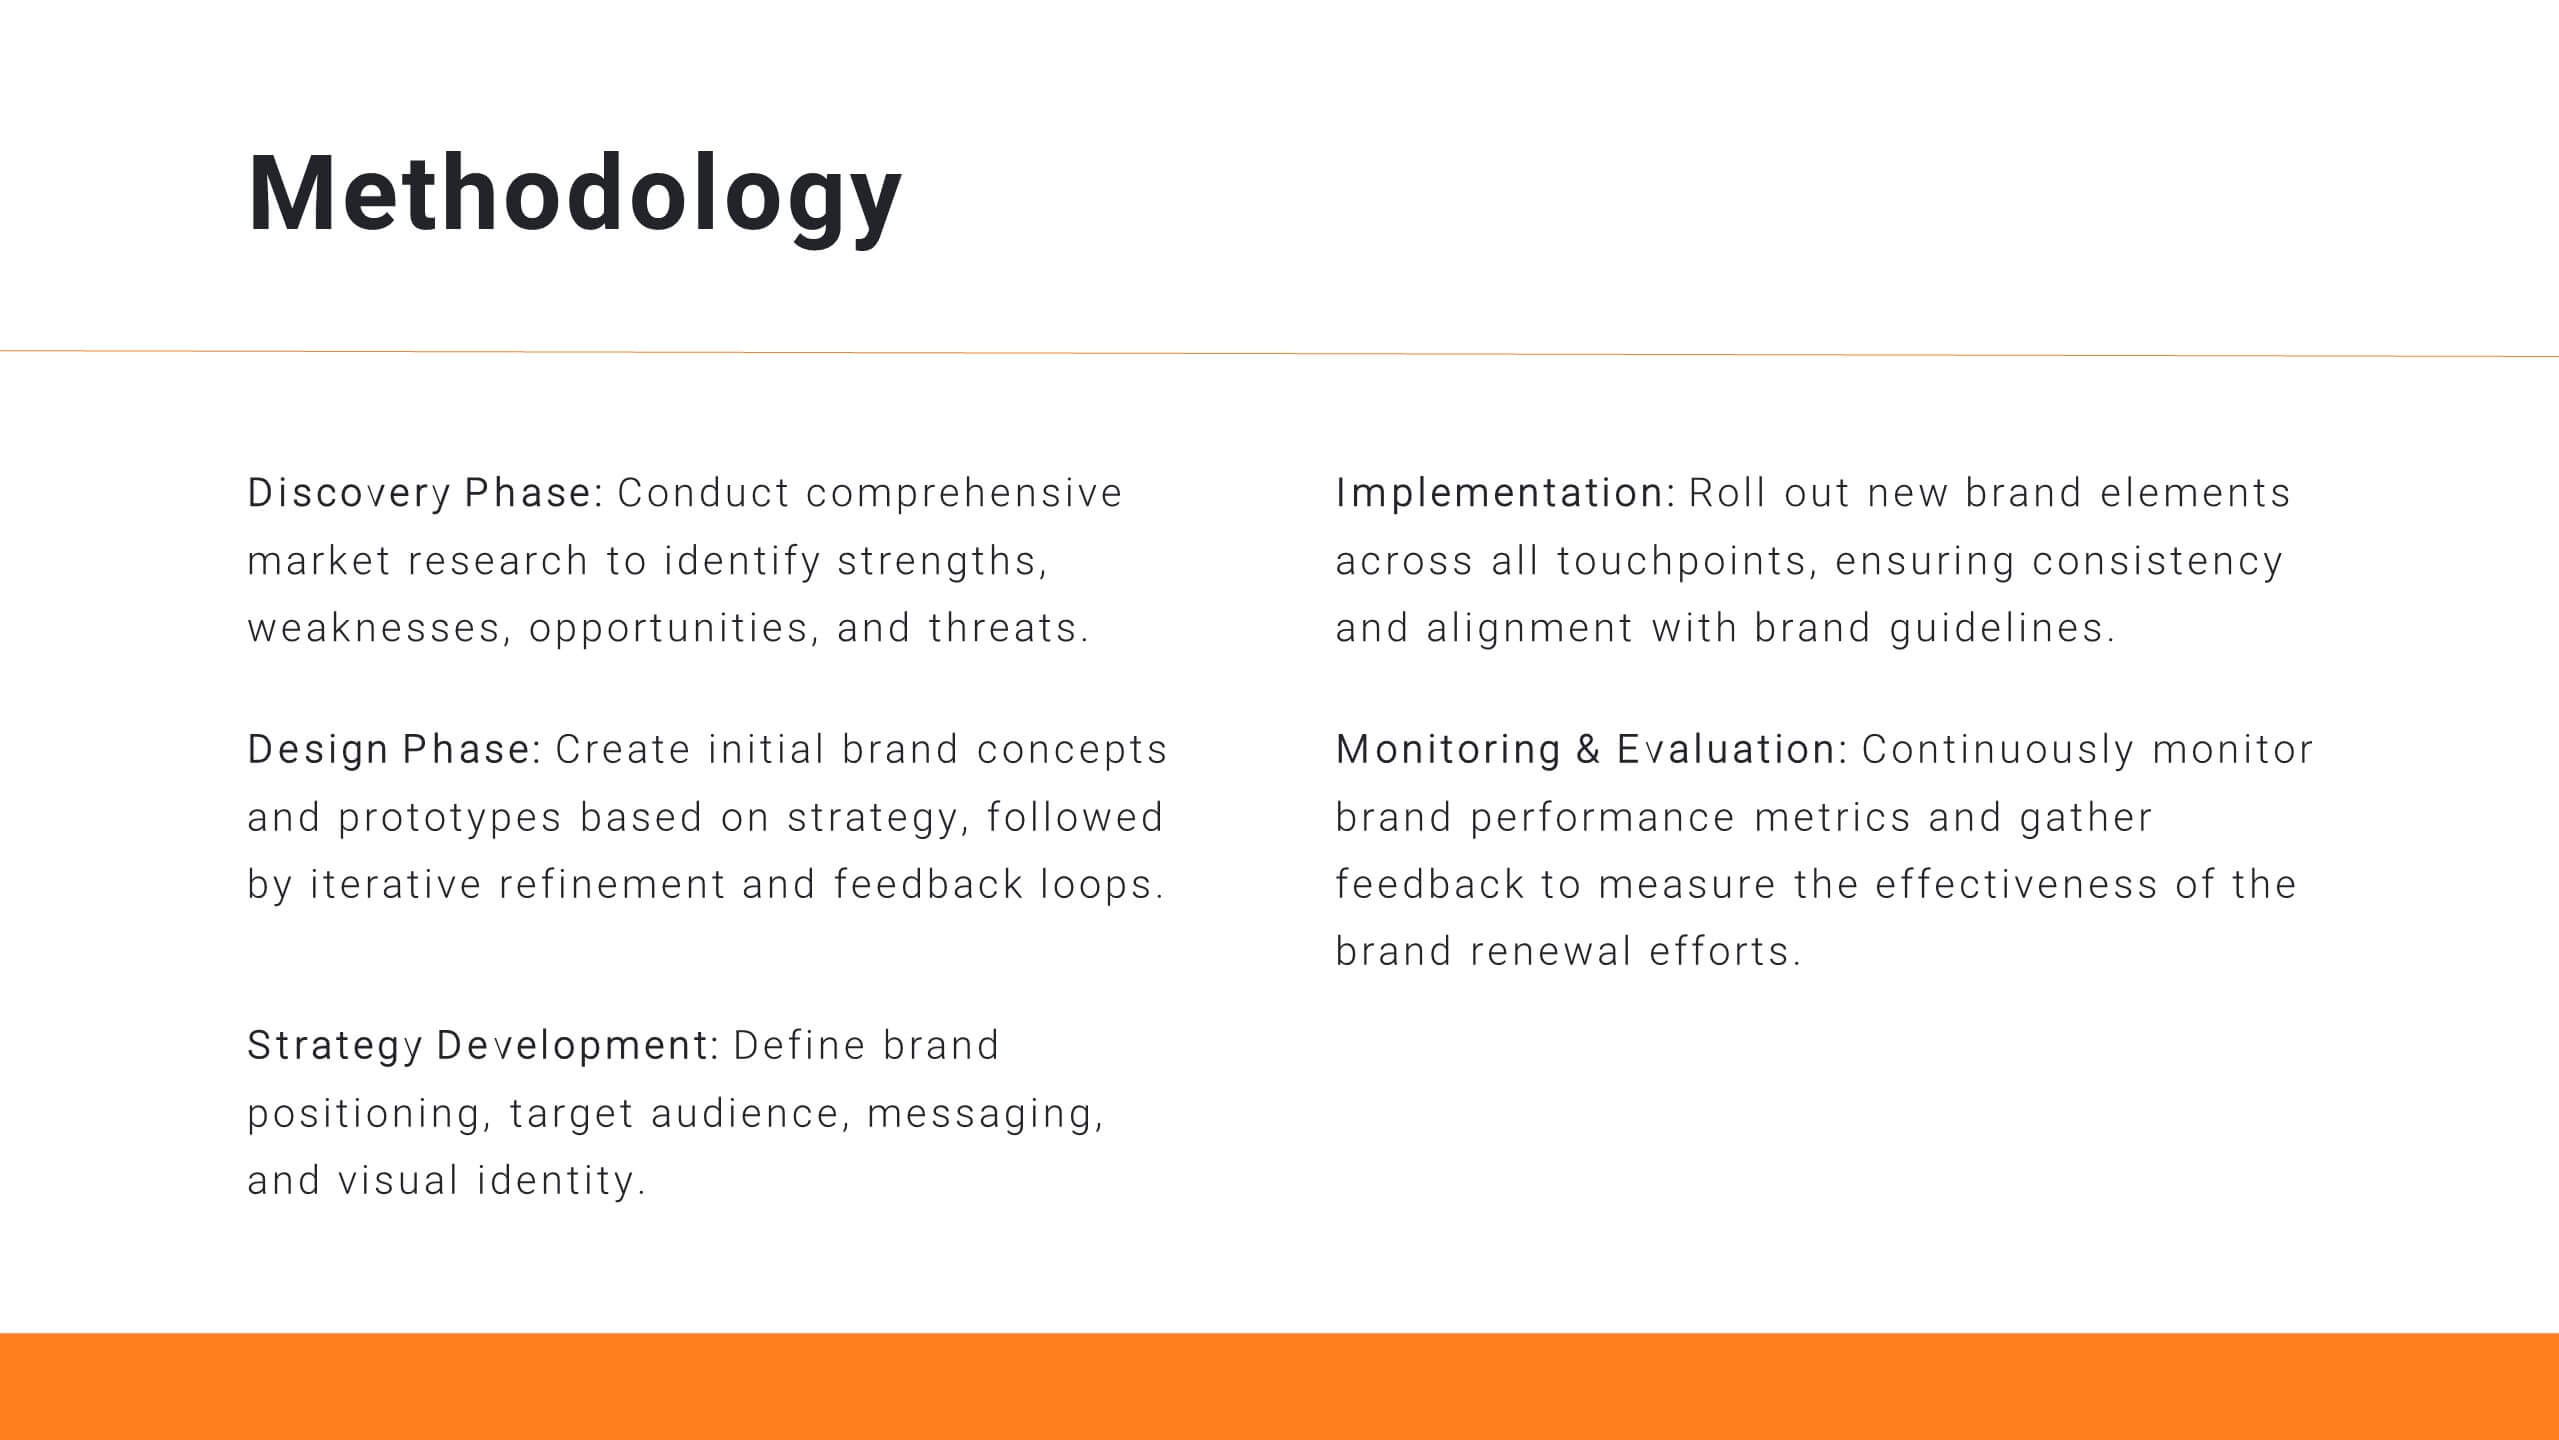
Tempo Brand Identity Presentation
Introduce and elevate your brand with this versatile presentation template designed to reflect your company's vision and values. Perfect for businesses looking to showcase their brand strategy, components, and touchpoints with clarity and professionalism. This presentation features thoughtfully designed slides covering brand identity components, visual guidelines, target audience insights, and future development plans. Use dedicated sections to outline your unique selling proposition, positioning, and strategy. With its clean layout and attention to detail, it's ideal for presenting a cohesive and impactful brand narrative. Compatible with PowerPoint, Google Slides, and Keynote, this template is fully customizable. Edit colors, text, and images to align with your brand aesthetics and messaging. Deliver your presentation with confidence, ensuring your audience is inspired by a polished and professional brand identity.


6 diapositivas
United States Energy Map Infographics
The "United States Energy Map" infographic template, suitable for PowerPoint, Keynote, and Google Slides, is an essential tool for visualizing the nation's energy landscape. Perfect for energy analysts, educators, and policymakers, this template vividly displays the distribution of various energy sources across the U.S., including renewable installations, fossil fuel production, and power plants. Key statistics and trends in energy consumption, production, and sustainability are highlighted, providing a comprehensive overview of America's energy profile. The color scheme effectively differentiates energy types and regions, making the presentation both visually appealing and informative. Ideal for energy sector presentations, educational lectures, or policy discussions, this template ensures the "United States Energy Map" is communicated clearly and engagingly, offering a snapshot of the country's diverse energy dynamics.


21 diapositivas
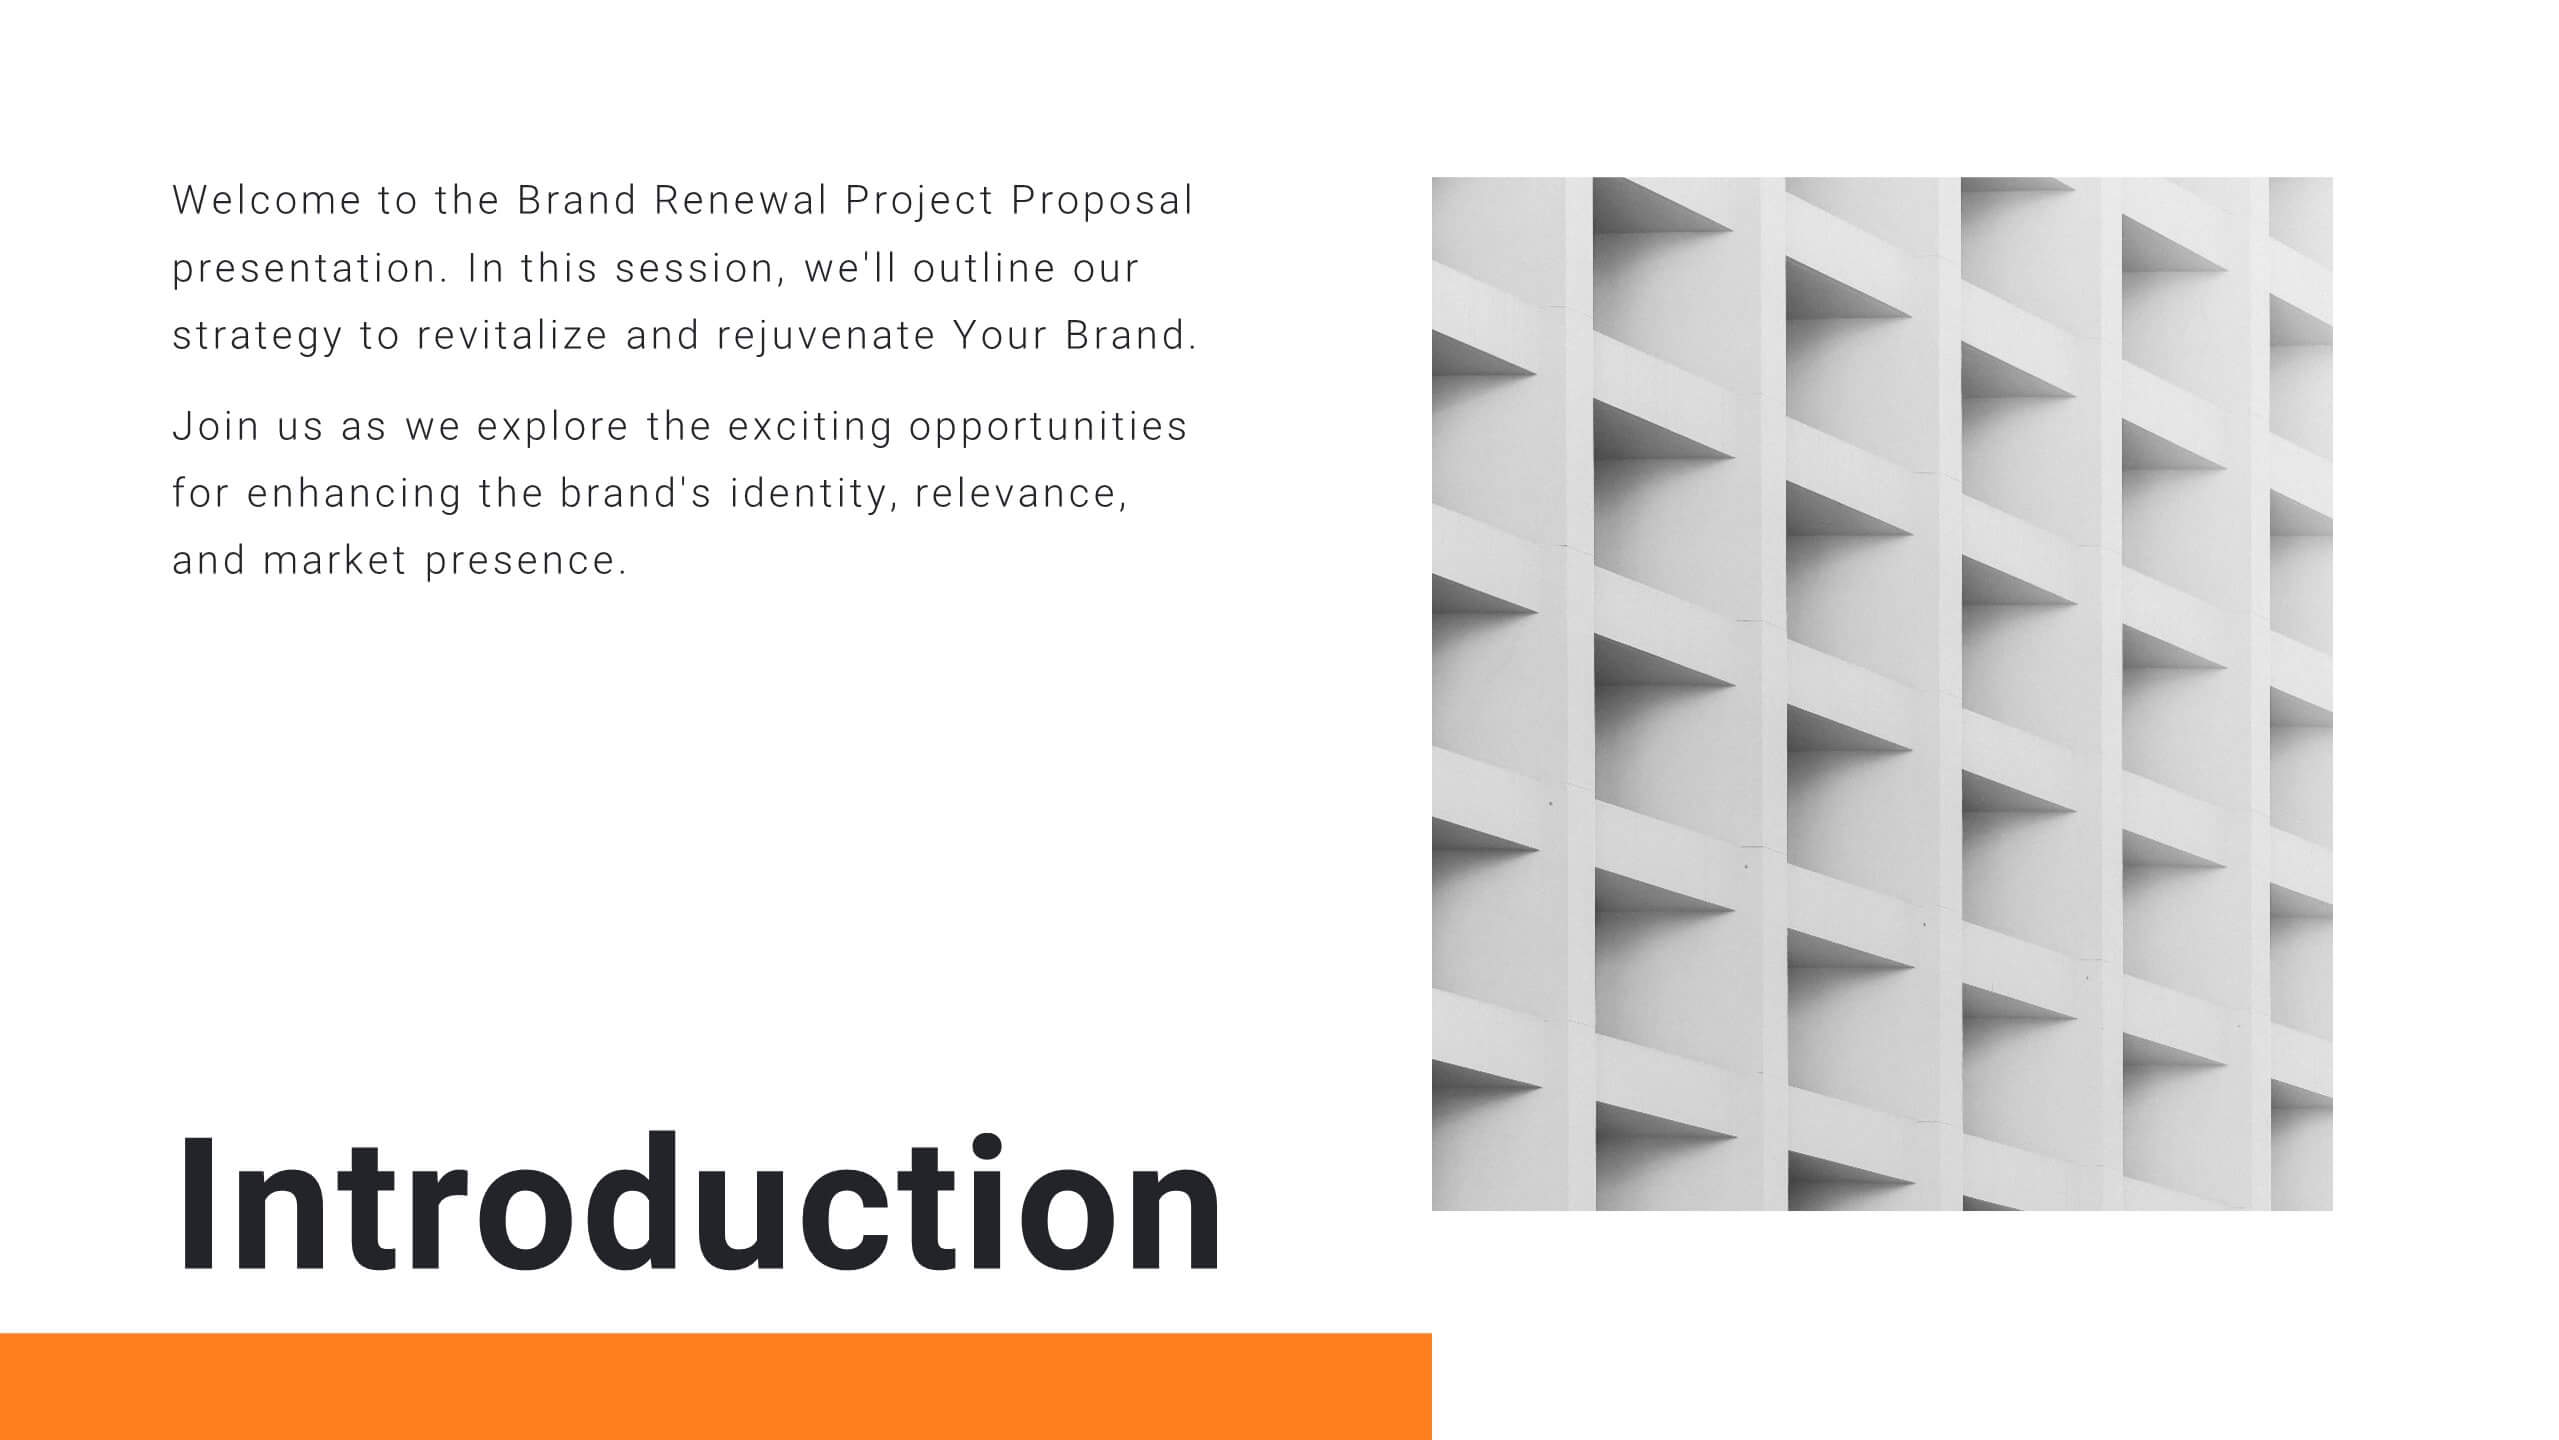
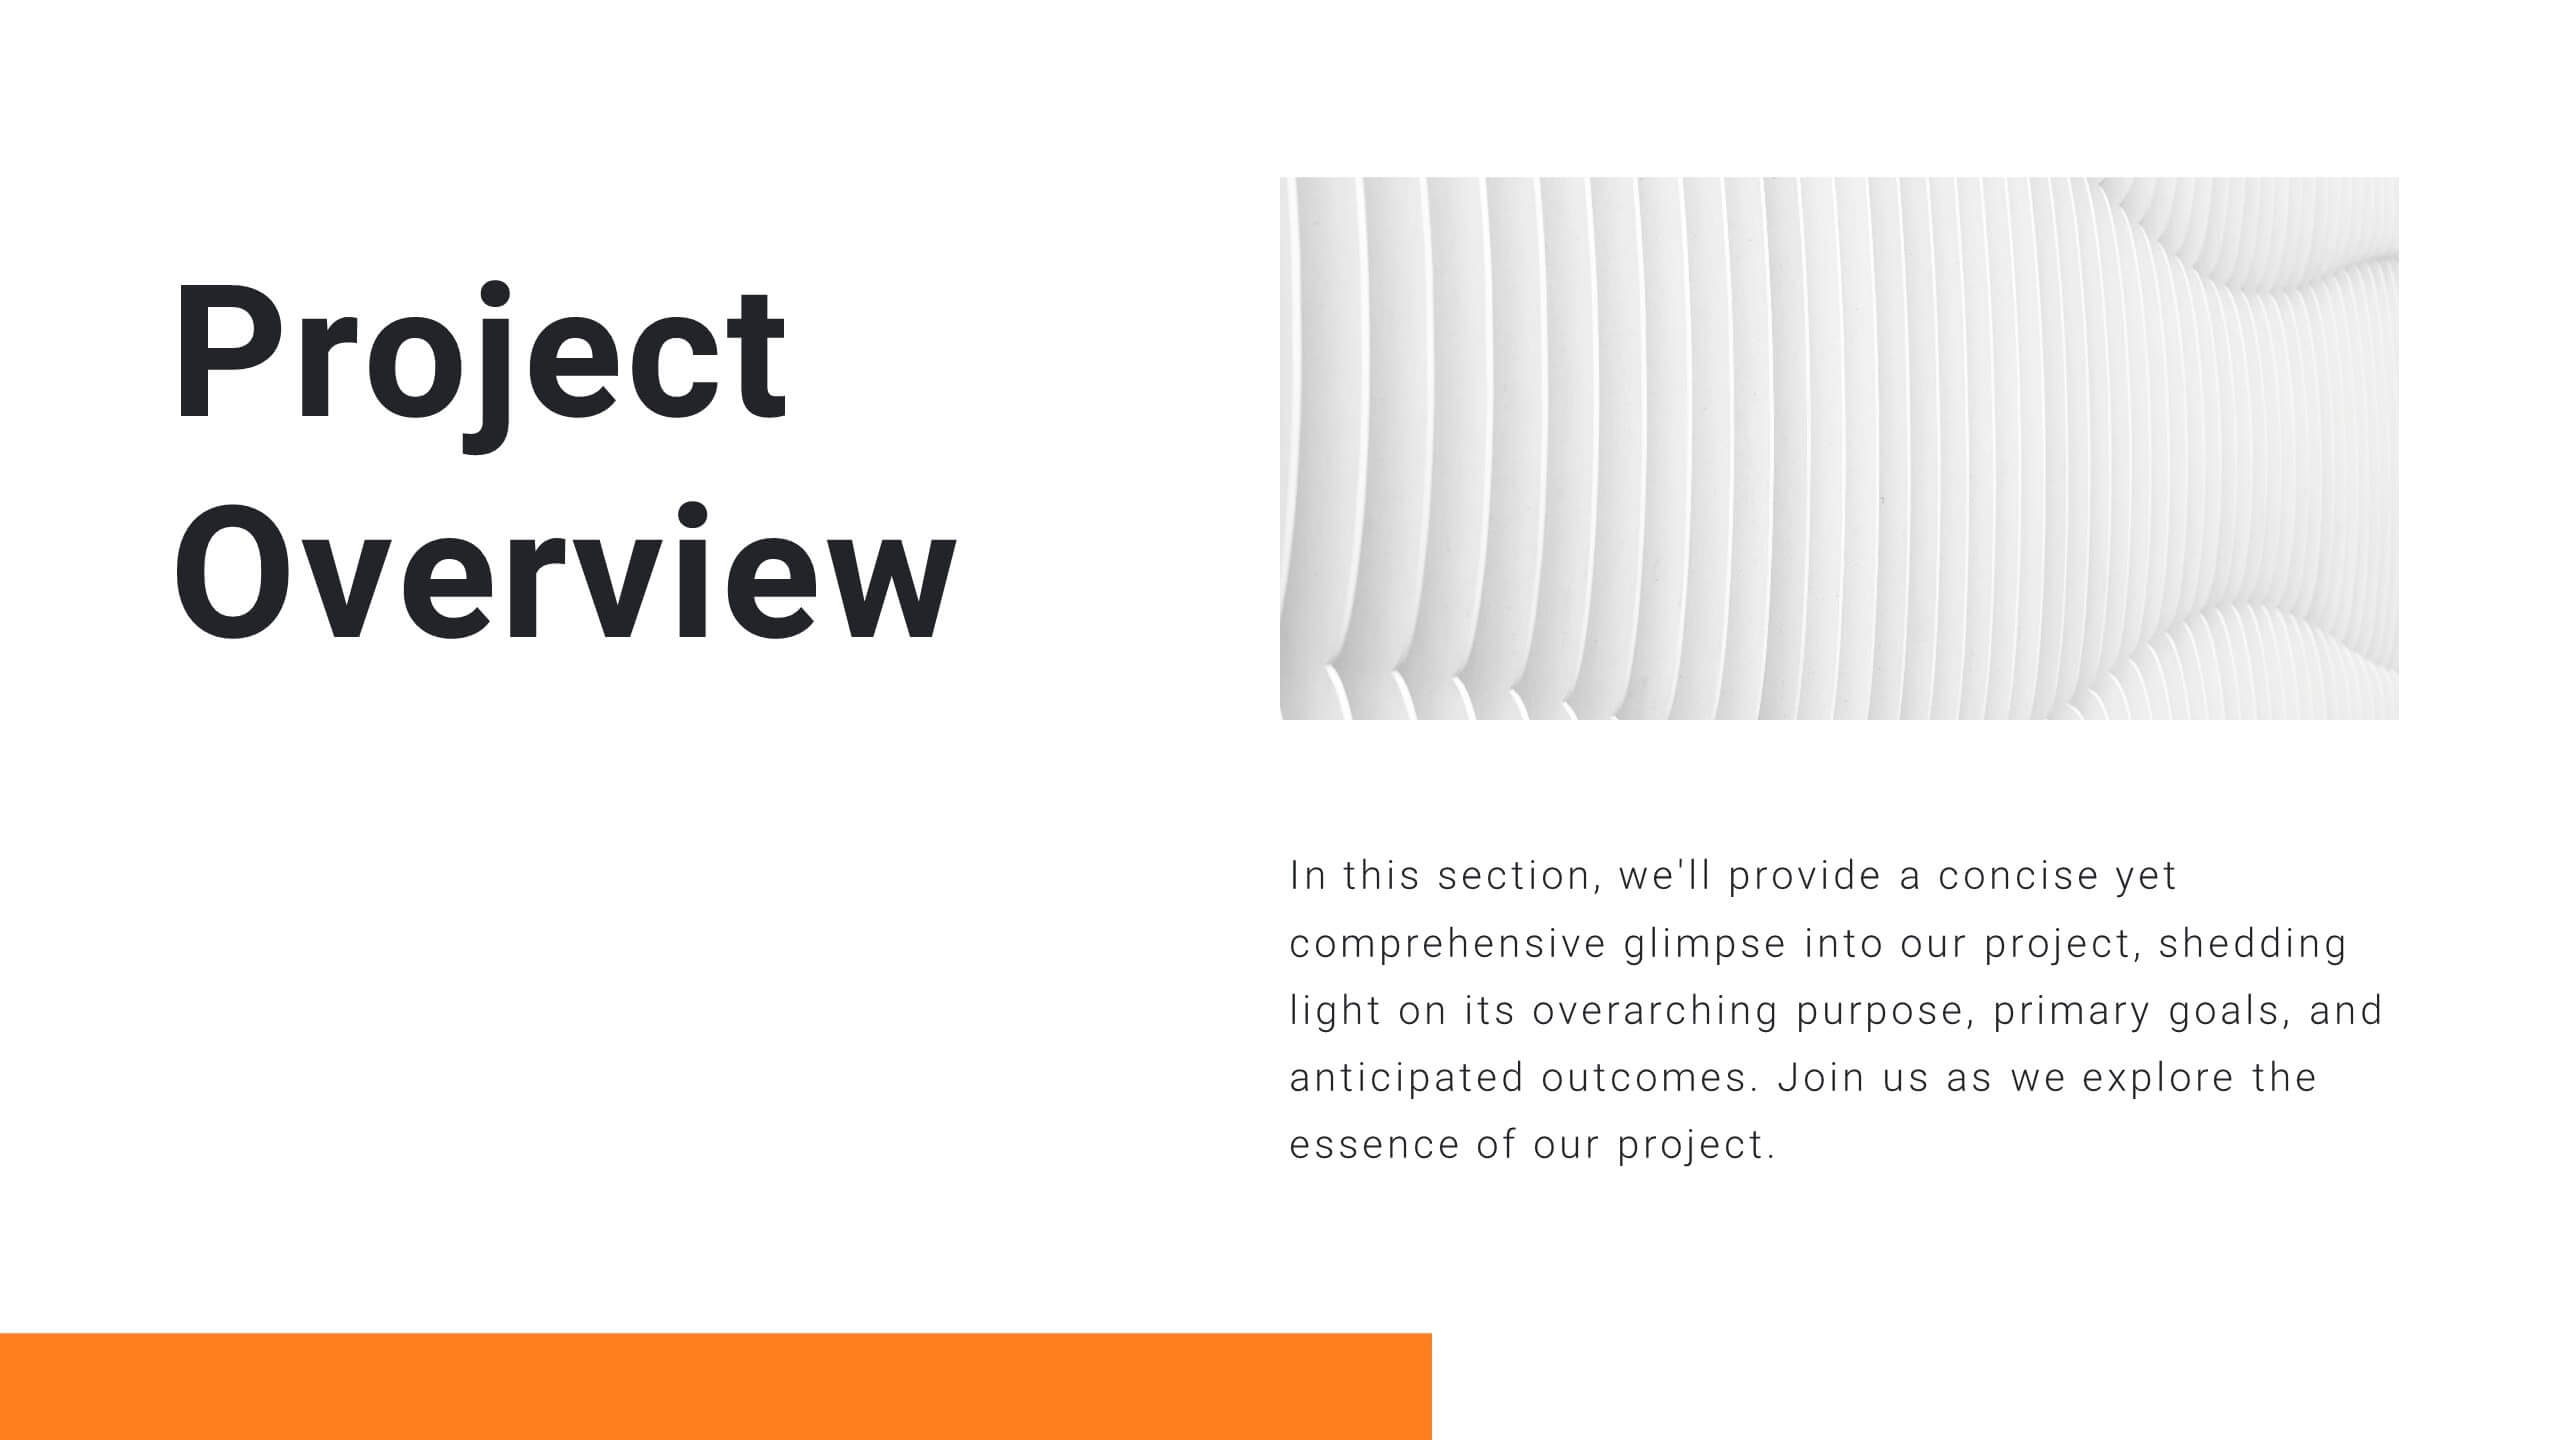
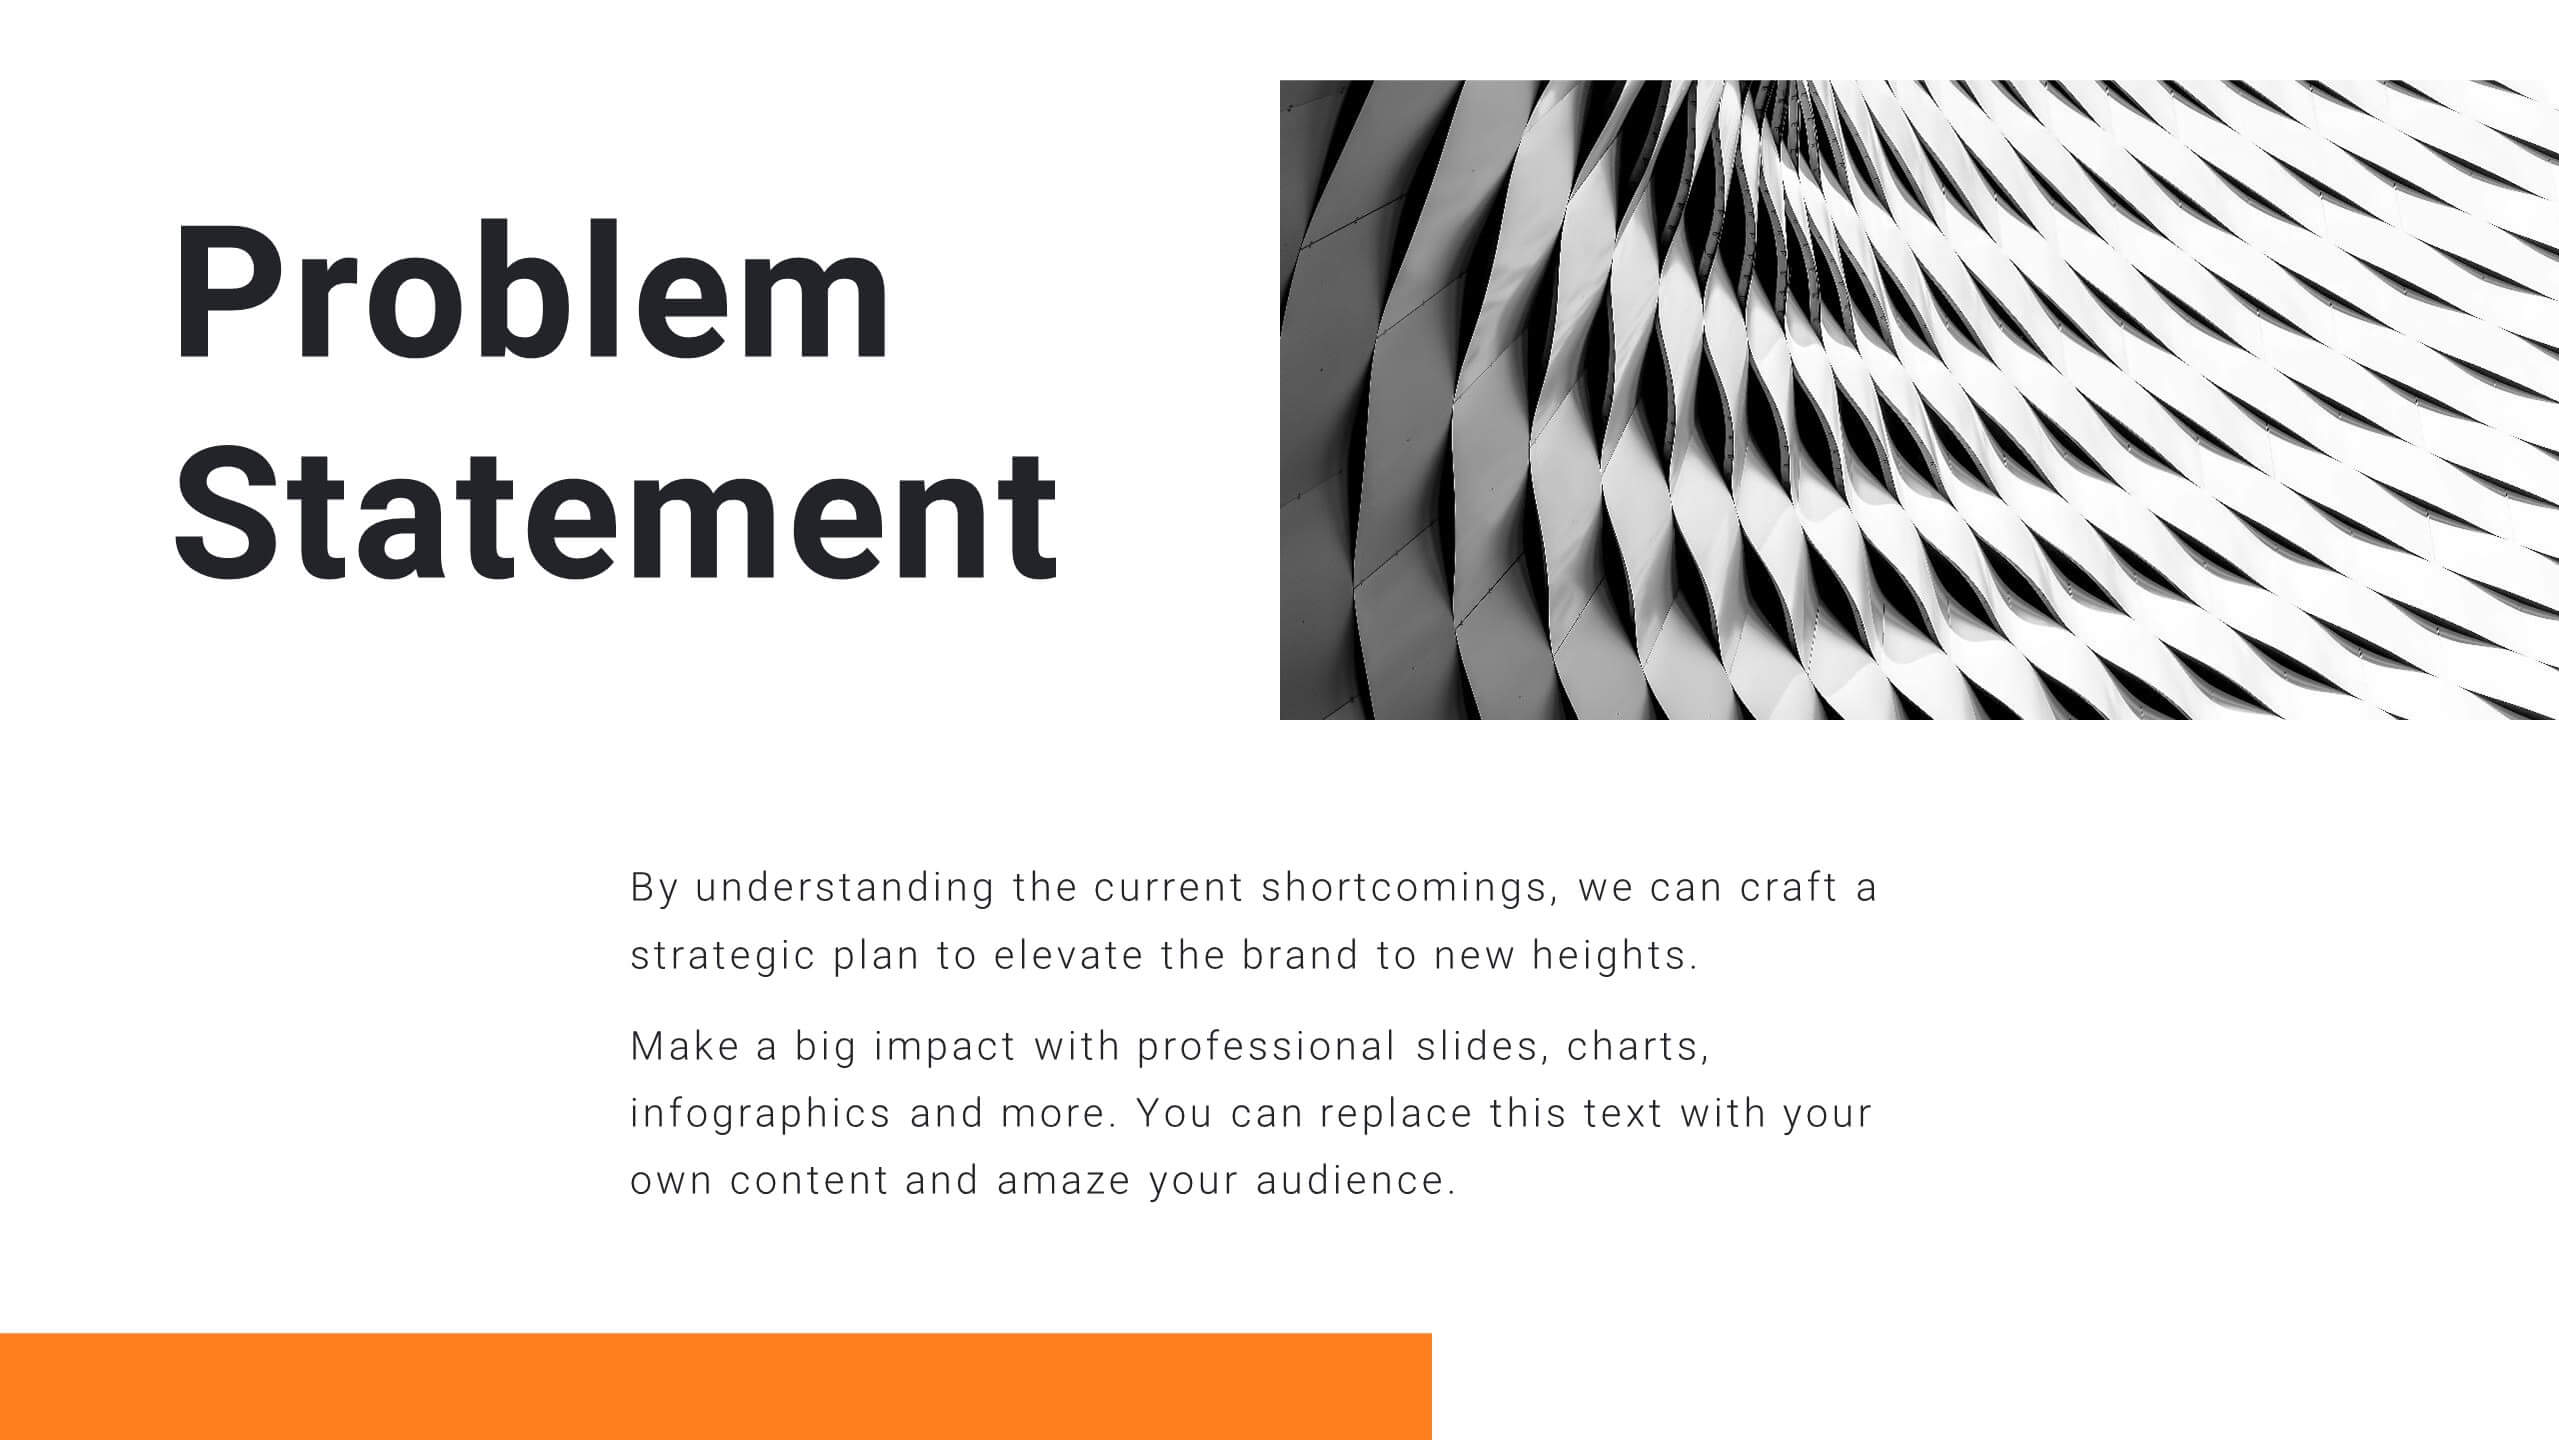
Harmony Project Management Plan Presentation
Plan your project efficiently with this comprehensive project management plan template! It covers all essential aspects including timeline, budget, resource allocation, and risk management. Ensure smooth project execution and achieve your objectives. Compatible with PowerPoint, Keynote, and Google Slides, it's designed to streamline your project planning and management process.


3 diapositivas
Governance and Compliance Slide Presentation
Bring structure and clarity to complex corporate processes with this modern triangle-based presentation design. Ideal for showcasing governance principles, compliance strategies, and operational standards, it visually balances accountability and efficiency. Fully editable and compatible with PowerPoint, Keynote, and Google Slides for seamless professional customization.


4 diapositivas
Innovative Business Solution Strategy
Present fresh, impactful ideas with this innovative business solution strategy slide. Featuring a creative lightbulb design, this template helps you showcase strategic solutions, key initiatives, or breakthrough concepts in a visually organized way. Perfect for startups, innovation workshops, and business growth meetings. Fully editable and compatible with PowerPoint, Keynote, and Google Slides.
5 diapositivas
Feedback Rating Smile Icons Presentation
Light up your presentation with a playful visual that turns audience feedback into clear, colorful insights. This slide helps you compare ratings, highlight sentiment patterns, and present review data in a friendly, memorable way. Perfect for surveys, reports, and performance reviews. Fully compatible with PowerPoint, Keynote, and Google Slides.


5 diapositivas
Analytical Chimestry Infographics
Analytical Chimestry Infographics is a bold, colorful, and modern presentation


5 diapositivas
Pricing Structure and Cost Allocation Presentation
Show stakeholders how every dollar works with this colorful arc-style financial slide. Explain product tiers, service fees, or project budgets in clear segments that highlight what matters most. Ideal for finance updates, sales decks, or board reviews, and fully compatible with PowerPoint, Keynote, and Google Slides for seamless team collaboration.


4 diapositivas
Creative Title Slide Templates Presentation
Make a bold first impression with the Creative Title Slide Templates Presentation. Featuring a sleek, split-layout design with glowing blue abstract waves, this template combines modern aesthetics with functional clarity. Circular icons on the side offer quick visual cues for business categories or departments. Ideal for keynote introductions or professional project kickoffs. Compatible with PowerPoint, Keynote, and Google Slides.


5 diapositivas
Benefits of Insurance Infographics
The purpose of insurance is to mitigate the financial impact of unexpected events or circumstances that may result in financial loss. These infographic templates are versatile and effective tools to convey the value of insurance to your audience. These are perfect to highlight the various advantages and importance of having insurance coverage. This serves as an engaging tool to educate and inform your audience about the benefits of different types of insurance policies. This makes it easy for viewers to understand the benefits and importance of insurance in various aspects of life. Compatible with Powerpoint, Keynote, and Google Slides.


4 diapositivas
Strategic SWOT Analysis Chart Presentation
Kick off your strategy session with a clean, modern layout that makes analyzing key strengths, weaknesses, opportunities, and threats feel effortless. This presentation helps teams visualize insights, connect patterns, and plan smarter using a clear, connected flow. Perfect for strategic planning and business reviews. Fully compatible with PowerPoint, Keynote, and Google Slides.


8 diapositivas
Effective Learning Techniques Presentation
Optimize learning strategies with the Effective Learning Techniques Presentation template. This dynamic and structured design helps illustrate key educational approaches, training methods, and cognitive learning strategies. Perfect for educators, trainers, and instructional designers, this fully editable template ensures clarity and engagement. Compatible with PowerPoint, Keynote, and Google Slides for seamless integration into your presentations.


6 diapositivas
Checklist and To-Do List Presentation
Bring order and elegance to your presentation with this sleek, easy-to-edit layout perfect for summarizing ideas, listing features, or outlining processes. Its balanced design ensures clarity and flow while keeping your slides visually engaging. Fully compatible with PowerPoint, Keynote, and Google Slides for effortless customization and professional results.


21 diapositivas
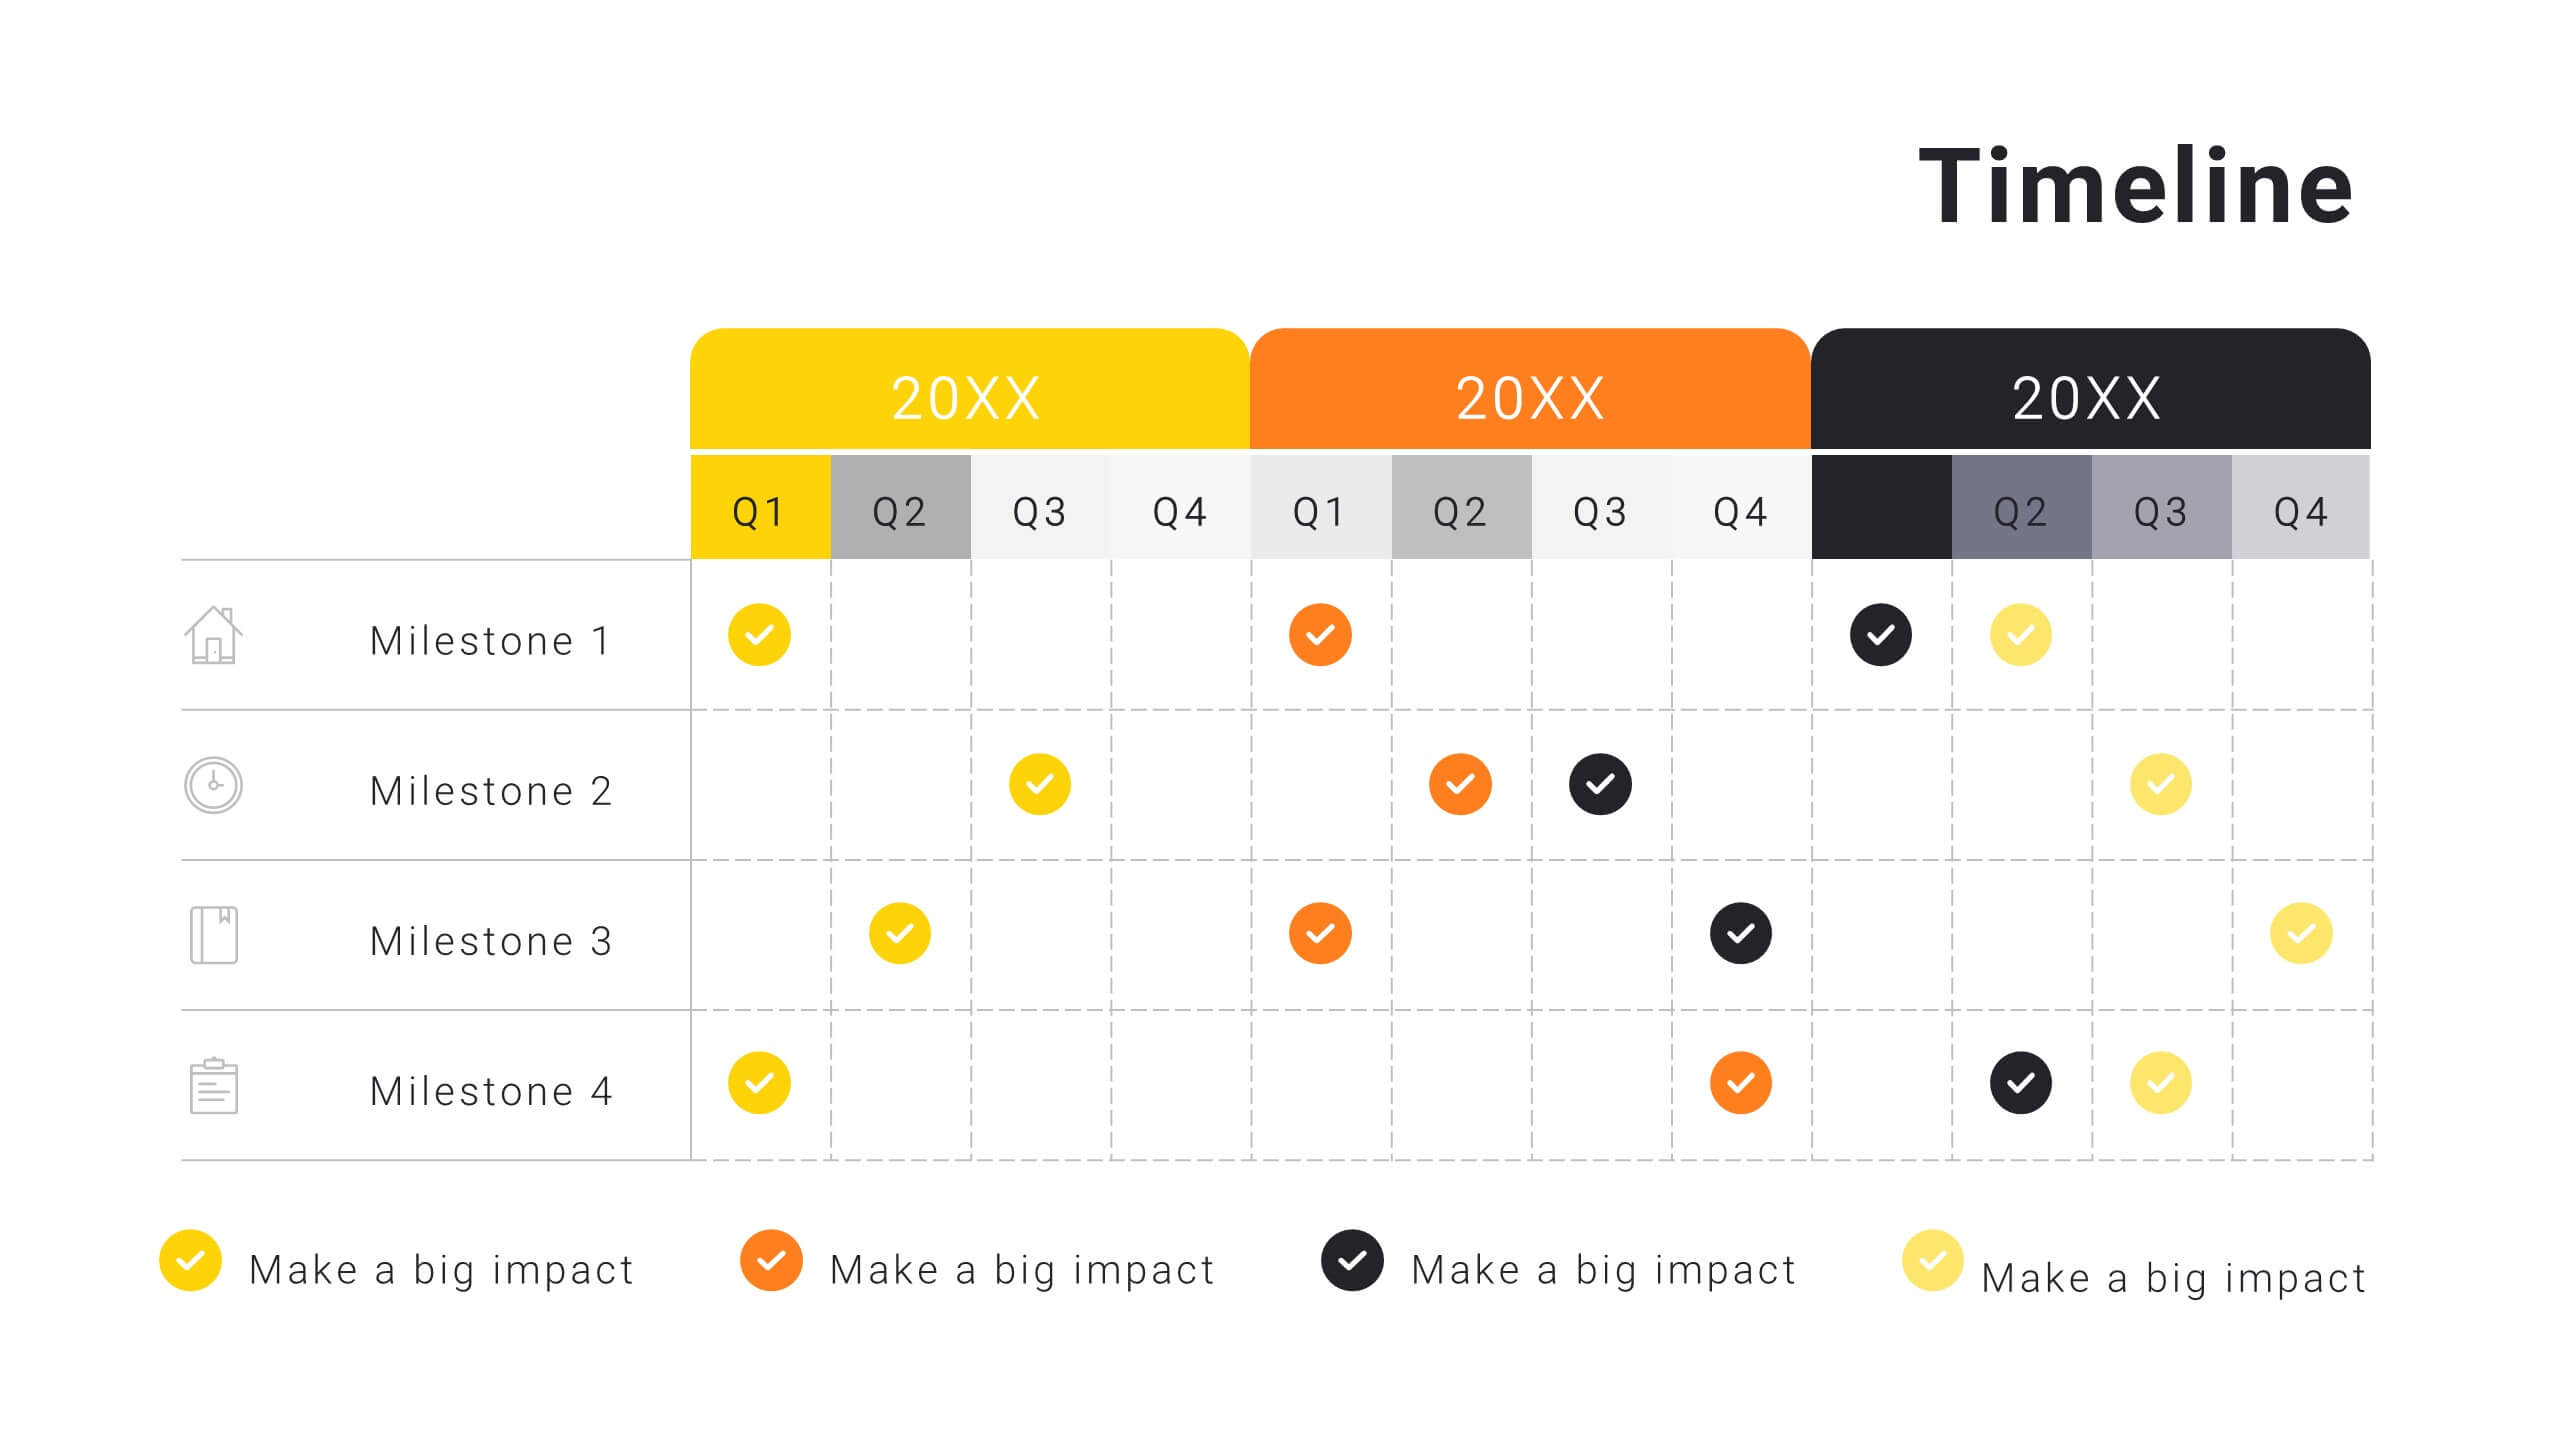
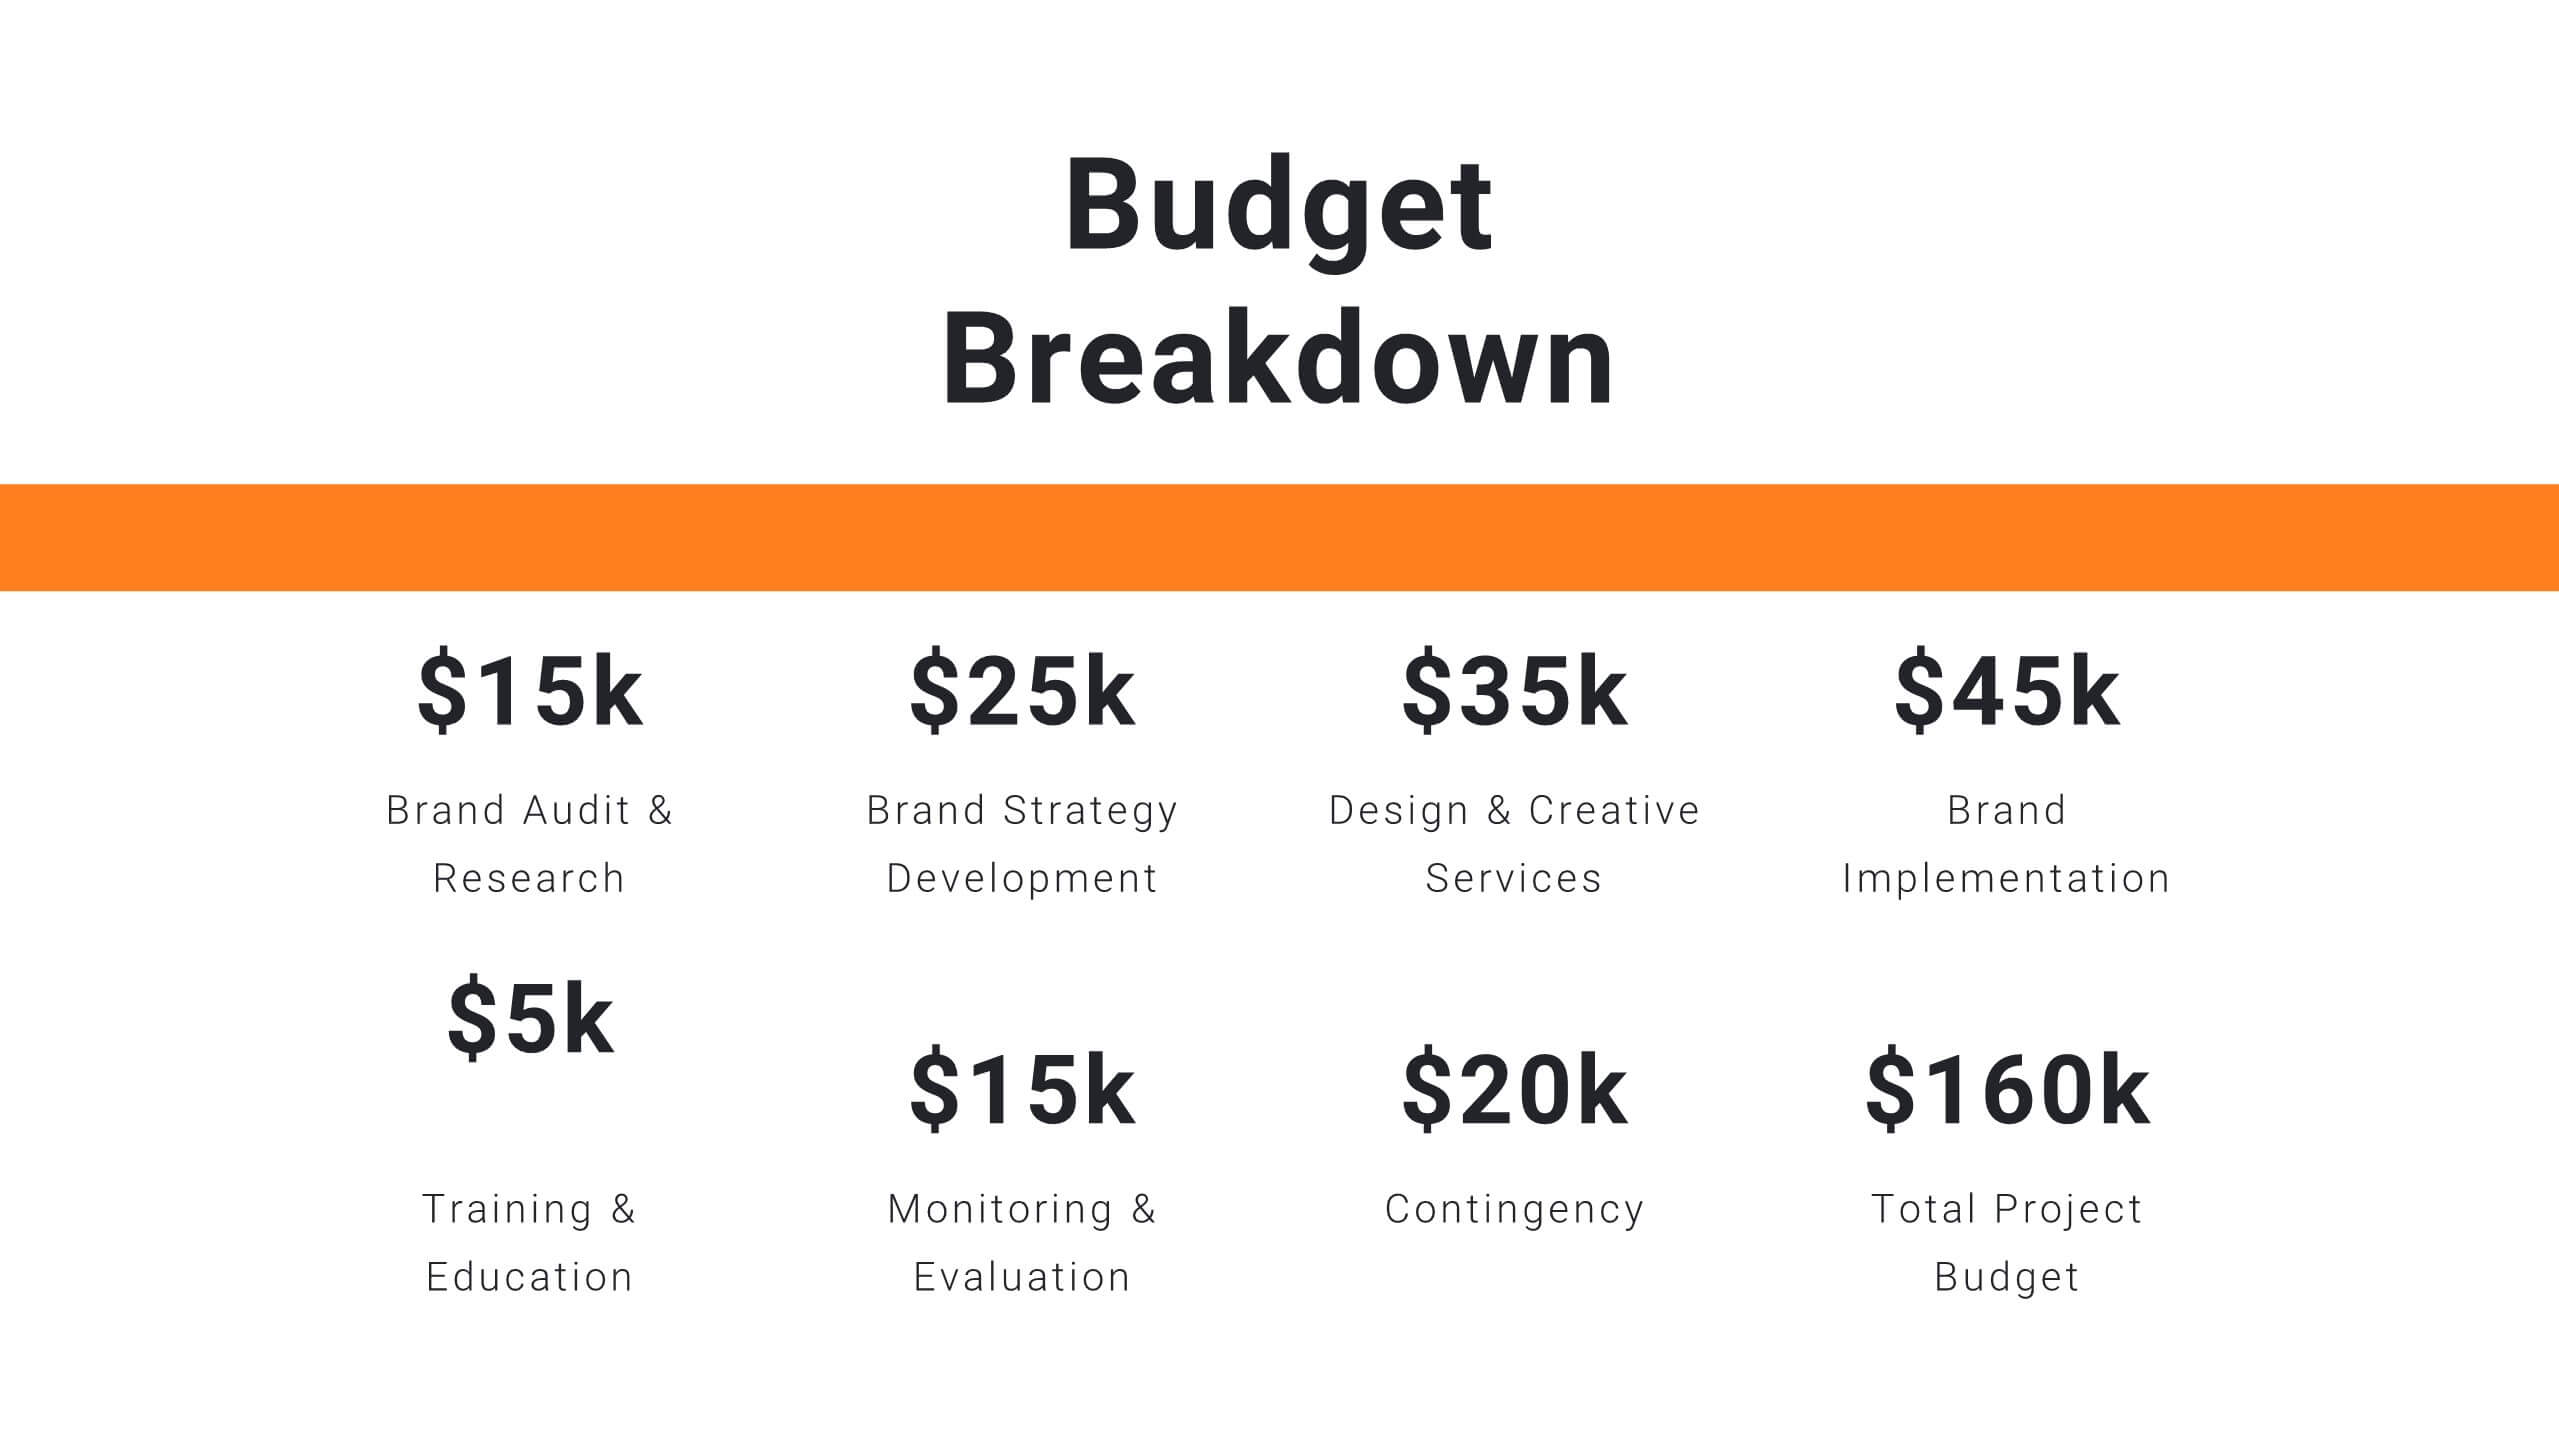
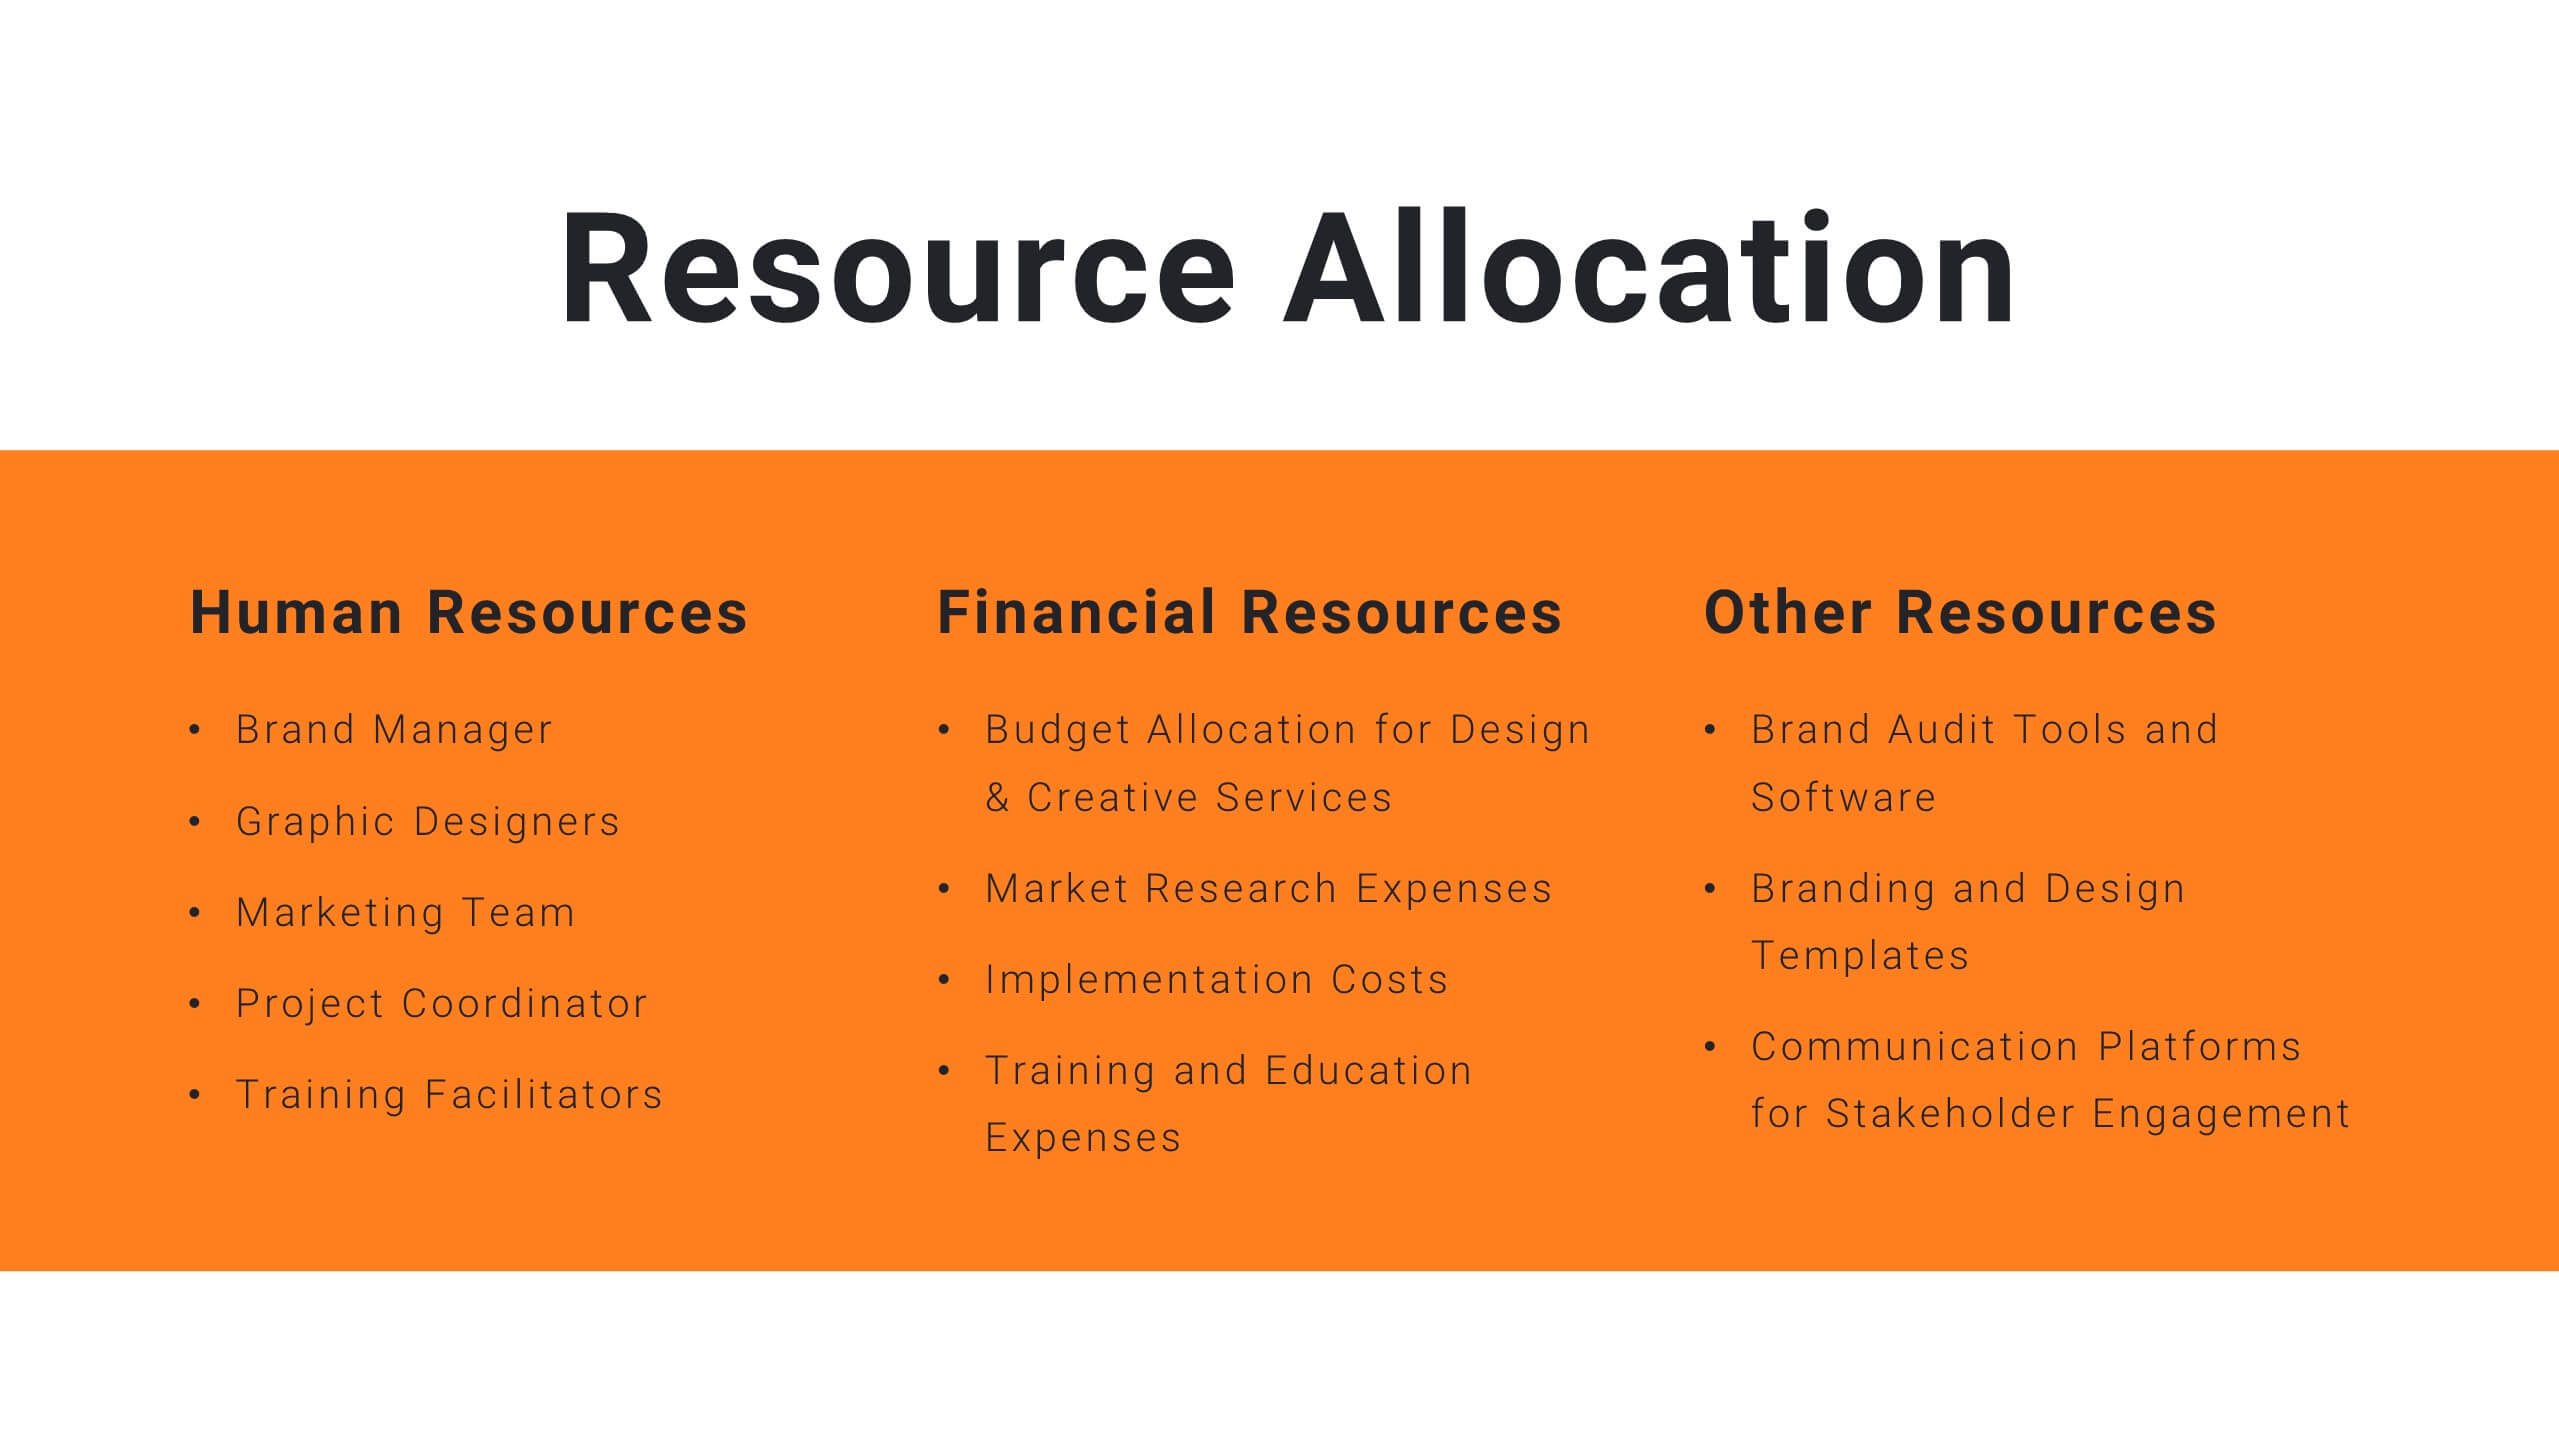
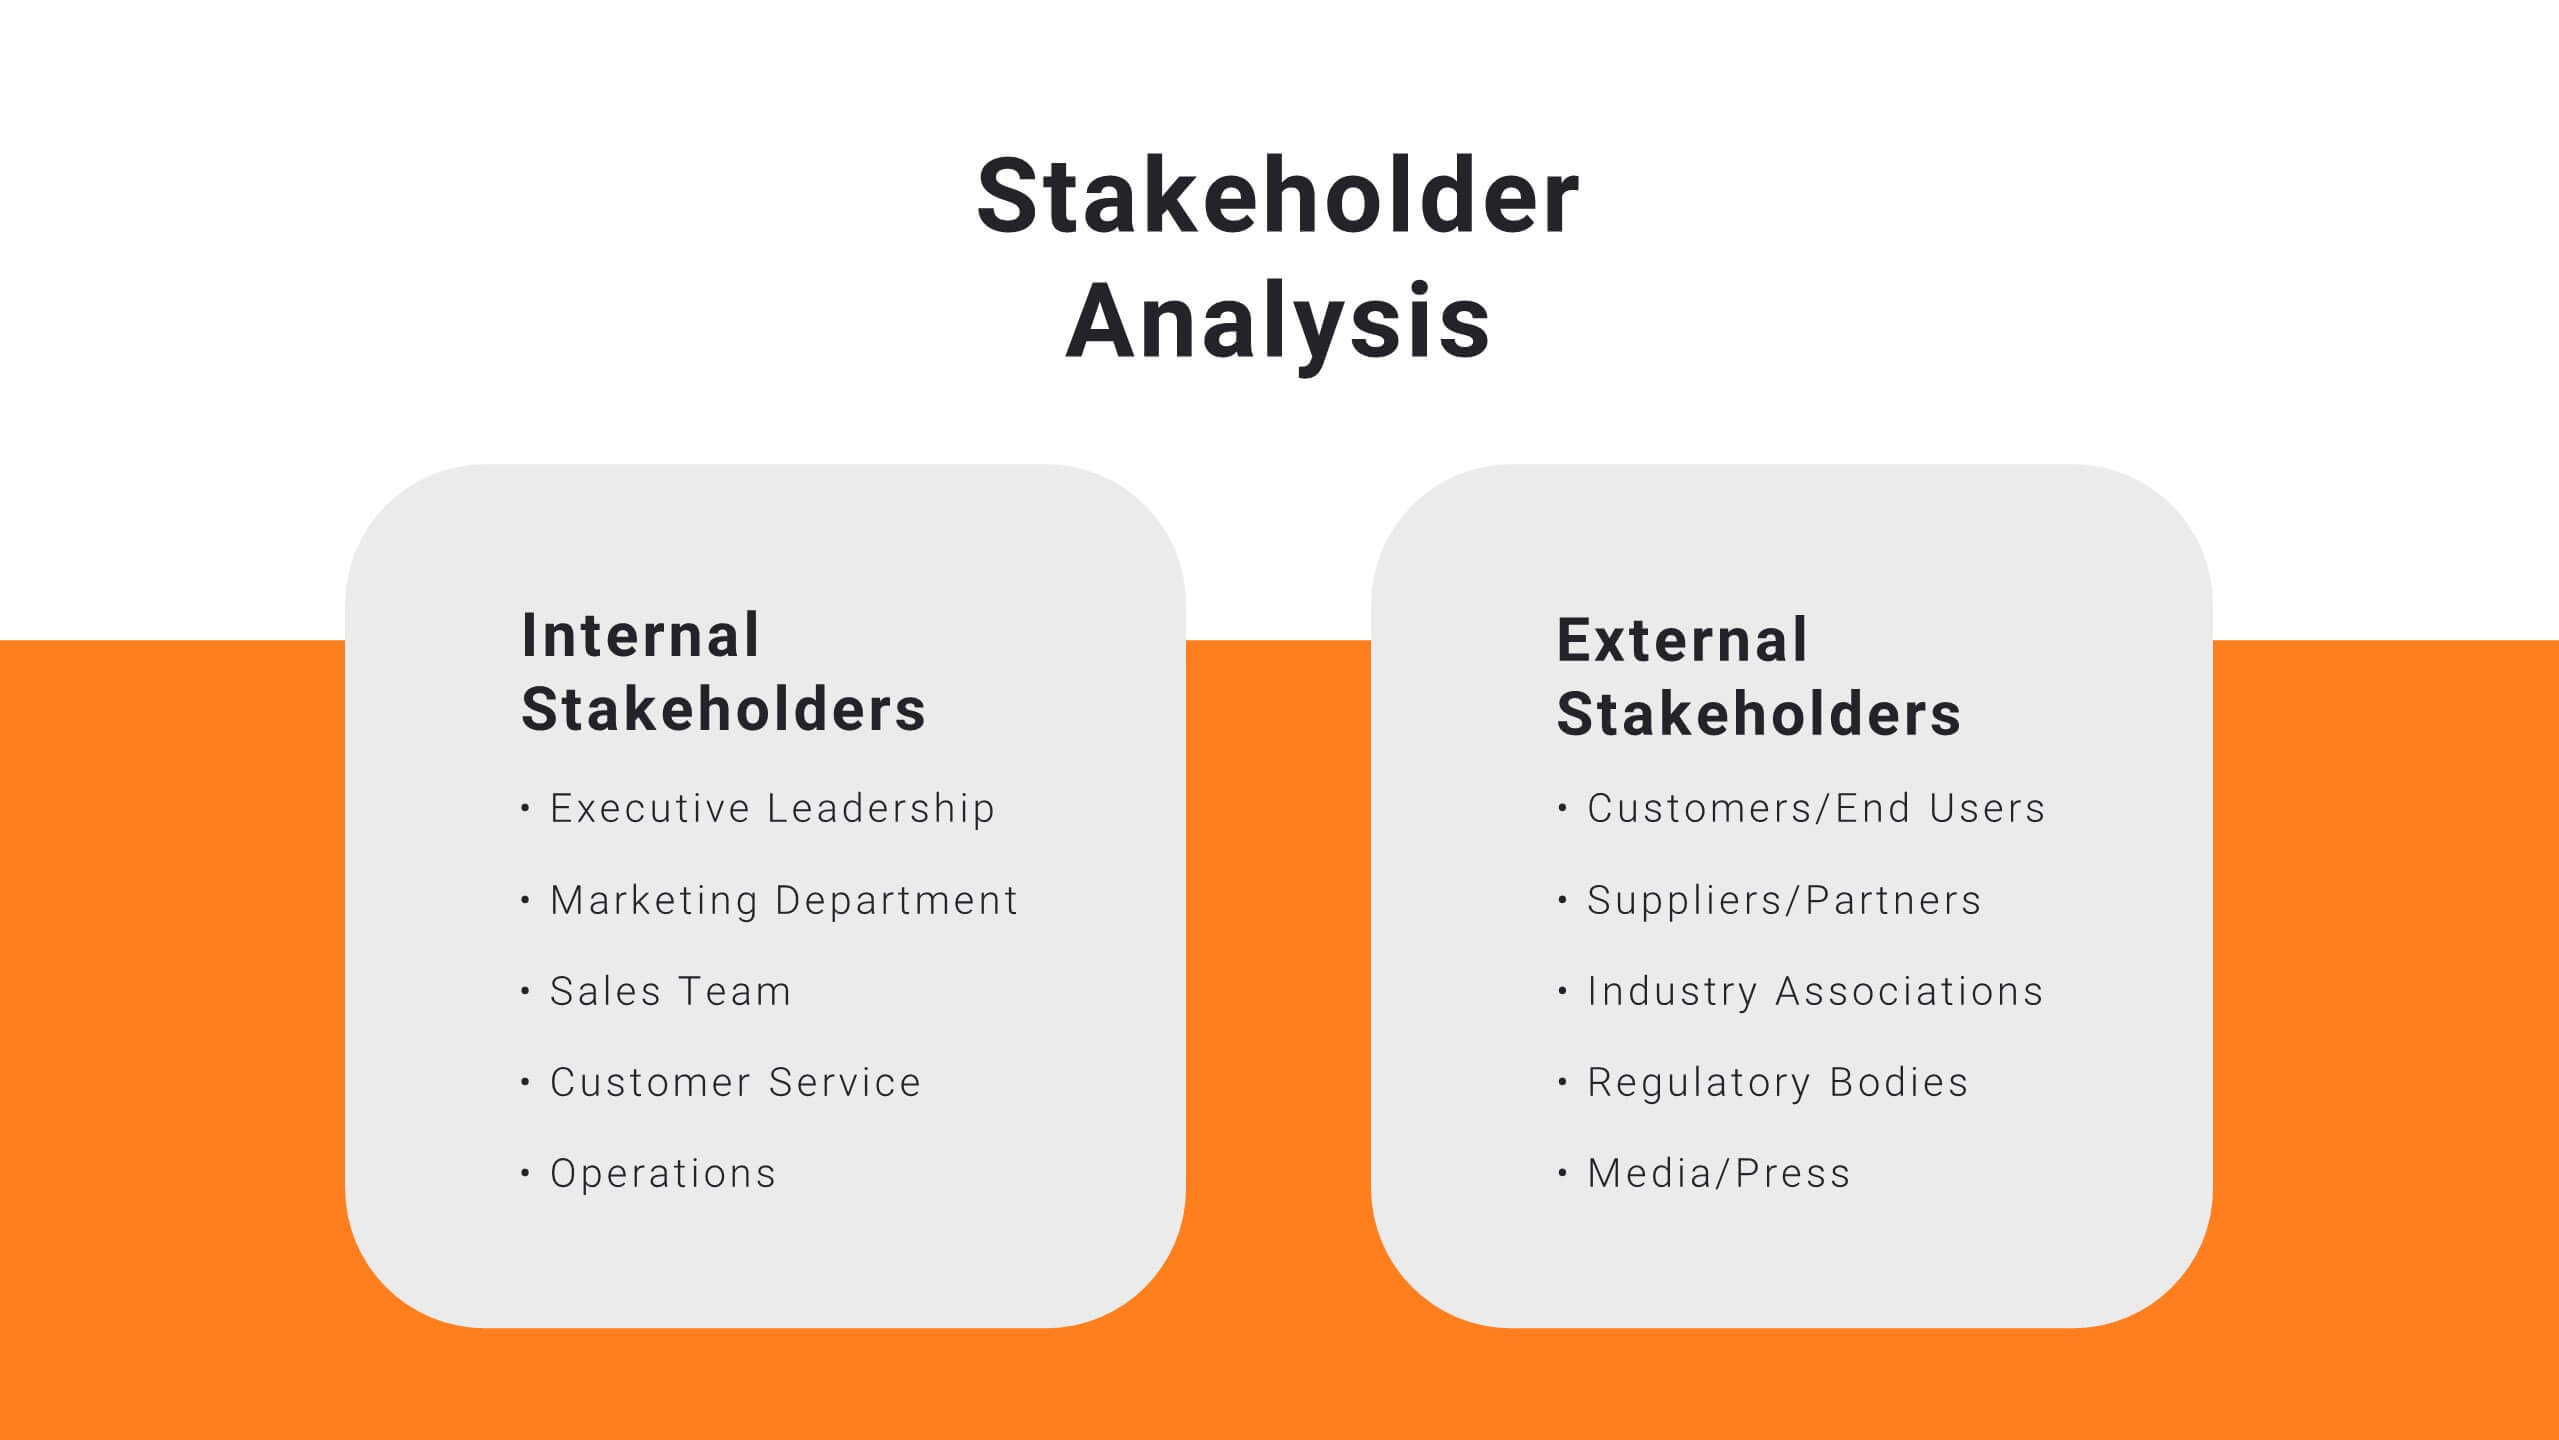
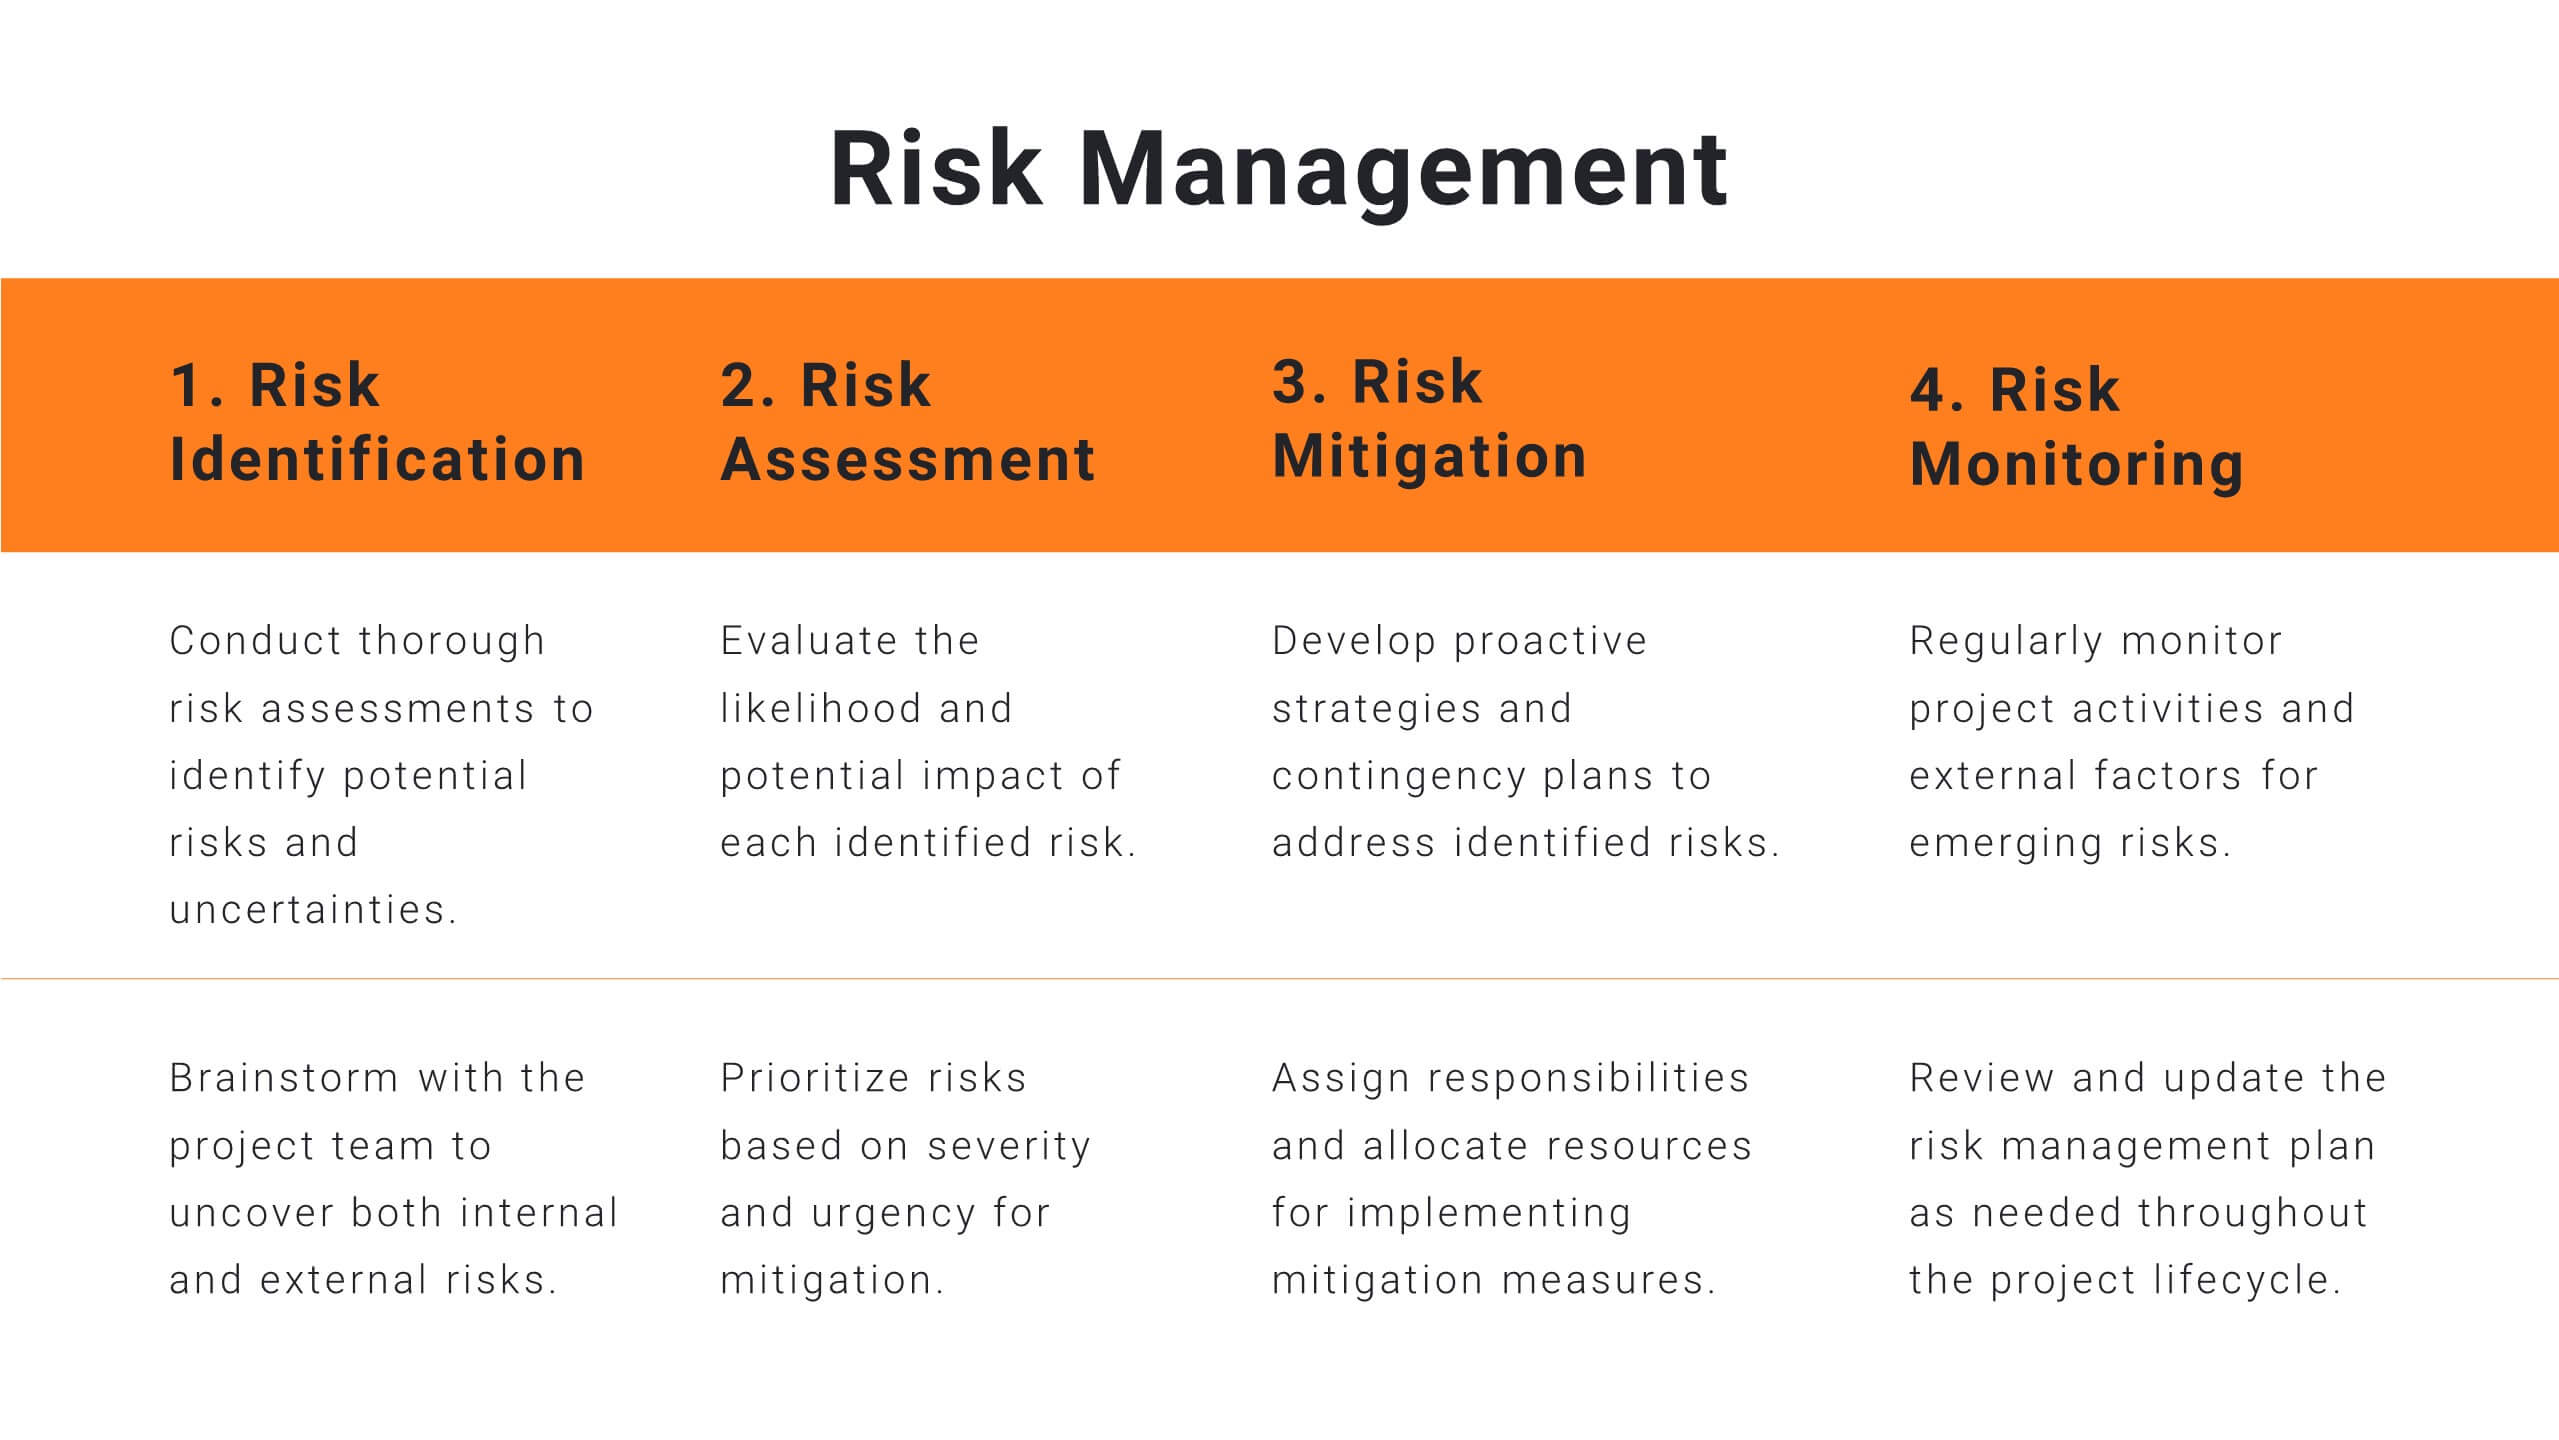
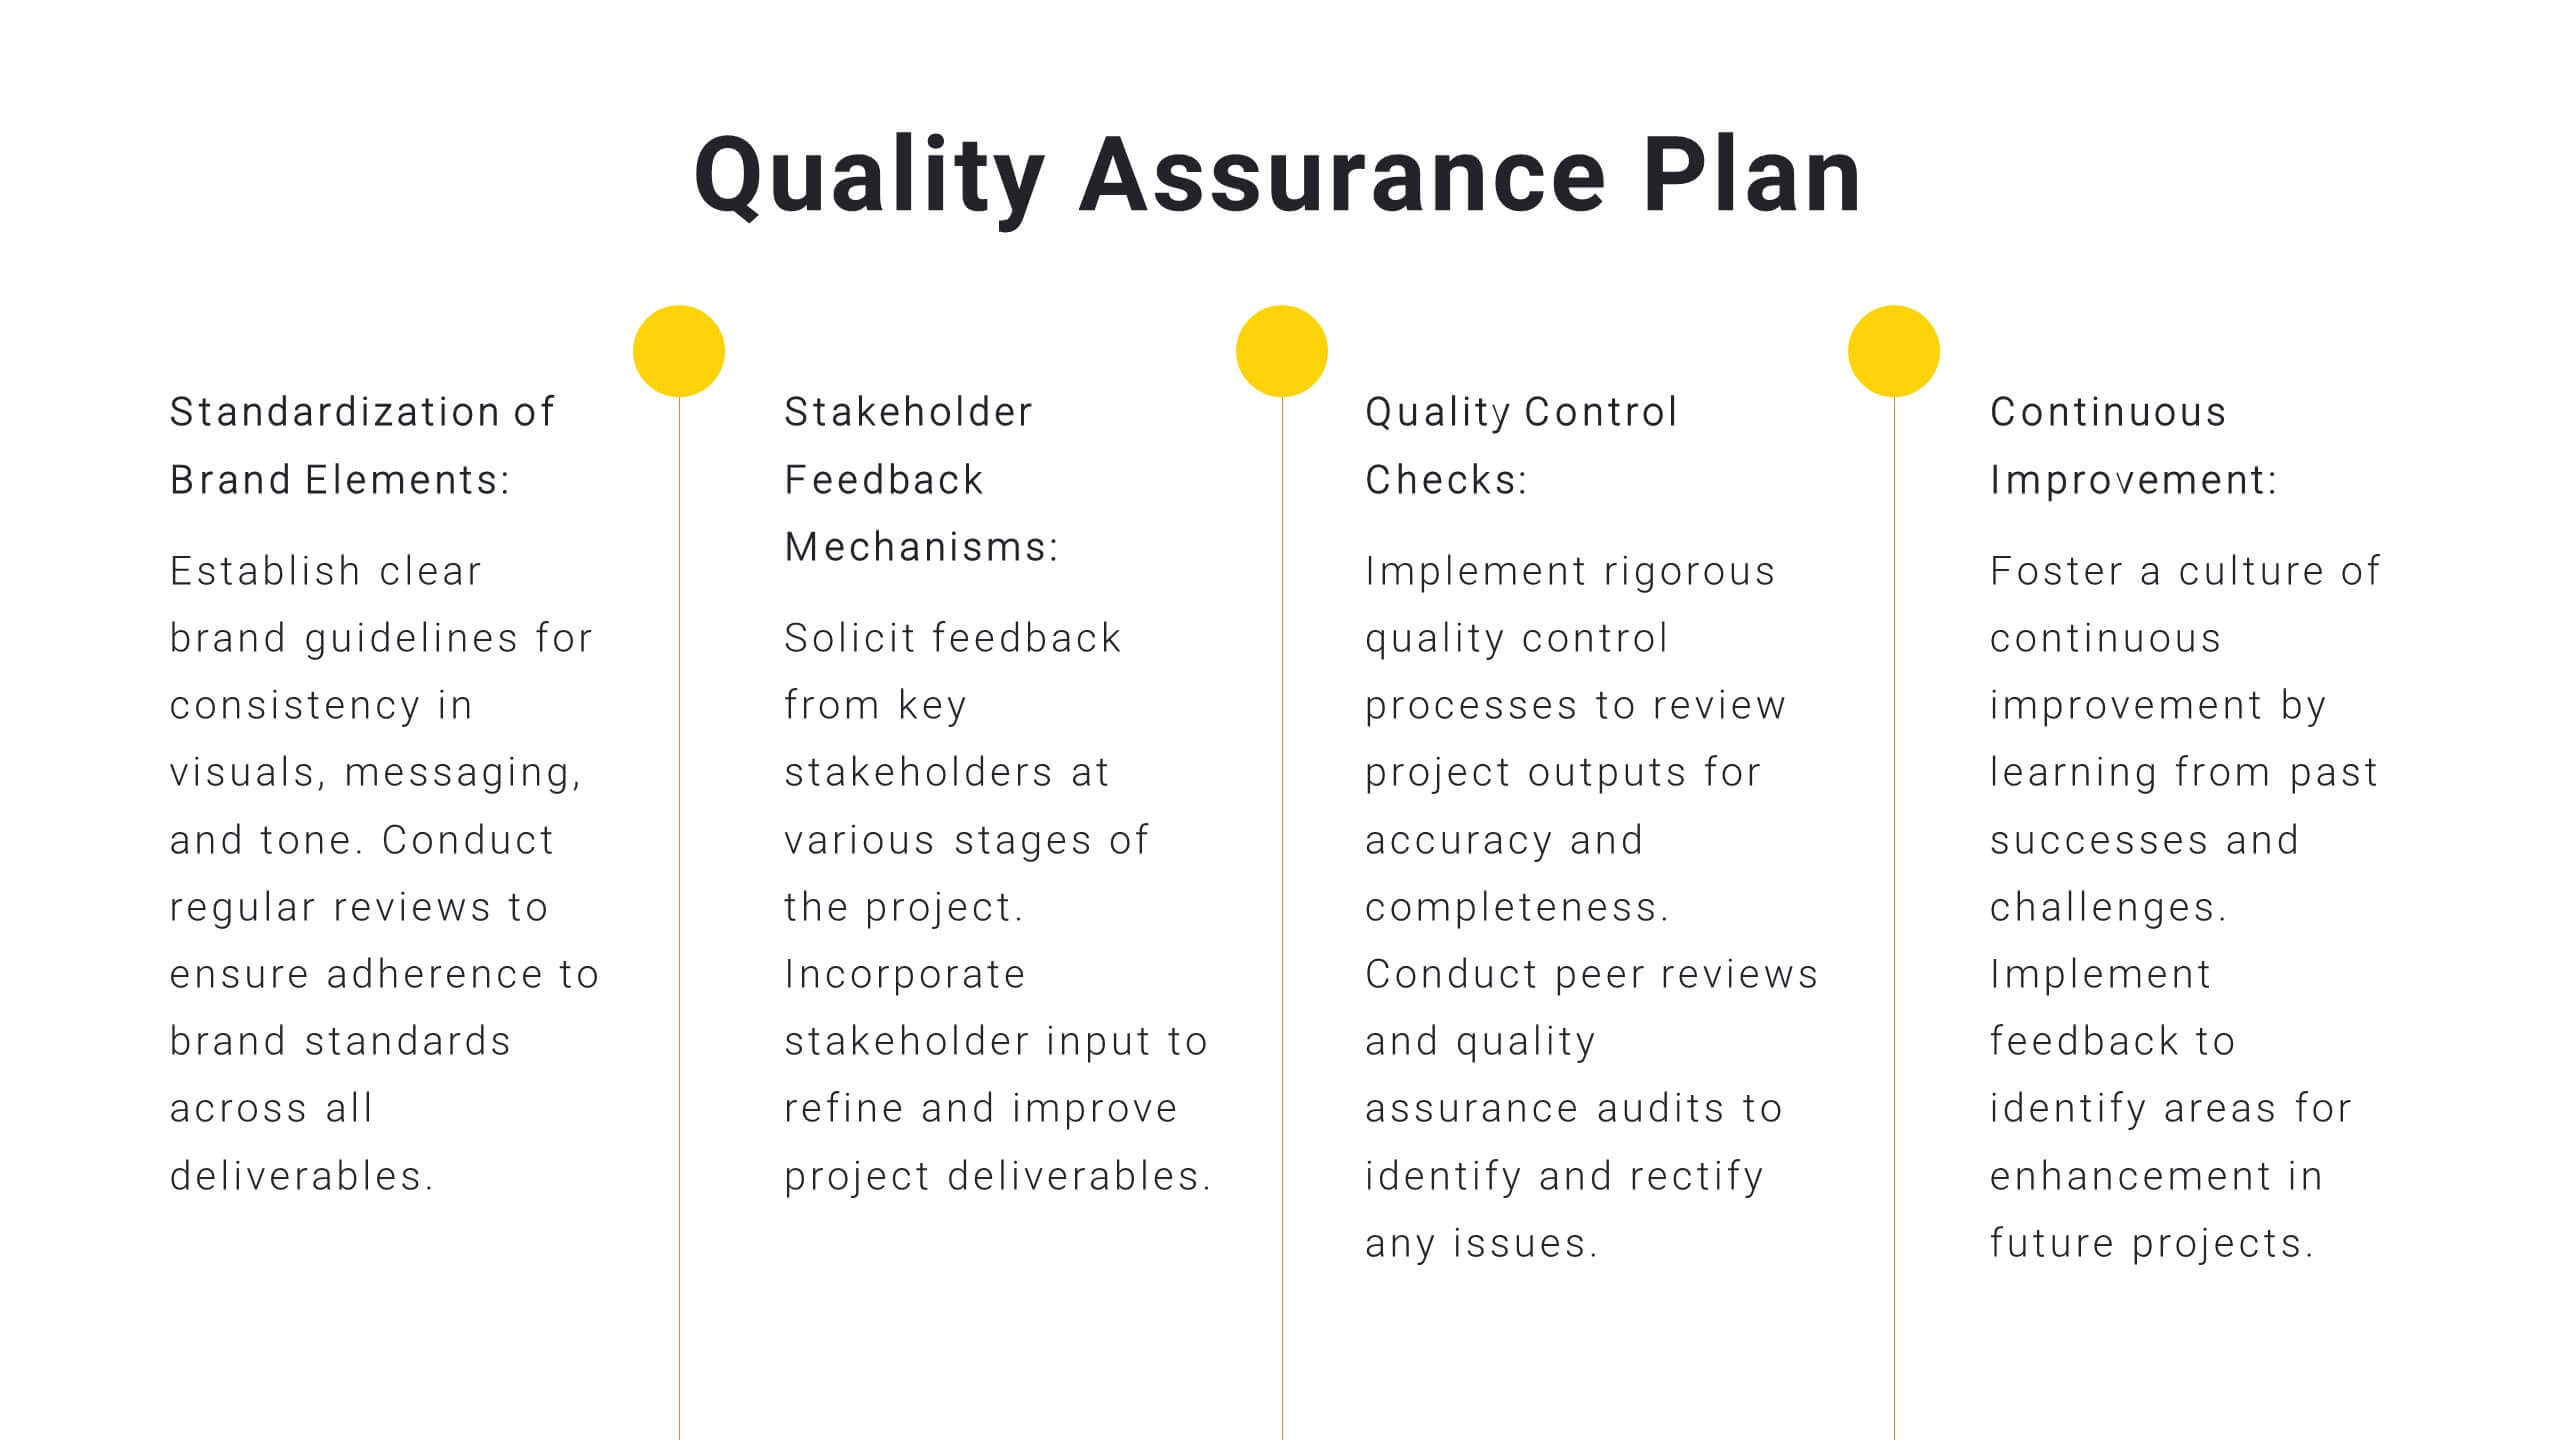
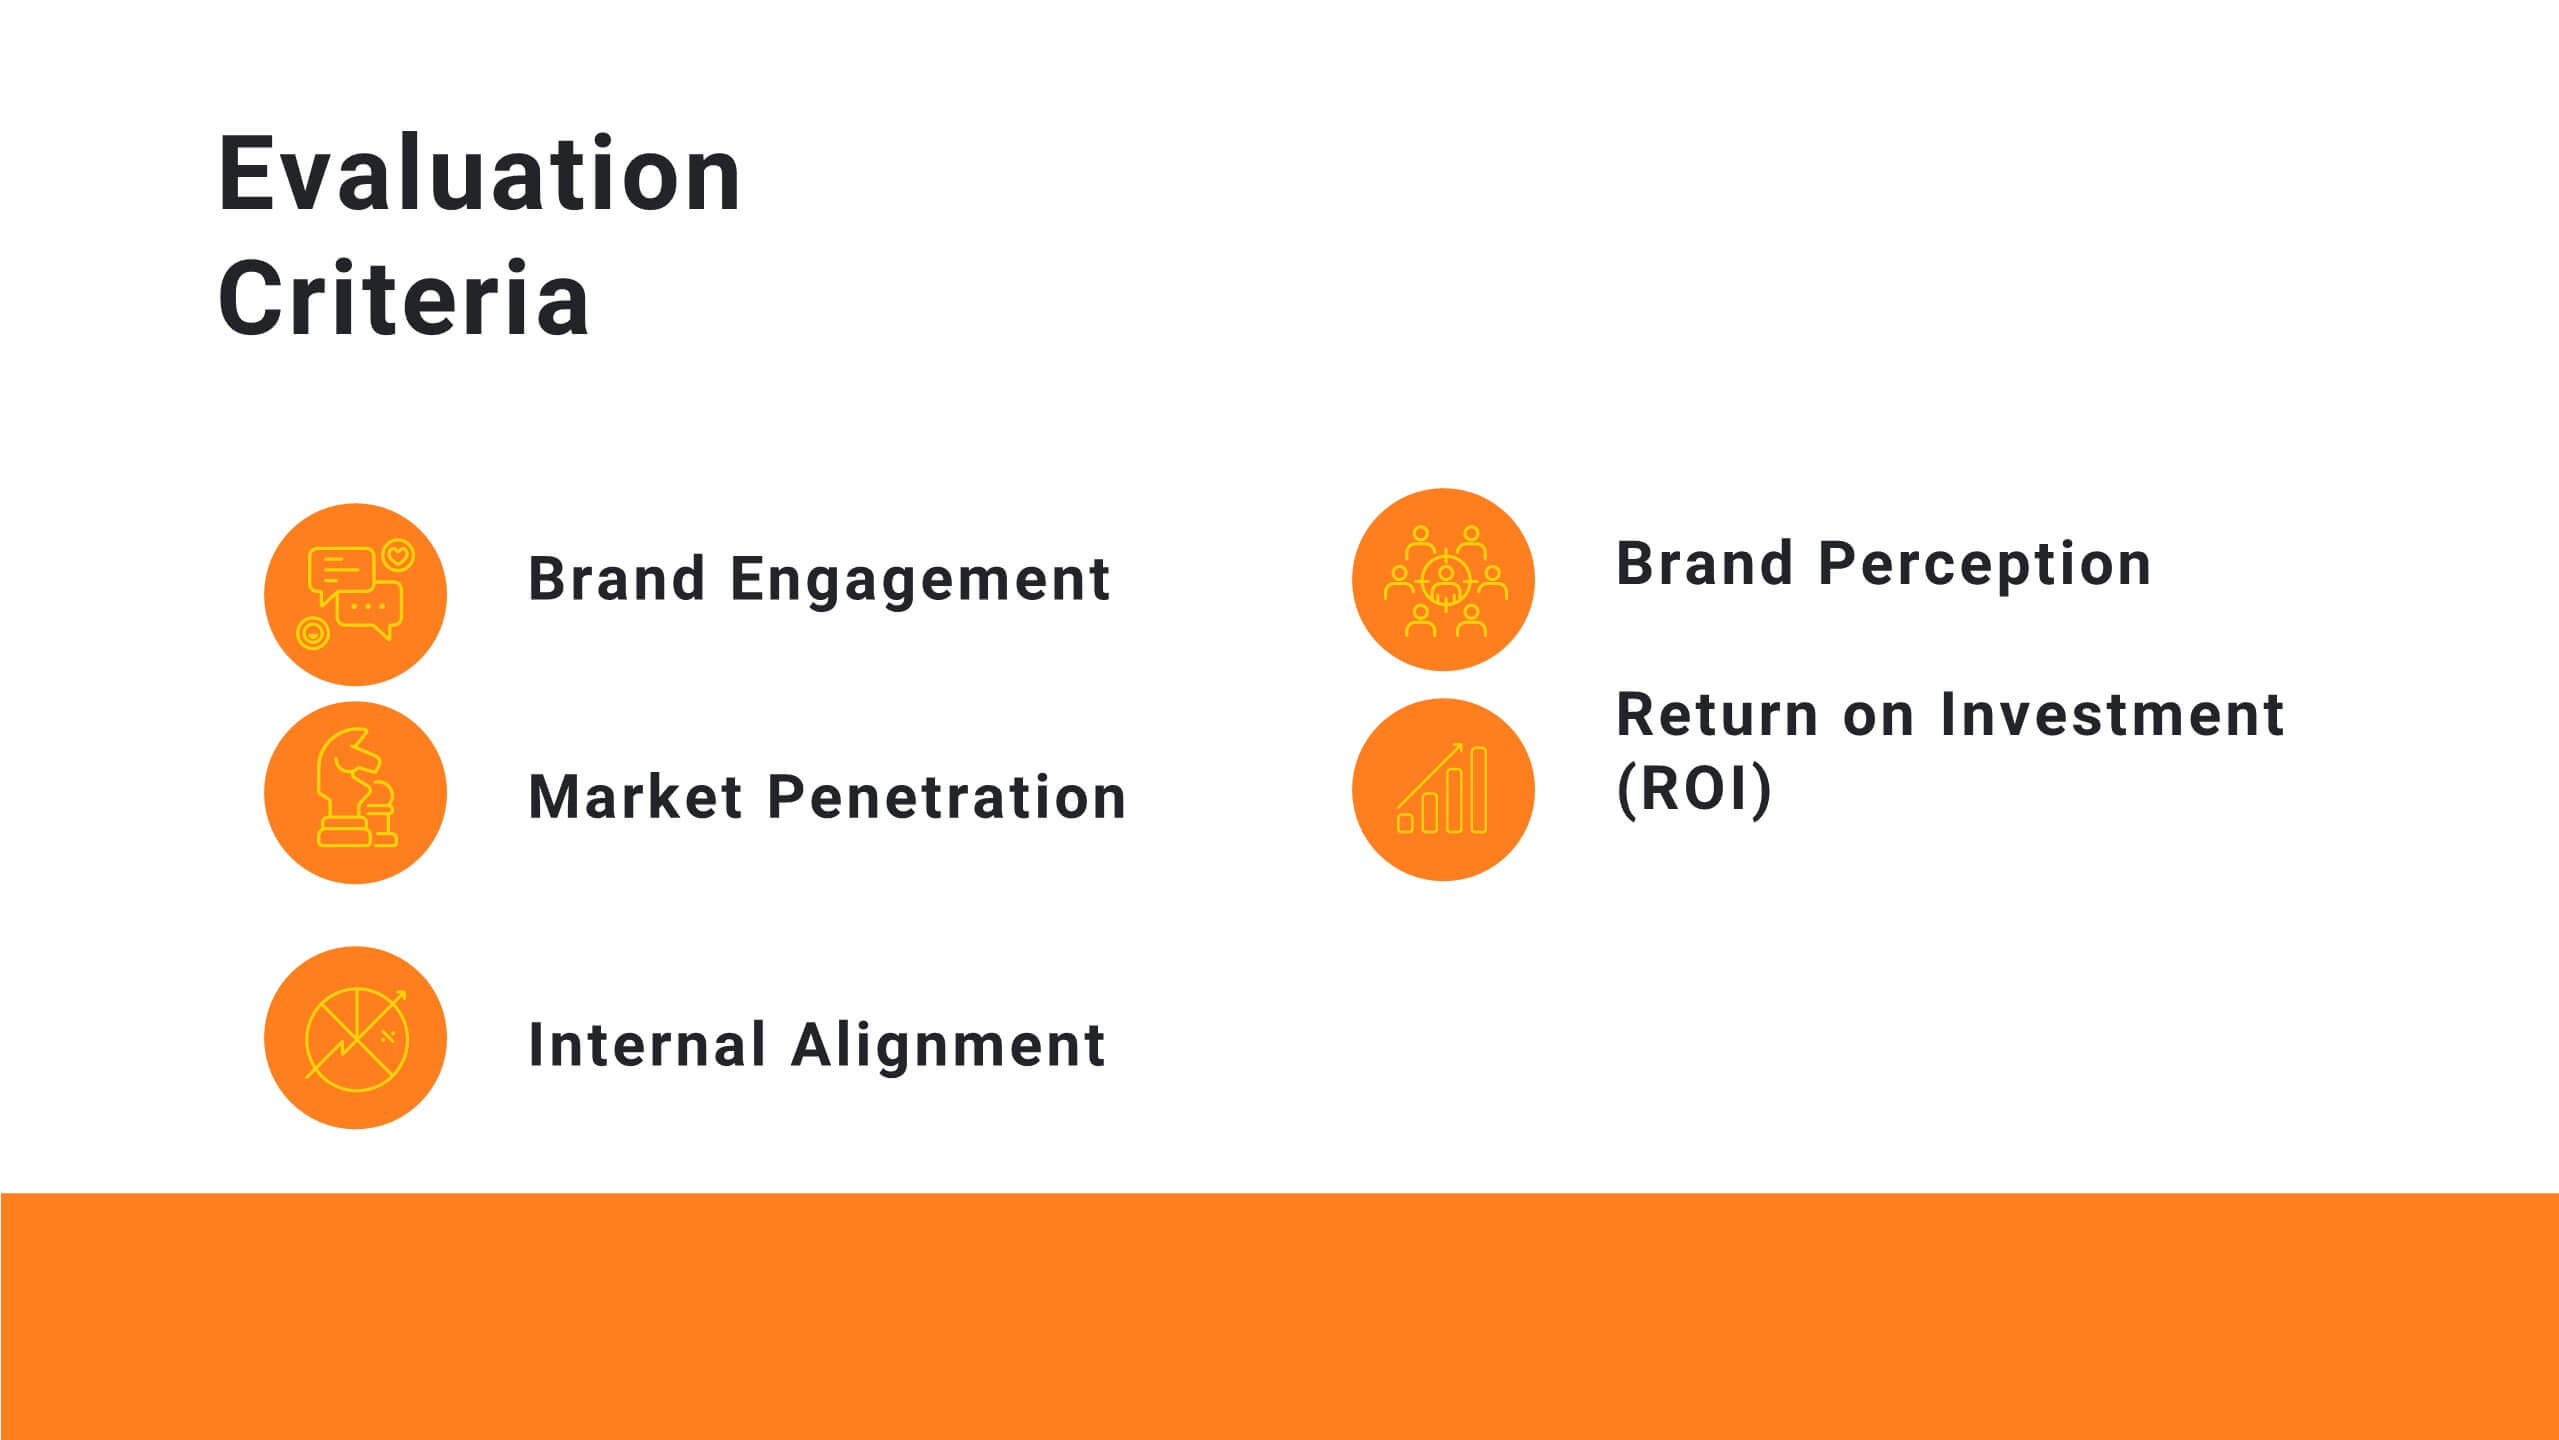
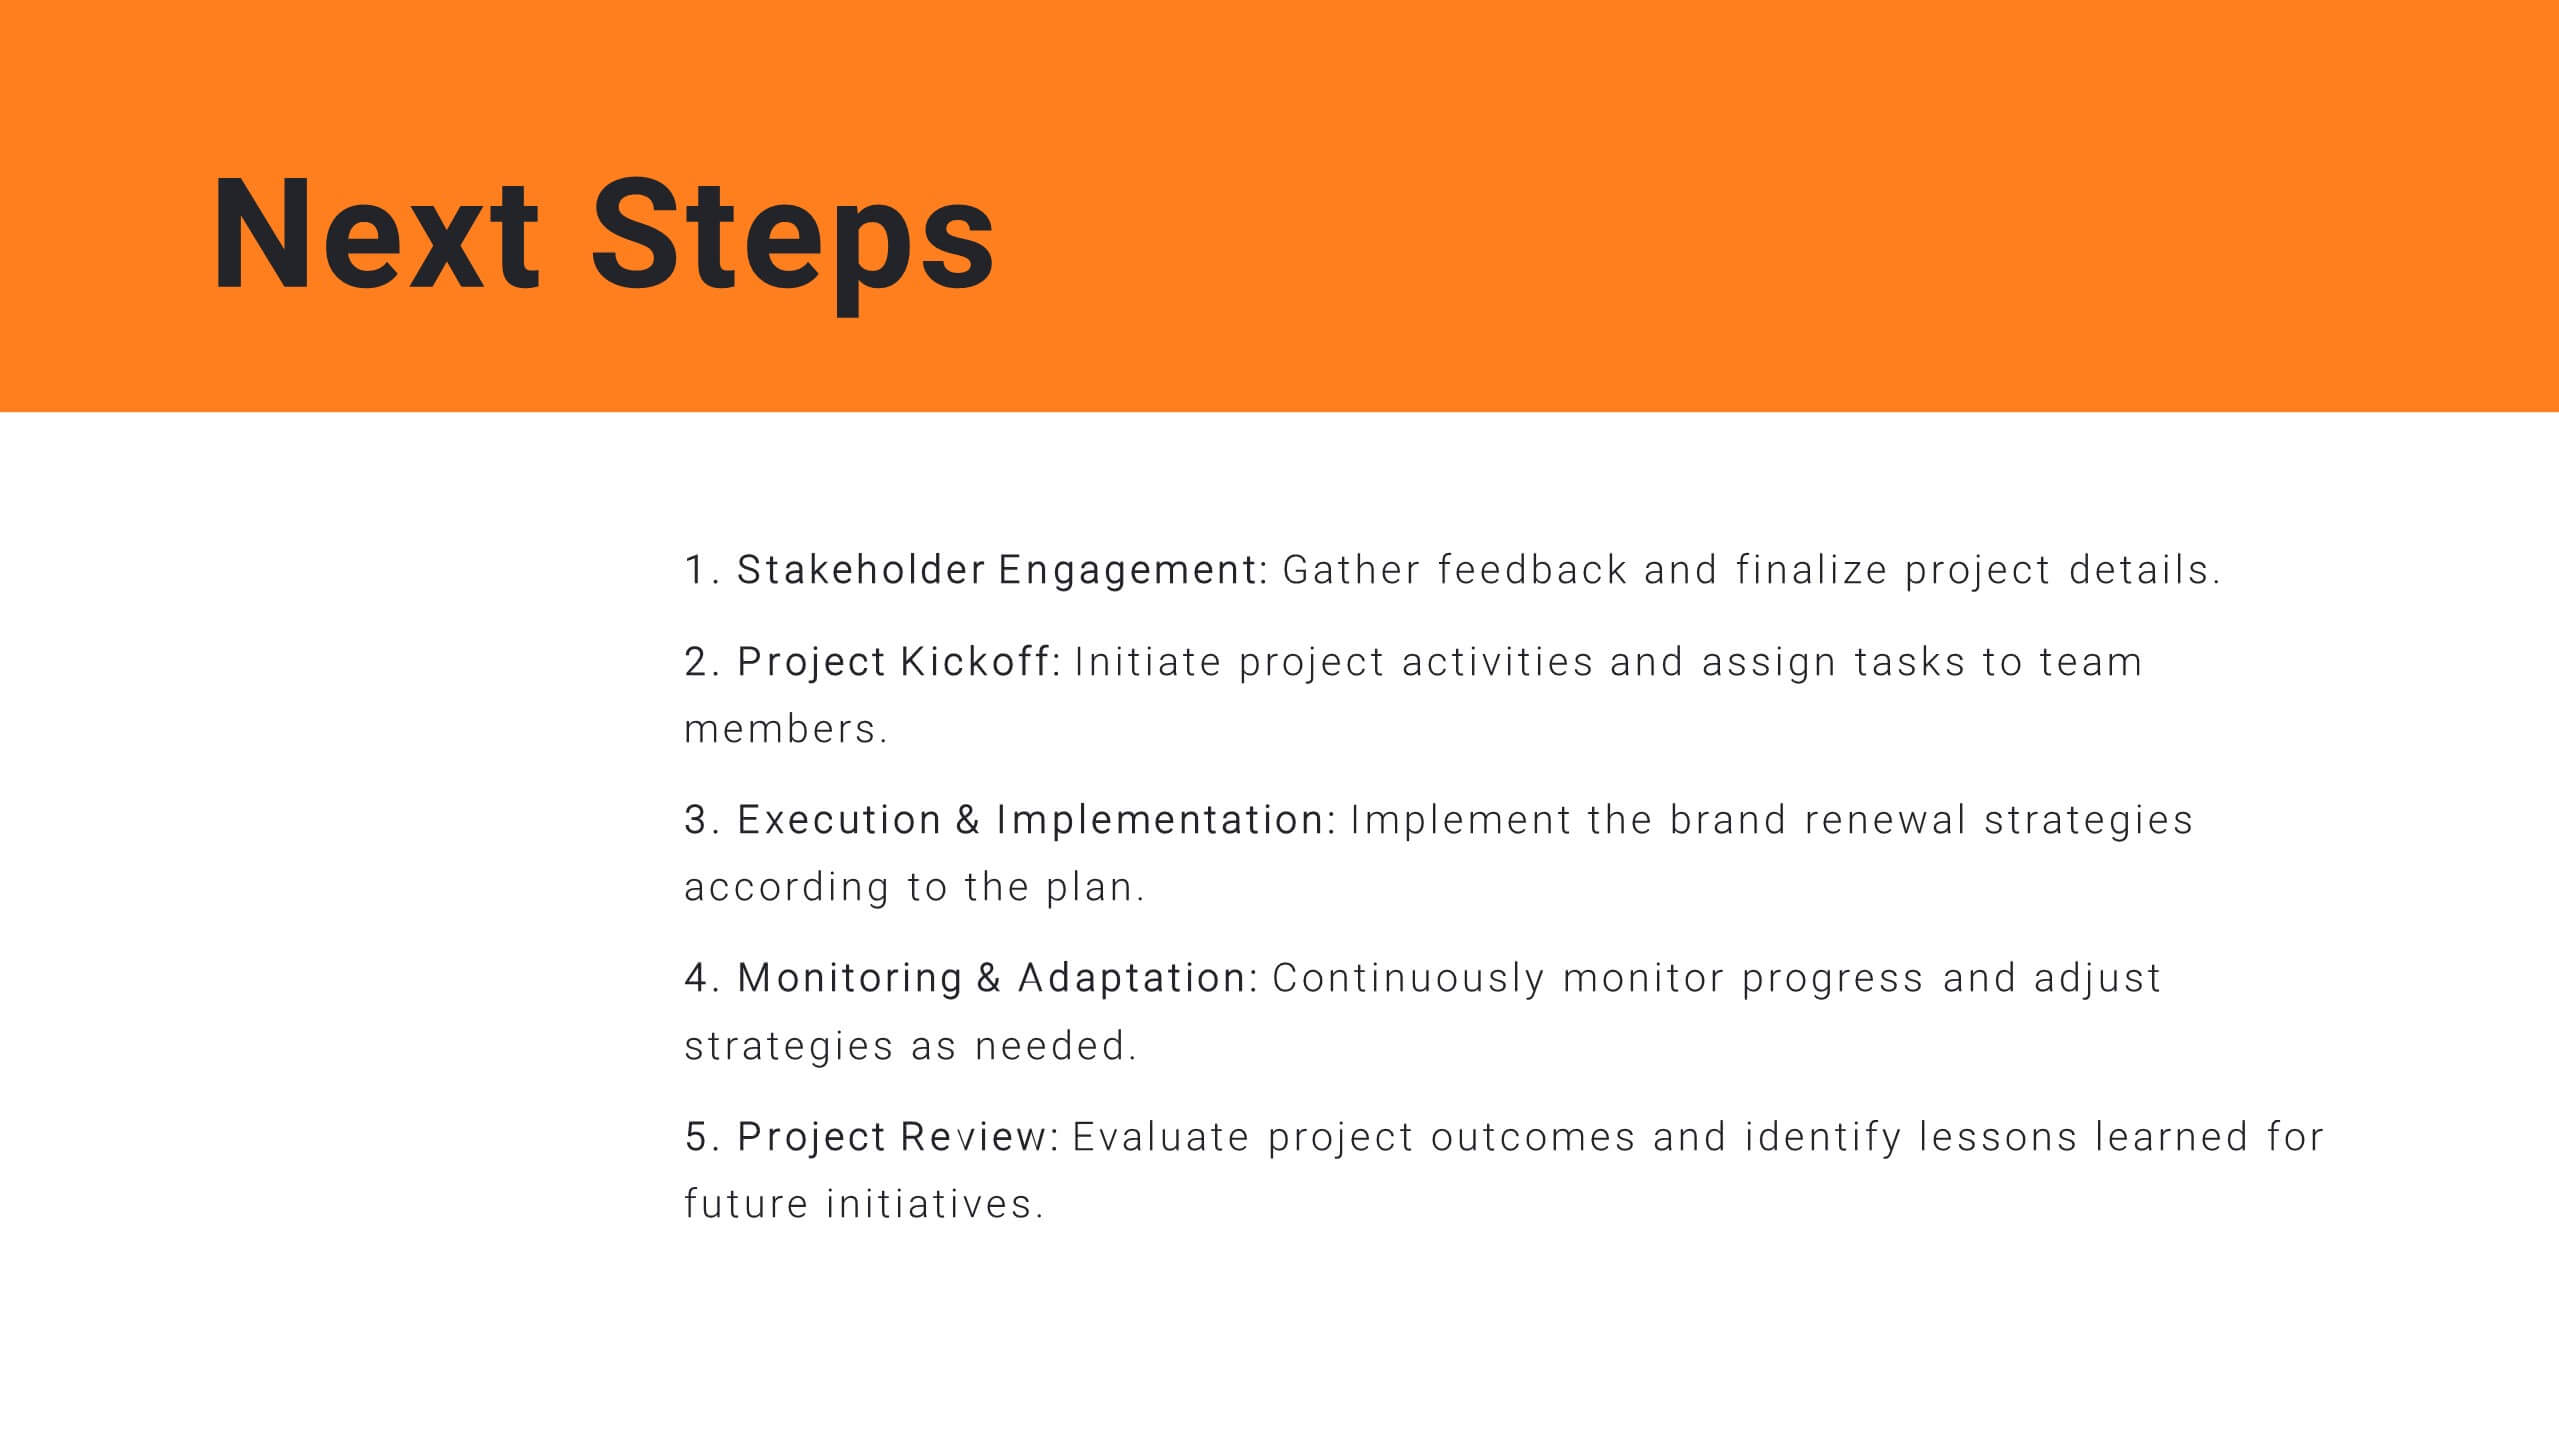
Nucleus Project Timeline Presentation
Plan with precision using this clean and modern Project Timeline Presentation Template. Highlight key phases, milestones, and deliverables with visually organized sections such as Project Overview, Objectives, Budget Breakdown, Resource Allocation, and Risk Management. Perfect for presenting timelines, evaluation criteria, and next steps to stakeholders. Fully customizable and compatible with PowerPoint, Keynote, and Google Slides.