


Características


¿Tienes alguna pregunta?
Recomendar


21 diapositivas
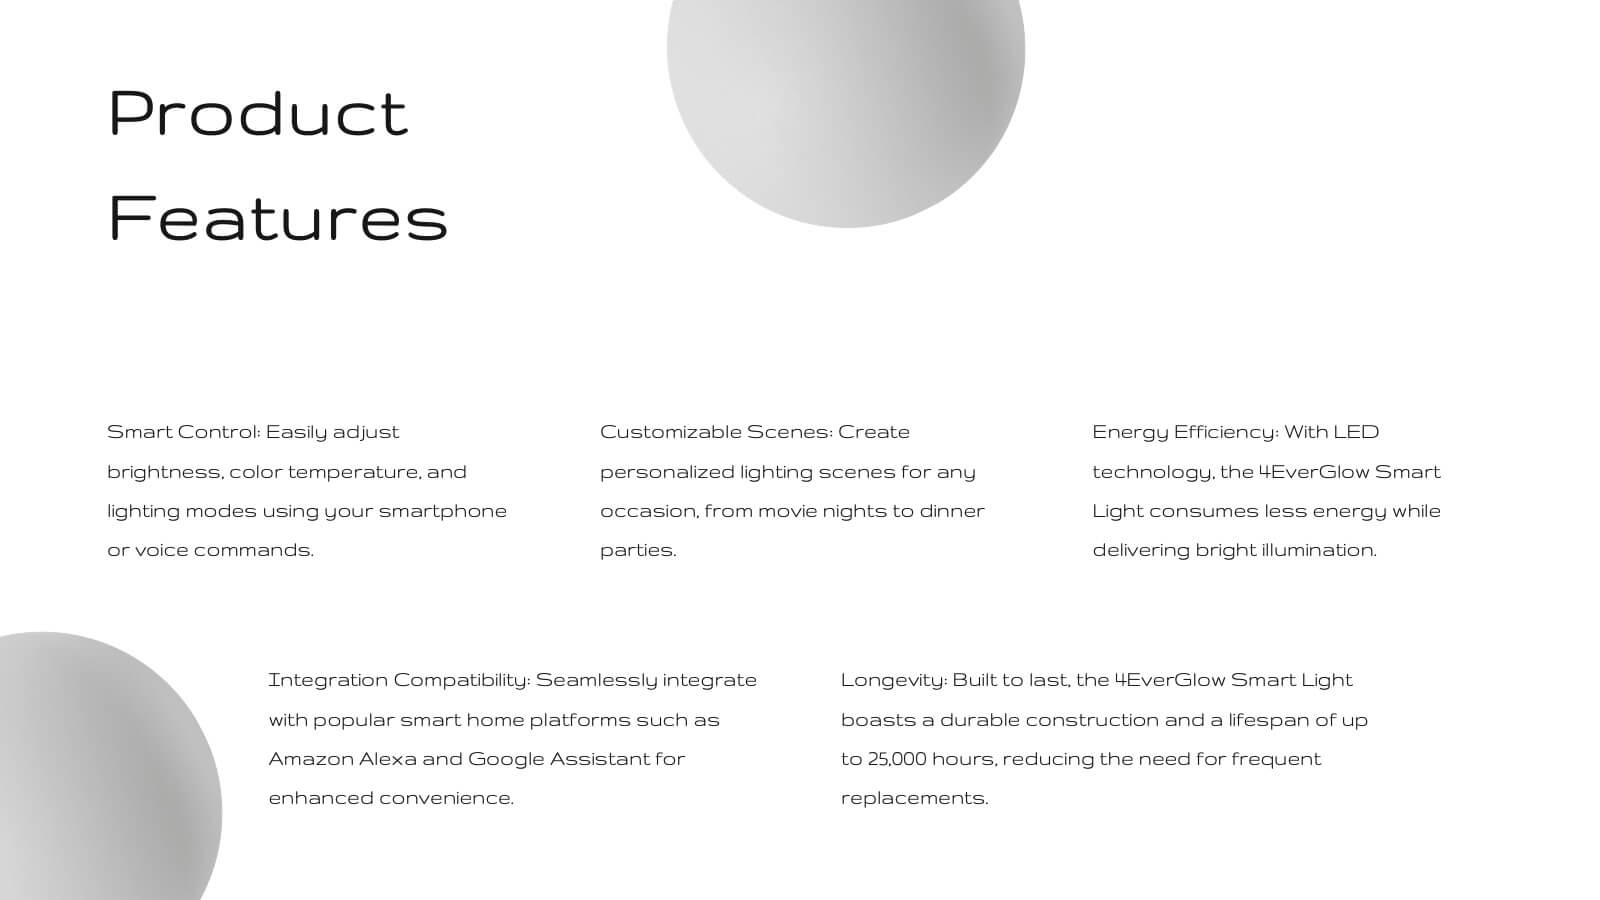
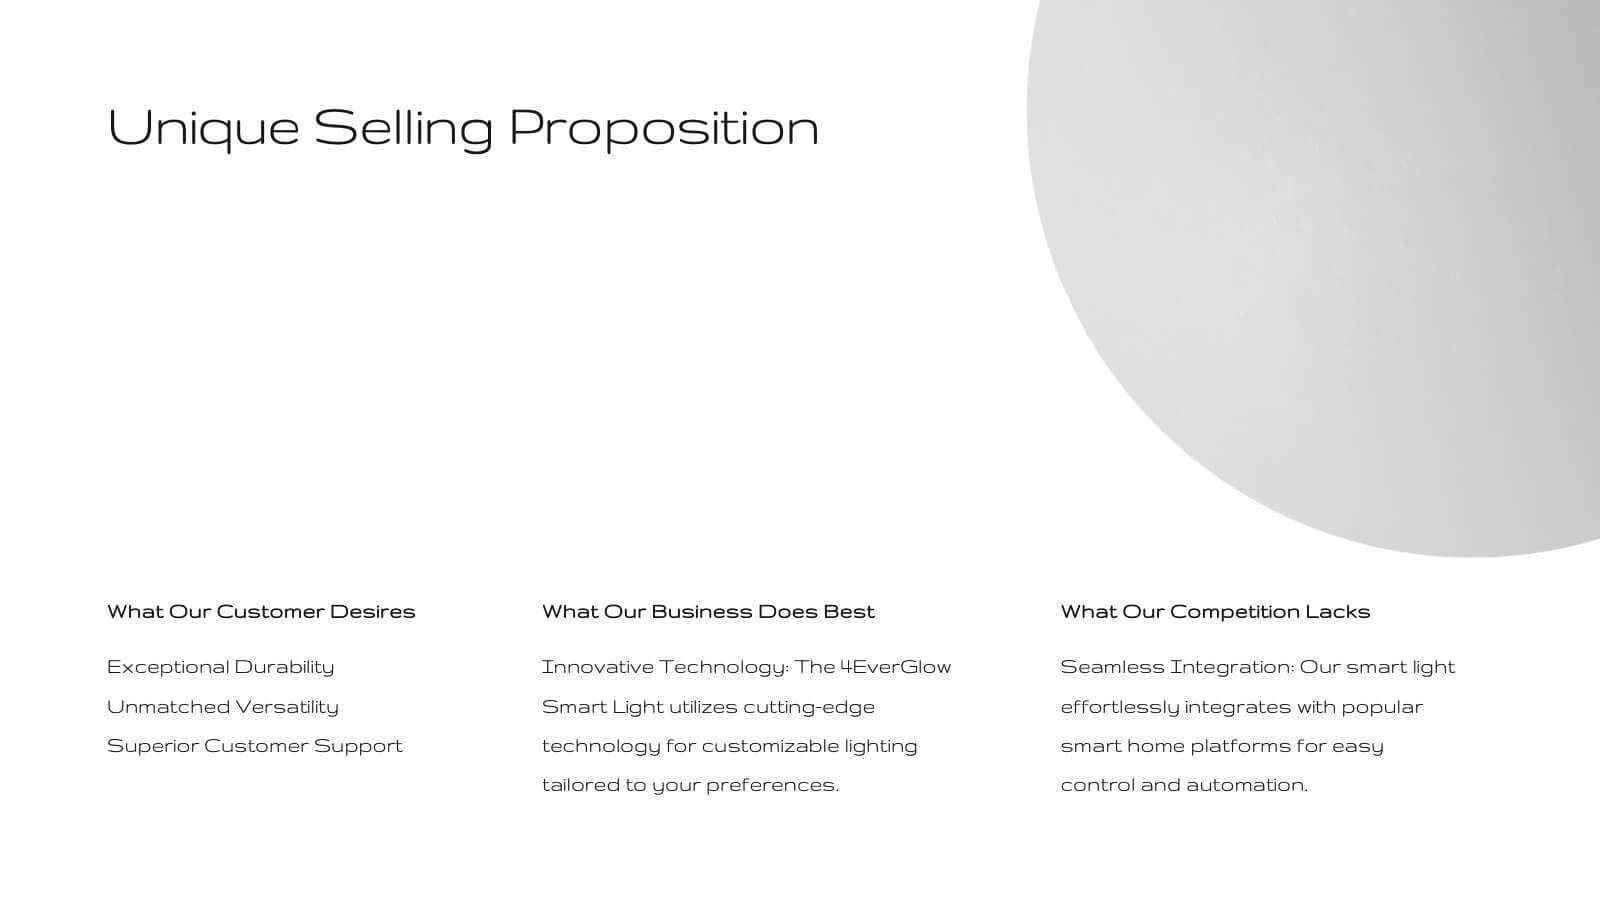
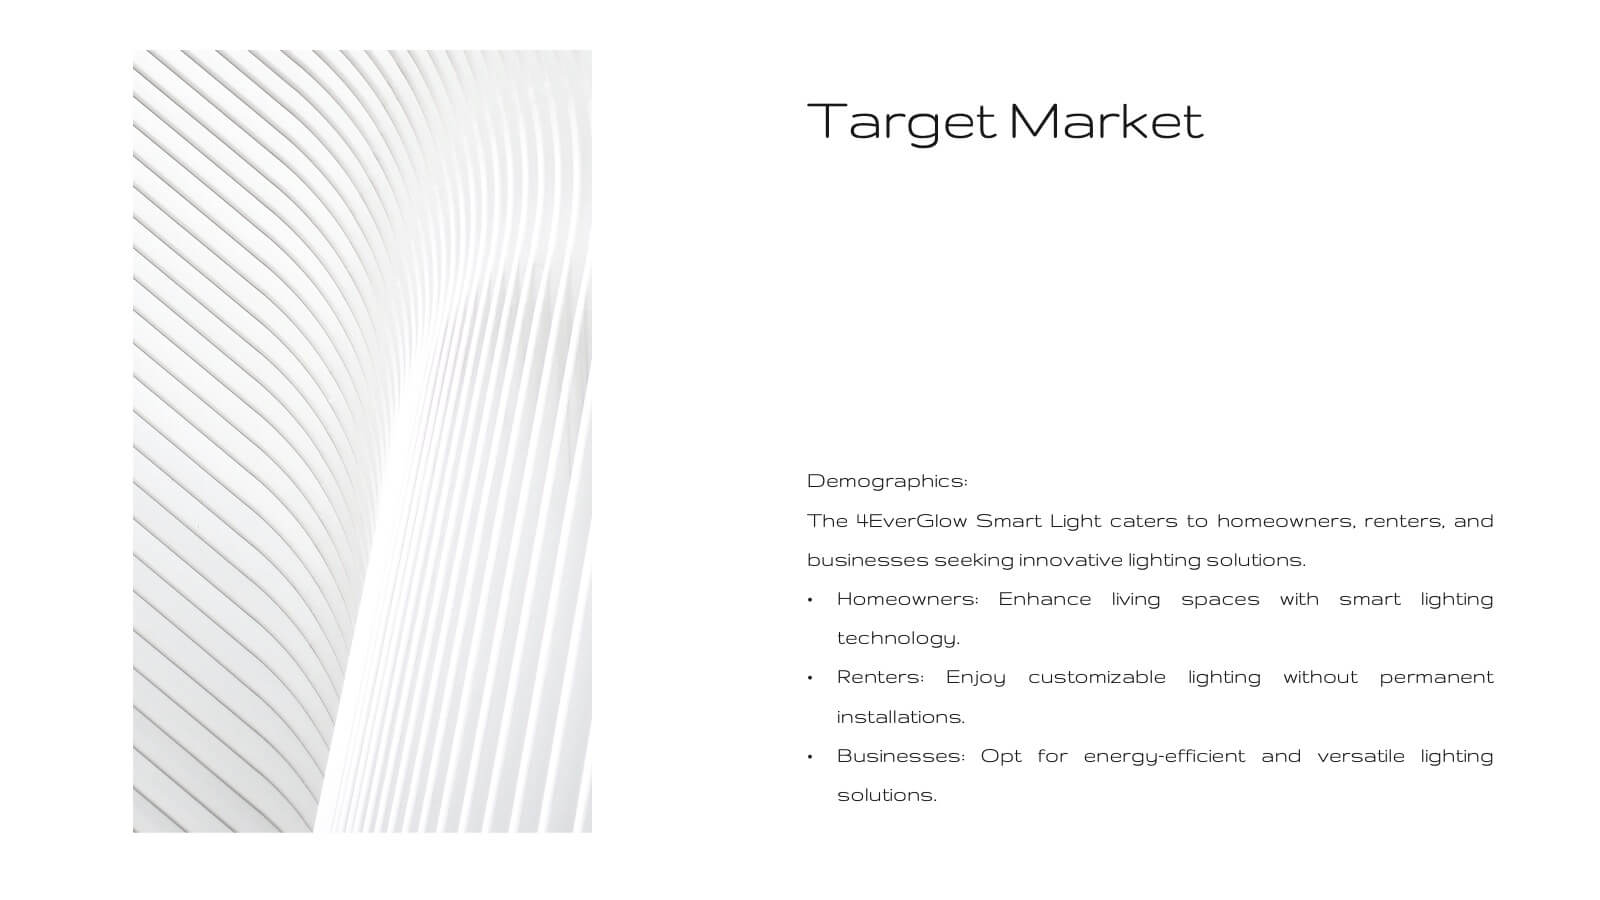
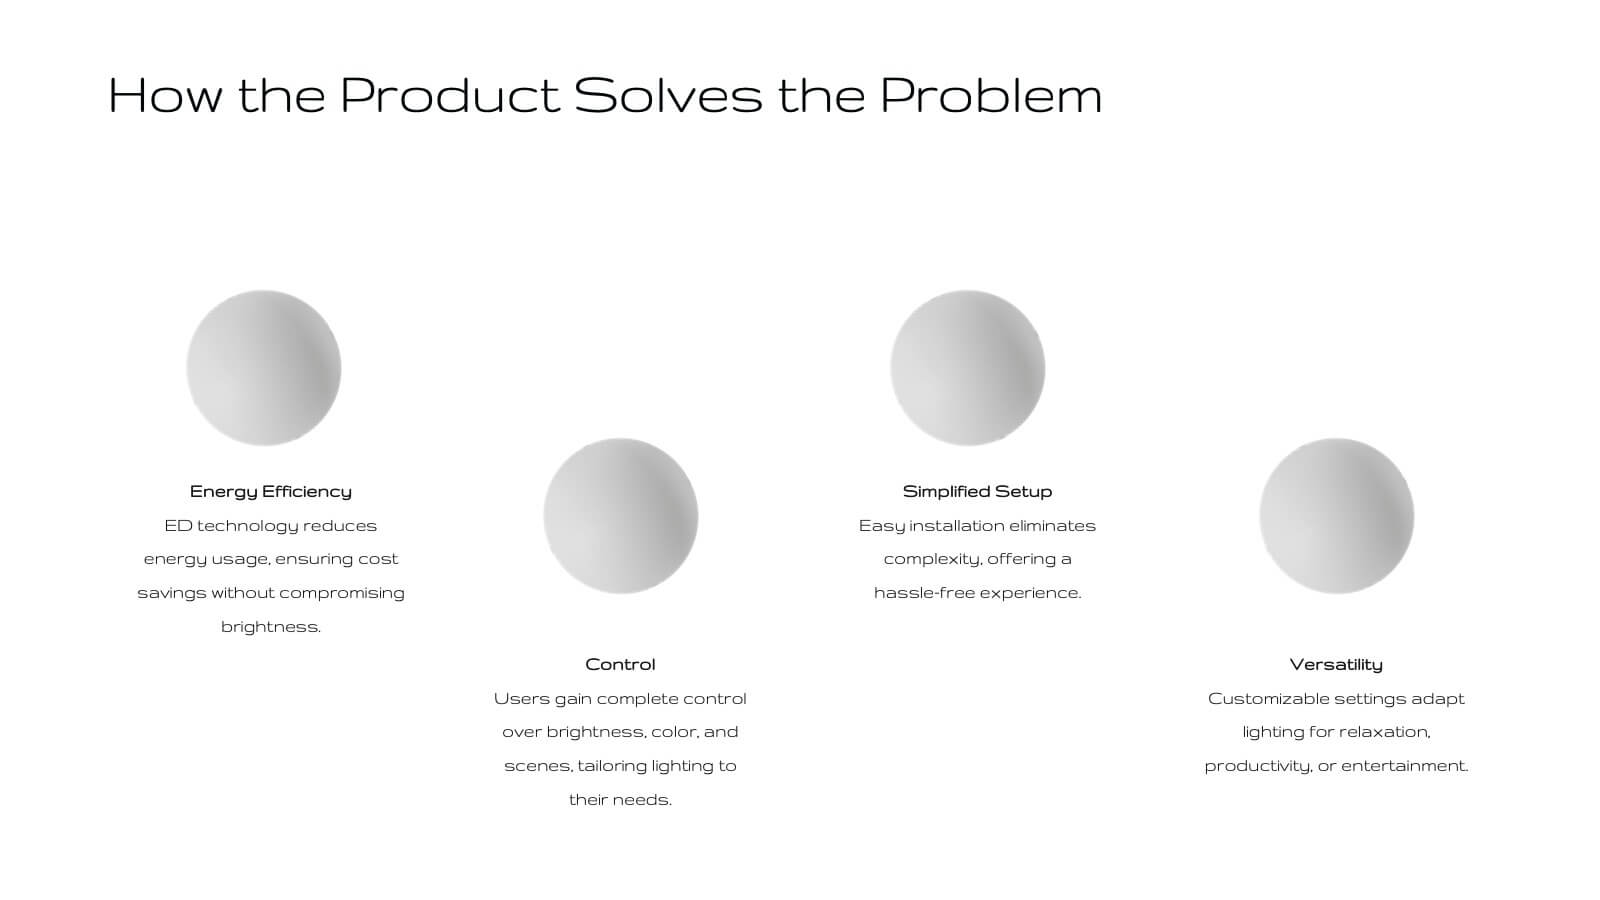
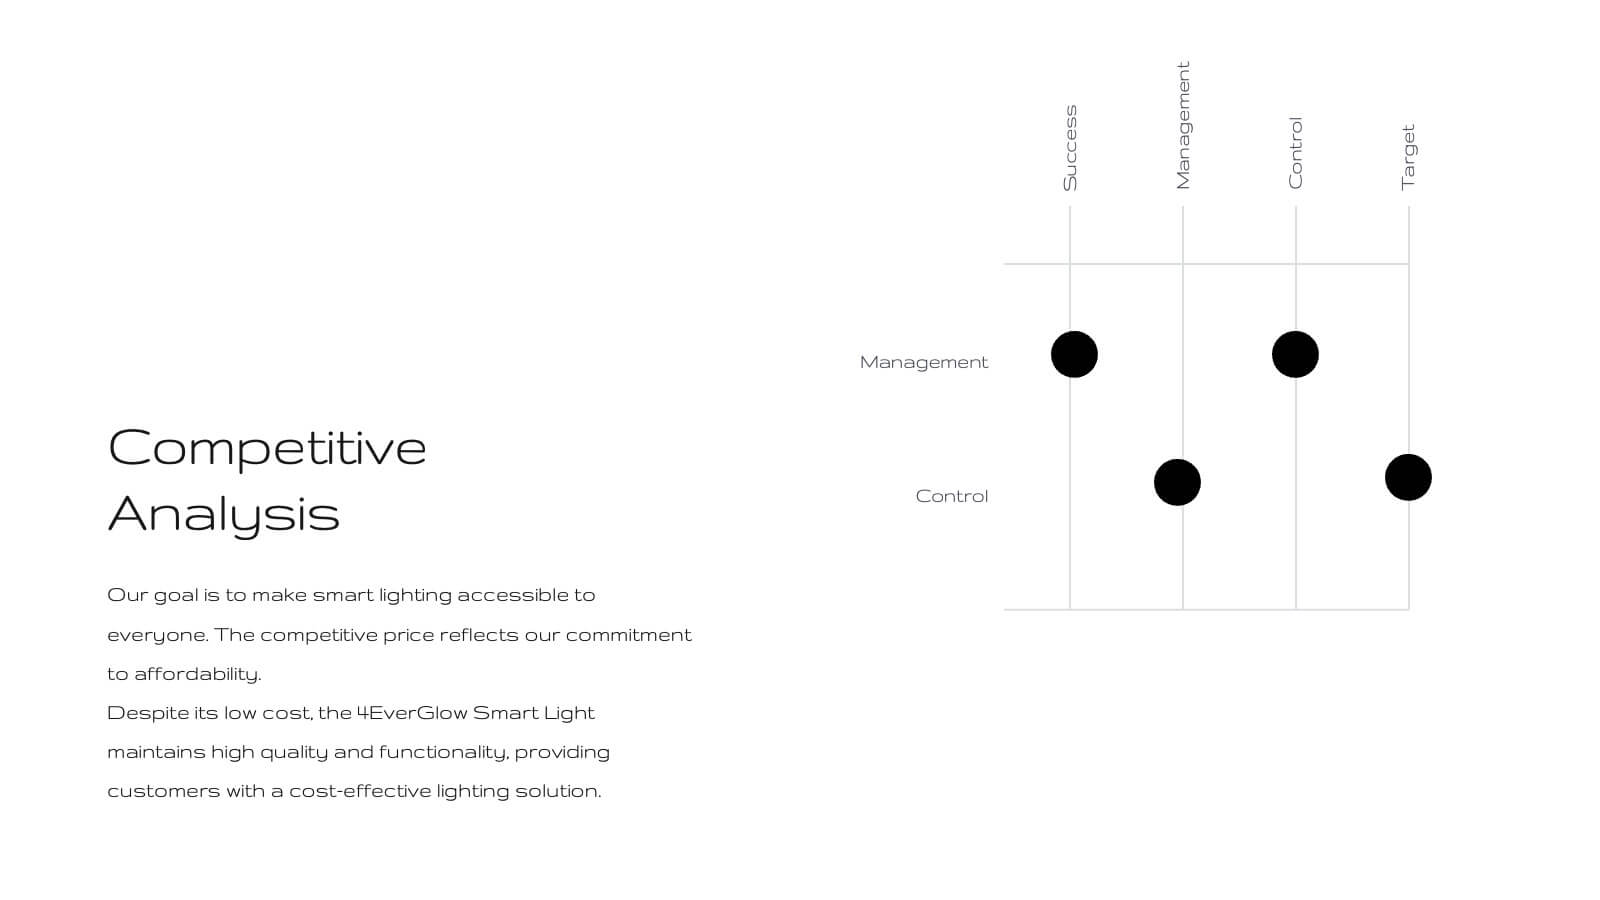
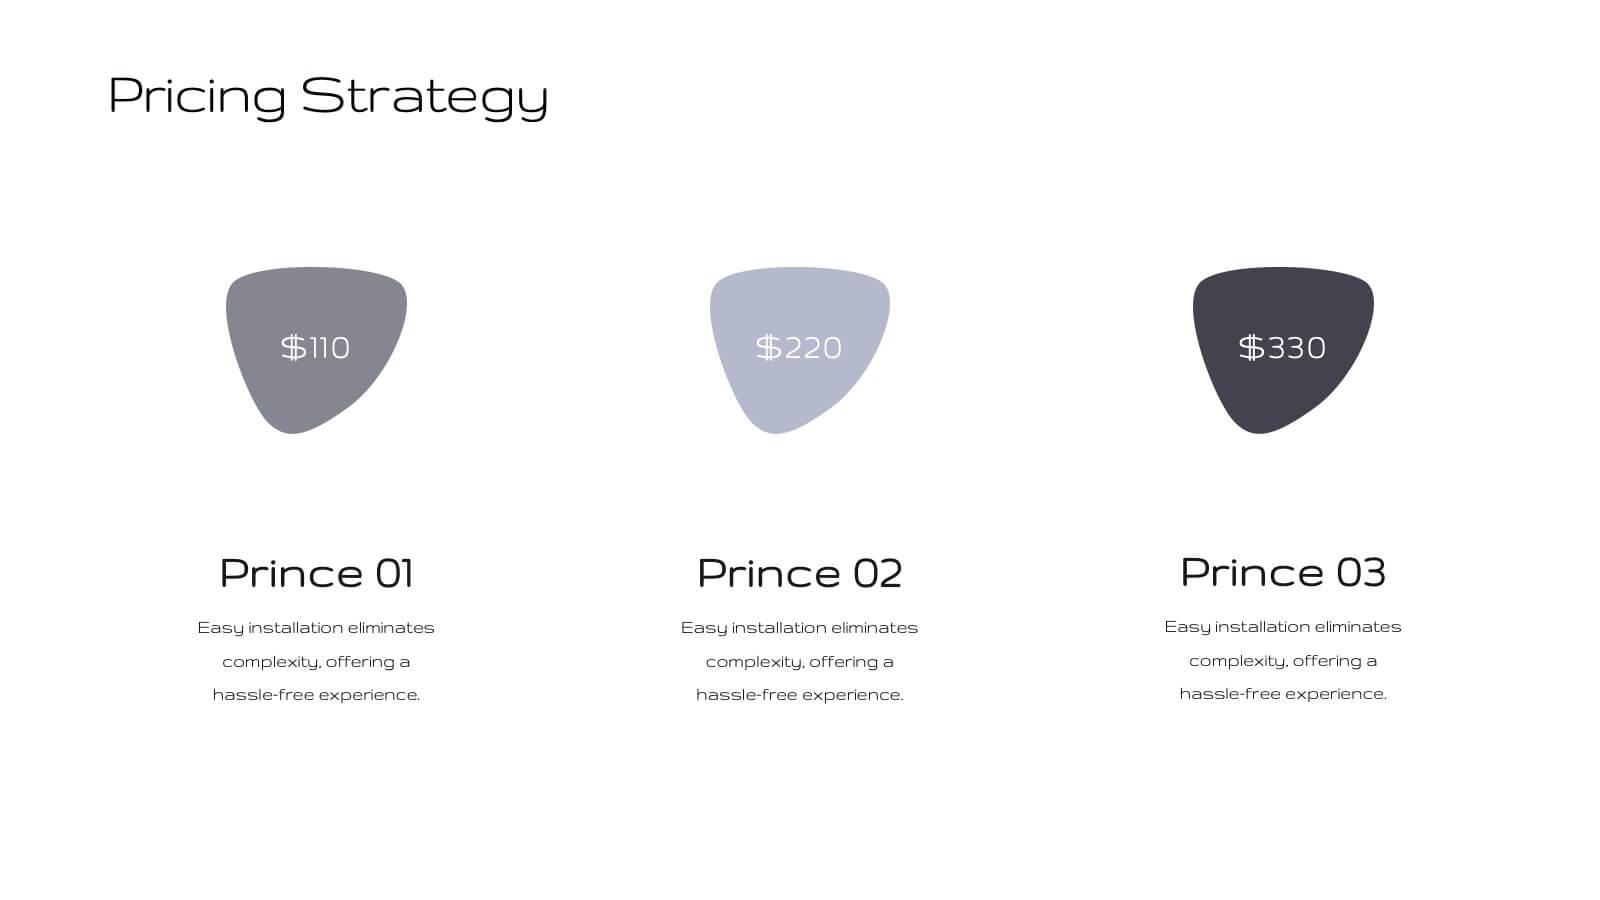
Fortuna Product Development Plan Presentation
Unveil your product's potential with this elegant, minimalist presentation template. Perfect for detailing product development, features, and market strategies, it features a clean design that emphasizes clarity and professionalism. Highlight key aspects like customer pain points, competitive analysis, and pricing strategies to captivate your audience. Compatible with PowerPoint, Keynote, and Google Slides, it ensures seamless presentations on any platform.


5 diapositivas
Marketing Strategy Wheel Diagram Presentation
Visualize your marketing framework in a clear and engaging way with this Marketing Strategy Wheel Diagram. Designed to highlight key components like audience targeting, communication channels, and campaign goals, this circular format brings strategy to life. Fully customizable and compatible with PowerPoint, Keynote, and Google Slides. Ideal for marketers, agencies, and branding professionals.


4 diapositivas
Content Calendar and Engagement Plan Presentation
Plan and track content effectively with this calendar-style engagement layout. Visualize posting frequency, engagement goals, and campaign performance in a single view. Ideal for content strategists and marketers managing social or editorial schedules. Fully editable in PowerPoint, Keynote, or Google Slides to suit your unique workflow and branding needs.


4 diapositivas
Banking Products and Credit Overview Presentation
Make your next presentation feel like a swipe of a card—clear, sleek, and purposeful. This layout is perfect for explaining the differences between financial products, highlighting banking services, and breaking down credit-related insights. Fully customizable and professionally designed for PowerPoint, Keynote, and Google Slides, it's ideal for any financial overview presentation.


4 diapositivas
Environmental Sustainability Presentation
Showcase sustainable strategies with this triangle-style infographic focused on Environmental Sustainability. Perfect for illustrating the relationship between ecological, economic, and social pillars. The arrow-based design emphasizes continuity and impact. Fully customizable and ideal for PowerPoint, Keynote, and Google Slides presentations.


26 diapositivas
E-commerce Presentation
Venture into the digital marketplace with a presentation template that embodies the innovative spirit of e-commerce. This template, with its vibrant colors and modern design elements, is tailored to highlight the fast-paced world of online retail. The slides offer a digital storefront for your ideas, from introducing the creative minds behind the operation to showcasing the latest trends in online shopping. Utilize engaging layouts to compare products, outline sales strategies, or highlight consumer behavior with clear, concise infographics. With promotional slide options to announce special deals and a design that captures the convenience and excitement of shopping with a click, this collection is an essential tool for marketers, online retailers, and startups. It’s optimized for conveying complex data in a user-friendly format, ensuring your audience stays engaged and informed. Compatible with PowerPoint, Keynote, and Google Slides, it’s the perfect cart to carry your message in the bustling online marketplace.


5 diapositivas
Business Activity Rotation Cycle Presentation
Showcase continuous workflows with the Business Activity Rotation Cycle Presentation. Ideal for operations, planning, and strategy meetings, this template visualizes multi-phase cycles with clean, editable layouts. Use it to outline repeated business functions, processes, or initiatives. Compatible with PowerPoint, Keynote, and Google Slides—perfect for consultants, teams, and business professionals.


6 diapositivas
Medical Anatomy Study Presentation
Present complex medical data with the Medical Anatomy Study infographic. Featuring a human body silhouette with key anatomical points and percentage-based insights, this slide is ideal for healthcare presentations, medical research, and educational purposes. Fully editable and compatible with PowerPoint, Keynote, and Google Slides.


7 diapositivas
South America Countries Map Infographic
This South America Countries Map infographic template is designed for detailed presentations on the geographical and statistical information of South American countries. Compatible with PowerPoint, Google Slides, and Keynote, the template set includes maps with data points indicating various statistics such as population percentages, and demographic information. Visual aids like pie charts, bar graphs, and icon representations help to depict data in an easily understandable manner. The color-coding and labels are clear, making it easy to differentiate between countries and regions. This template is ideal for educators, analysts, and business professionals needing to present country-specific data across South America.


5 diapositivas
Operational Process Logic Map
Visualize how every function interconnects with the Operational Process Logic Map Presentation. This template uses a radial node structure to break down workflows, responsibilities, or systems into logical clusters, showing how different units or steps interact within an operational framework. Each node is color-coded and icon-marked for clarity, ideal for explaining process flows, department roles, or system dependencies. Fully editable in PowerPoint, Keynote, and Google Slides.


7 diapositivas
Time Management Infographic Presentation Template
Time management skills are important in all aspects of life, not just work. Mastering time management allows you to get everything that you want out of your day. This time management template is the perfect tool to help you stay productive. Keep track of tasks, create a schedule and organize time where you need it most. Use this template to build a database of your weekly tasks, daily activities and recurring tasks that can be easily structured in a clock view. This time management template Is compatible with Powerpoint, Keynote, and Google Slides, so you can use it on any device.


25 diapositivas
Siren Rebranding Project Plan Presentation
This sleek brand presentation template covers essential elements like market analysis, brand guidelines, positioning, and audience insights. It's designed to showcase your brand identity and development strategies with a modern layout. Compatible with PowerPoint, Keynote, and Google Slides, it’s perfect for delivering professional and engaging brand presentations.


10 diapositivas
Marketing Wheels Strategy Presentation
Turn your marketing process into a powerful visual story with this dynamic circular design. Each stage connects seamlessly to highlight planning, execution, and performance insights. Perfect for illustrating campaigns, workflows, or business strategies. Fully customizable and compatible with PowerPoint, Keynote, and Google Slides for effortless editing and presentation.


3 diapositivas
Process Mapping with Tree Diagram Presentation
Optimize Your Workflow! The Process Mapping with Tree Diagram Presentation simplifies complex processes, illustrating decision paths and workflows in a clear, structured format. Perfect for business strategy, operations, and project planning, this fully editable template enhances understanding and efficiency. Compatible with PowerPoint, Keynote, and Google Slides, ensuring seamless customization.


7 diapositivas
Mission Statement Infographic
Present your organization's core values and goals with clarity using this collection of professionally designed slide templates. Each one is crafted to communicate key elements of your strategic vision effectively, combining aesthetic appeal with functional design to ensure your message resonates. Featuring a clean and professional layout, these slides emphasize the importance of your foundational principles. The balanced use of images and text is ideal for enhancing corporate presentations, stakeholder meetings, or team workshops. With various designs available, you can select the layout that best aligns with your branding and organizational ethos. These templates are fully customizable, allowing for adjustments in color, font, and imagery to perfectly articulate your core messages. They are an excellent tool for motivating your team, impressing stakeholders, and conveying the driving purpose behind your initiatives.


6 diapositivas
Blue Ocean Market Infographics
Dive into the concept of Blue Ocean Markets with our customizable infographic template. This template is fully compatible with popular presentation software like PowerPoint, Keynote, and Google Slides, allowing you to easily customize it to illustrate and communicate various aspects of Blue Ocean Strategy and market creation. The Blue Ocean Market infographic template offers a visually engaging platform to explain the principles, strategies, and advantages of creating new market spaces by focusing on innovation and value innovation. Whether you're a business leader, strategist, entrepreneur, or anyone interested in market expansion, this template provides a user-friendly canvas to create informative presentations and educational materials. Deepen your knowledge of Blue Ocean Markets with this SEO-optimized infographic template, thoughtfully designed for clarity and ease of use. Customize it to showcase the differentiation factors, examples of successful blue ocean strategies, and the shift from competition to uncontested market space, ensuring that your audience gains valuable insights into this innovative approach. Start crafting your personalized infographic today to explore the world of Blue Ocean Markets.


5 diapositivas
Corporate Ethics and Legal Guidelines
Clearly outline company policies and ethical standards with this organized and professional slide. Featuring a checklist-style layout with customizable categories, it’s ideal for corporate trainings, compliance presentations, and HR onboarding. Fully editable and compatible with PowerPoint, Keynote, and Google Slides.