


Características


¿Tienes alguna pregunta?
Recomendar


21 diapositivas
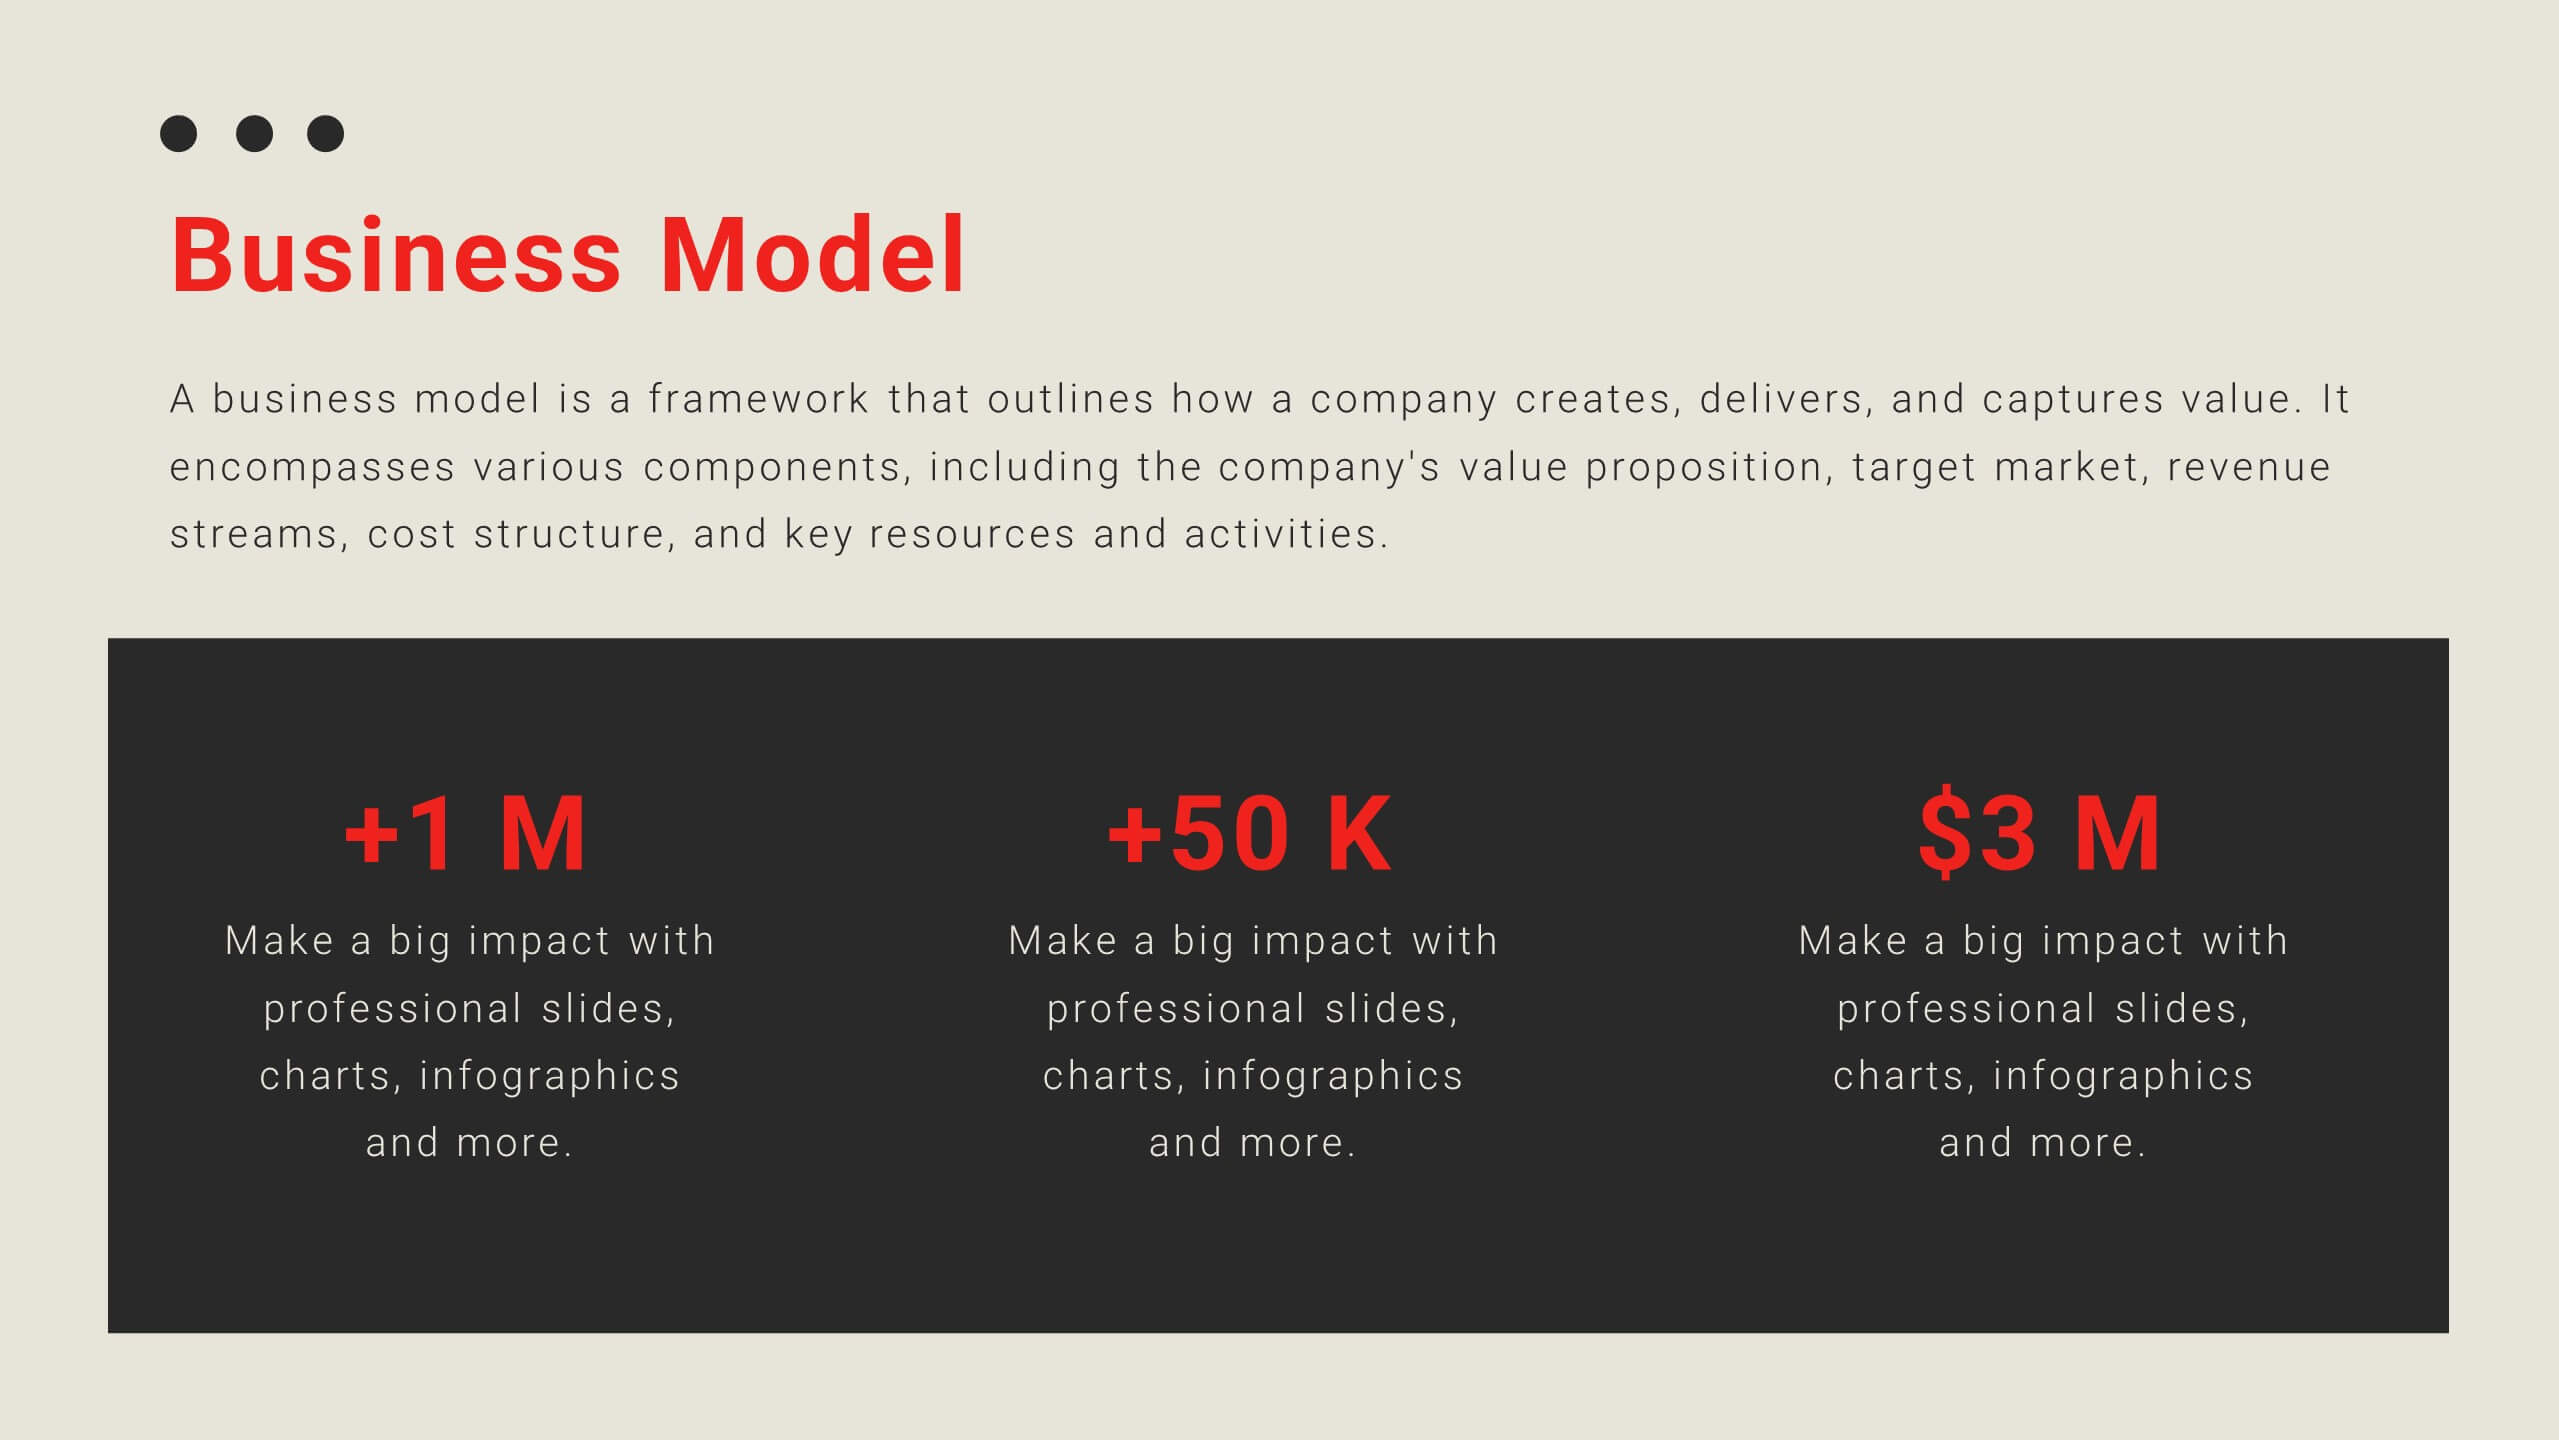
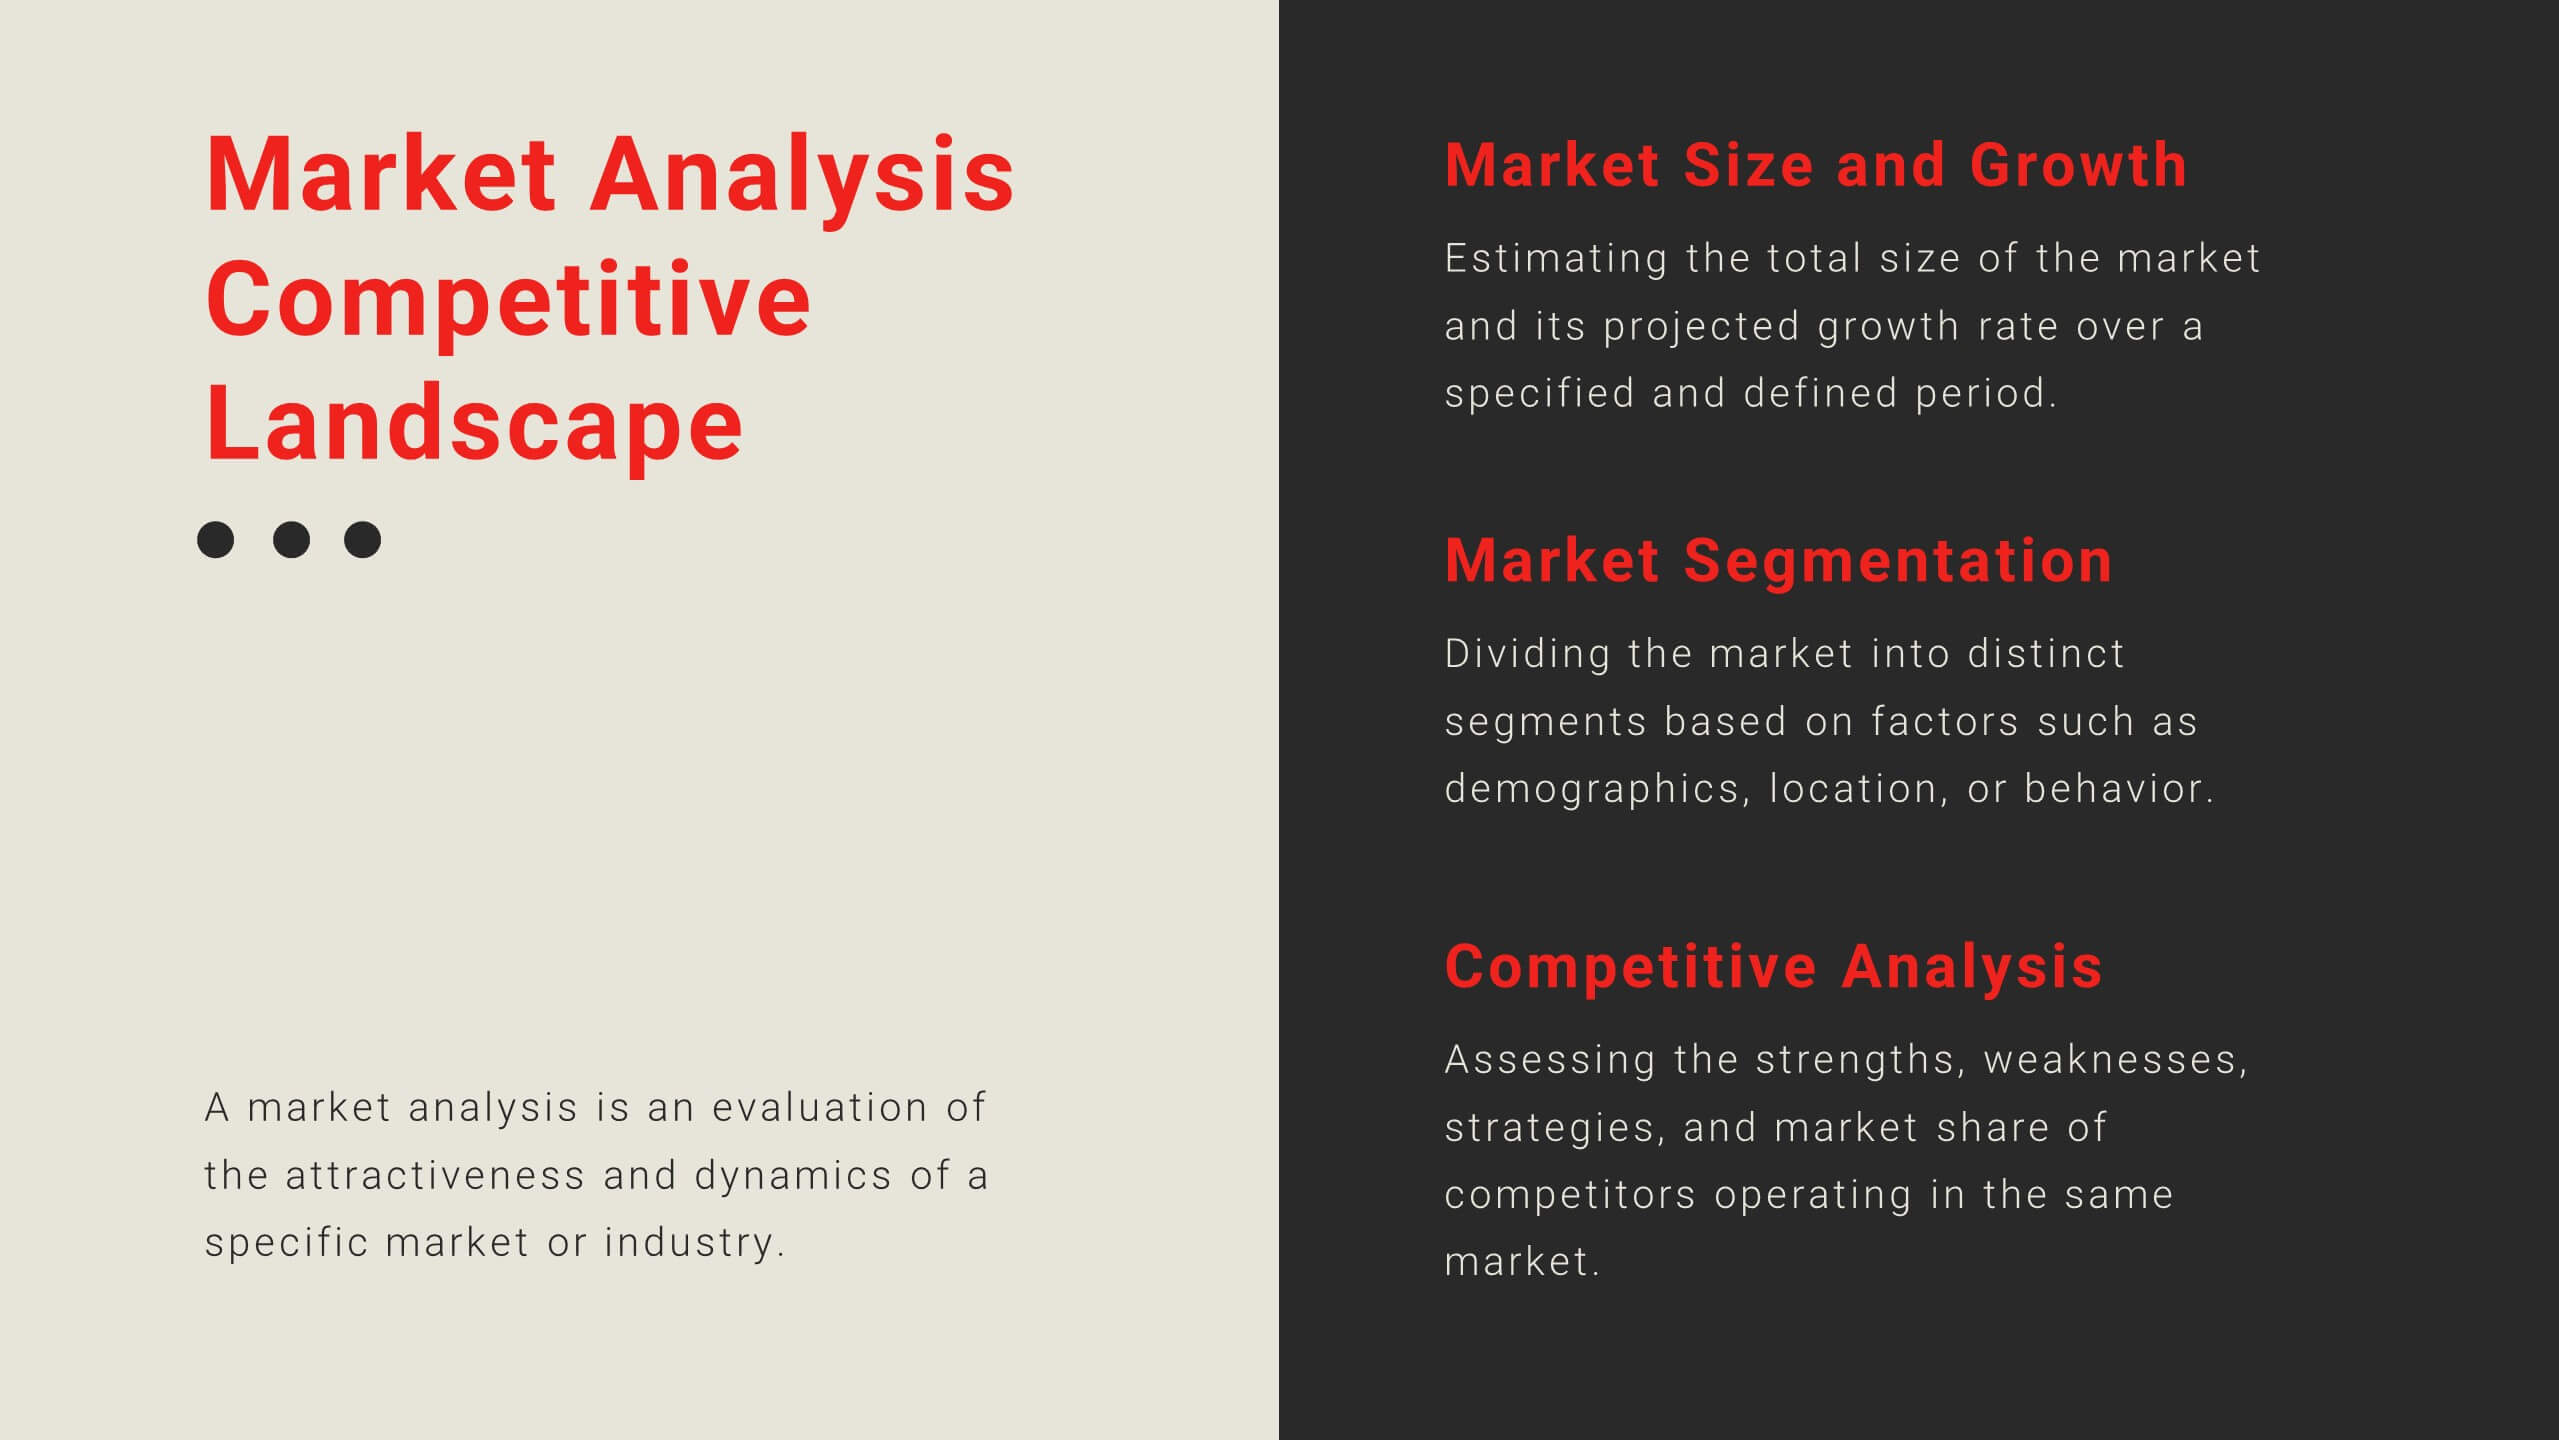
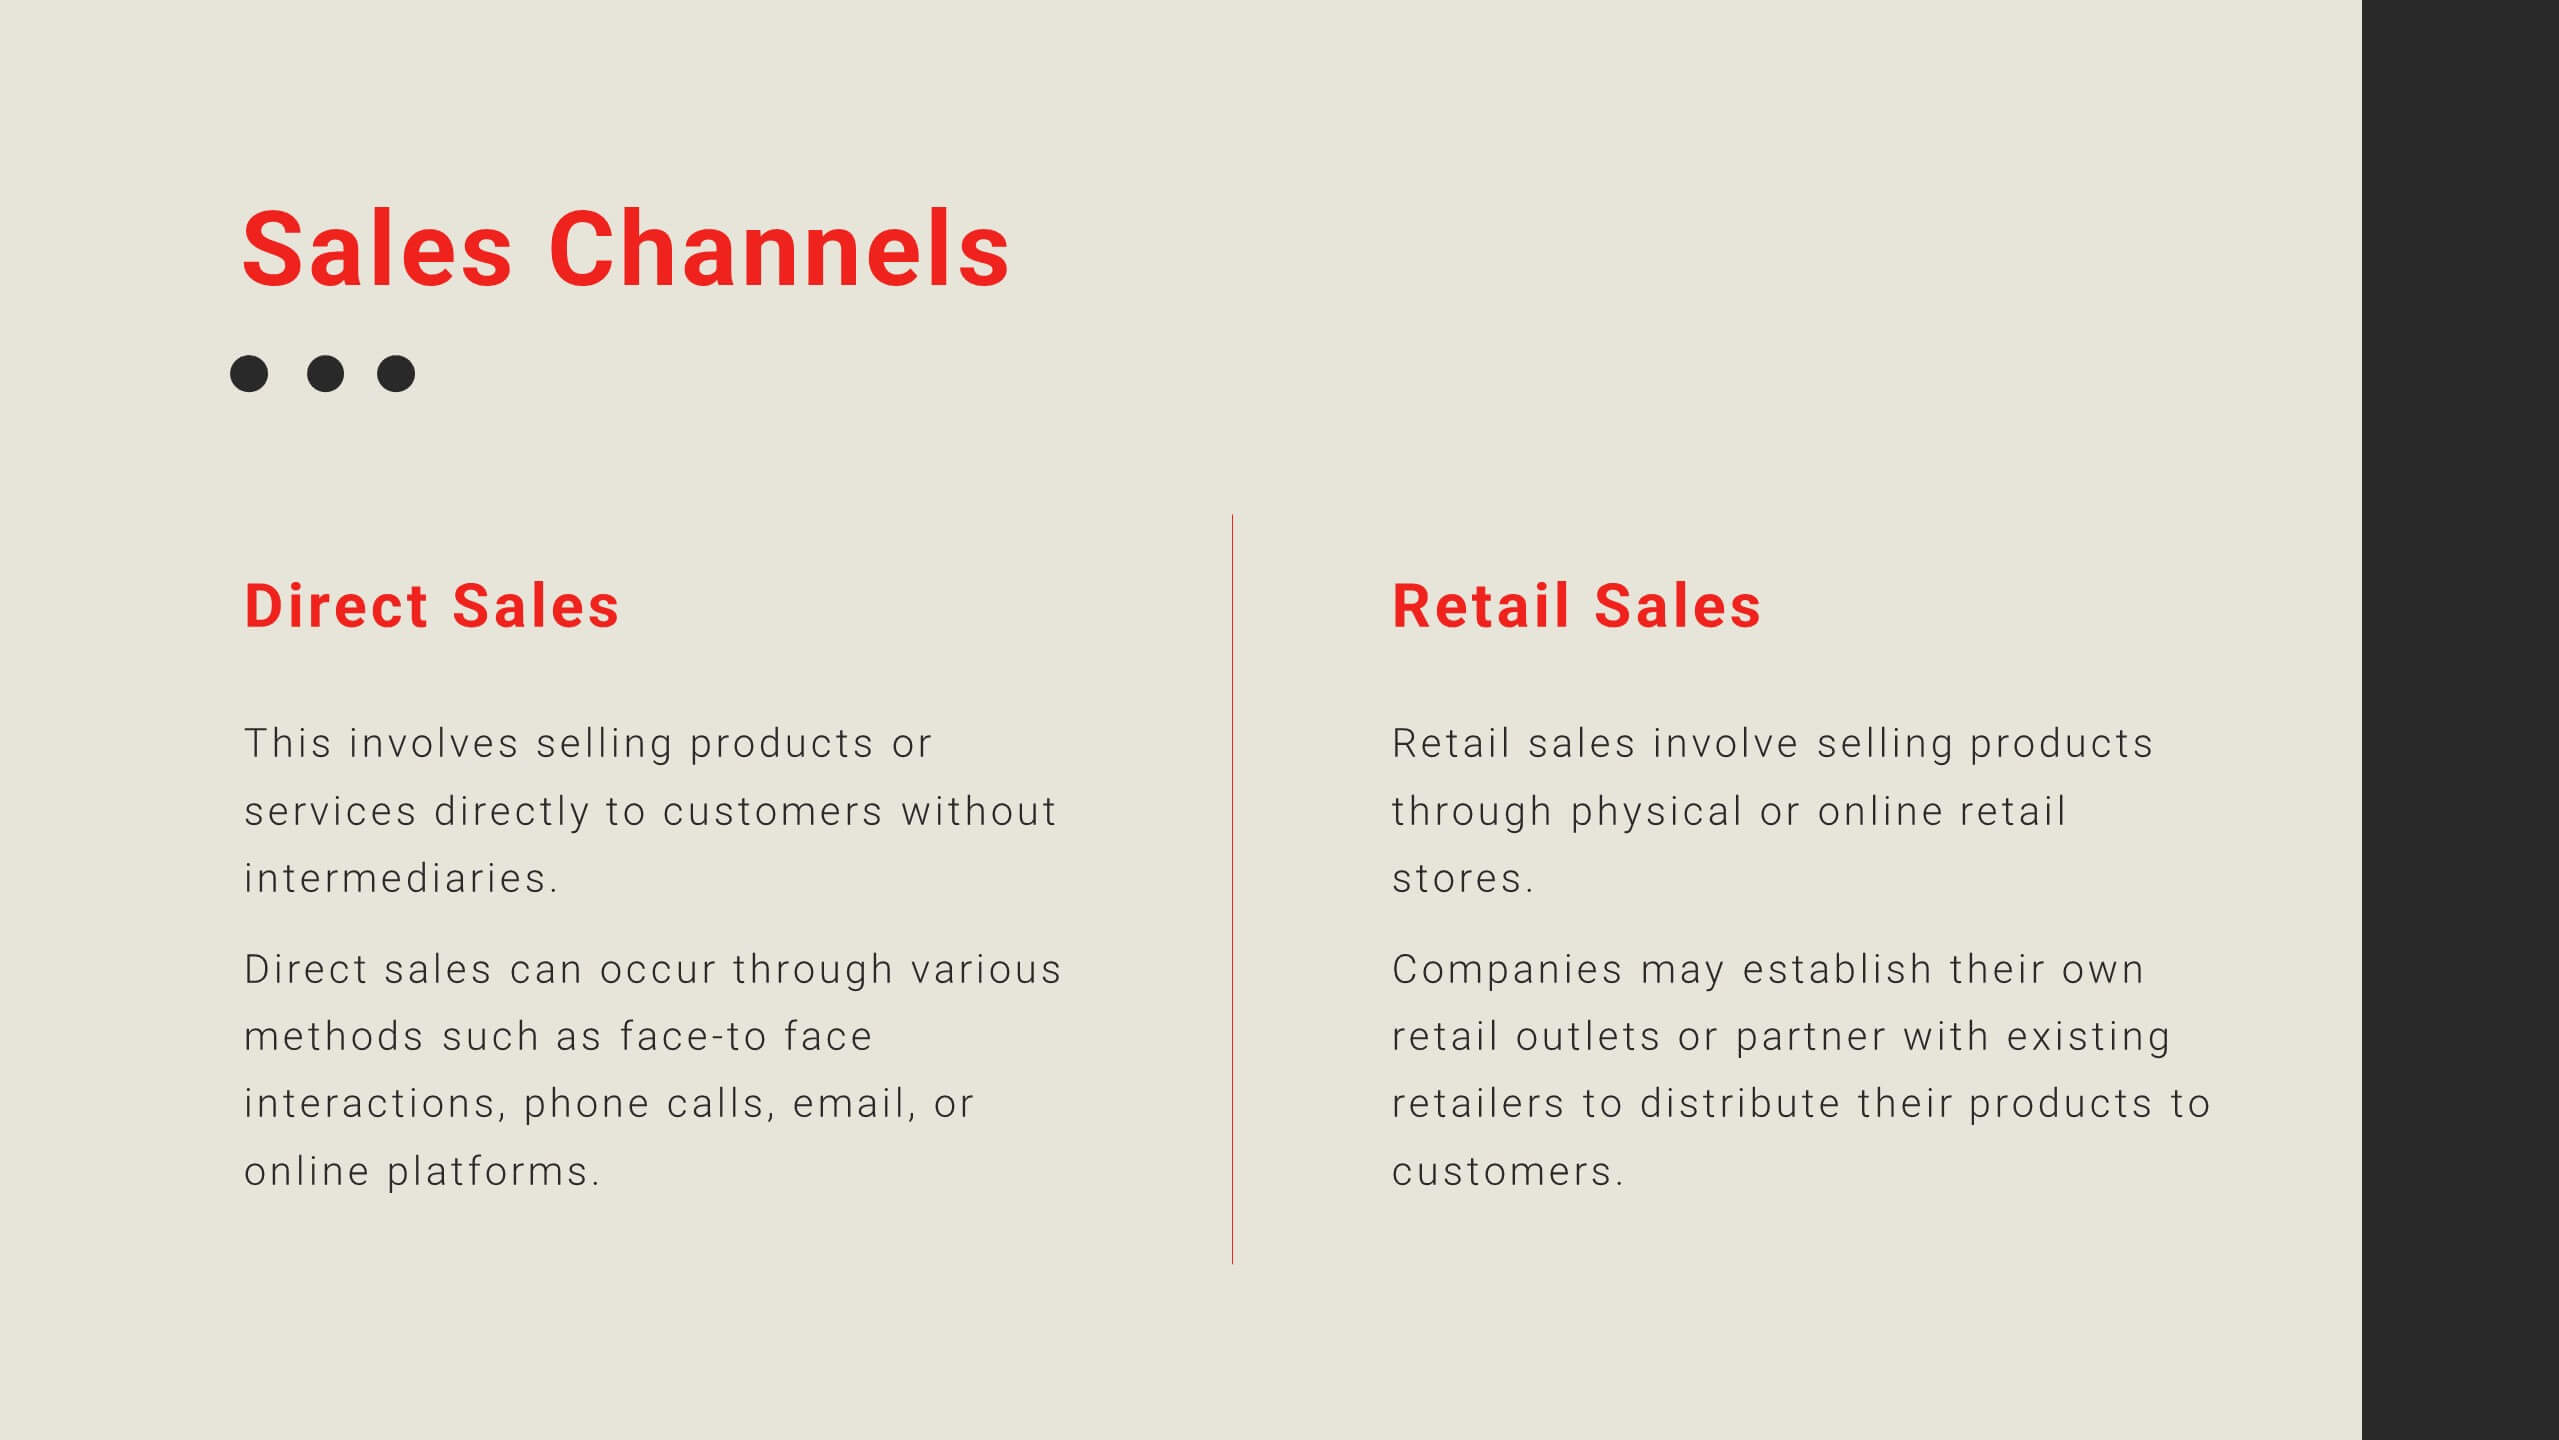
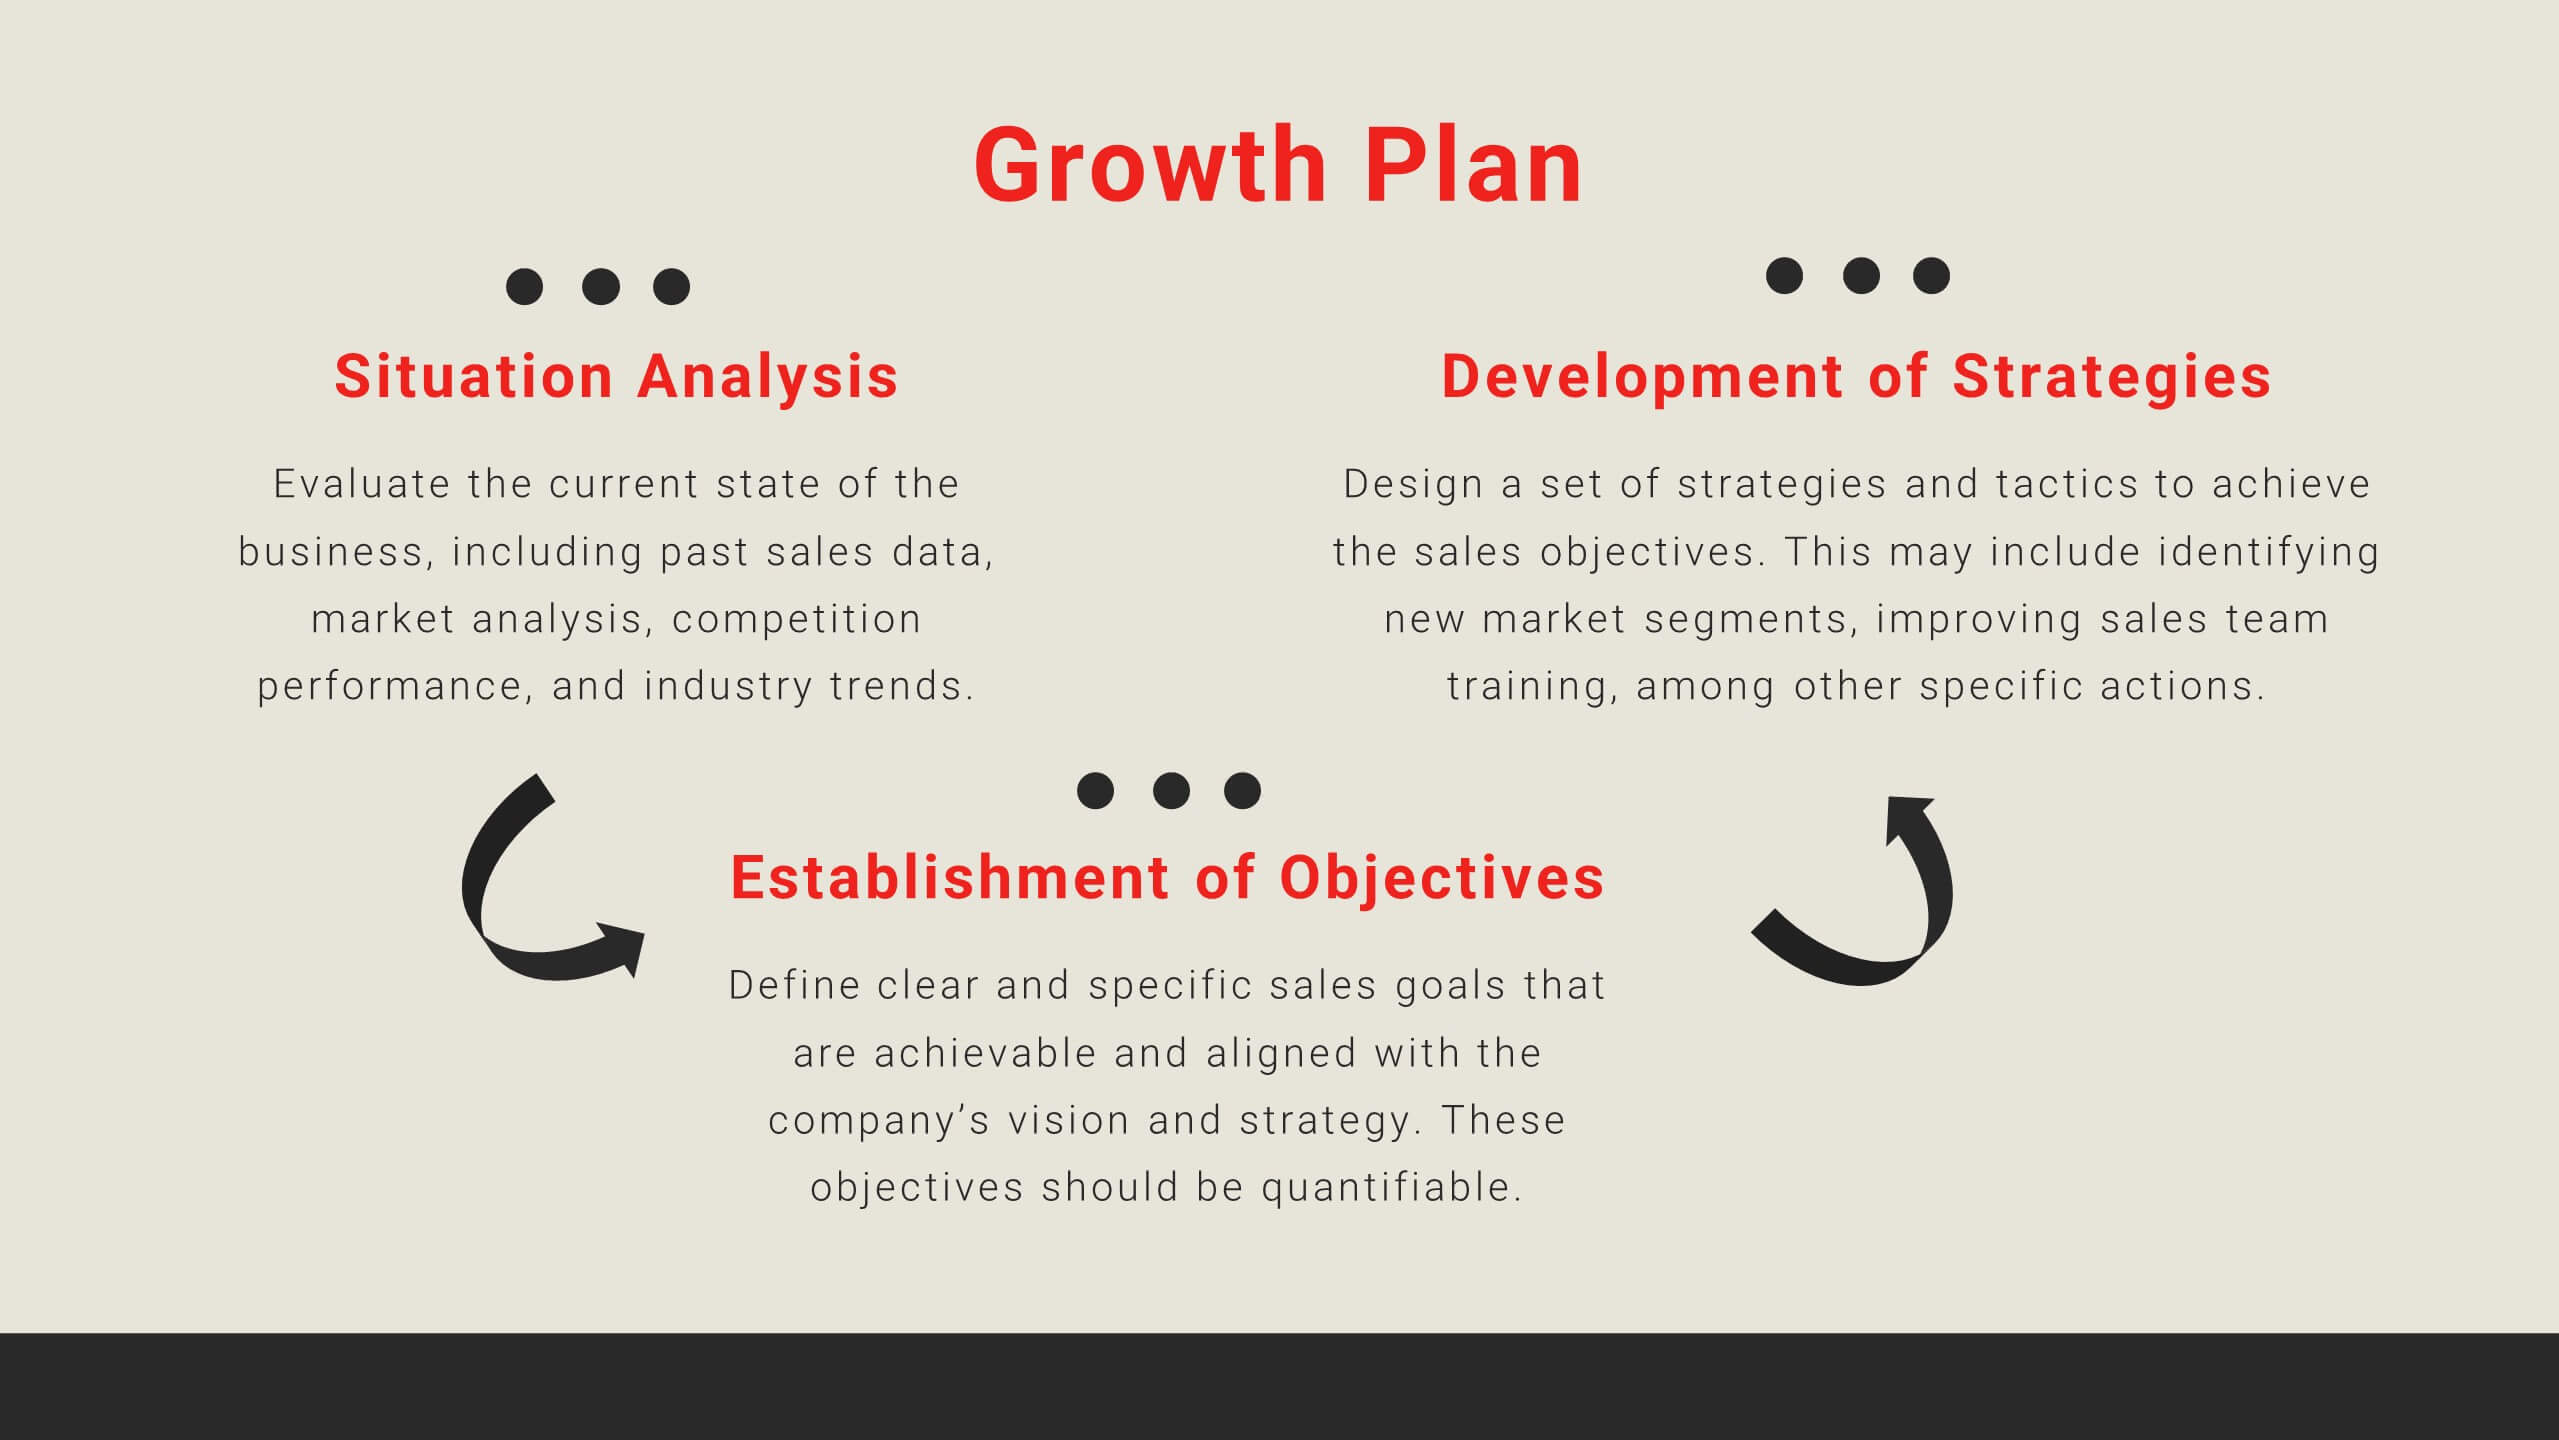
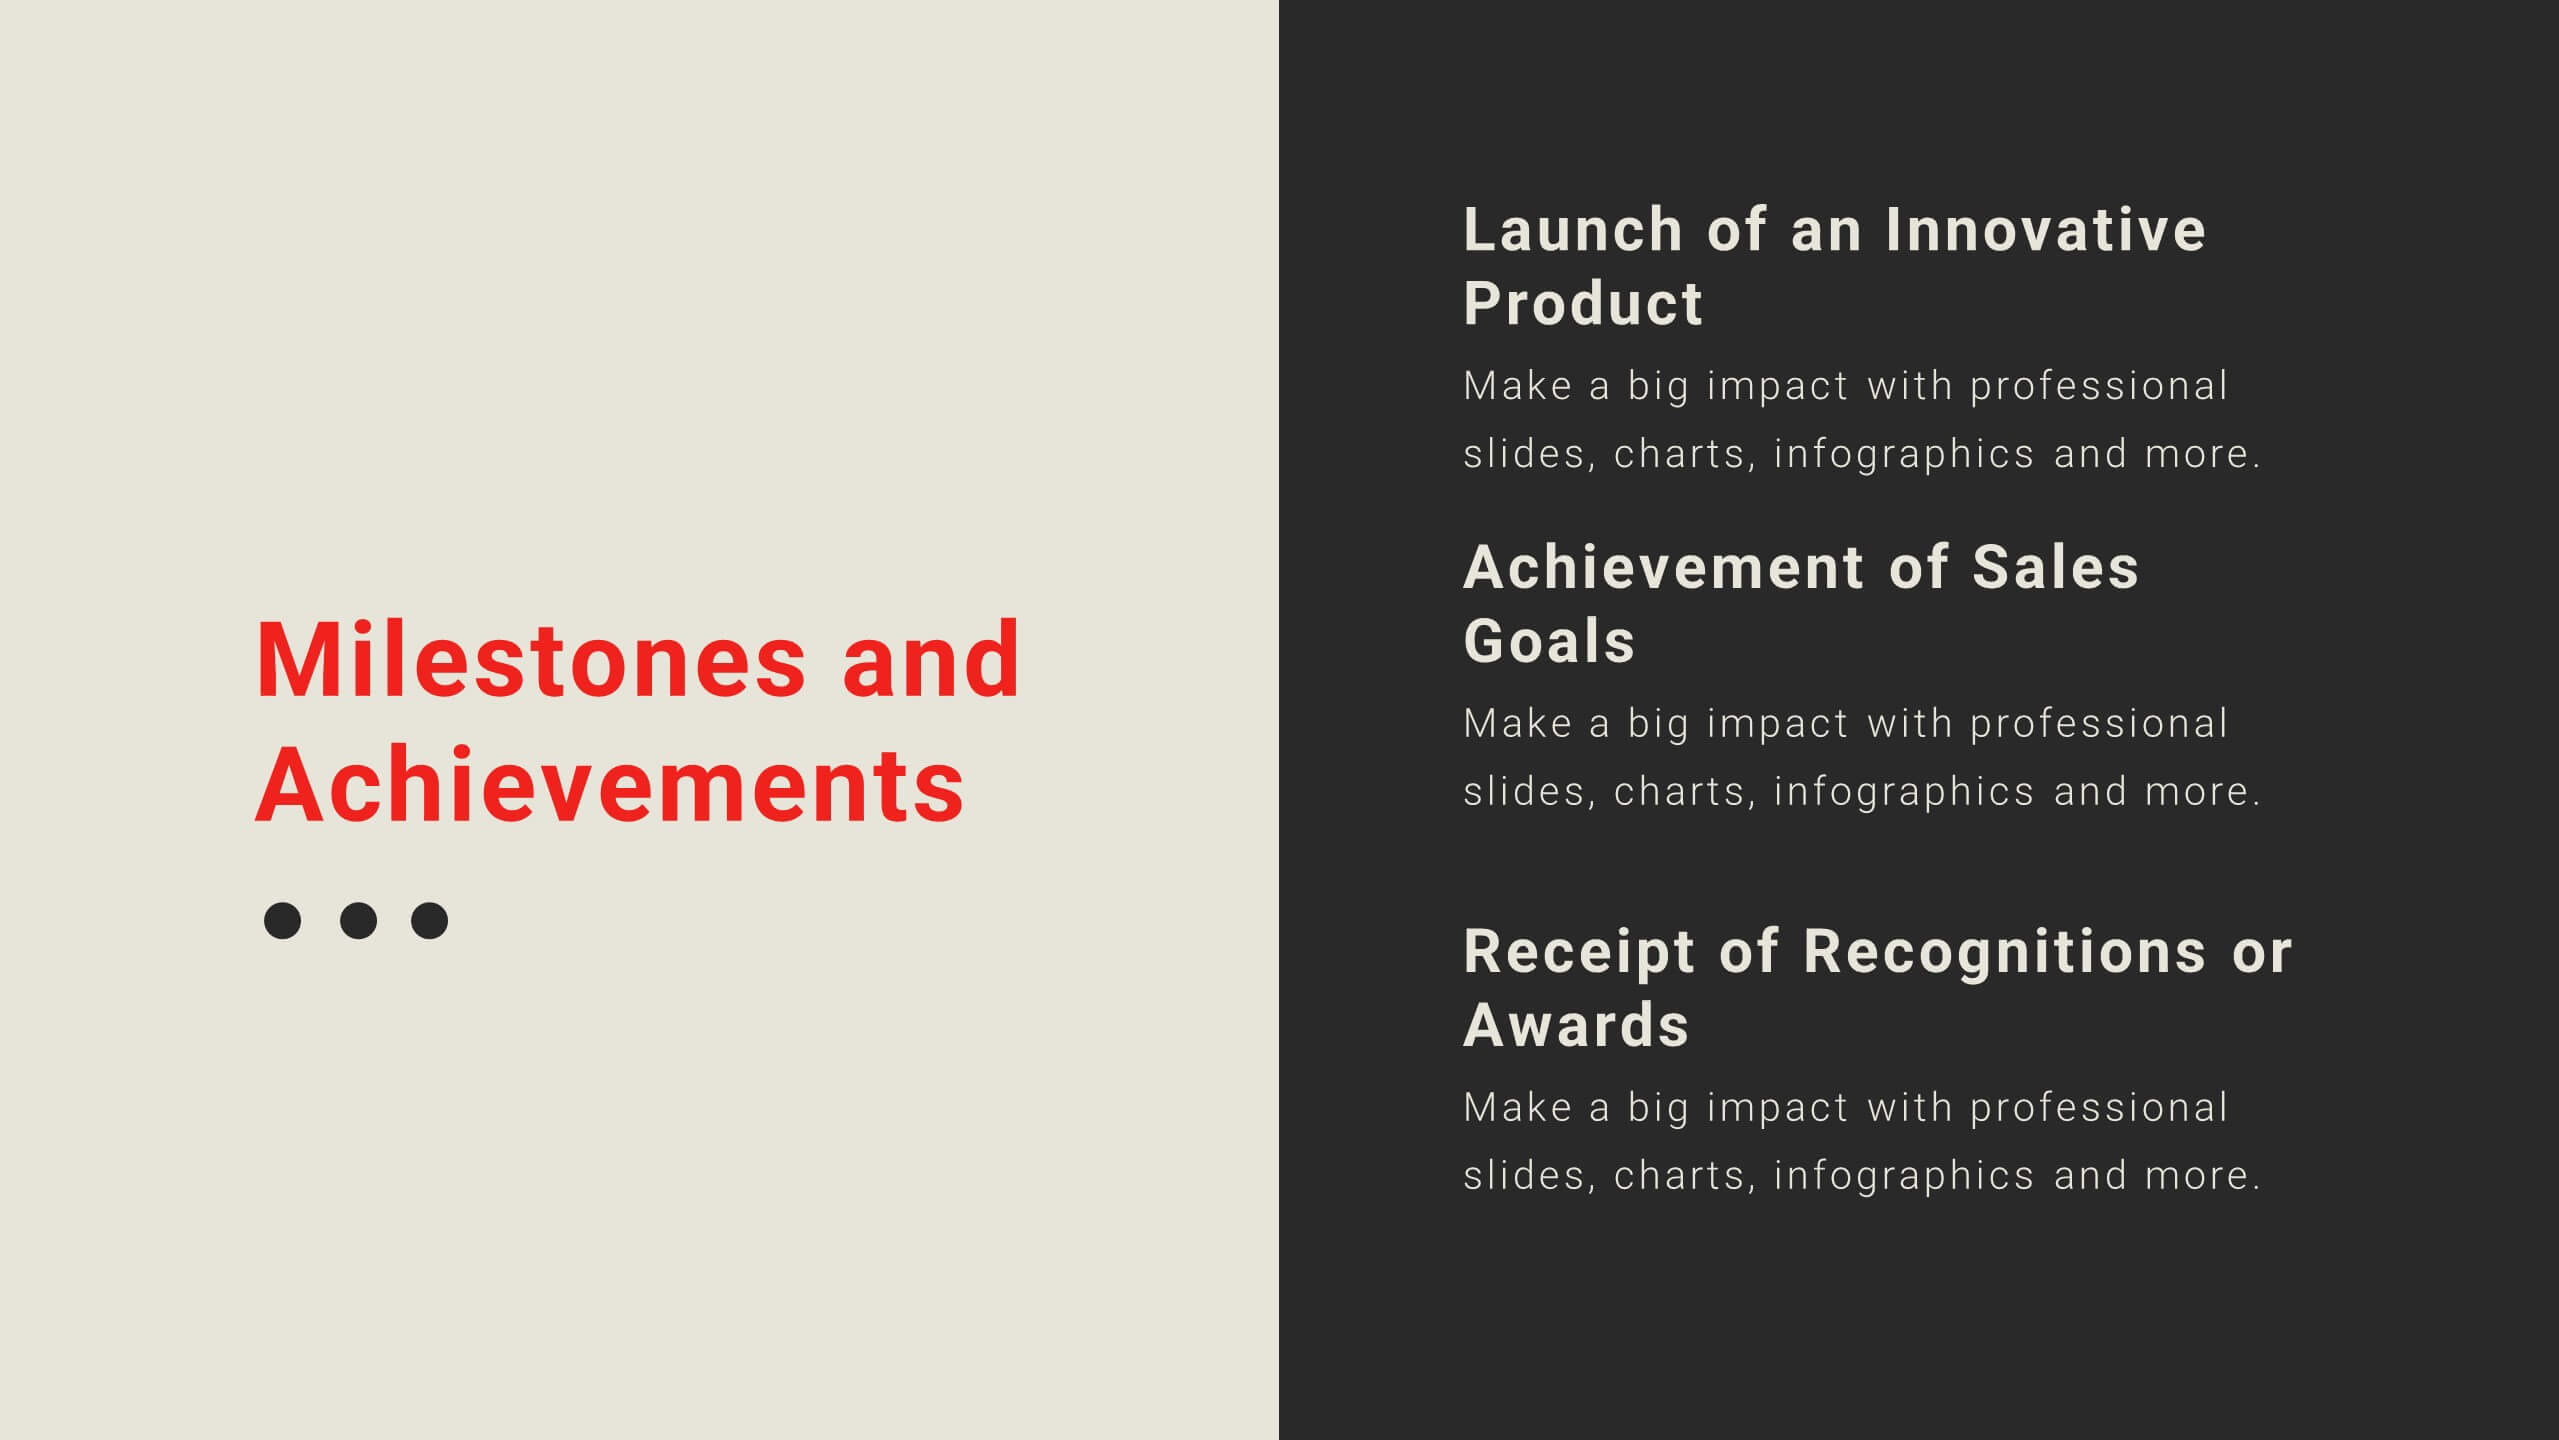
Velocity Startup Growth Plan Presentation
Accelerate your startup's growth with this dynamic plan template! Perfect for outlining your mission, vision, business model, and marketing strategy. Ideal for entrepreneurs aiming to secure funding and drive success. Compatible with PowerPoint, Keynote, and Google Slides, this template ensures your growth plan is clear, professional, and compelling. Achieve your startup goals today!


5 diapositivas
Side-by-Side Product Comparison Table Presentation
Clearly showcase differences with the Side-by-Side Product Comparison Table Presentation. This modern, easy-to-scan layout is perfect for comparing two features, services, or product options. Use icons and color highlights to emphasize key advantages. Ideal for marketing, sales decks, or client proposals. Compatible with PowerPoint, Keynote, Canva, and Google Slides.


6 diapositivas
Website Optimization and Traffic Insights Presentation
This infographic set helps break down complex analytics into bite-sized, visually engaging pieces. Use these slides to highlight traffic sources, performance metrics, user journeys, and conversion flows in a circular format that keeps viewers focused. These templates are fully customizable and compatible with PowerPoint, Keynote, and Google Slides.


4 diapositivas
Governance Practices for Risk Mitigation Presentation
Break down your risk strategy with the Governance Practices for Risk Mitigation Presentation. This slide features a step-stair 3D block visual, ideal for illustrating layered compliance initiatives, control measures, and escalation paths. Perfect for corporate governance teams, compliance officers, and strategic risk planners. Fully editable in PowerPoint, Keynote, and Google Slides.


7 diapositivas
Network Infographics Presentation Template
Networking is a great way to meet people in your same field and gain valuable information. It's a great way to meet and connect with other professionals, find out about job opportunities, and keep up with what's new in your field. This template is perfect for becoming informed on the benefits of networking. Networking is a powerful way to expand your circle of contacts and get in touch with people who can help you advance in your career. This template includes a helpful infographic that explains the standard process, visualizations and diagrams, providing you with a great starting point.


4 diapositivas
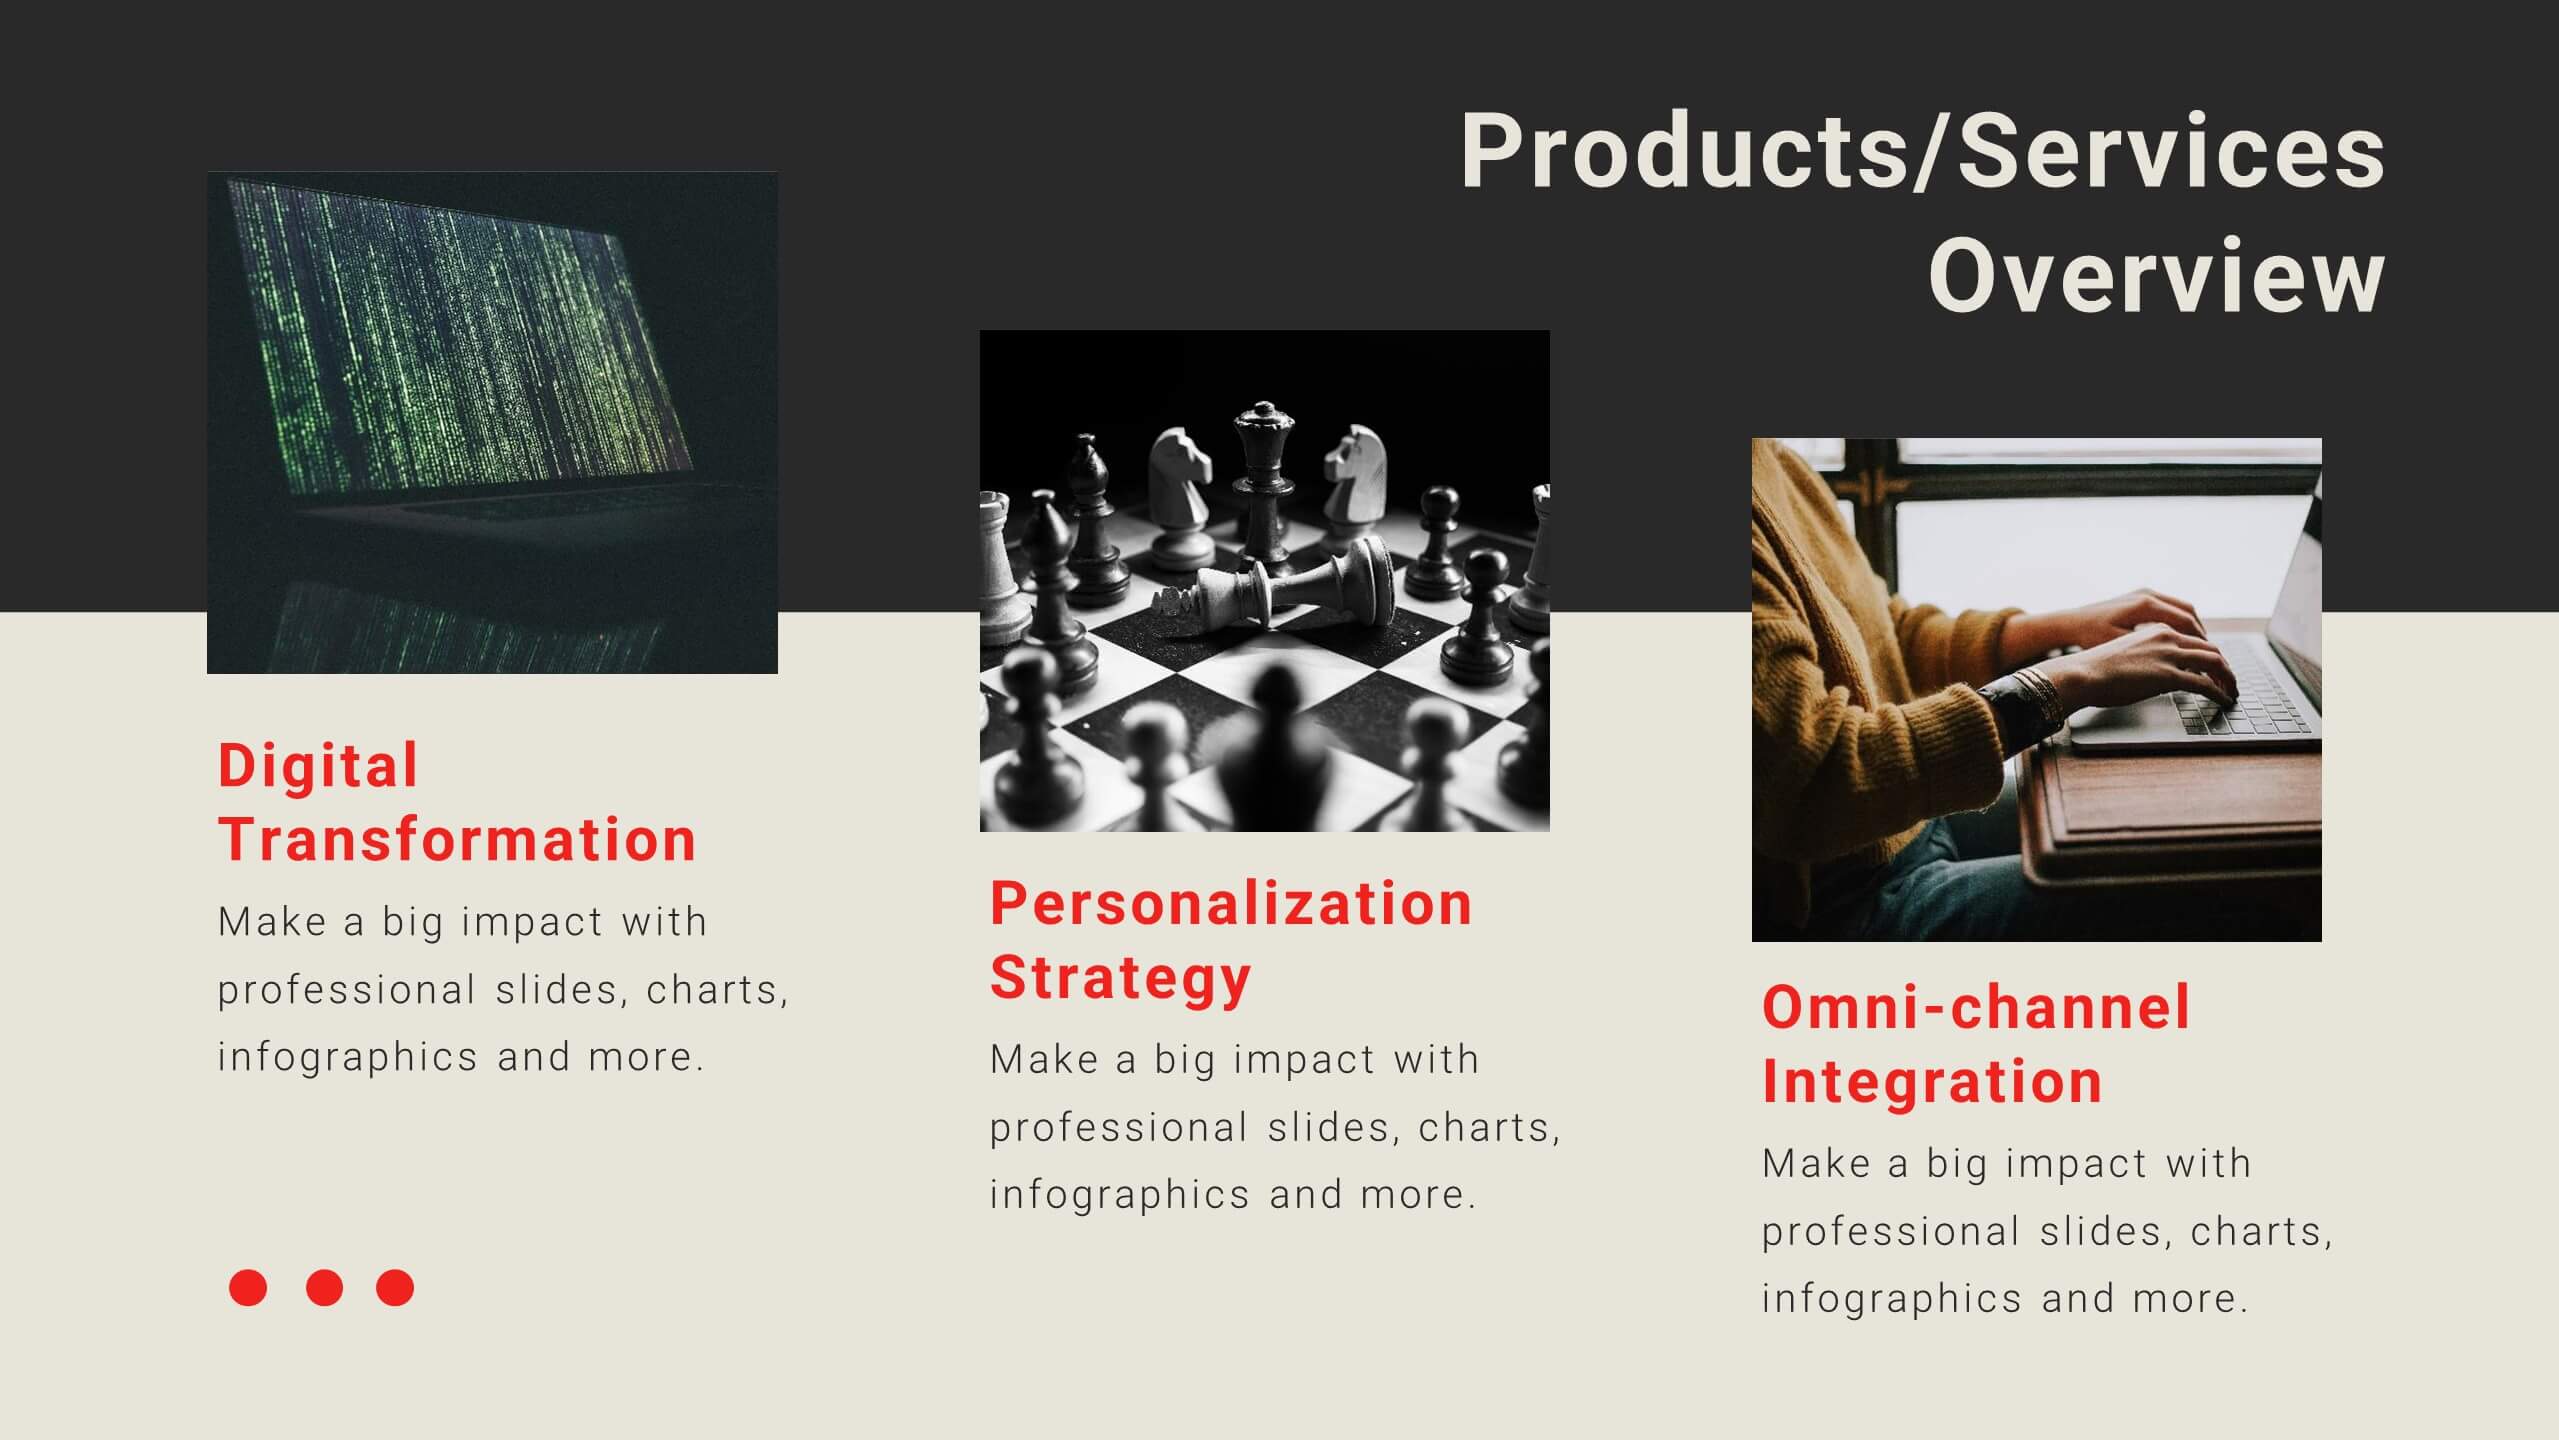
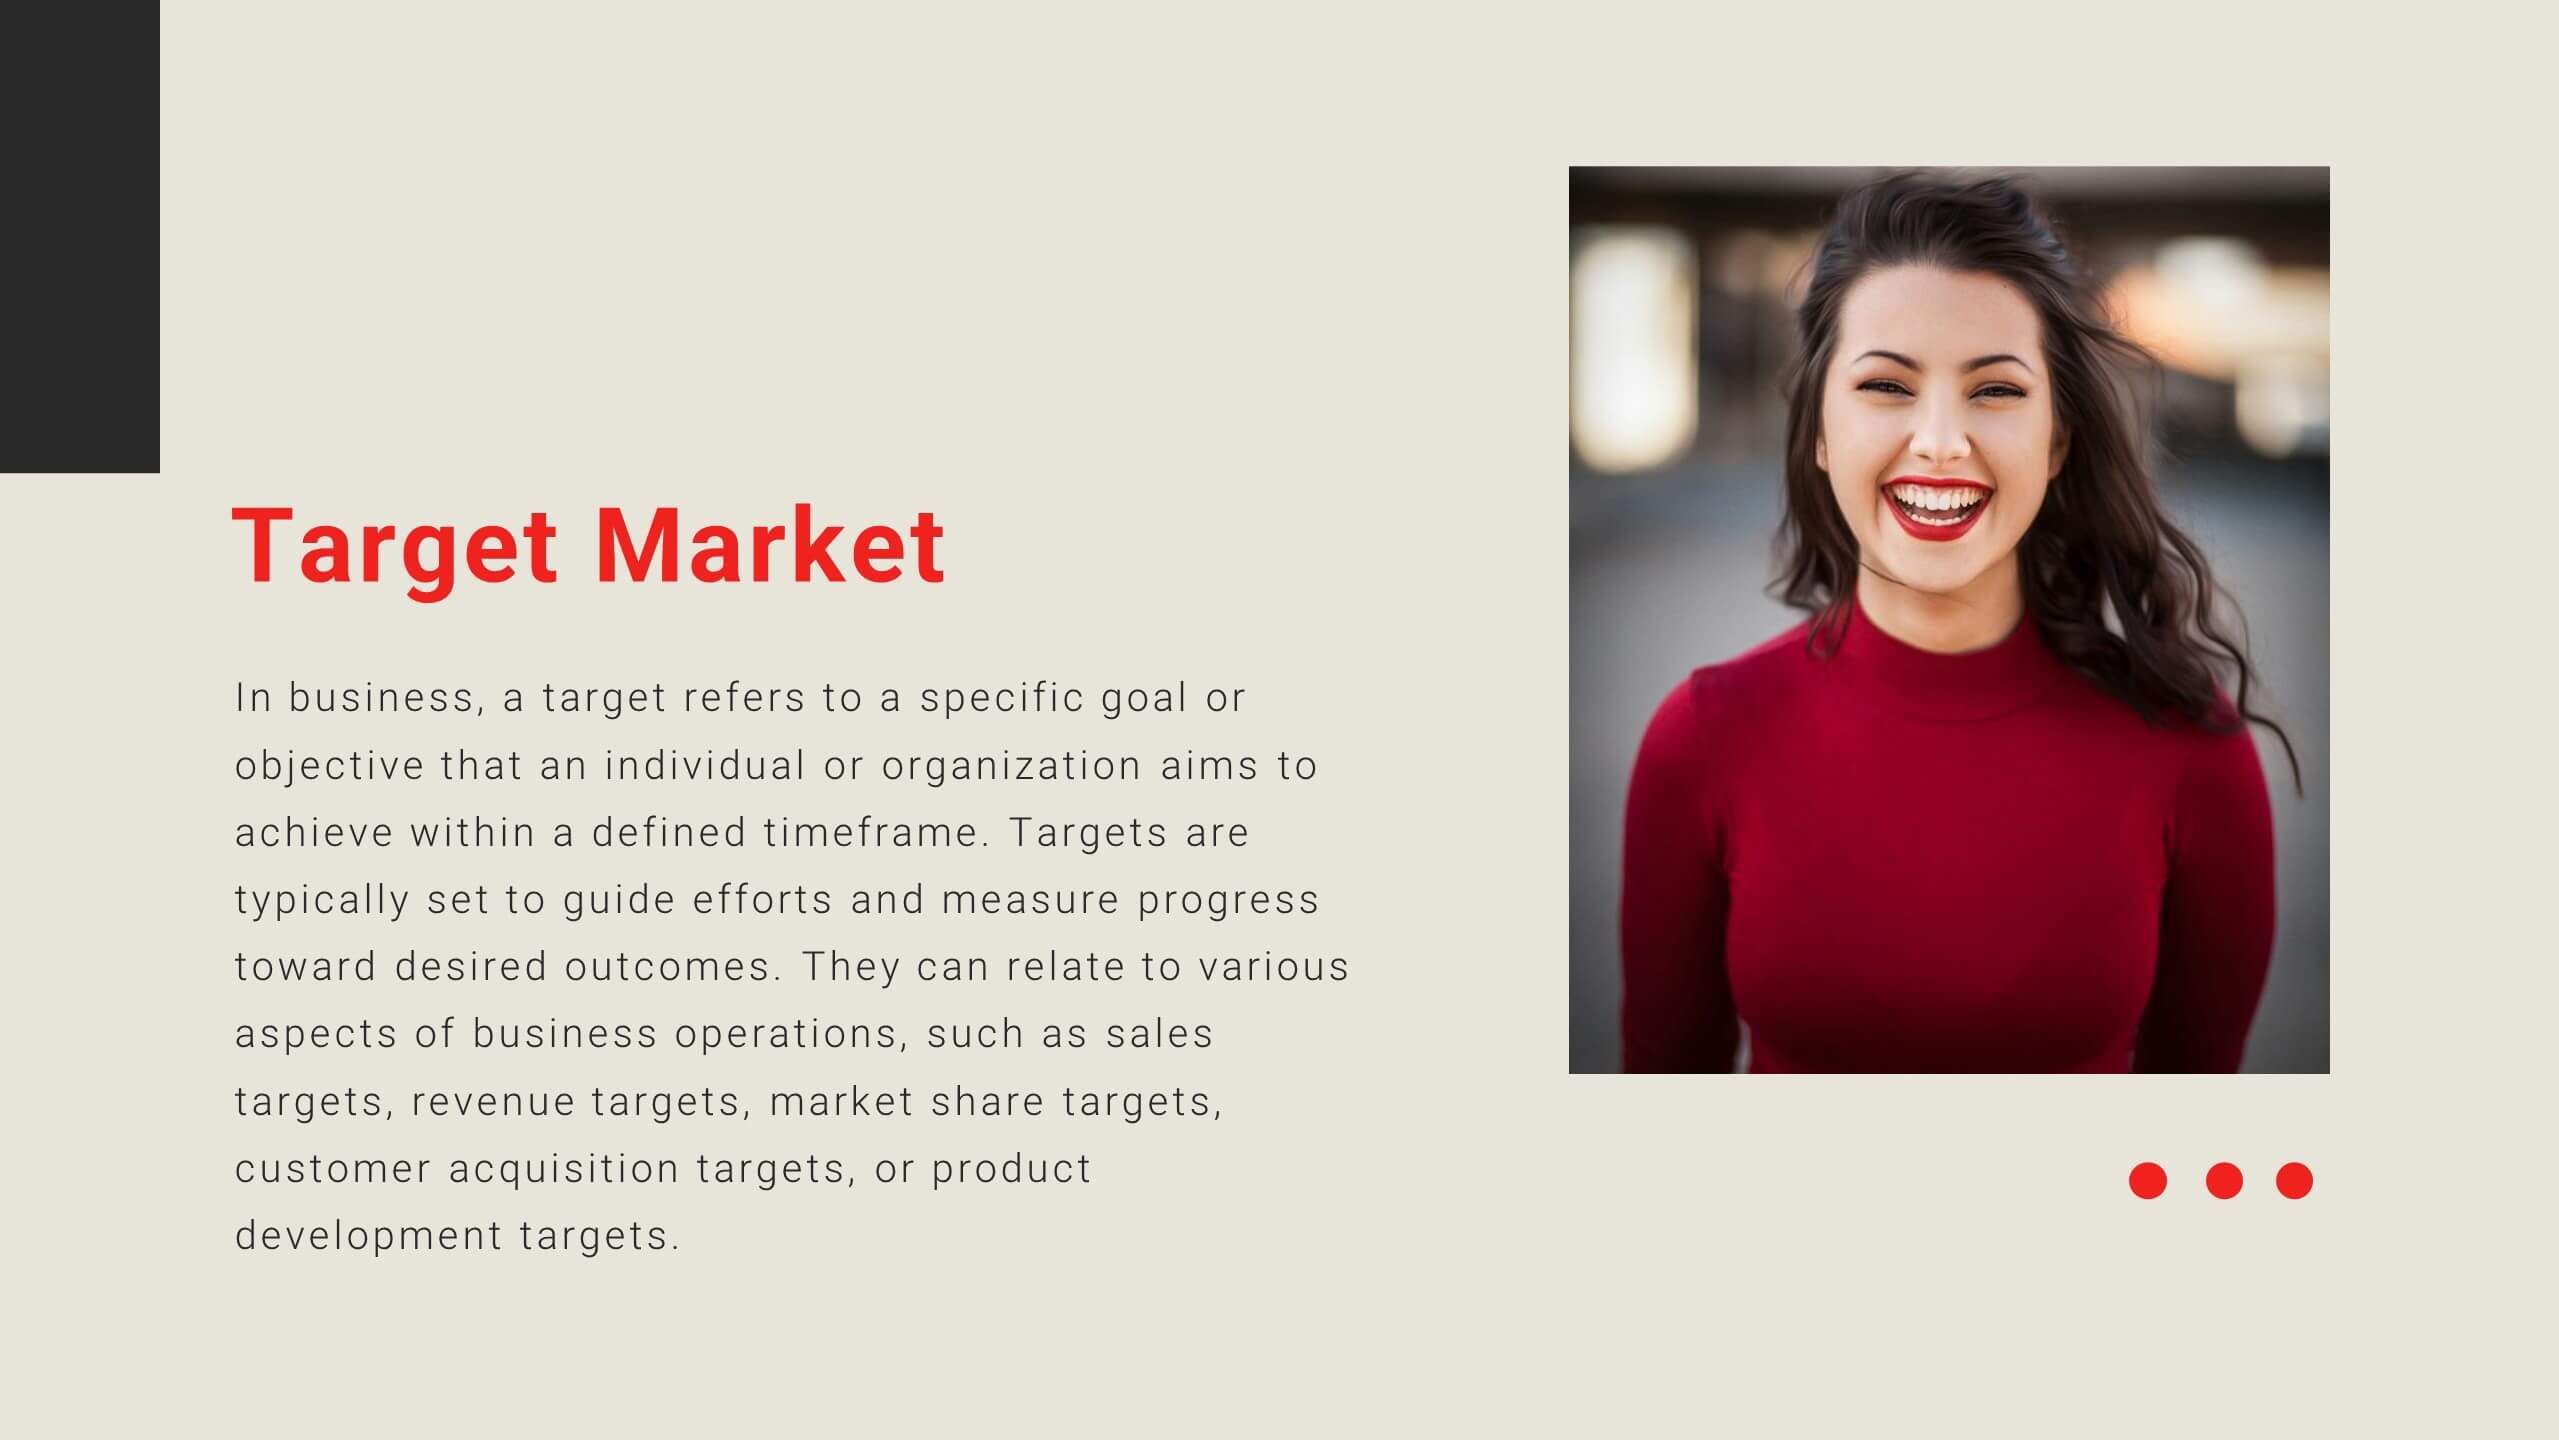
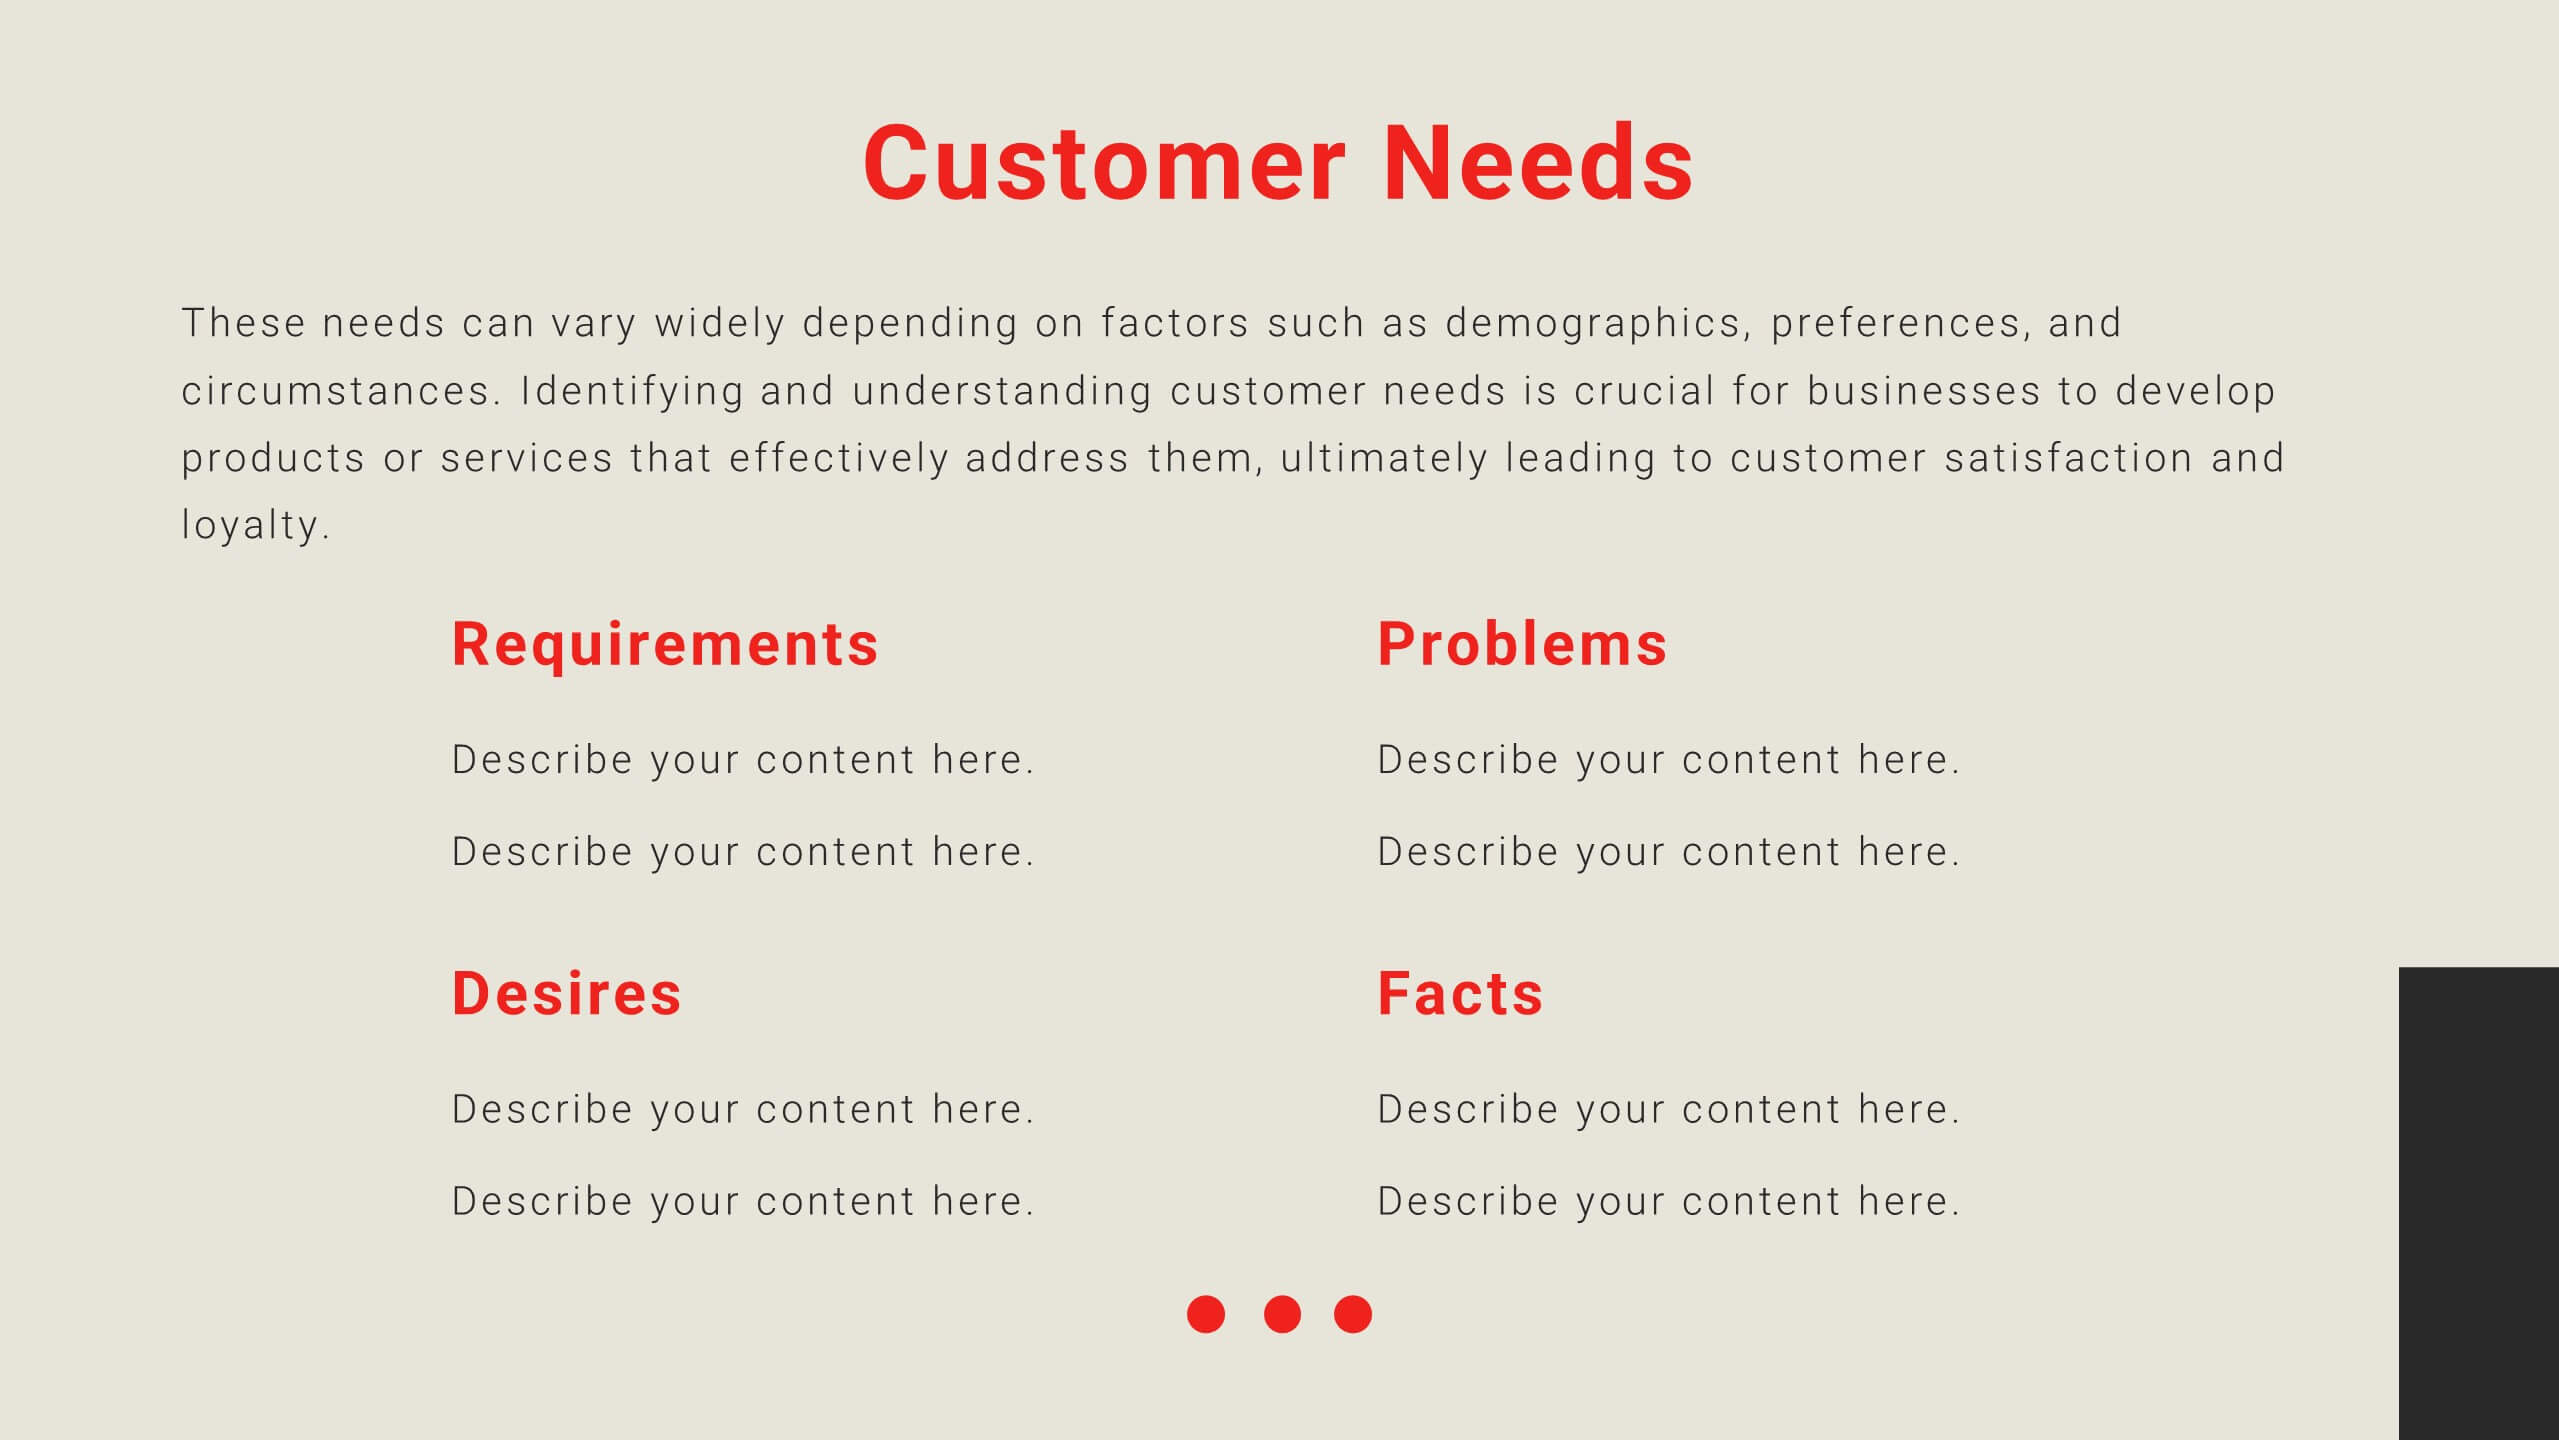
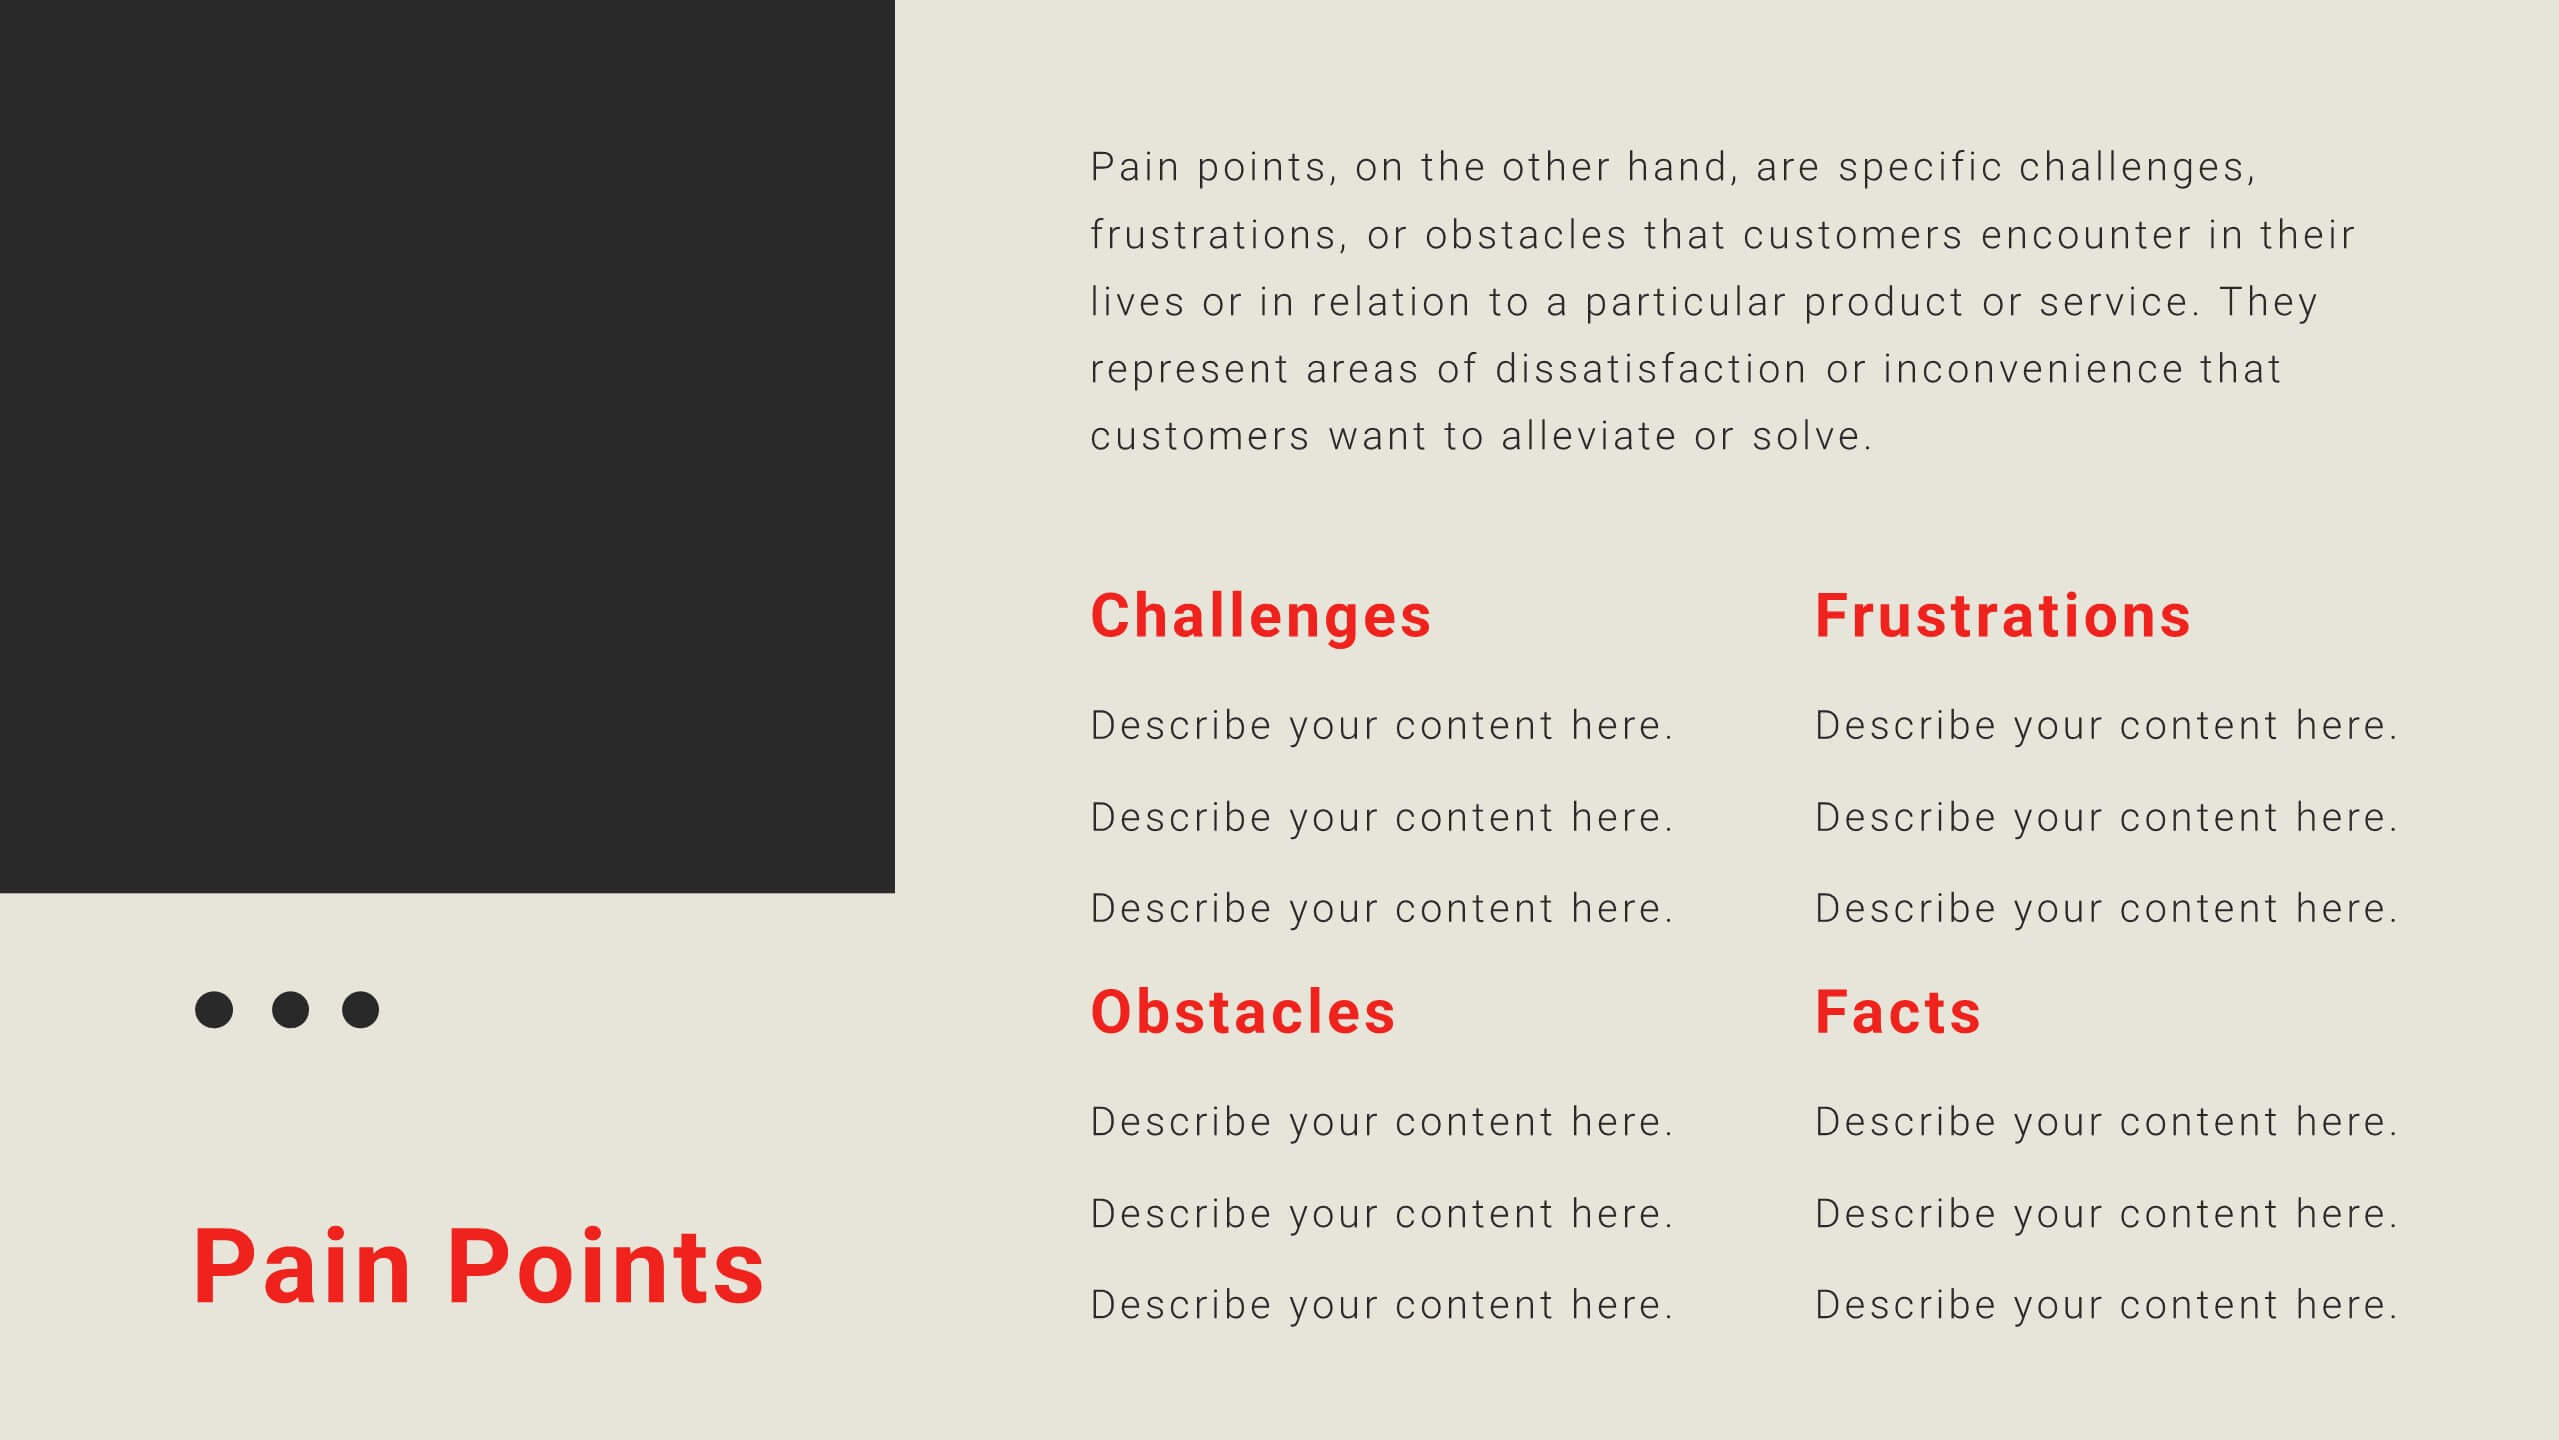
Cyber Security Measures Overview Presentation
Protect your digital world with this bold and professional template designed to visualize data protection, network security, and online safety strategies. Perfect for IT teams, tech presentations, or training materials. Fully customizable and compatible with PowerPoint, Keynote, and Google Slides for a seamless and secure presentation experience.


6 diapositivas
Budget and Expense Breakdown Presentation
Kickstart your financial story with a clean, energetic visual that makes every cost and category instantly understandable. This presentation helps you break down spending, compare expenses, and highlight key budget insights using a simple, structured layout. Perfect for reports and planning meetings. Fully compatible with PowerPoint, Keynote, and Google Slides.


5 diapositivas
Agriculture Industry Infographics
Delve into the heart of the agricultural sector with our agriculture industry infographics. Cast in the earthy tones of green and yellow, reflecting growth and harvest, this template brings the farming industry to your fingertips. Its creative, vertical design infused with farm-style aesthetics makes it perfect for agricultural educators, and farming consultants seeking to present data with a touch of nature's essence. Compatible with Powerpoint, Keynote, and Google Slides. The template boasts graphics, intuitive icons, and flexible image placeholders. From showcasing industry trends to unraveling complex farming processes.


6 diapositivas
AIDA Diagram
The AIDA Diagram is a simple and effective marketing tool used to guide the design of advertising and promotional materials with the goal of attracting and retaining customers. AIDA stands for Attention, Interest, Desire, and Action, and it represents the four stages a potential customer goes through when exposed to marketing content. This infographic template is a classic marketing and advertising framework used to understand and guide the consumer's journey through the buying process. This infographic is completely customizable and compatible with Powerpoint, Keynote, and Google Slides.


7 diapositivas
Annual Summary Infographic
Revitalize your year-end reports with our expertly designed Infographic Templates! Tailored for professionals keen on showcasing annual achievements and insights, this collection offers a dynamic array of layouts that cater to varied presentation needs. From streamlined bar graphs and intricate circle diagrams to engaging icon lists, these templates are engineered to translate complex annual data into digestible, visually appealing content. Customize colors, fonts, and text to mirror your organization’s branding, ensuring a consistent and professional appearance across all communications. Compatible with PowerPoint, Google Slides, and Keynote, our templates simplify the creation of presentations that not only inform but inspire. Ideal for executives, team leaders, and marketers, these templates are indispensable tools for illustrating yearly progress, highlighting significant outcomes, and strategizing for future success. Enhance your professional presentations and make your annual summary not just seen, but remembered.


7 diapositivas
Work From Home Benefits Infographic
The modern digital era has ushered in a revolution: the feasibility of working from home. Our work from home benefits infographic, crafted with a crisp white palette highlighted by shades of red and subtle black touches, dives deep into the multifaceted advantages of remote work. Whether it's the flexibility in hours, reduced commute stress, or the savings made, this template sheds light on every facet. This infographic template is perfect for professionals, team leaders, and organizations keen to adopt this model, its seamlessly compatible with PowerPoint, Keynote, and Google Slides.


5 diapositivas
Meal Plan and Nutrition Guide Presentation
Simplify your nutrition strategy with the Meal Plan and Nutrition Guide Presentation. This visually engaging circular layout lets you outline five key nutrition pillars or daily meals with icons and editable titles. Ideal for dietitians, wellness coaches, or health brands. Compatible with PowerPoint, Canva, and Google Slides for seamless customization.


4 diapositivas
Data Visualization Pie Chart
Make your insights pop with this engaging Pie Chart slide. Perfect for reporting KPIs or comparing segmented data, the radial design blends clear visuals with editable text sections. Ideal for marketing, analytics, or strategy meetings. Fully customizable in PowerPoint, Keynote, and Google Slides.


7 diapositivas
Annual Financial Report Infographic
This easy-to-use infographic template is crafted for a straightforward Annual Financial Report. Suitable for PowerPoint, Google Slides, and Keynote, it features diverse charts like bar graphs, pie charts, and tables for illustrating financial data such as sales growth, product earnings, and expenses. The professional blue and grey color palette is ideal for a corporate setting, while simple icons and clear spaces for text ensure information is digestible. This template is perfect for financial analysts and business managers who need to present complex fiscal data in a clear, visually appealing way.


7 diapositivas
Urban Ecology Illustrated Infographics
Ecology is the scientific study of the interactions between organisms and their environment. This ecology template will help you explain the science behind our world. This is great for anyone who is presenting information about ecology, environment, or sustainability. You can use this infographic as is or customize it by changing the colors and fonts of each slide. You can also add your own images, and text by downloading in Powerpoint, Keynote, or Google Slides. This Template comes with a wealth of key facts and figures on eco-friendly living and presents them in an infographic style.


6 diapositivas
Business Mission Statement Presentation
Here is a vivid "Business Mission Statement" presentation template tailored to elucidate your company's core objectives and strategic goals. This template features a unique brain-design interface that symbolizes thought leadership and innovative thinking, ideal for sharing insights that resonate deeply with your team or stakeholders. Compatible with PowerPoint, Keynote, and Google Slides, it's the perfect tool for broadcasting your mission with clarity and impact.


4 diapositivas
Cause-Effect Relationships Bowtie Format Presentation
Clearly illustrate the connection between causes and outcomes with the Cause-Effect Relationships Bowtie Format Presentation. Designed to simplify complex business logic, this layout uses a symmetrical bowtie shape to contrast contributing factors with resulting effects. Ideal for strategy, operations, or risk analysis. Fully editable in Canva, PowerPoint, Google Slides, and Keynote.