


Características


¿Tienes alguna pregunta?
Recomendar


7 diapositivas
Financial Forecasting with Statistics Presentation
Unlock your financial future with the "Financial Forecasting with Statistics" presentation templates. These slides are designed to clearly present growth forecasts, trends, and statistics, empowering you to make informed decisions. Ideal for financial analysts and corporate strategists, these templates are fully compatible with PowerPoint, Keynote, and Google Slides.


7 diapositivas
Matrix Sales Infographic
Steer through the intricacies of sales data with our matrix sales infographic. Set upon a pristine white backdrop, the design pulses with the analytical depth of blue, the urgency of red, and the vibrancy of orange. With meticulously crafted infographics, relevant icons, and adaptable image placeholders, this template delivers a systematic representation of the sales matrix, from product positioning to market segmentation. Exquisitely designed for Powerpoint, Keynote, or Google Slides. A pivotal tool for sales managers, market analysts, strategists, or any business professional aiming to dissect sales data and drive decisions.


10 diapositivas
Business Strategy Puzzle Presentation
Build a strong foundation with the Business Strategy Puzzle. This visually compelling design helps you break down key strategic components, business planning, and operational workflows into digestible segments. Perfect for corporate strategies, project management, and executive decision-making. Fully editable and compatible with PowerPoint, Keynote, and Google Slides.


5 diapositivas
Corporate Risk Assessment Framework Presentation
Streamline corporate risk evaluations with a structured framework. This Corporate Risk Assessment Framework provides a clear, organized approach to identifying, analyzing, and managing risks. Ideal for business strategists, project managers, and compliance teams. Fully customizable and compatible with PowerPoint, Keynote, and Google Slides for seamless integration into your workflow.


10 diapositivas
Adapting to Business Transformation Presentation
Guide your audience through change with this dynamic, step-by-step layout tailored for showcasing transformation journeys. The slide features a curved flow design with five customizable stages, perfect for visualizing digital shifts, organizational restructuring, or innovation roadmaps. Best for corporate strategists, consultants, and change managers. Fully editable in PowerPoint, Keynote, and Google Slides.


22 diapositivas
Stormlight Qualitative Research Findings Presentation
This Qualitative Research Presentation Template is a dynamic and structured solution designed to present in-depth research findings, methodologies, and analysis. It covers key sections such as data collection, results interpretation, implications, and recommendations to deliver a comprehensive research overview. Perfect for academic, business, or market research purposes, and fully compatible with PowerPoint, Keynote, and Google Slides for easy customization.


26 diapositivas
Modern Company Culture Playbook Presentation
A culture playbook is a document or guide that outlines the values, beliefs, behaviors, and norms that define the organizational culture of a company or team. This presentation template is designed to help businesses create and communicate their unique company culture to employees and potential recruits. With a modern and professional design, this presentation provides a comprehensive overview of your company's values, mission, and beliefs, fostering a positive and inclusive work environment. Illustrate your company's vision for the future and its role in shaping a better world, encouraging employees to be part of a meaningful journey.


7 diapositivas
Veterinary Hospital Infographic
A veterinary hospital, is a medical facility that provides healthcare services to animals, primarily focusing on the diagnosis, treatment, and prevention of illnesses and injuries in pets and other animals. This vibrant and heartwarming infographic template brings to life the journey of our beloved pets through the lens of a caring veterinary hospital. Compatible with Powerpoint, Keynote, and Google Slides. This template celebrates the love, care, and healing that happens every day at veterinary hospitals. This infographic is a haven where wagging tails and purring hearts find comfort and a reason to smile.


22 diapositivas
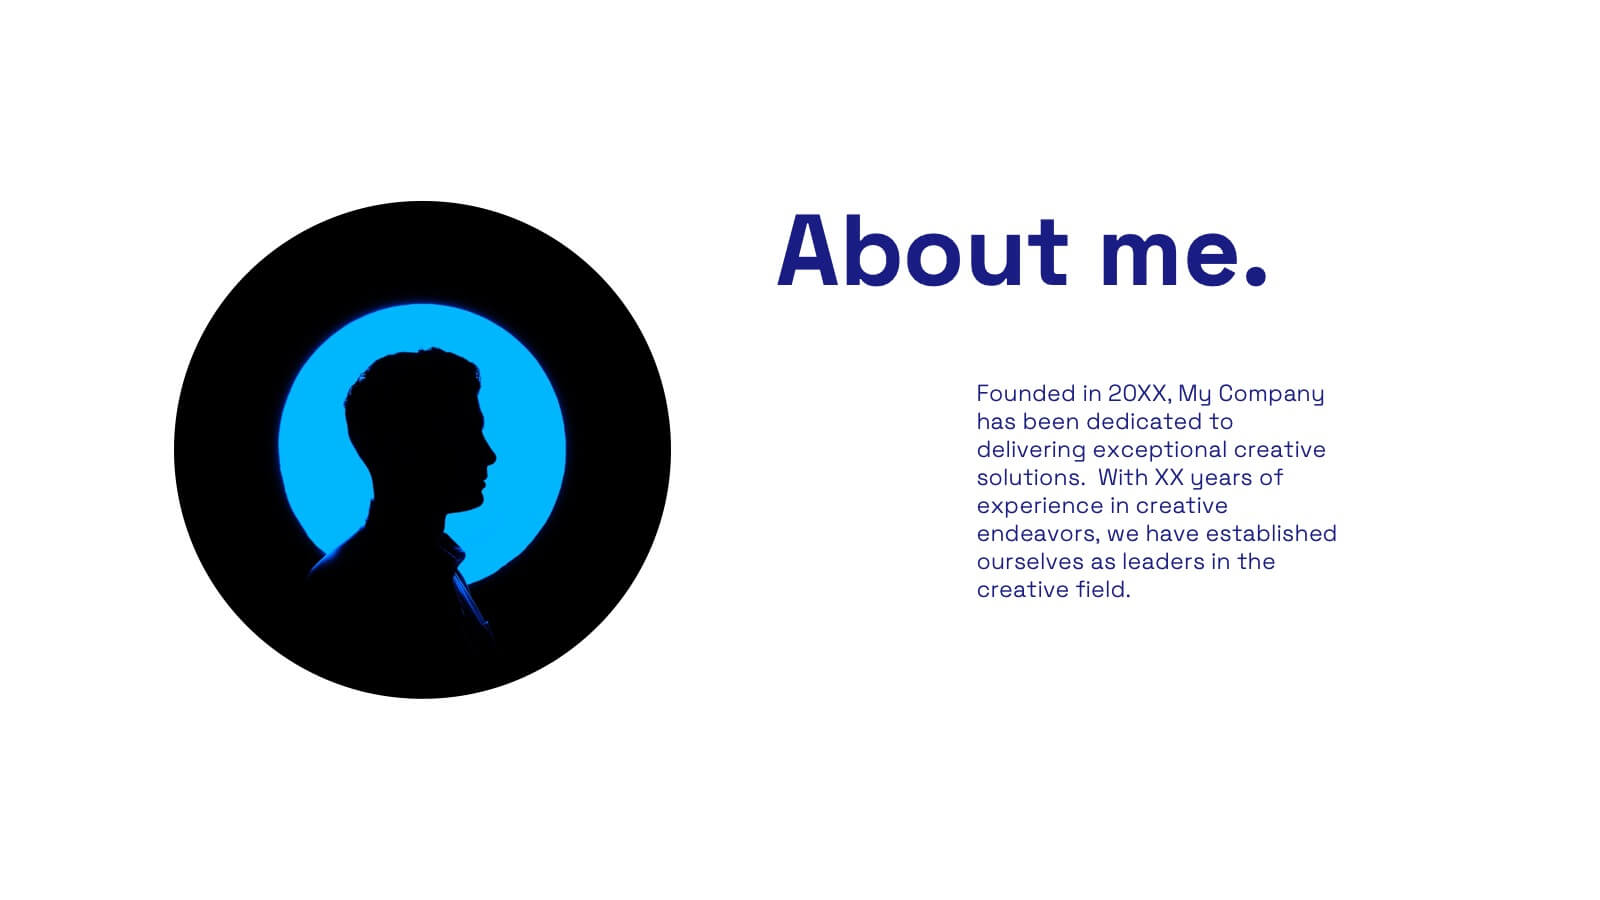
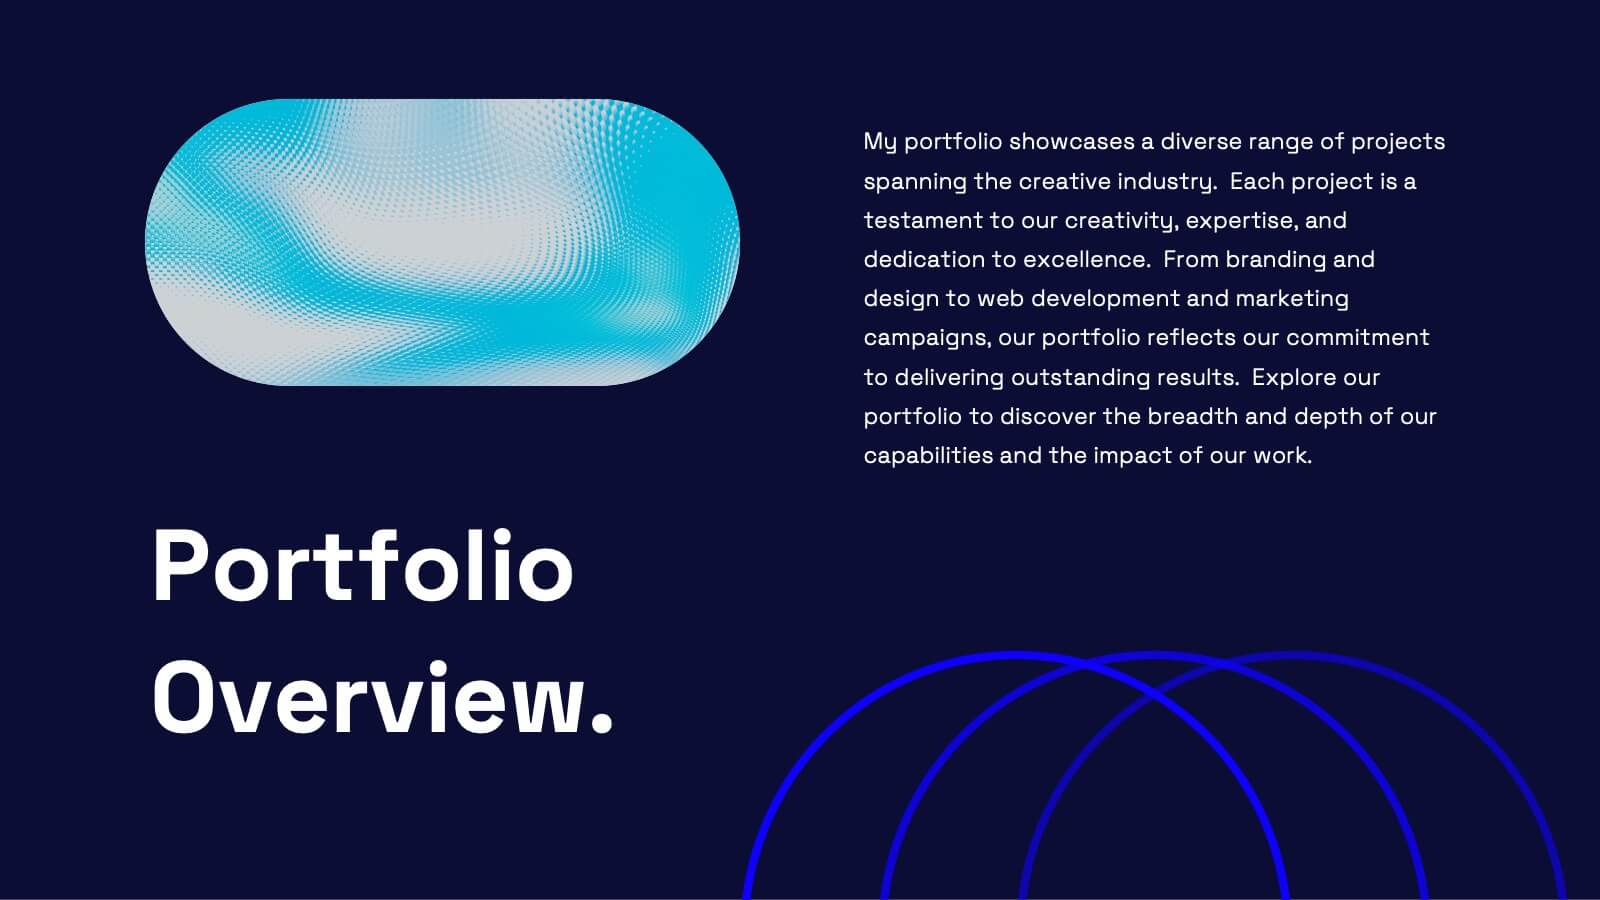
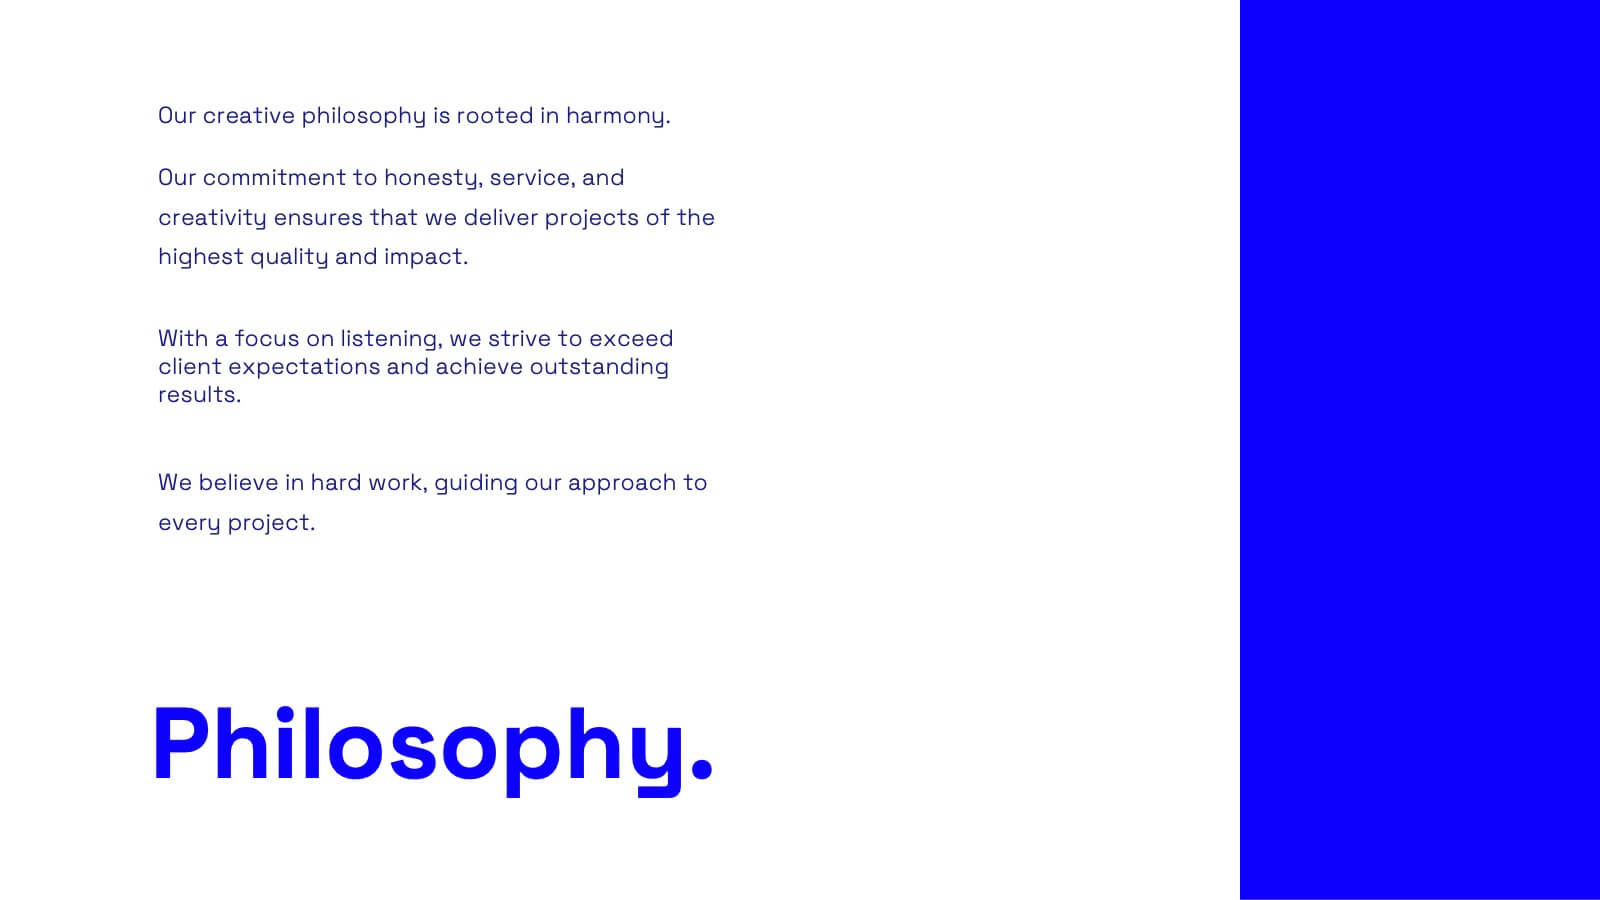
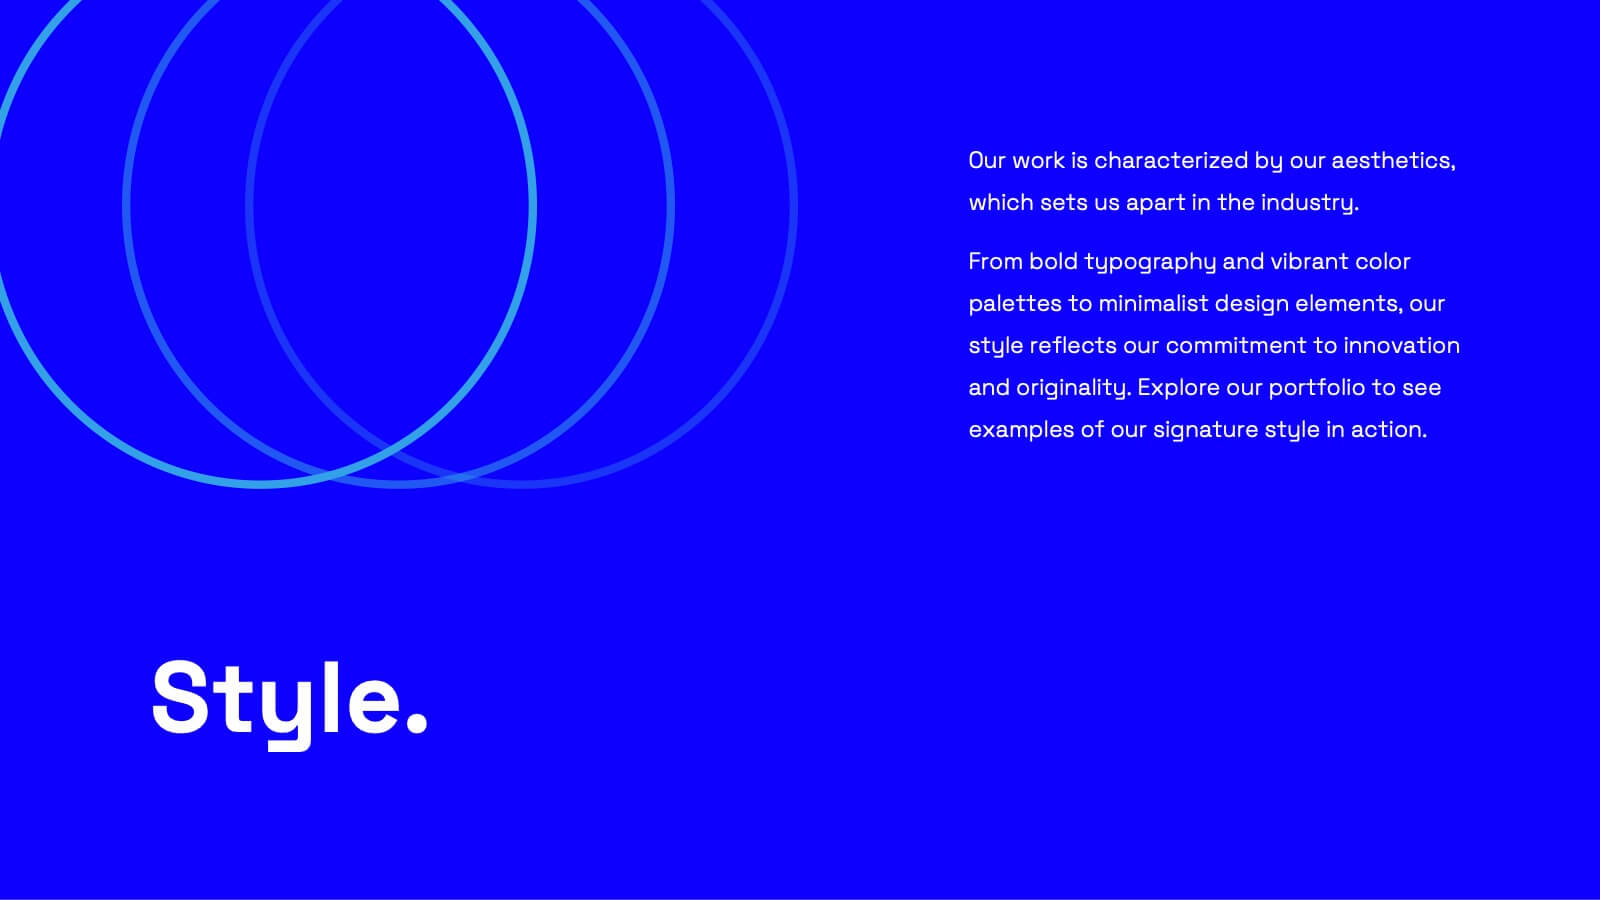
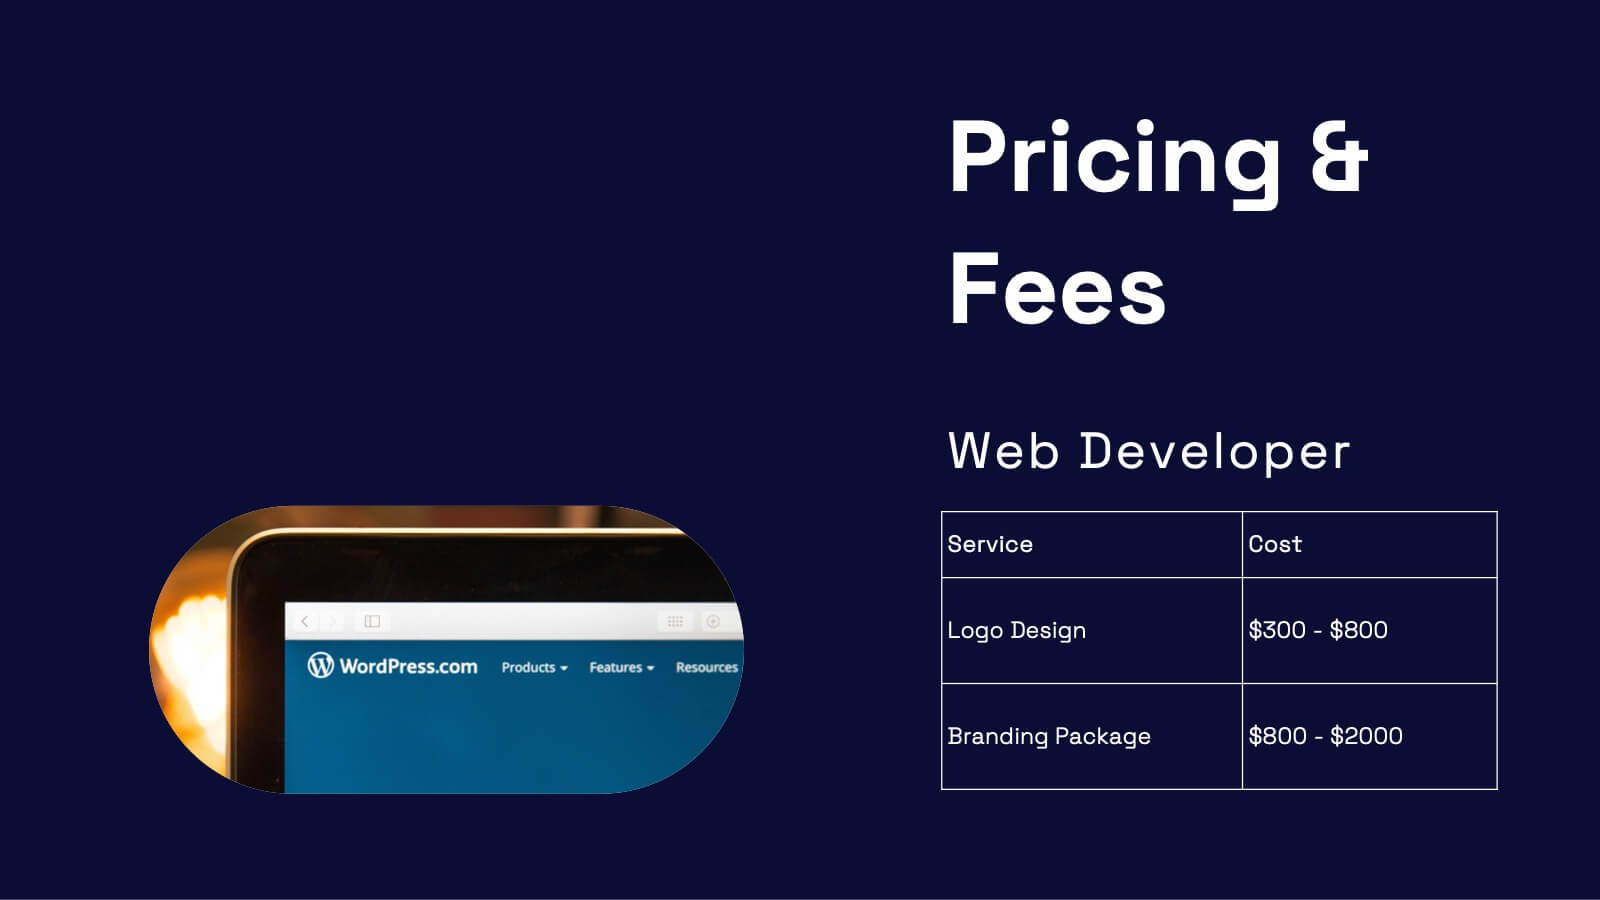
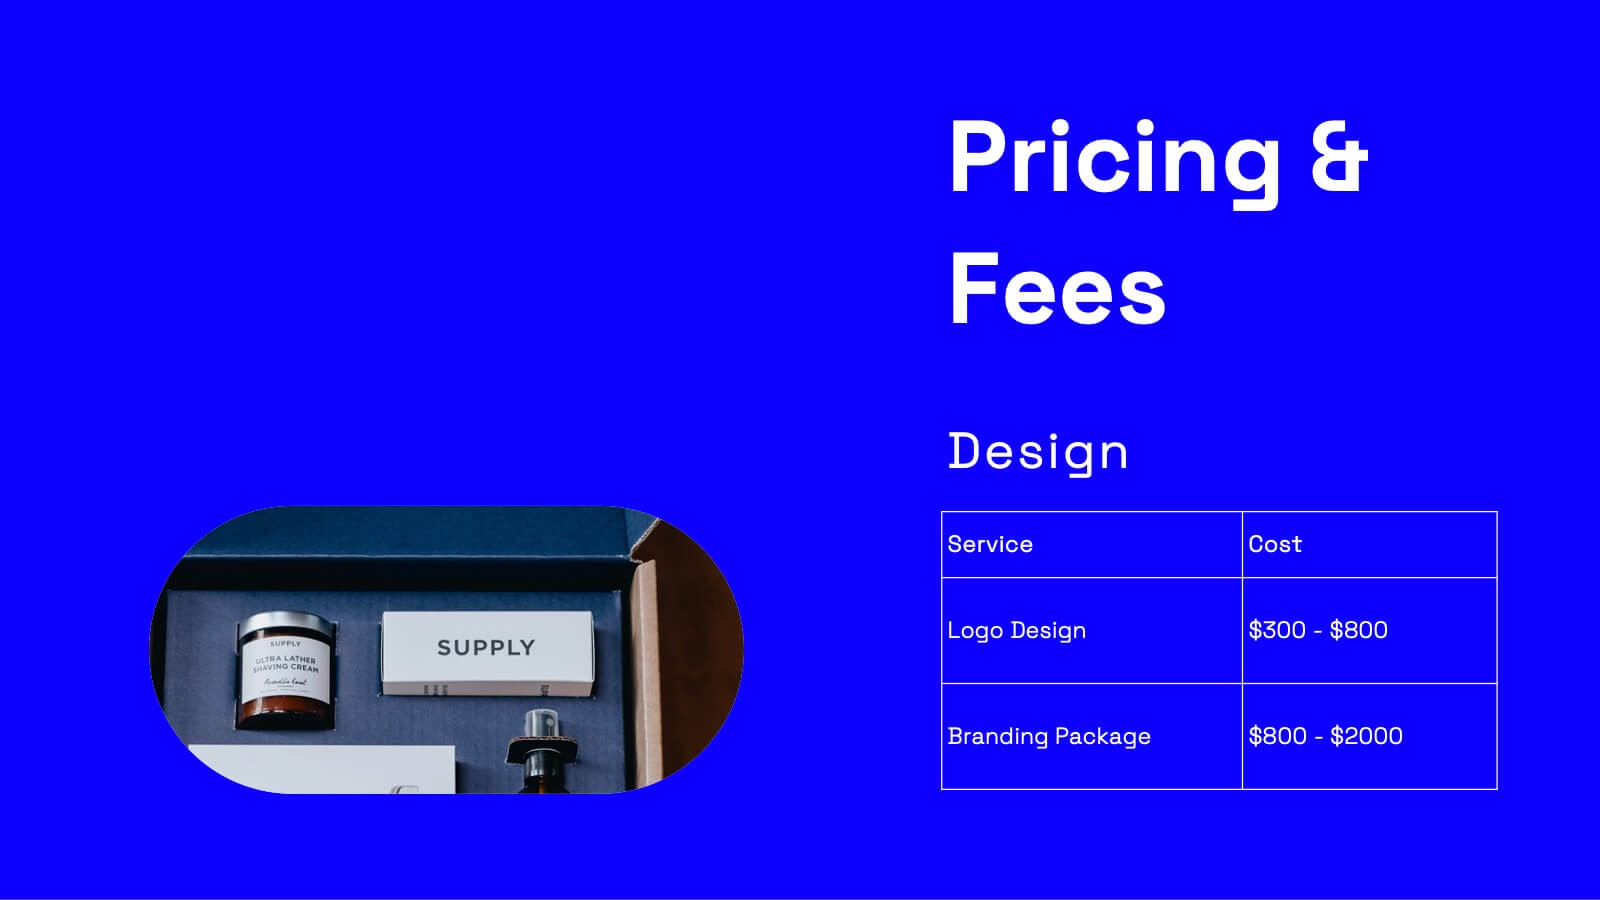
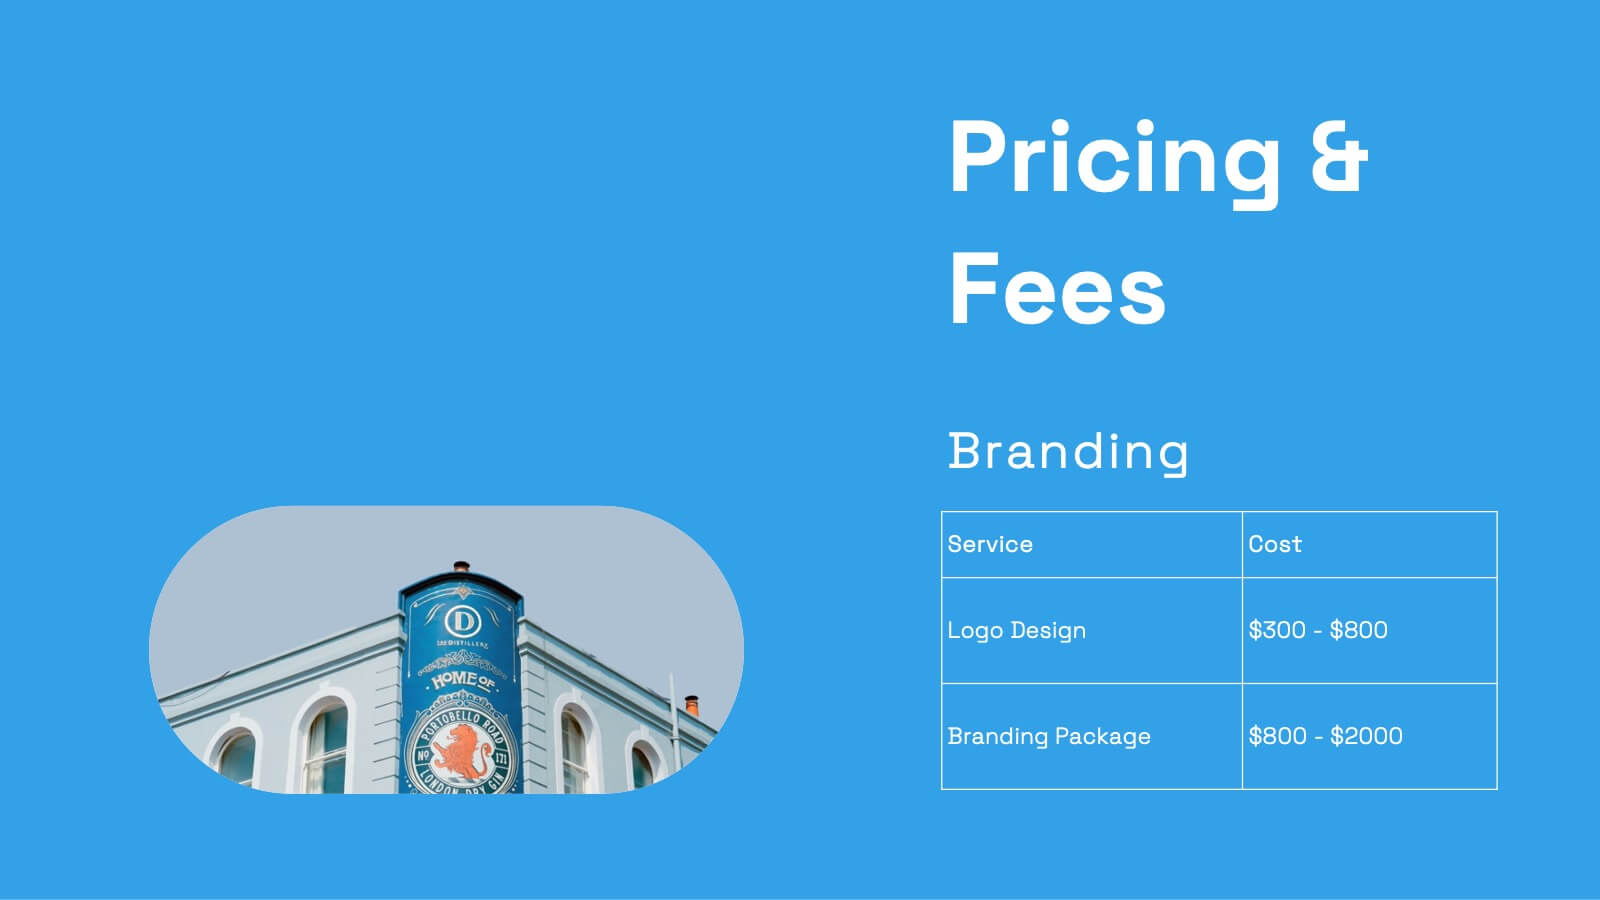
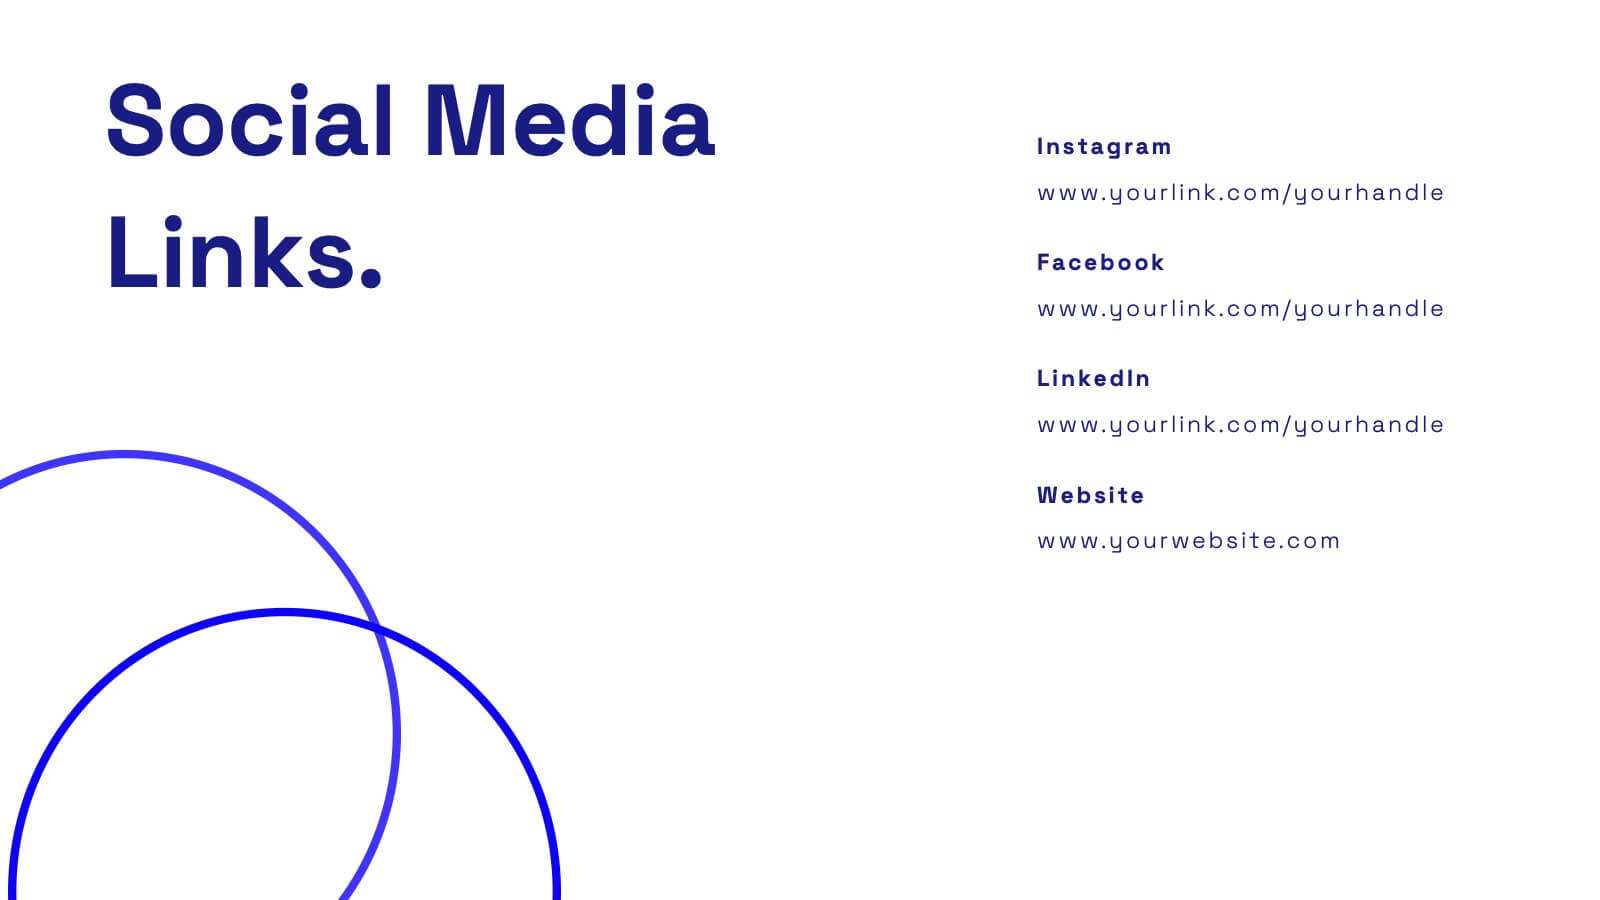
Wanderer Professional Portfolio Showcase Presentation
Showcase your creative work with this sleek, modern portfolio template. Perfect for highlighting your projects, philosophy, and client testimonials, it features a professional design with a dynamic layout. Display your awards, services offered, and pricing clearly to impress potential clients. Compatible with PowerPoint, Keynote, and Google Slides, it ensures seamless presentations on any platform.


7 diapositivas
Butterfly Visualization Layout Presentation
Bring balance and clarity to your data storytelling with a sleek, symmetrical design that connects ideas seamlessly. This presentation is ideal for visualizing comparisons, workflows, or interconnected topics in a clean and engaging format. Fully customizable and compatible with PowerPoint, Keynote, and Google Slides.


6 diapositivas
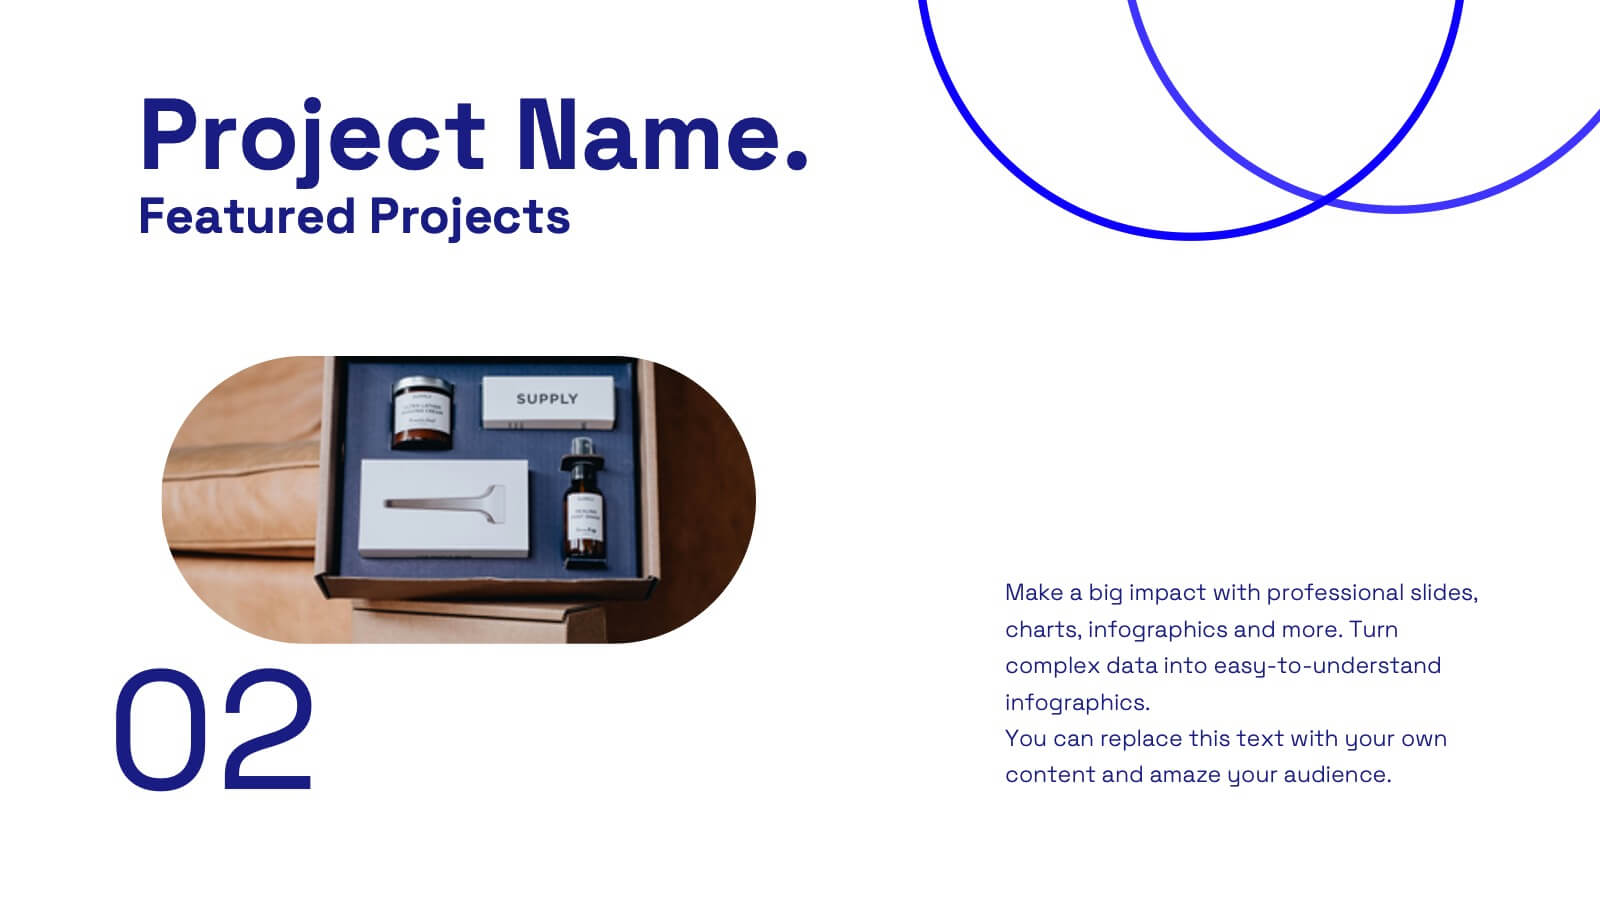
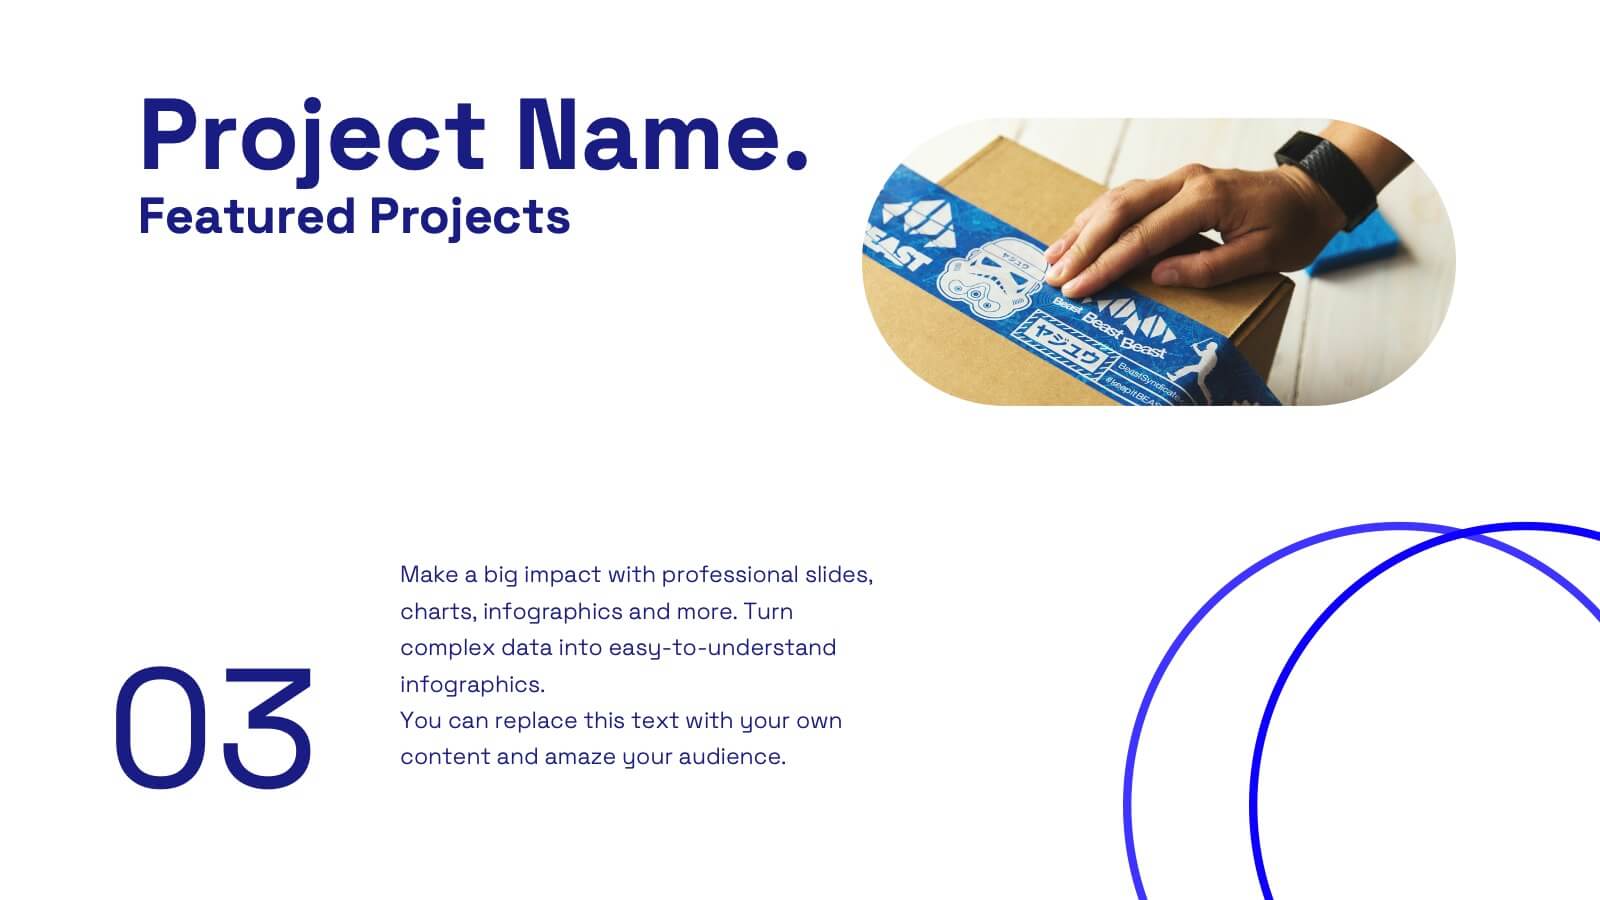
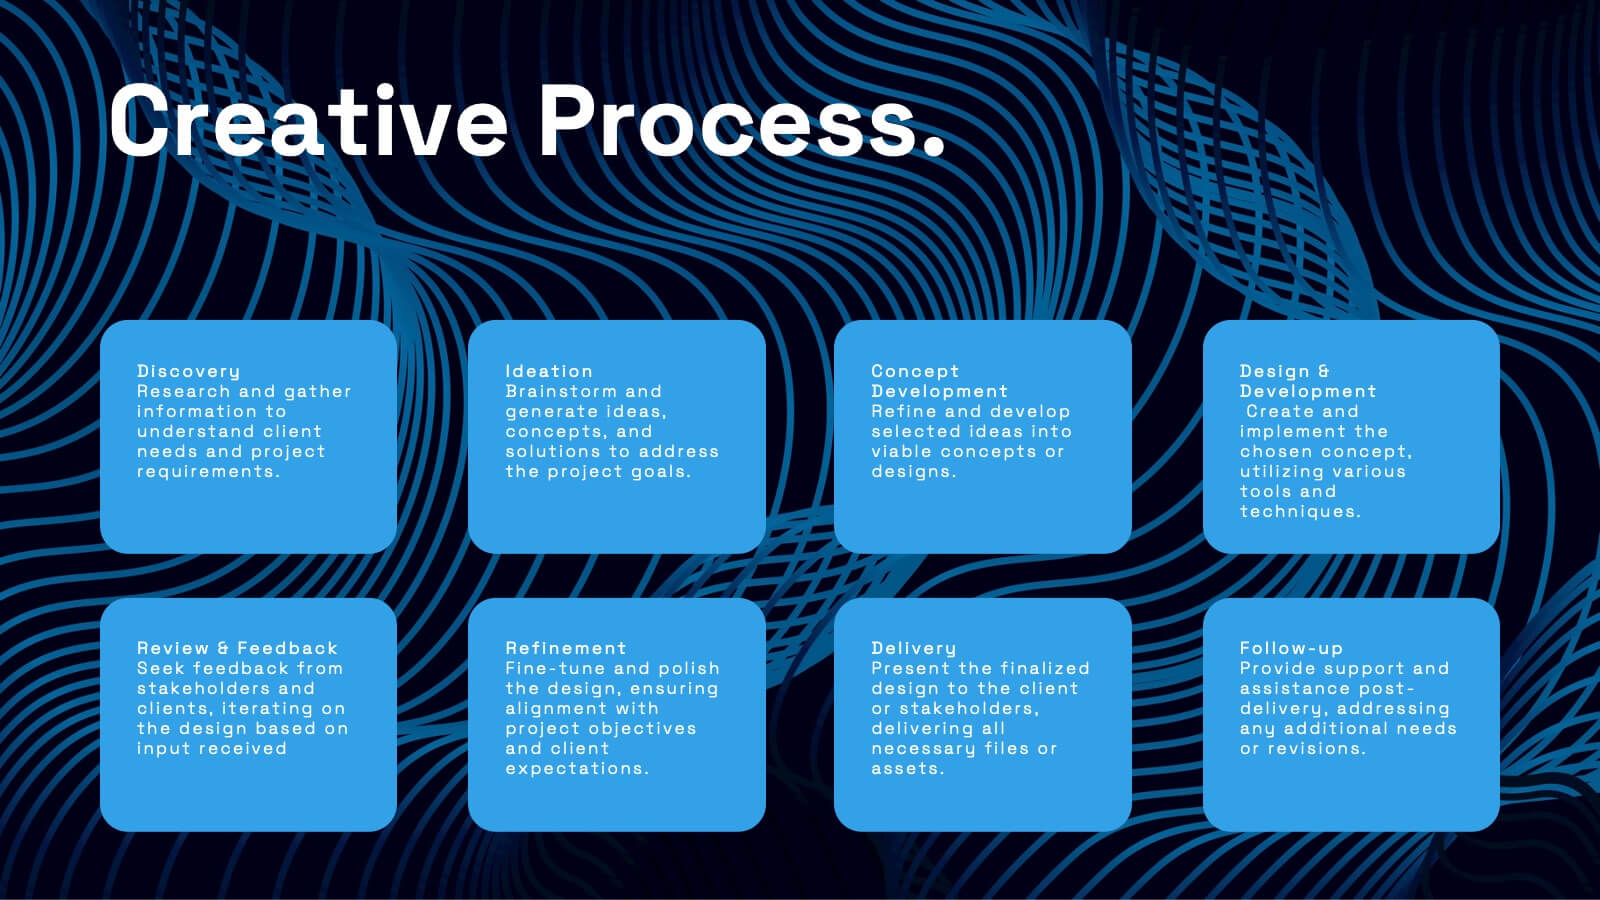
Project Rollout Milestone Timeline Presentation
Visually map out your project phases with the Project Rollout Milestone Timeline Presentation. Featuring a modern cylinder path layout, this slide is perfect for showcasing five key milestones in sequential or strategic order. Ideal for project managers and teams, and fully editable in Canva, PowerPoint, Keynote, and Google Slides.


5 diapositivas
Demographic Segmentation Analysis Presentation
Bring your insights to life with a clean, engaging layout that simplifies complex audience data into clear, visual segments. This presentation helps you explain key patterns, compare group behaviors, and communicate strategic decisions with confidence. Fully editable and compatible with PowerPoint, Keynote, and Google Slides.


7 diapositivas
Communication Skills Infographics
Effective communication skills are essential in every aspect of life, including personal relationships, professional relationships, and societal interactions. This template provides you with a great resource for presenting your communication skills. This can help you present your ideas in an effective way. This template features customizable slide designs and graphics allowing you plenty of room to add your own content. The format makes this presentation easy to follow and understand visually as it focuses on what are the most important aspects of delivering effective communication skills.


21 diapositivas
Goldenshadow Professional Portfolio Showcase Presentation
A refined portfolio presentation template crafted to highlight professional achievements and expertise. Showcase featured projects, collaborations, and client testimonials with a sleek, modern design. Includes sections for services offered, awards, pricing, and contact information. Fully customizable and compatible with PowerPoint, Keynote, and Google Slides for impactful portfolio presentations.


5 diapositivas
Hydrology and Water Cycle Presentation
Showcase the complete water cycle with this vibrant Hydrology and Water Cycle infographic. Highlight key stages like precipitation, collection, evaporation, and condensation using clear visuals and numbered sections. Fully customizable for science, sustainability, or educational presentations. Compatible with PowerPoint, Keynote, and Google Slides for easy editing.


5 diapositivas
USA Economic Map Infographic
Navigate the complexities of the American economy with our USA economic map infographic. Crafted in shades of blue and diverse colors, this creative, vertical infographic is a boon for economists, researchers, and educators. It's designed to dissect financial data across states, highlighting economic indicators vividly. From GDP growth, employment rates to industry-specific insights, make economic trends accessible. This template, beneficial for anyone addressing economic audiences, features intuitive graphics, state icons, and designated areas for relevant imagery, ensuring each economic facet is visually compelling and information-rich.


8 diapositivas
Chain of Command Mapping Presentation
Clarify your organizational flow with the Chain of Command Mapping Presentation. This template is ideal for visualizing reporting lines, departmental authority, and team structures in a clean, easy-to-follow format. Featuring modern icons, varied layouts, and editable labels, it helps simplify decision-making and responsibility tracking. Fully customizable in PowerPoint, Keynote, Canva, and Google Slides.