


Características


¿Tienes alguna pregunta?
Recomendar


6 diapositivas
Business Task Checklist Presentation
Bring order and focus to your workflow with a clean, structured layout that tracks progress and priorities at a glance. Ideal for project updates, task planning, or performance reviews, this presentation makes organization effortless. Fully compatible with PowerPoint, Keynote, and Google Slides for easy customization and professional use.


5 diapositivas
Effective Time Management Strategies Presentation
Master productivity with structured time management strategies using this Effective Time Management Strategies template. Featuring a dynamic stopwatch visual, this slide is perfect for presenting key productivity techniques, time-blocking methods, and efficiency-boosting strategies. Ideal for business professionals, project managers, and personal development trainers, this template is fully customizable and compatible with PowerPoint, Keynote, and Google Slides.


23 diapositivas
Night Slash UX Strategy Plan Presentation
Elevate your UX/UI design presentations with the Night Slate UX Strategy Plan template! This dynamic and visually striking design is perfect for conveying your strategic ideas with impact. The bold use of contrasting black and orange creates a modern and energetic vibe, making your content stand out. Each slide is thoughtfully designed to cover every aspect of your UX/UI strategy, from user research and personas to prototyping and user testing. The template includes sections on design principles, wireframes, and responsive design, ensuring that your audience gains a comprehensive understanding of your approach. Whether you're presenting to stakeholders or guiding a design team, this template is designed to keep your audience engaged and informed. Fully compatible with PowerPoint, Keynote, and Google Slides, the Night Slate template is your go-to tool for delivering compelling UX/UI strategy presentations that leave a lasting impression.


6 diapositivas
Hexagonal Grid for Process Mapping Presentation
Visualize your workflow with structure using the Hexagonal Grid for Process Mapping Presentation. This clean, geometric layout guides viewers through each phase of your process with clarity and consistency. Ideal for outlining steps, stages, or interconnected tasks in a modern format. Fully editable in Canva, PowerPoint, Keynote, and Google Slides.


8 diapositivas
Business Revenue and Profit Analysis Presentation
Analyze and visualize Business Revenue and Profit trends effectively with this modern and data-driven slide template. Featuring a dual-chart layout with reseller performance trends and purchase breakdowns, this slide is ideal for financial reports, sales presentations, and strategic business meetings. Fully customizable, you can edit the text, colors, and data to fit your specific needs. Compatible with PowerPoint, Keynote, and Google Slides for easy editing and seamless integration.


5 diapositivas
Organ Structure Breakdown Slide Presentation
Bring your anatomy data to life with this clear and engaging organ breakdown slide. Designed to visually map out key organ functions or statistics, this layout makes complex info feel simple. Whether you're teaching biology or sharing medical research, it's editable and works with PowerPoint, Keynote, and Google Slides.


10 diapositivas
Cryptocurrency Market Trends
Highlight key movements in the crypto space with this 5-step 3D bar chart layout. Ideal for financial analysts, fintech startups, and blockchain professionals. Fully editable in PowerPoint, Keynote, or Google Slides—customize colors, text, and data to reflect your insights with precision.


10 diapositivas
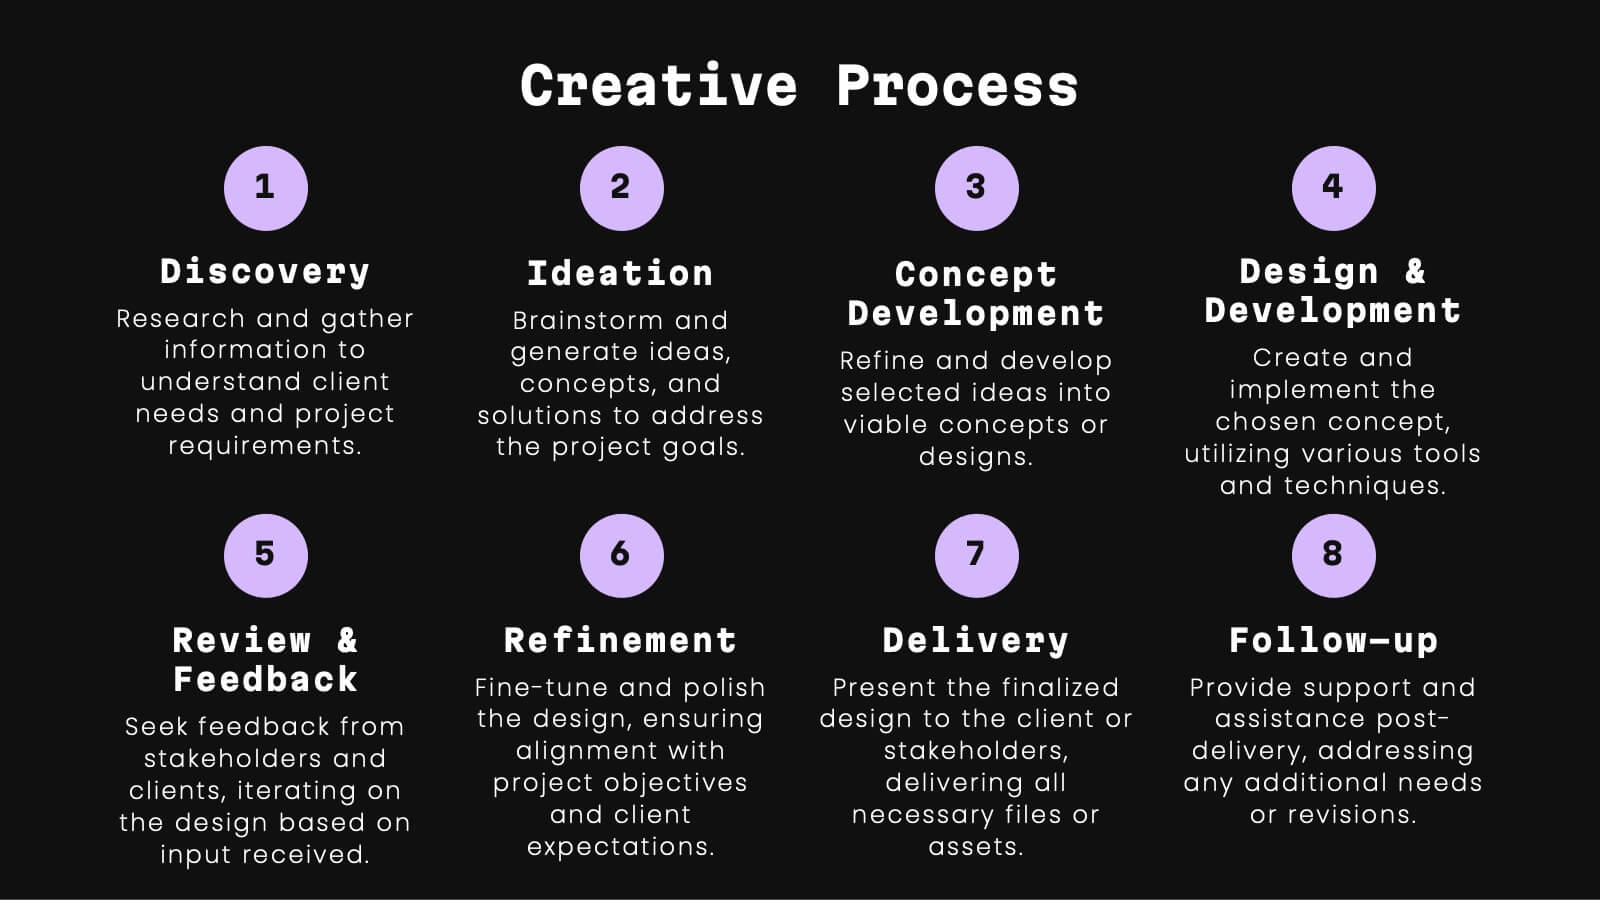
Strategic Business Action Plan Presentation
Create a roadmap for success with the Strategic Business Action Plan presentation. This well-structured template provides a clear, step-by-step framework for executing business strategies, making it ideal for corporate teams, entrepreneurs, and business consultants. Its modern design ensures effective communication of key goals and objectives. Fully customizable and compatible with PowerPoint, Keynote, and Google Slides.


23 diapositivas
Aegean UX Strategy Plan Presentation
The Aegean UX Strategy template is a vibrant and modern presentation tool designed for UX/UI designers, project managers, and creative teams. Its gradient pink and orange color scheme creates a visually appealing backdrop for discussing complex design strategies. This template includes slides for every step of the UX process, from defining user personas and journey maps to detailing wireframes, prototyping, and user testing. It also covers critical aspects like branding guidelines, accessibility, and usability, ensuring that your design considerations are comprehensive. Ideal for presenting design projects, strategies, or user experience audits, this template is fully compatible with PowerPoint, Keynote, and Google Slides, allowing for easy customization and seamless presentations across platforms. Use the Aegean UX Strategy template to convey your design vision clearly and compellingly, engaging your audience with a blend of style and substance.


22 diapositivas
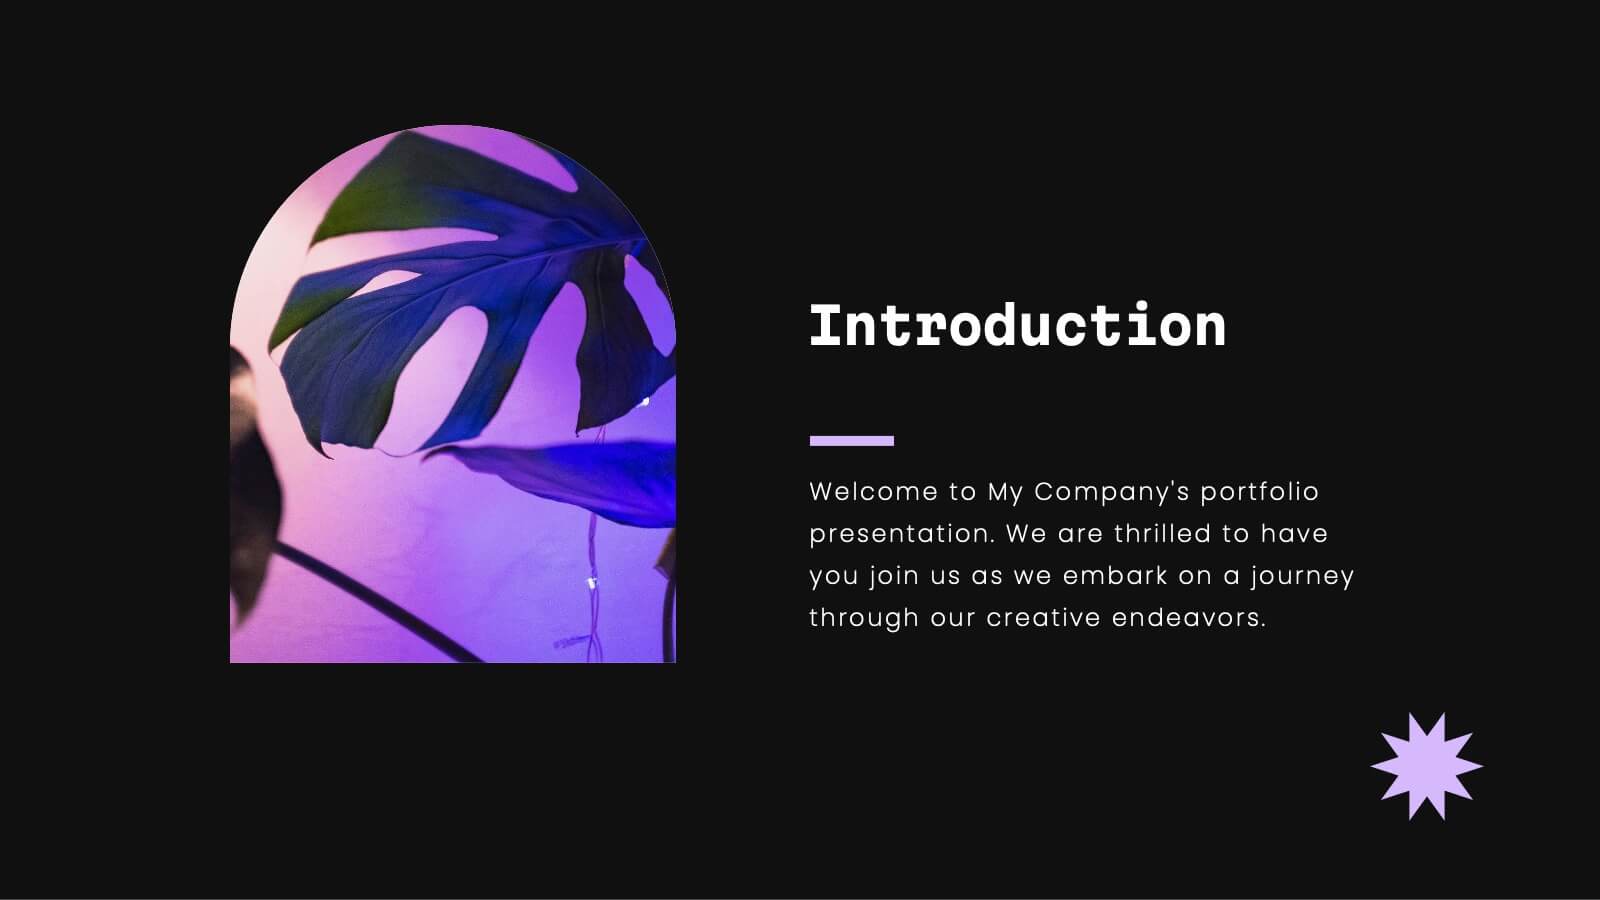
Celeste Professional Portfolio Showcase Presentation
Impress with style using this sophisticated portfolio presentation template. Perfect for showcasing featured projects, creative processes, and client testimonials, this template enhances the visual appeal of your work. Its modern, dark-themed design ensures your content stands out, making a lasting impression. Compatible with PowerPoint, Keynote, and Google Slides, it's versatile for any platform.


4 diapositivas
3-Circle Venn Diagram Presentation
Visualize overlap and connection with clarity using the 3-Circle Venn Diagram Presentation. This minimalist slide is ideal for showing relationships between three ideas, strategies, or data sets. Each circle is color-coded for distinction, and intersections highlight shared elements. Perfect for business models, marketing segments, or product comparisons. Fully editable in PowerPoint, Keynote, and Google Slides.


6 diapositivas
Multiple Choice Options Slide Presentation
Make your ideas stand out with a bold, interactive design that organizes multiple options clearly and visually. Ideal for showcasing comparisons, scenarios, or decision pathways, this presentation keeps audiences engaged and informed. Fully compatible with PowerPoint, Keynote, and Google Slides for seamless customization and professional results.


3 diapositivas
Risk Assessment Spider Chart
Evaluate risks across key criteria with the Risk Assessment Spider Chart Presentation. This template showcases a multi-dimensional radar chart, ideal for comparing variables like probability, impact, and preparedness. Use this to present security assessments, project vulnerabilities, or business exposure insights. Fully editable in PowerPoint, Keynote, and Google Slides.


7 diapositivas
Business Decision-Making Questions Presentation
Streamline your decision-making process with this engaging and structured presentation slide. Featuring a lightbulb and question mark design, this template effectively illustrates problem-solving and strategic choices in a professional and visually appealing way. Ideal for business strategy, consulting, and brainstorming sessions, it is fully editable, allowing you to customize text, colors, and layout to fit your needs. Compatible with PowerPoint, Keynote, and Google Slides for seamless use.


4 diapositivas
Audience Demographic Profile Overview
Present audience composition with clarity using the Audience Demographic Profile Overview Presentation. This slide is designed to showcase gender-based or group-specific data through visual figures, percentage markers, and supporting bar charts. Ideal for marketers, analysts, and researchers who need to communicate user distribution and behavior insights. Fully editable in PowerPoint, Keynote, and Google Slides.


5 diapositivas
Celebrating Major Milestones Presentation
Highlight achievements and key moments with this medal-themed milestone template. Ideal for progress tracking, awards, or timeline presentations. Showcase up to four major events using a clean, structured layout. Fully editable in PowerPoint, Keynote, and Google Slides—perfect for business reviews, team celebrations, or personal growth milestones.


26 diapositivas
Remote Works Strategie Presentation
This presentation template is designed for businesses focused on remote work strategies. It features a variety of slide types, including team introductions, Gantt charts, comparison slides, and infographics. The design is clean and modern, with a mix of text, images, and icons to help communicate your message effectively. Key slides include options for showcasing your team, outlining different strategies, and presenting data visually through charts and maps. The template also includes device mockups for mobile and laptop views, making it versatile for different presentation needs. Each slide is customizable to fit your brand's colors and content.