


Características


¿Tienes alguna pregunta?
Recomendar


6 diapositivas
Geometric Shape Design Slides
Present your process or flow clearly using the Geometric Shape Design Slides Presentation. This layout uses connected circular icons to visually represent sequential steps, ideal for workflows, timelines, or strategic roadmaps. Each stage is color-coded and paired with editable titles and descriptions for clarity. Fully customizable in PowerPoint, Keynote, and Google Slides.


6 diapositivas
Budget Planning Spreadsheet Slide Presentation
Visualize your spending strategy with a clean, circular layout that turns complex financial data into simple, engaging visuals. This modern design helps you outline expenses, track categories, and showcase progress effectively in meetings or reports. Fully editable and compatible with PowerPoint, Keynote, and Google Slides for effortless customization.


7 diapositivas
Work From Home Infographic Presentation Template
A Work From Home Infographic is a visual representation of data related to working from home. This infographic can be used as a guide to get you through some of the best opportunities available. Use this template to get the necessary tools to start working from home. Use this infographic to show your audience how many people work from home by adding statistics, tips and interesting facts. This template is designed to effectively communicate complex information in a simple format, making it great for exploring the topic of working from home. This is a perfect way to promote your business!


22 diapositivas
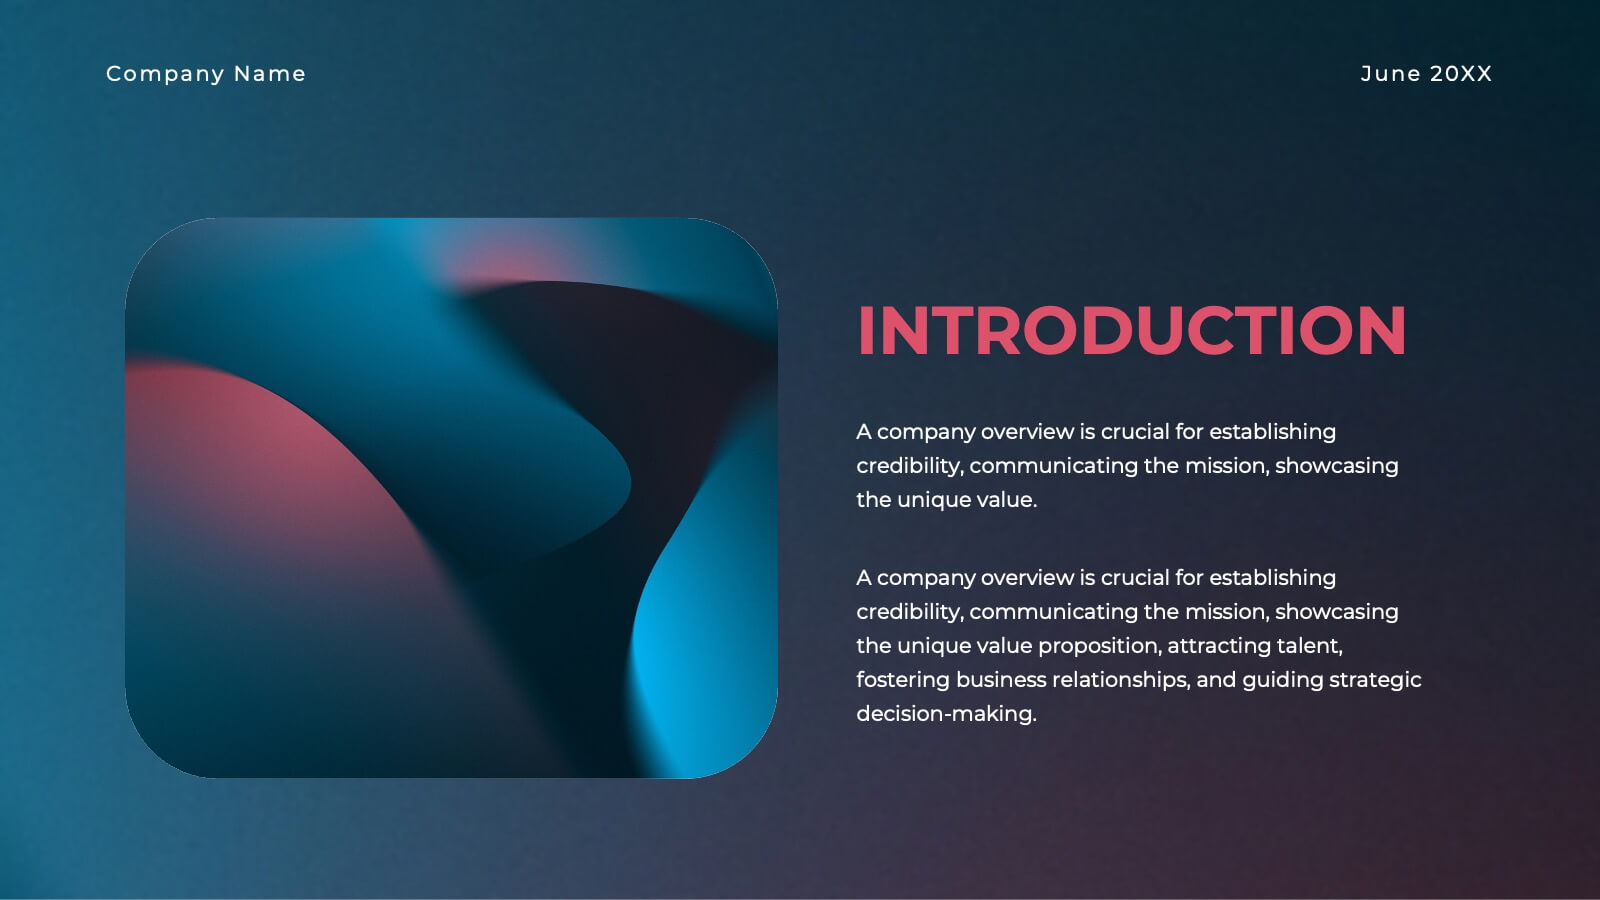
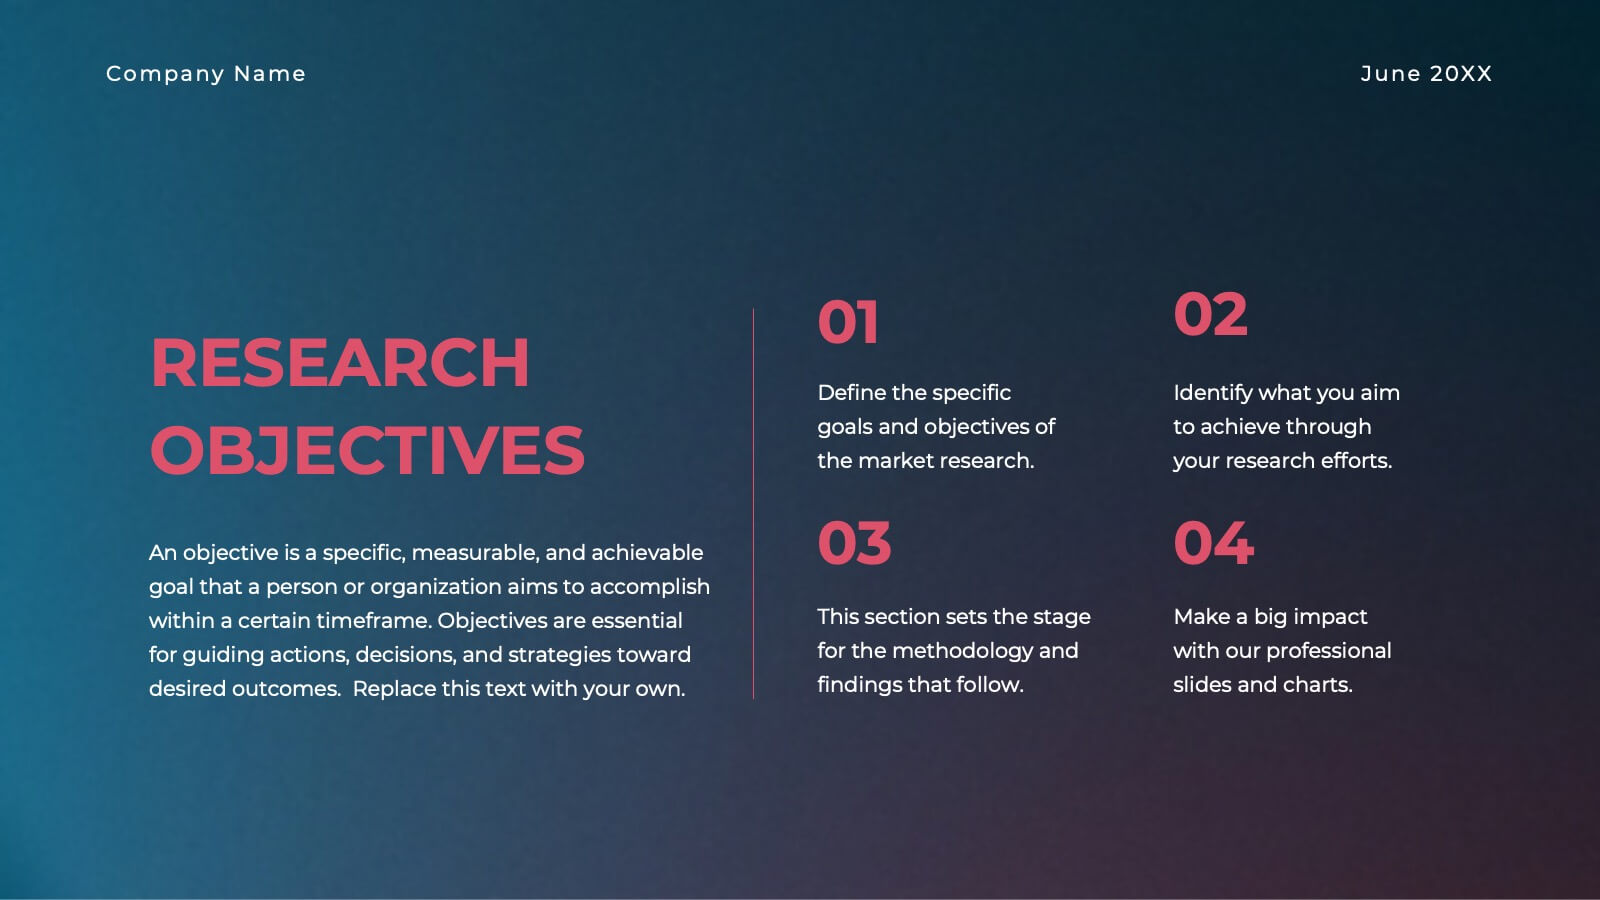
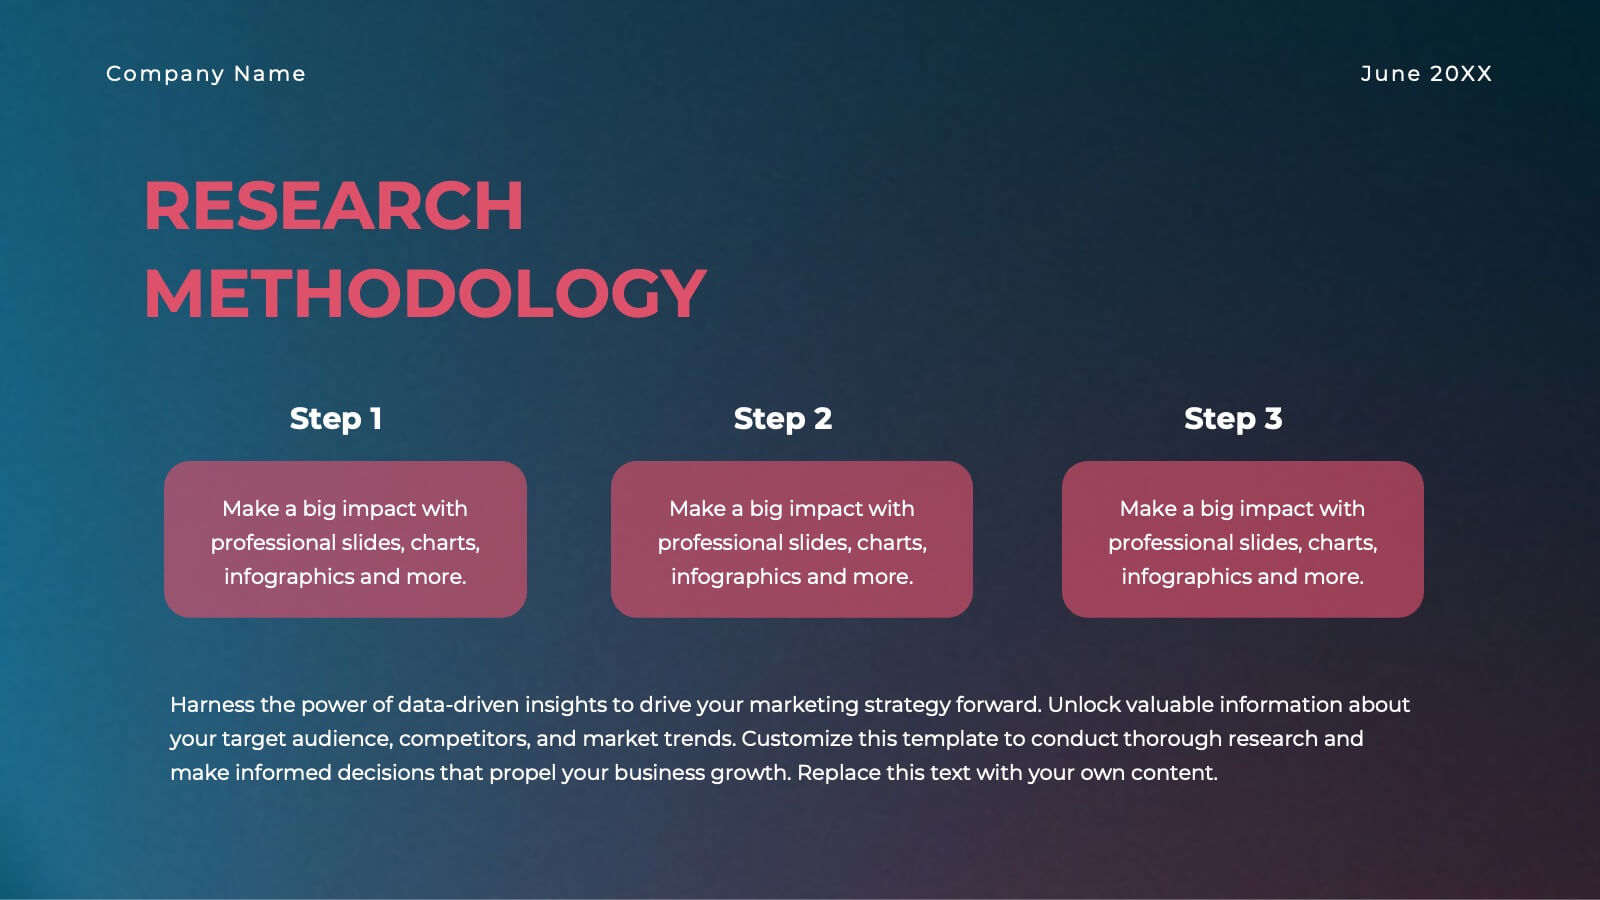
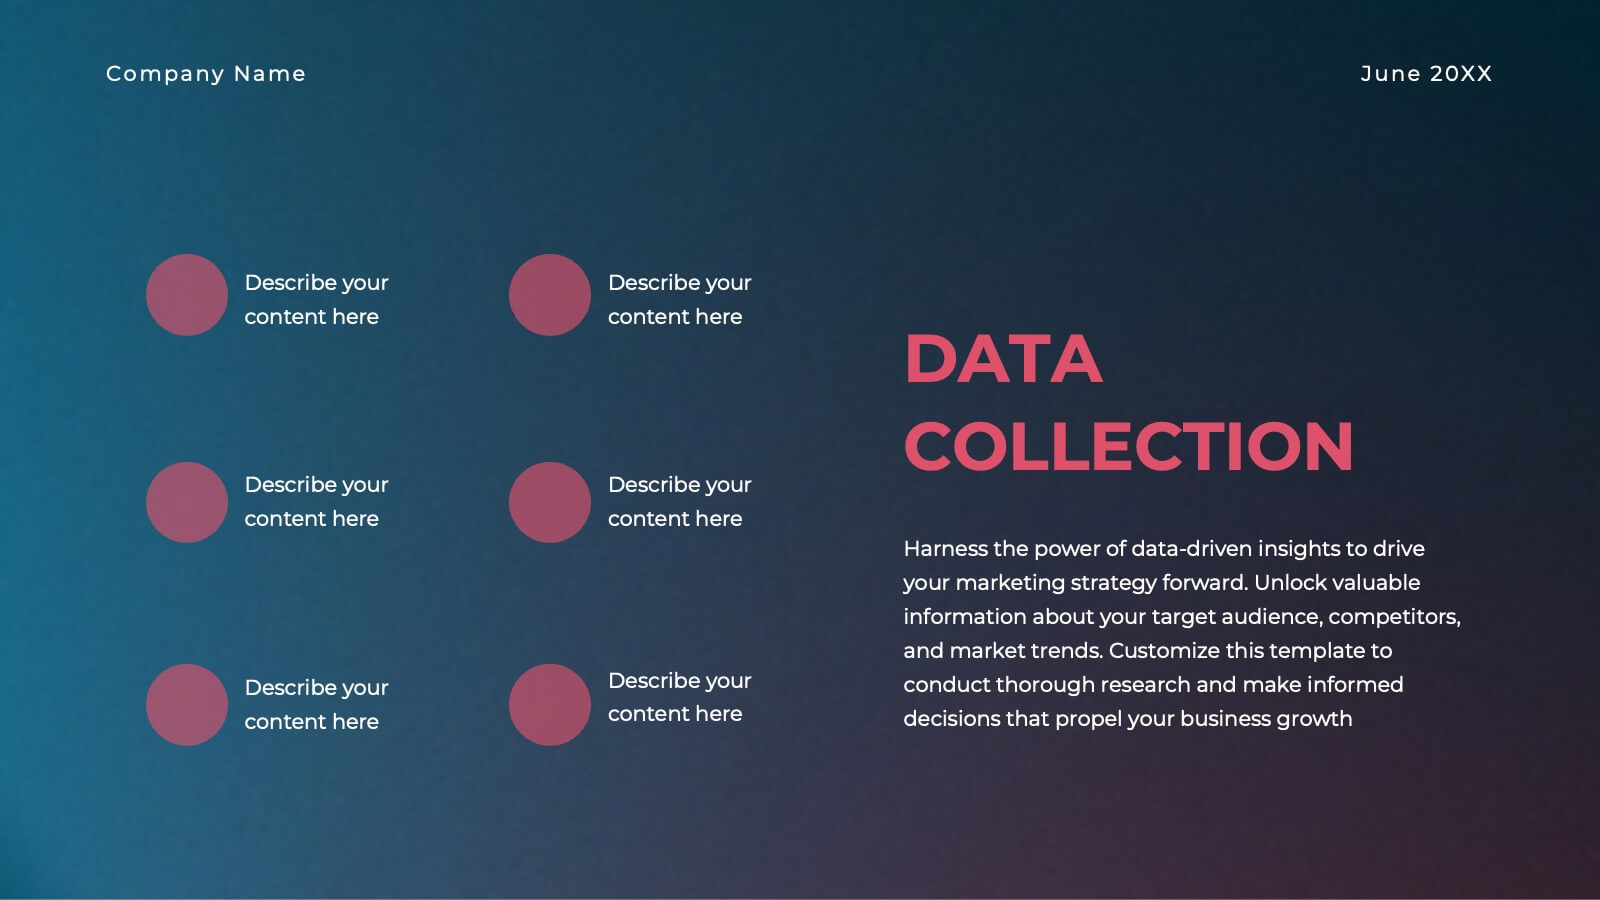
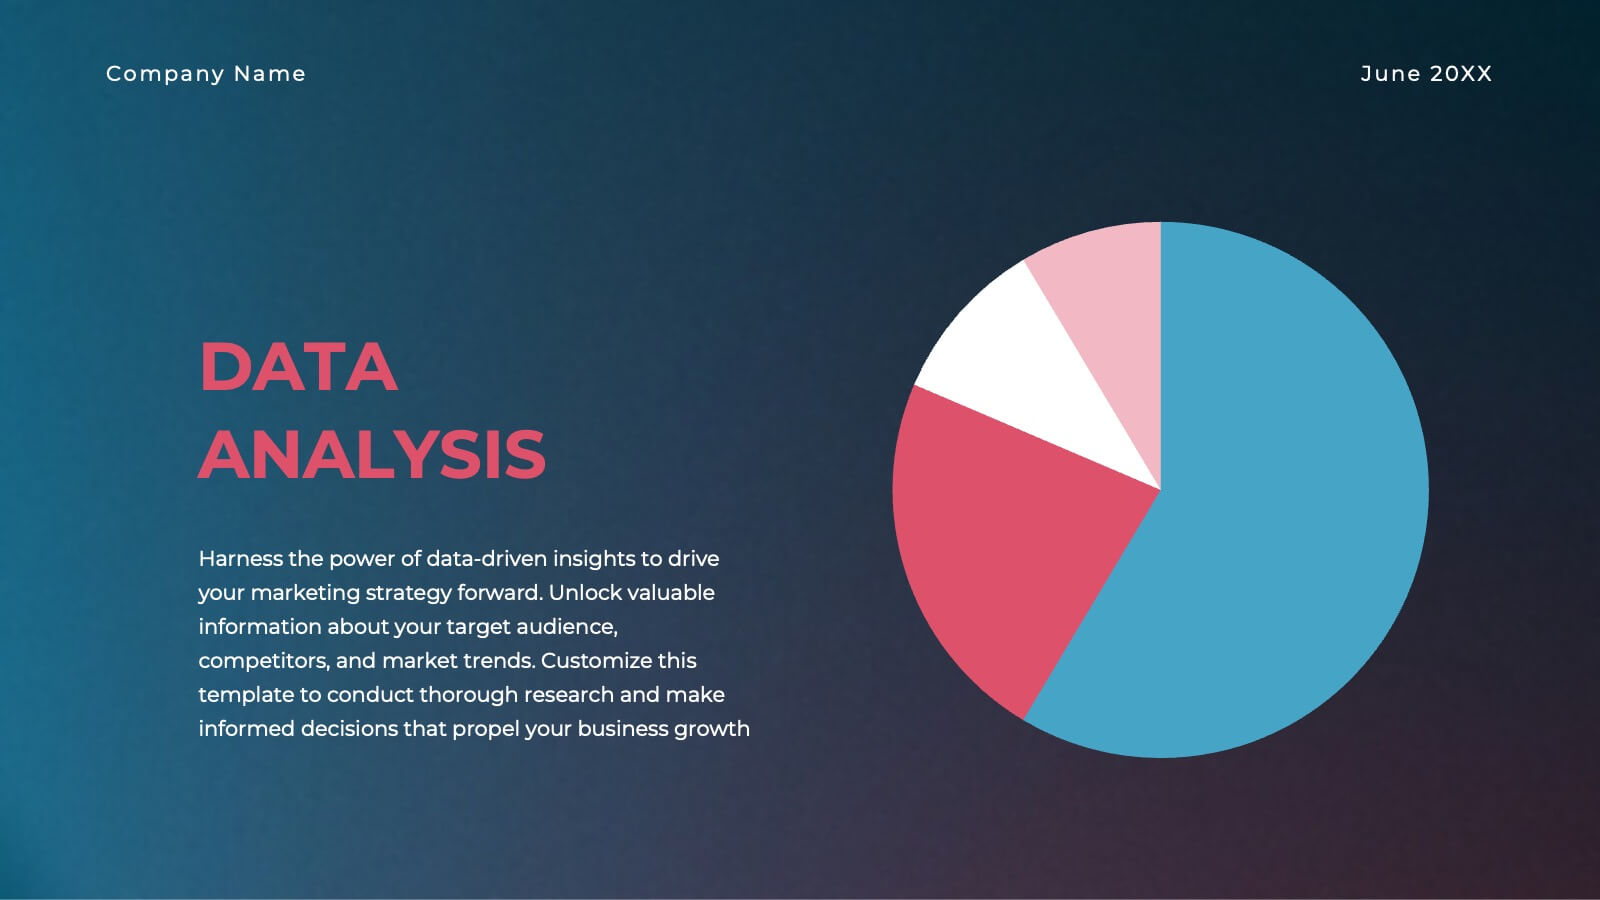
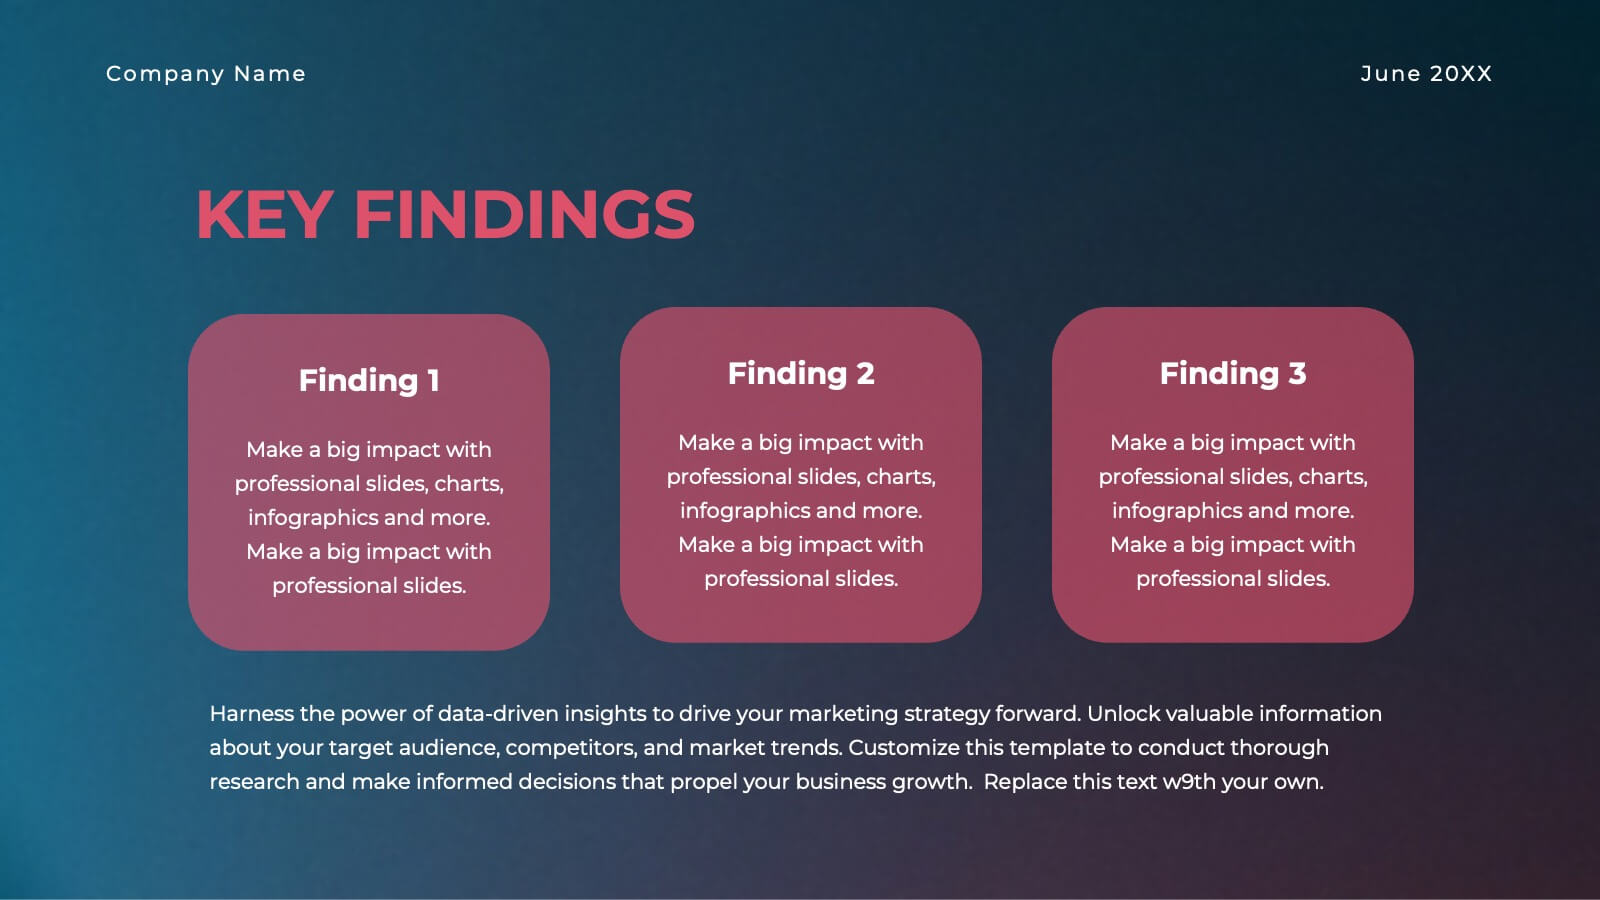
Gold Research Proposal Presentation
Present your research with impact using this sleek and modern research proposal template! Featuring sections for objectives, data collection, analysis, key findings, and recommendations, this template helps organize your research clearly and professionally. Fully customizable and compatible with PowerPoint, Keynote, and Google Slides, it's ideal for any research presentation.


6 diapositivas
TAM SAM SOM for Target Reach Forecasting Presentation
Break down your market reach with clarity using the TAM SAM SOM for Target Reach Forecasting Presentation. This sleek, layered circle diagram is ideal for illustrating your total addressable market, serviceable market, and obtainable market. Customize easily in PowerPoint, Keynote, or Google Slides to align with your brand and business strategy.


4 diapositivas
Historical Event Timeline Presentation
Visualize your timeline with this Historical Event layout, ideal for showcasing progress, milestones, or key moments over time. Featuring a horizontal design with date markers and icons, it’s perfect for history, education, or project recaps. Fully editable in PowerPoint, Keynote, and Google Slides to match your content and branding.


25 diapositivas
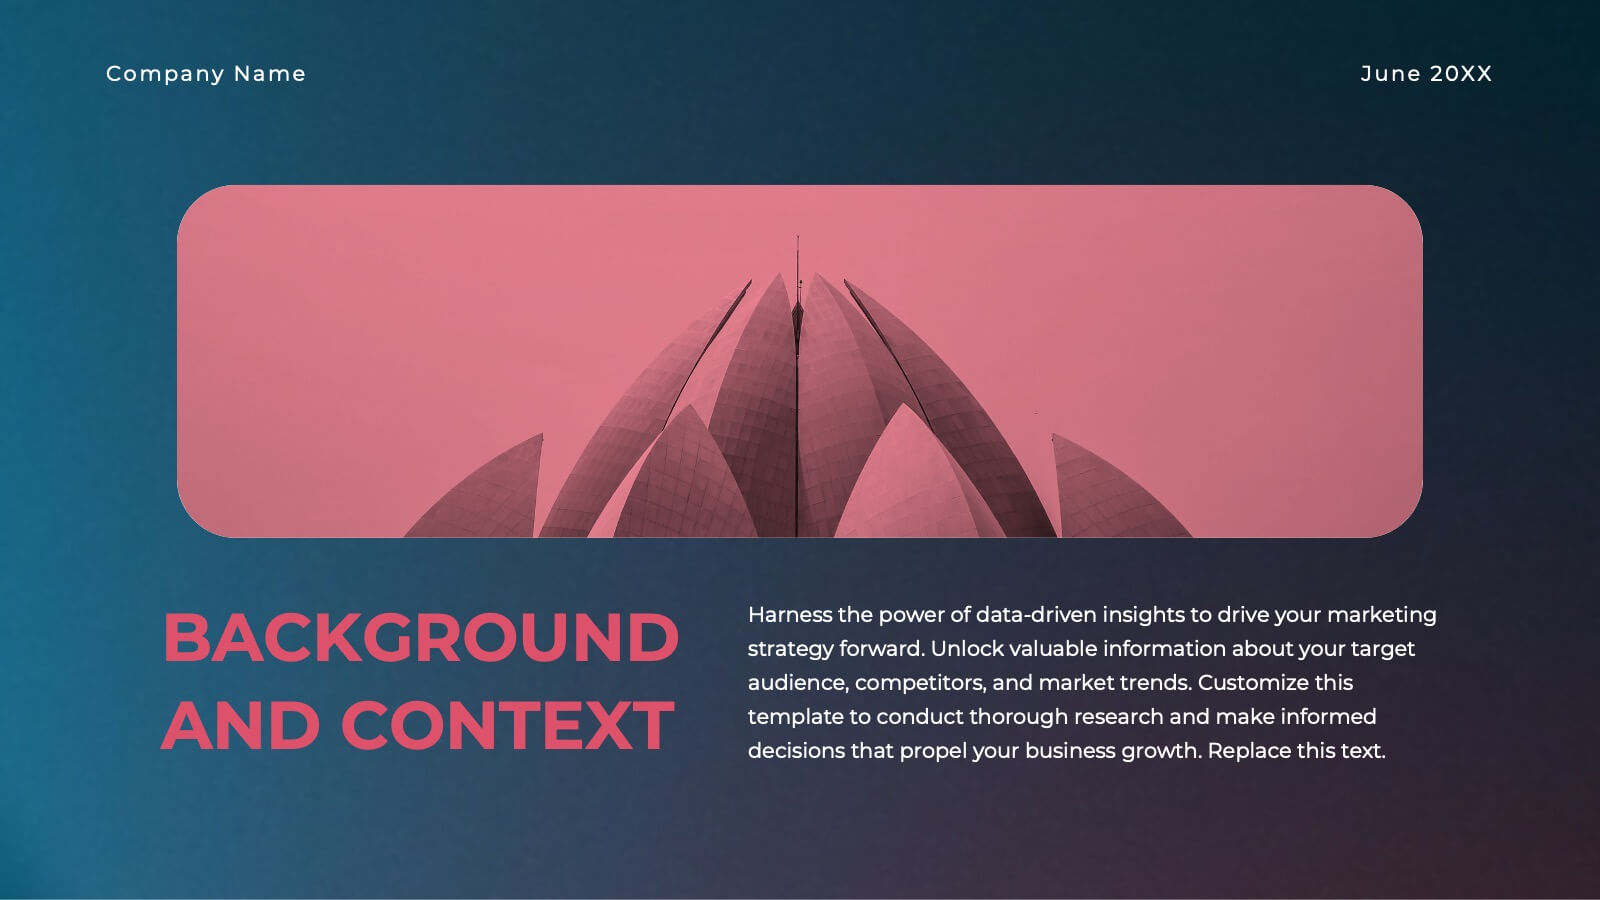
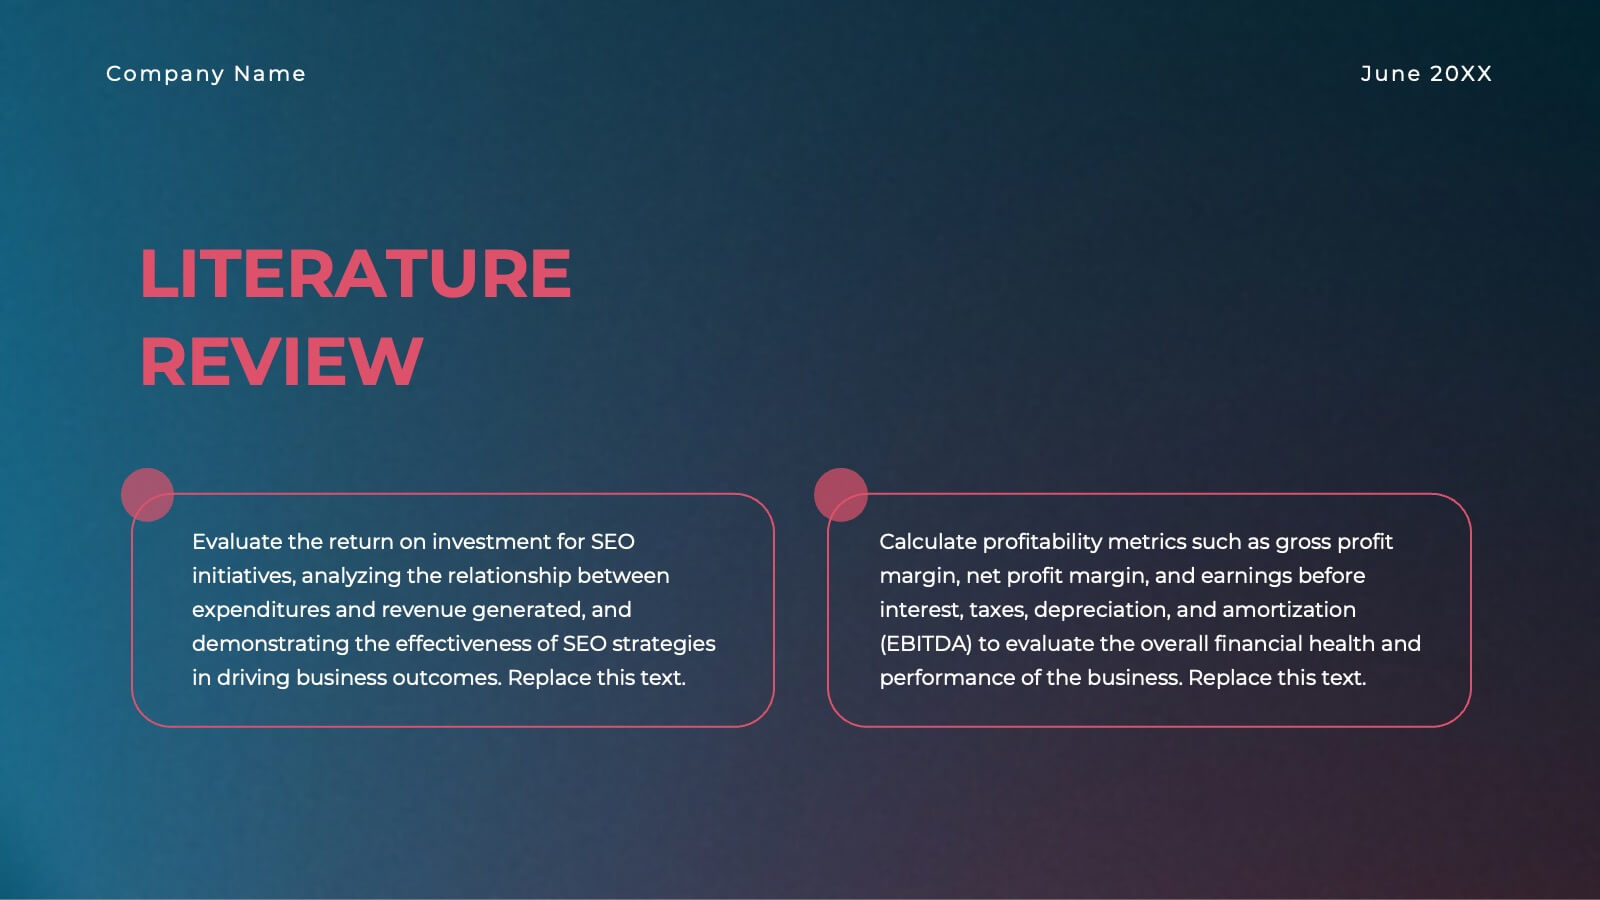
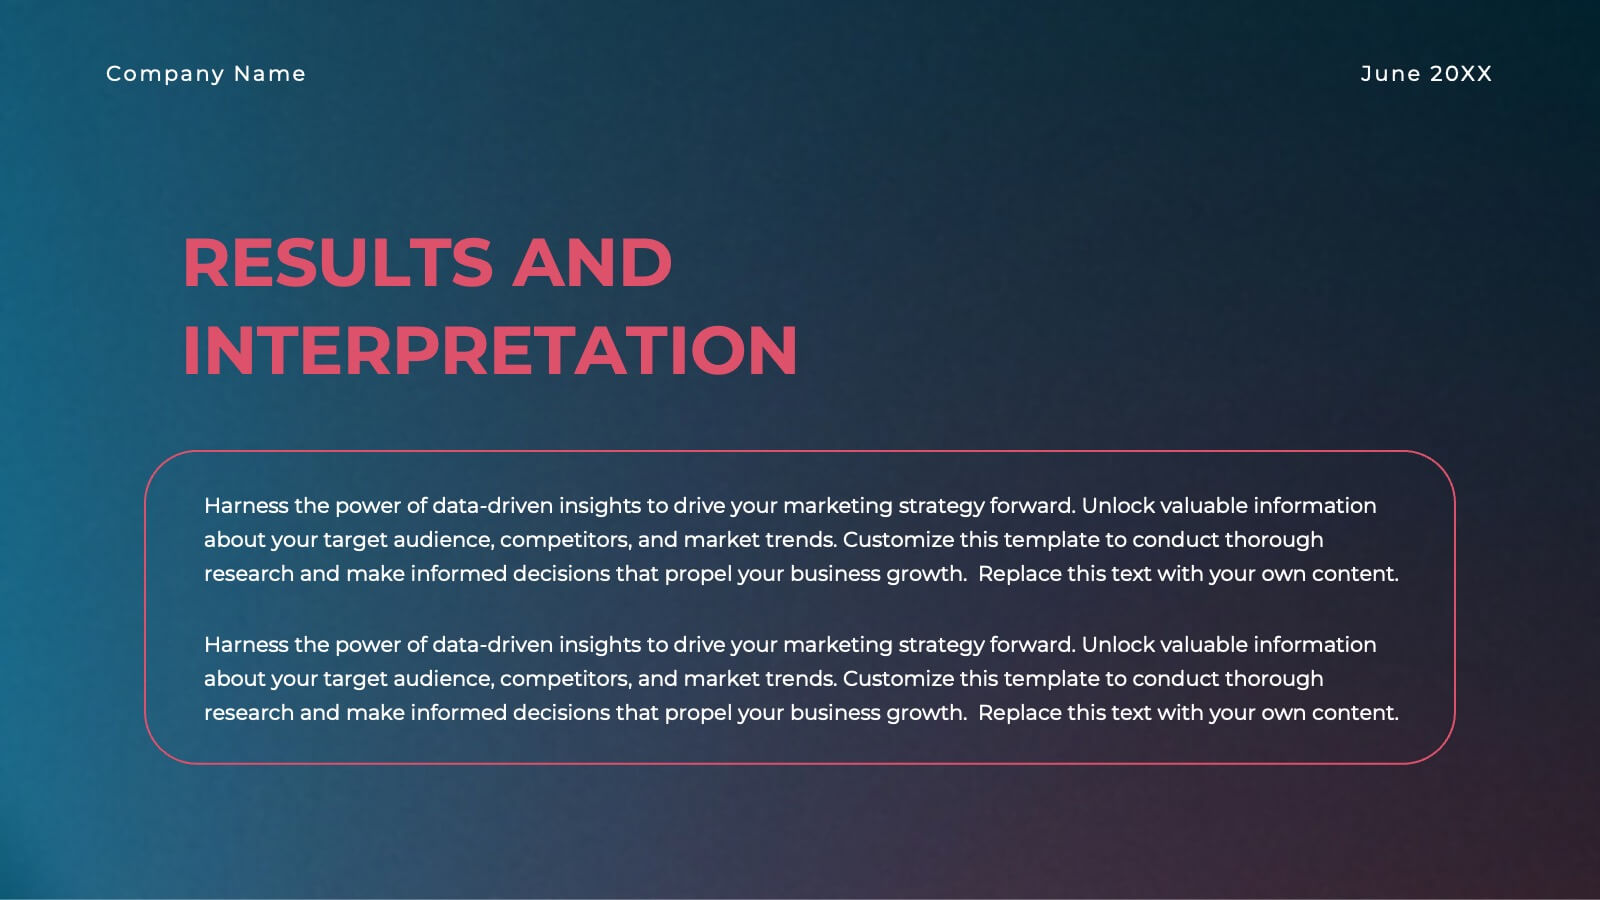
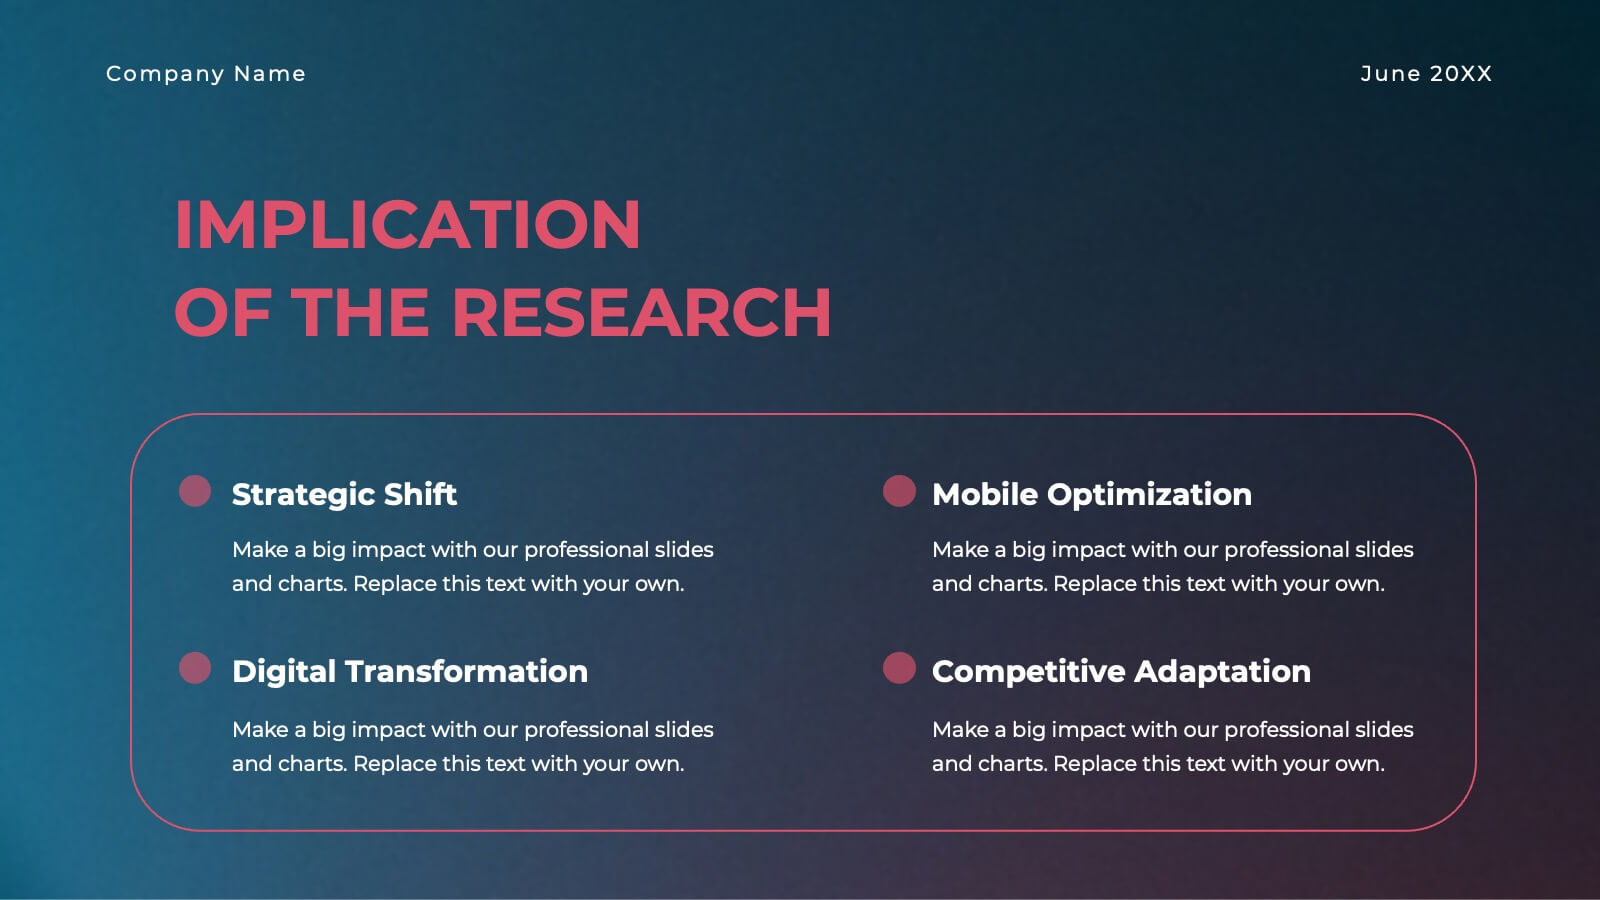
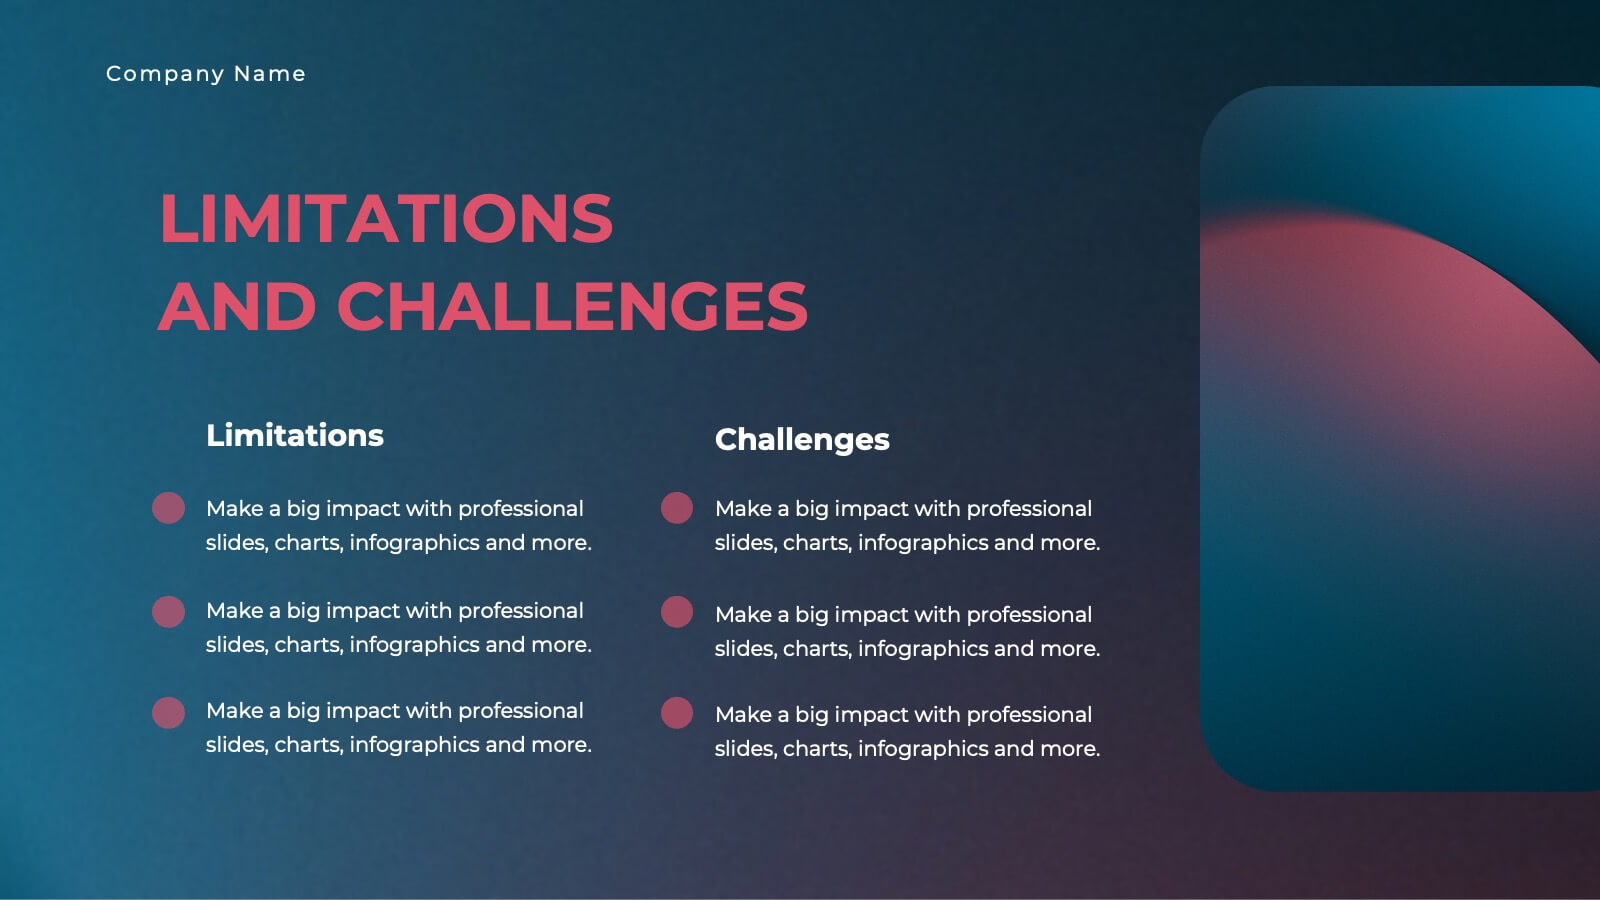
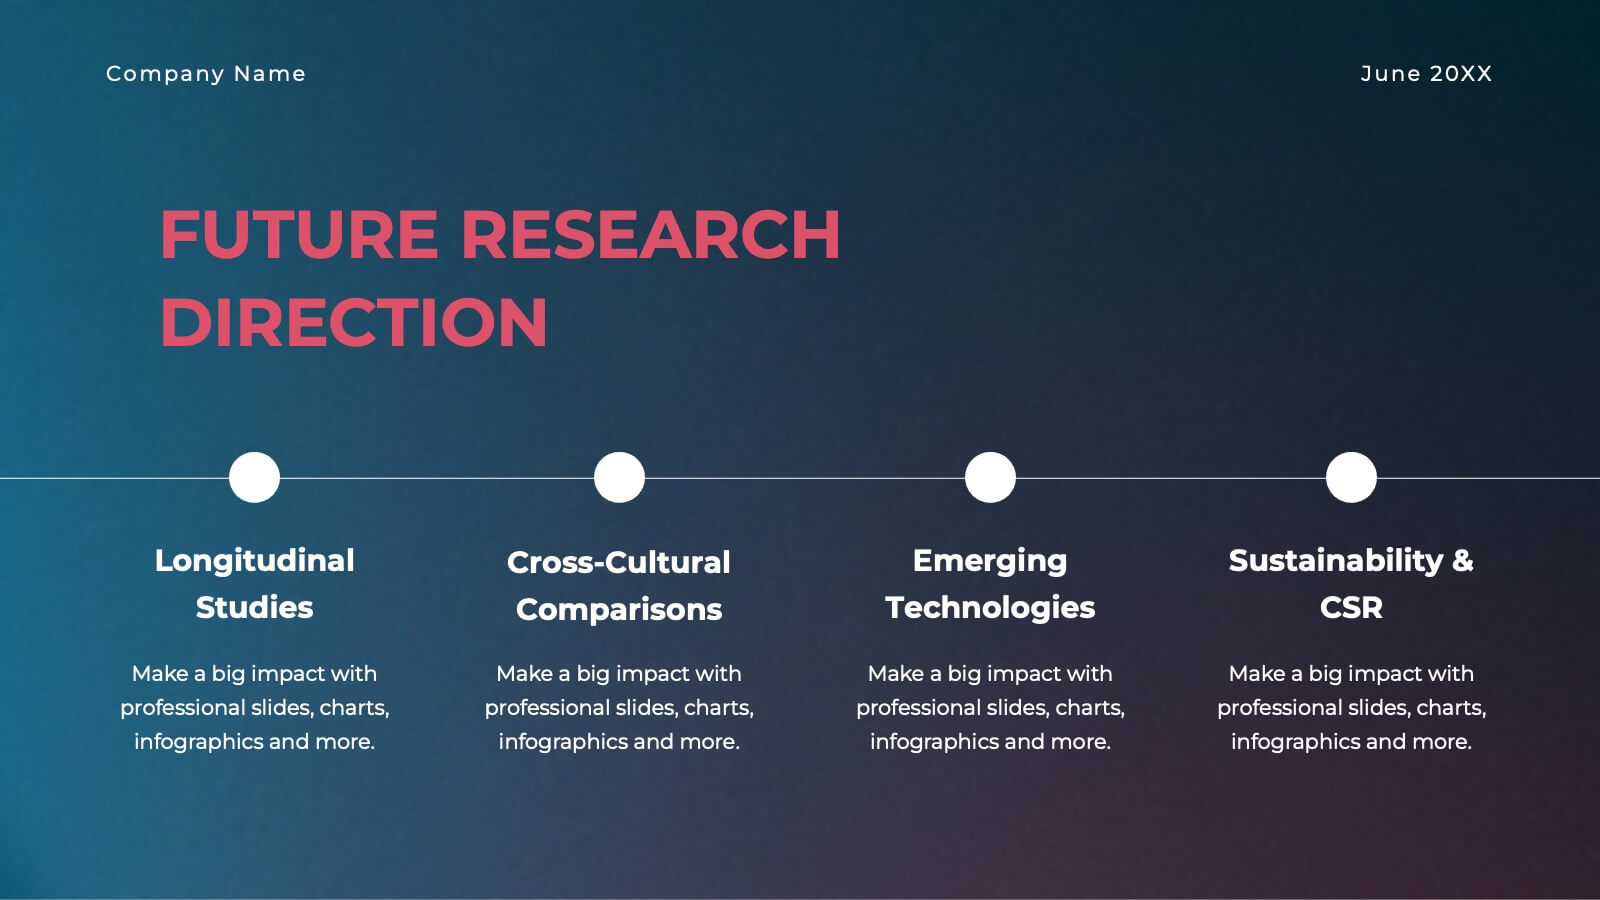
Keystone Market Research Presentation
Present your market research with confidence using this stylish, contemporary template. Perfect for detailing research objectives, data collection, and key findings, it features a sleek design with vibrant colors. Highlight critical aspects like market trends, results interpretation, and recommendations to captivate your audience. Compatible with PowerPoint, Keynote, and Google Slides, it ensures seamless presentations on any platform.


26 diapositivas
Leyna Presentation Template
Leyna is an elegant and minimalist wedding planner presentation template. This wonderful presentation template will help couples know what all you’ll offer as a wedding planner. We have made it easy for you this this multipurpose template because you will be able to edit easily to make sure it fits what you need. We have built a clean, responsive and modern design for them to have a great experience on what they are looking for in the best way possible. This template provides a professional and clean design for your business or personal use. It's time to impress the potential clients!


5 diapositivas
Innovation with Design Thinking Framework
Boost creativity and problem-solving with the Innovation with Design Thinking Framework Presentation. This slide features a vertically stacked rocket diagram symbolizing the five key phases of design thinking—perfect for illustrating iterative innovation processes. Each level includes editable text and icons, helping you align stakeholders around empathy, ideation, and prototyping. Ideal for workshops, innovation teams, educators, or product development presentations. Fully customizable in PowerPoint, Keynote, and Google Slides.


4 diapositivas
Blockchain and Cryptocurrency Market Analysis Presentation
Present complex blockchain structures and crypto market layers with clarity using the Blockchain and Cryptocurrency Market Analysis presentation template. Featuring a stacked cylinder diagram with four interactive data points, this layout is ideal for breaking down transaction flows, network layers, or decentralized finance (DeFi) ecosystems. Each title block offers space for concise key insights. Best suited for blockchain consultants, fintech startups, and crypto analysts. Fully compatible with PowerPoint, Keynote, and Google Slides.


6 diapositivas
Project Rollout Milestone Timeline Presentation
Visually map out your project phases with the Project Rollout Milestone Timeline Presentation. Featuring a modern cylinder path layout, this slide is perfect for showcasing five key milestones in sequential or strategic order. Ideal for project managers and teams, and fully editable in Canva, PowerPoint, Keynote, and Google Slides.


7 diapositivas
Creative Tree Diagram Infographic
Unveil hierarchical structures or processes with our evocative tree diagram infographic. Set against a pristine white canvas and enriched with shades of trusty blue and organic green, this creative template epitomizes growth, interconnections, and systematic understanding. Embellished with crisp infographics, intuitive icons, and illustrative image placeholders, it effortlessly visualizes layered information. Perfectly tailored for Powerpoint, Keynote, or Google Slides. An indispensable resource for project managers, educators, business analysts, or any organization aiming to display branching information or decisions. Grow with clarity; let each slide branch out into a wealth of understanding.


5 diapositivas
Performance Metrics Dashboard Presentation
Turn complex data into clear, engaging visuals with a clean, modern dashboard layout that highlights performance results at a glance. Perfect for tracking KPIs, progress, and team outcomes, this template brings structure and clarity to reports. Easily editable in PowerPoint, Keynote, and Google Slides for professional presentations.


4 diapositivas
Global Market Overview with World Map Presentation
Present international data visually with this world map slide layout. Ideal for showcasing market reach, regional insights, or global performance metrics. Each pin can be customized with location-specific information and iconography. Perfect for business overviews, sales reports, and investor decks. Editable in PowerPoint, Keynote, and Google Slides.


4 diapositivas
Business SWOT Evaluation Presentation
Break down business strategies with this visually structured SWOT analysis layout. Present strengths, weaknesses, opportunities, and threats in a clean, quadrant-style format. Ideal for reports, pitches, or internal reviews. Fully editable in PowerPoint, Keynote, and Google Slides for clear, impactful analysis that drives smarter decision-making and strategic alignment.


4 diapositivas
Task Automation Workflow Presentation
Streamline your operations with the Task Automation Workflow template, designed to visualize automated processes and optimize efficiency. Perfect for project managers and teams, this template helps clarify task dependencies, process flows, and automation impact. Fully customizable and compatible with PowerPoint, Keynote, and Google Slides for seamless workflow presentations.


4 diapositivas
Artistic Watercolor Theme Presentation
Make a bold creative statement with this Artistic Watercolor Theme Presentation. Featuring a painter’s palette design and vibrant color splashes, this layout is ideal for showcasing four key ideas or creative concepts. Perfect for designers, educators, and artists, the layout is fully customizable in PowerPoint, Keynote, and Google Slides.