


Características


¿Tienes alguna pregunta?
Recomendar


4 diapositivas
Machine Learning Overviews Presentation
Bring your audience into the world of intelligent automation with a bold, visual layout that makes complex concepts feel simple and engaging. This presentation breaks down key processes, workflows, and insights using clear graphics that support your message. Fully customizable and compatible with PowerPoint, Keynote, and Google Slides.


26 diapositivas
Creative Home Office Setups Presentation
Transform your workspace into an inspiring and productive haven with this engaging presentation on creative home office setups. Covering ergonomic design, aesthetic organization, tech essentials, and personalized decor, this template helps you present ideas that enhance efficiency and comfort. Fully customizable and compatible with PowerPoint, Keynote, and Google Slides for a seamless experience.


4 diapositivas
Artificial Intelligence Strategy Map Presentation
Step into the future with a clean, modern layout that makes complex technology easy to grasp and exciting to explore. This presentation helps you break down emerging innovations, real-world applications, and industry opportunities using clear visuals and structured sections. Fully customizable and compatible with PowerPoint, Keynote, and Google Slides.


5 diapositivas
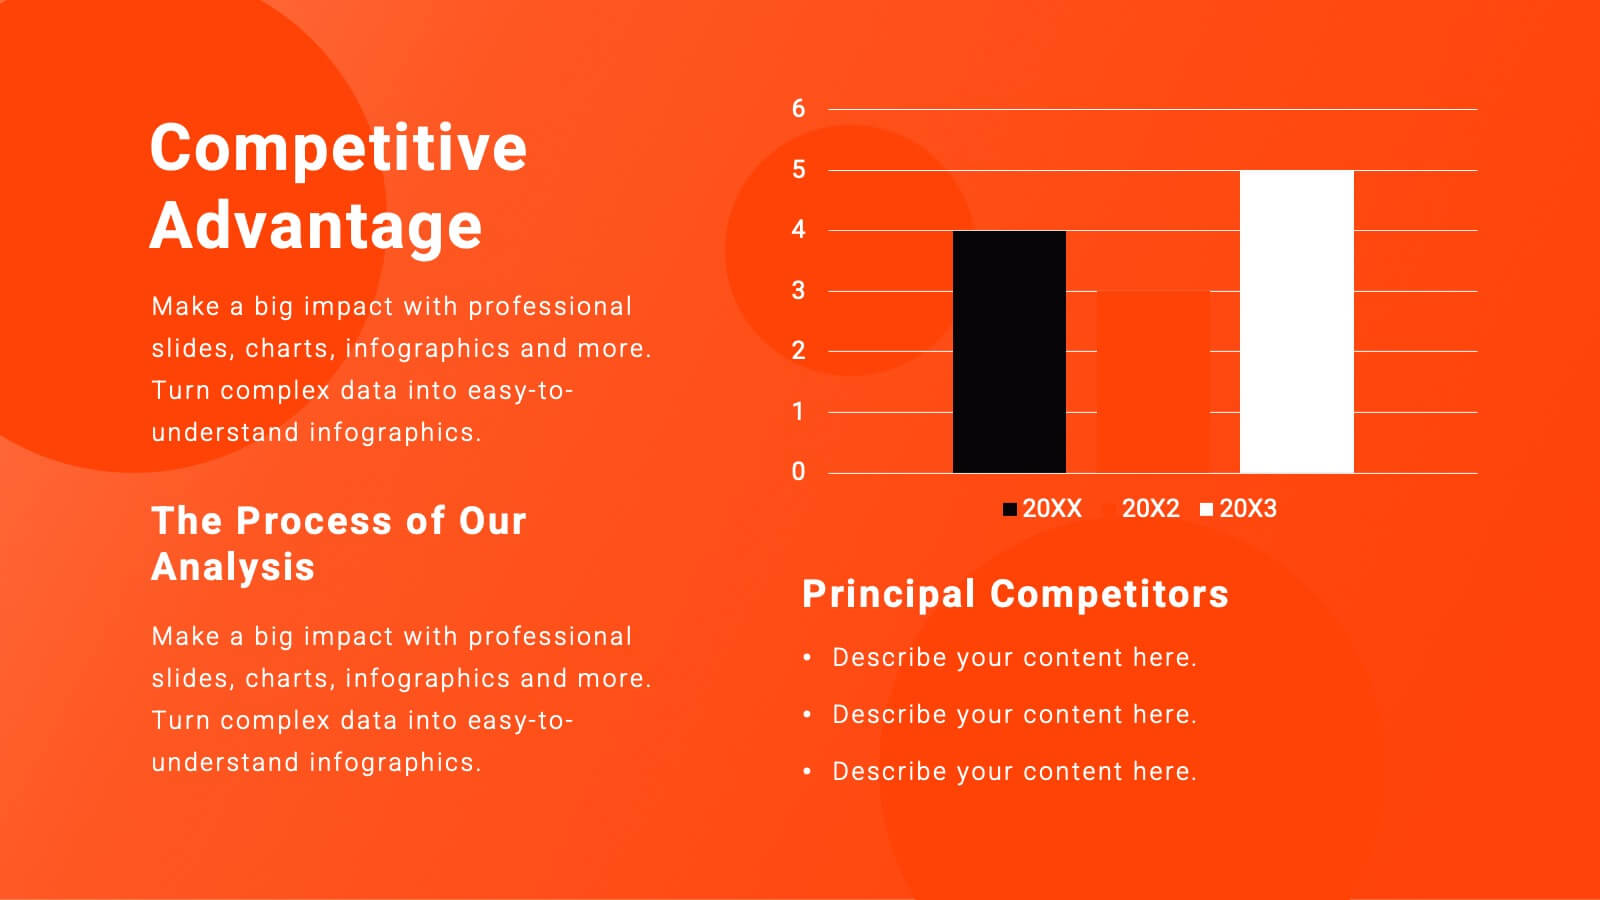
Rival Strategy Review Presentation
Bring competitive insights to life with a modern, circular layout that highlights rival strategies, key strengths, and market positioning. Perfect for analyzing competitors and identifying growth opportunities, this presentation combines clarity with style. Fully compatible with PowerPoint, Keynote, and Google Slides for effortless customization and professional delivery.


20 diapositivas
Team Meeting Presentation
Streamline your team meetings with this professional presentation template, designed in striking purple tones. It covers all essential aspects from agenda setting to feedback collection, ensuring efficient and effective communication. Compatible with PowerPoint, Google Slides, and Keynote, this template is perfect for keeping your team aligned and focused.


23 diapositivas
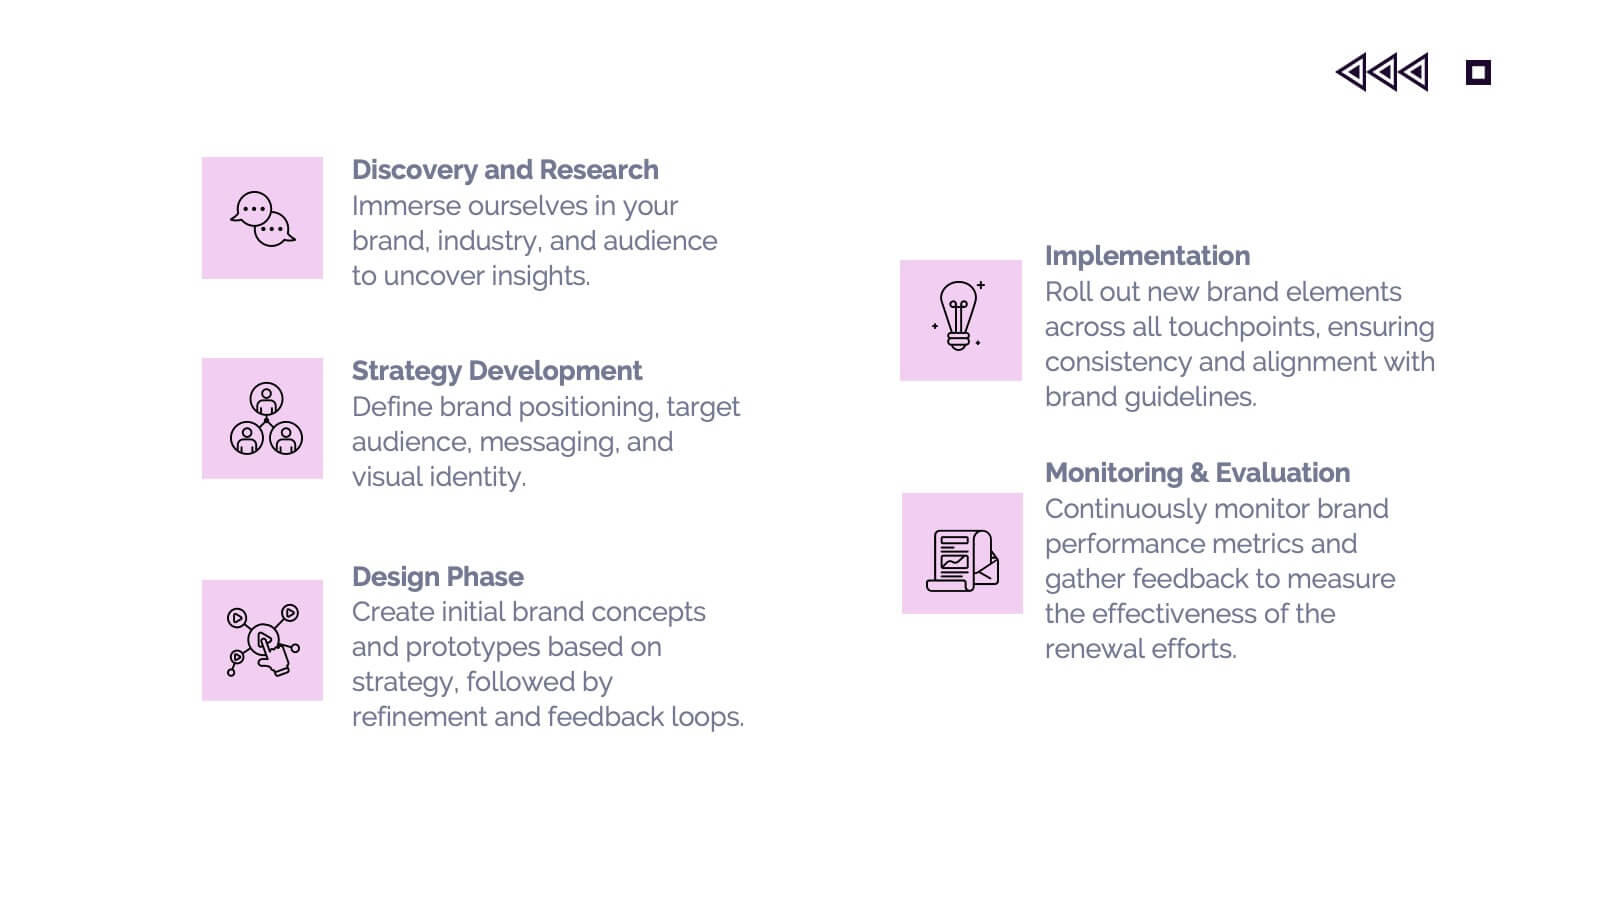
Wendigo Agency Portfolio Presentation
This sleek agency portfolio template showcases your mission, services, and success stories with modern flair. From case studies and strategy development to campaign execution and client testimonials, it’s designed to highlight your agency’s strengths. Perfect for agency presentations across PowerPoint, Keynote, and Google Slides, this template makes your content shine effortlessly.


21 diapositivas
Eidolon Digital Strategy Presentation
Craft a forward-thinking presentation with a dynamic template designed for digital strategies. Highlight key components such as current landscape analysis, market trends, and competitive insights to provide a comprehensive overview of your strategic vision. Use the SWOT analysis and key challenges slides to identify opportunities and areas of growth. Showcase your value proposition and strategic initiatives, backed by detailed plans for resource allocation, risk management, and implementation timelines. The template also includes sections for performance metrics, communication strategies, and team roles and responsibilities, ensuring every detail is covered. With its sleek and professional design, this template is fully editable and compatible with PowerPoint, Google Slides, and Keynote, making it an ideal choice for businesses, consultants, or agencies aiming to communicate their digital strategies with precision and impact.


6 diapositivas
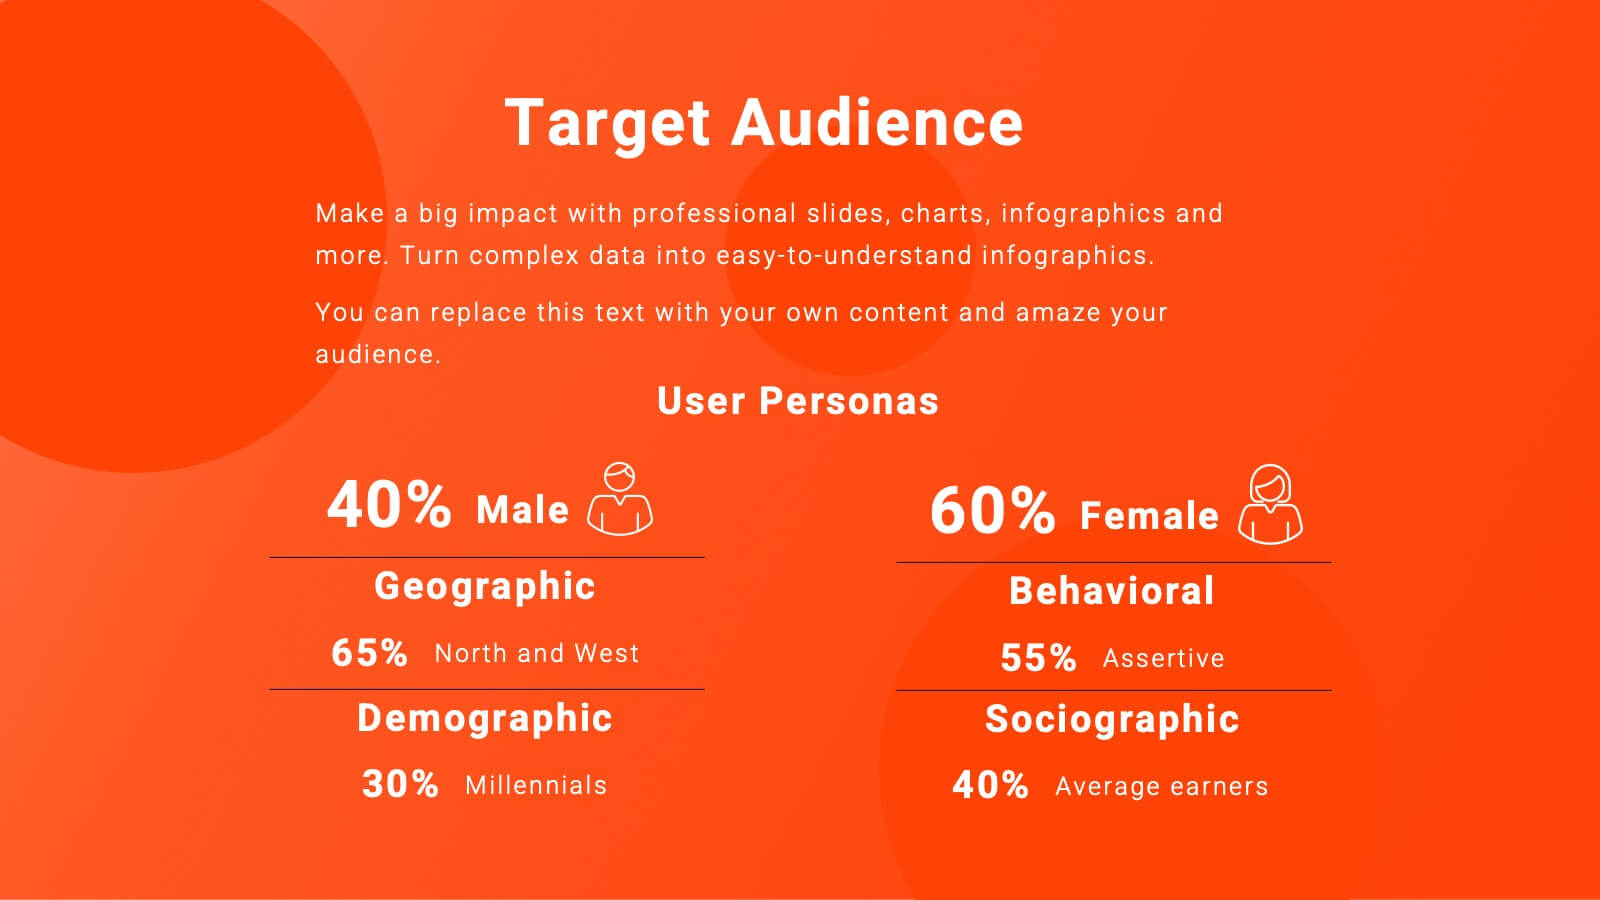
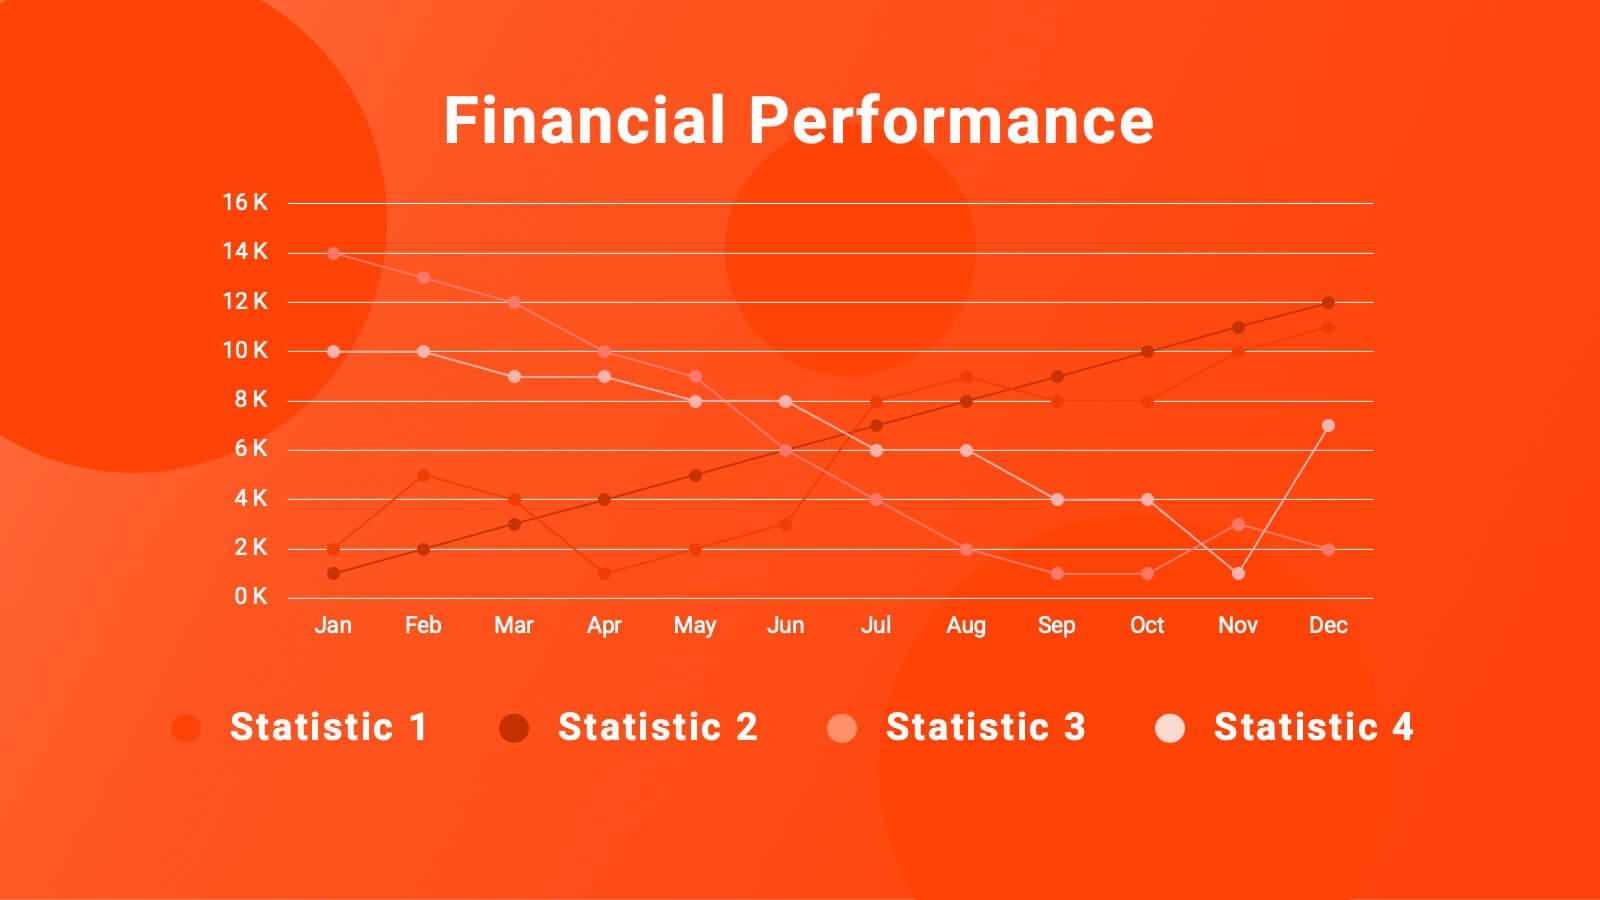
Statistical Data Overview Presentation
Transform raw numbers into a compelling visual story with a clean and structured layout that highlights key insights effortlessly. Ideal for showcasing progress, analytics, and results, this design helps simplify complex data for clear communication. Fully editable and compatible with PowerPoint, Keynote, and Google Slides for seamless customization.


5 diapositivas
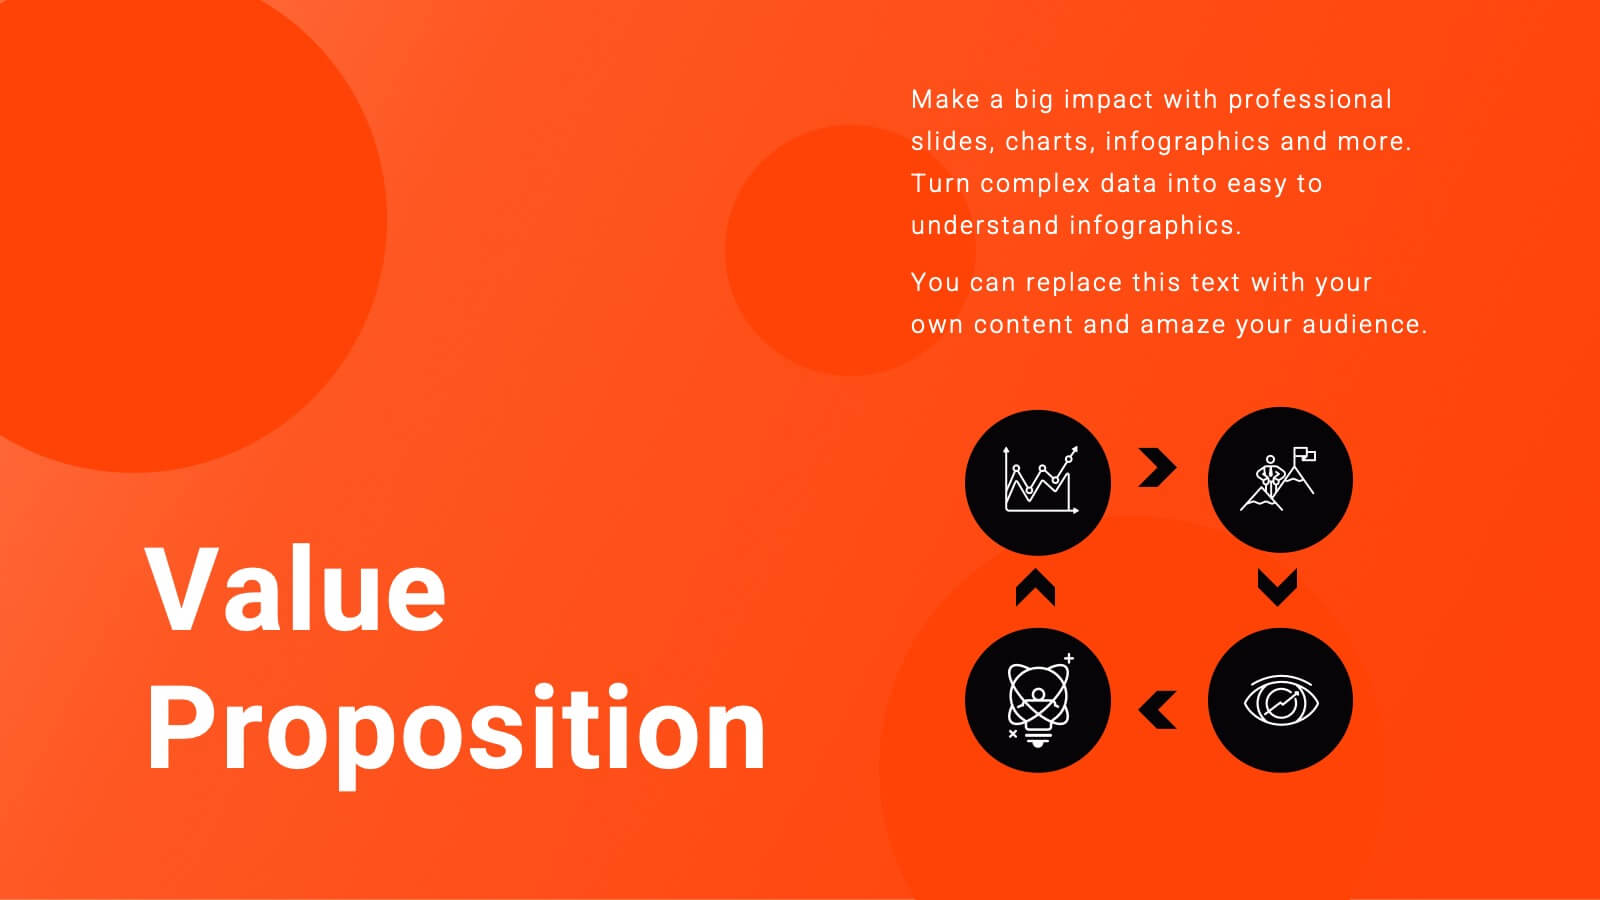
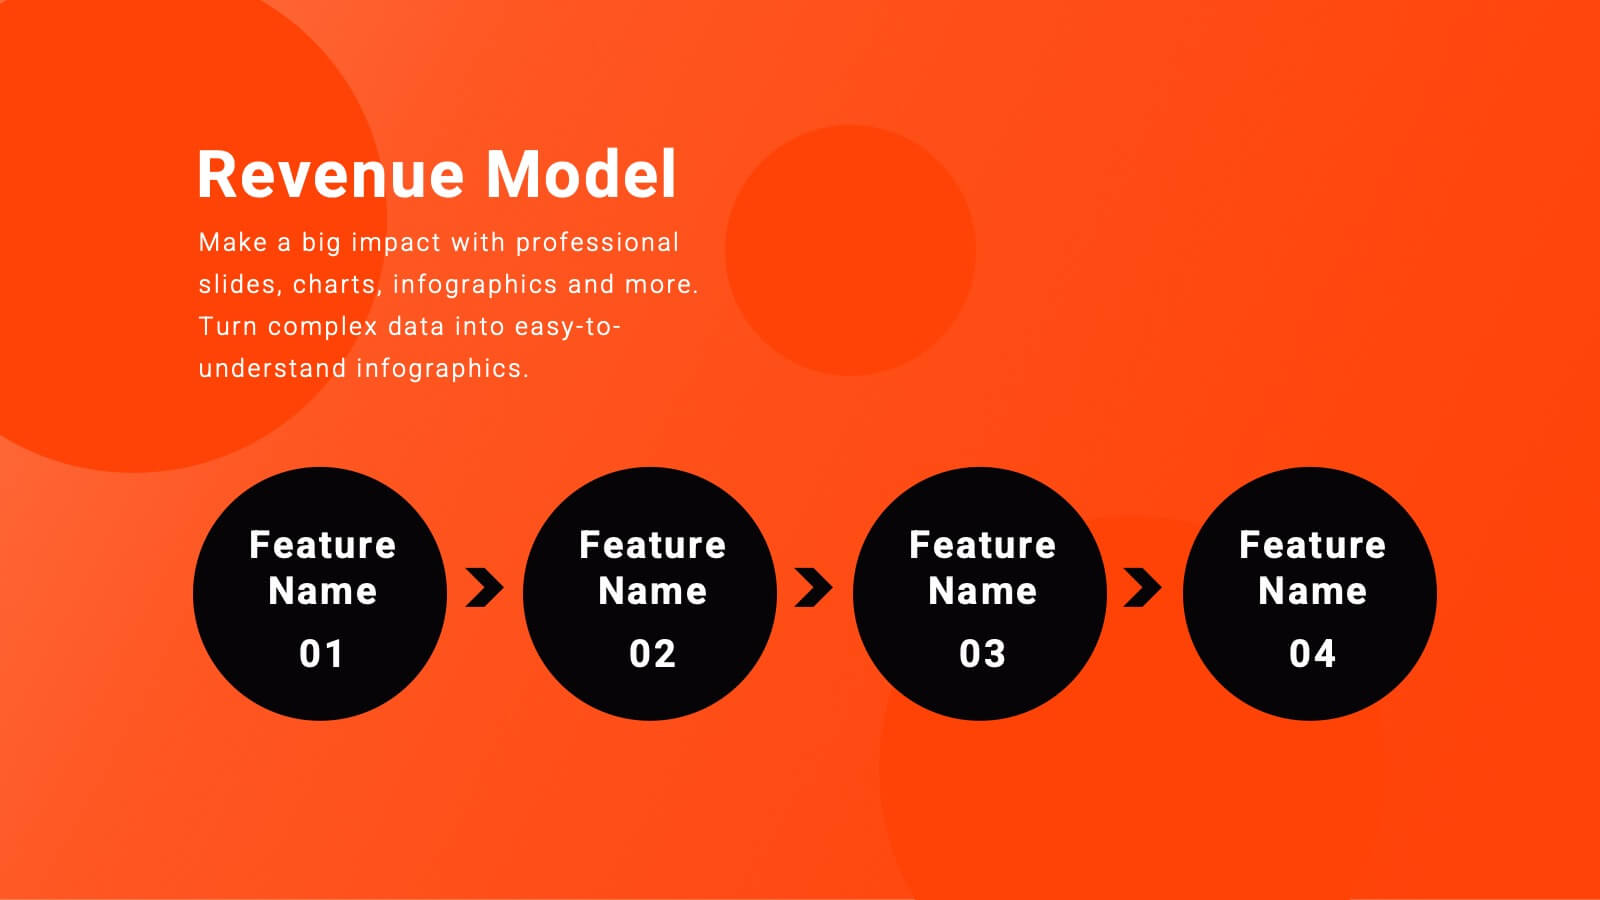
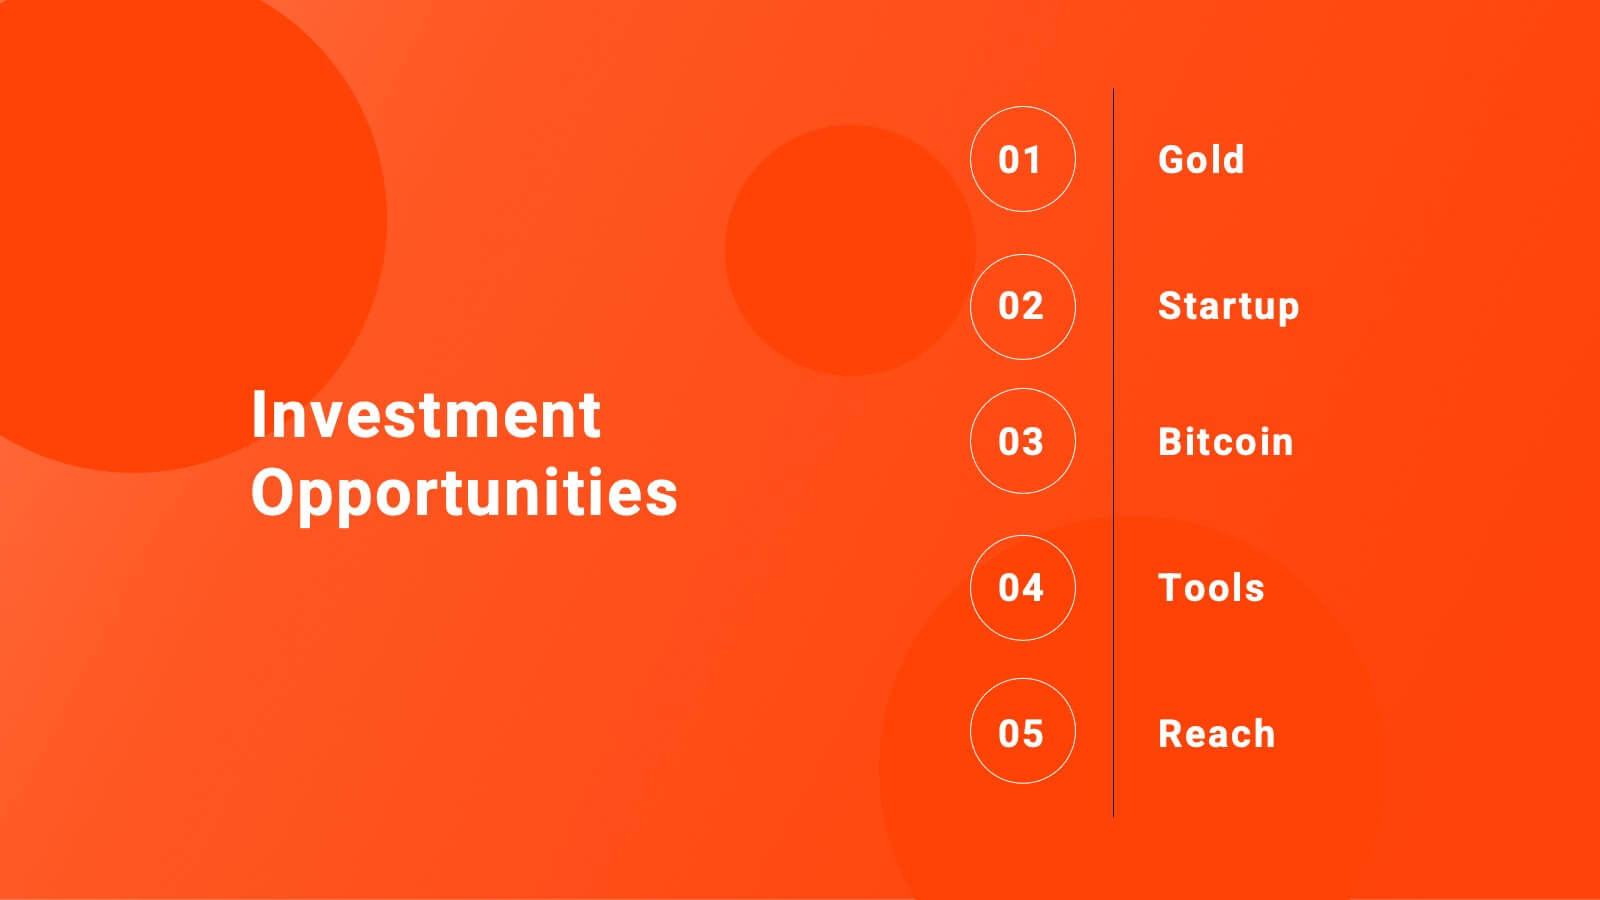
Investment Opportunity Business Case
Visualize the value behind your proposal with this key-themed layout, ideal for presenting compelling reasons to invest. Each section highlights a unique point, making it easy to walk stakeholders through critical benefits and insights. Fully editable and compatible with PowerPoint, Keynote, and Google Slides.


6 diapositivas
Virtual Meeting Best Practices Presentation
Master your online meetings with this sleek, illustrated layout featuring a character graphic and clear content blocks. Designed to share virtual etiquette, tools, or steps for effective communication, it’s ideal for remote team briefings and onboarding. Fully editable and compatible with PowerPoint, Keynote, and Google Slides.


26 diapositivas
Melo Presentation Template
Are you looking for a presentation to make your product stand out? Melo is a beautifully elegant presentation with modern elements and light neutral color palette. Perfect for furniture brands, or any one looking for a modern presentation. These slides include world maps, company slides, mockups and charts perfect for businesses, this template has everything you'll need. It's simple yet chic design makes it stand out and at the same time keep your audience engaged. This is the perfect choice for businesses, brands or anyone who needs to make a great looking template on their next presentation


5 diapositivas
Human Capital Planning Overview Presentation
Streamline workforce strategies with the Human Capital Planning Overview Presentation. This structured template helps visualize talent development, succession planning, and HR workflows in clear, step-by-step layouts. Perfect for HR leaders, consultants, and executives. Fully editable in PowerPoint, Keynote, and Google Slides for seamless customization to match your team or organization.


6 diapositivas
Leadership Vision and Strategy Presentation
Present your organization’s goals with this leadership vision and strategy template, designed with a hierarchy graphic to represent team structure and growth. Perfect for strategic planning, leadership meetings, and corporate presentations. Fully editable in Canva, PowerPoint, or Google Slides, making it easy to customize colors, text, and layout to fit your brand.


23 diapositivas
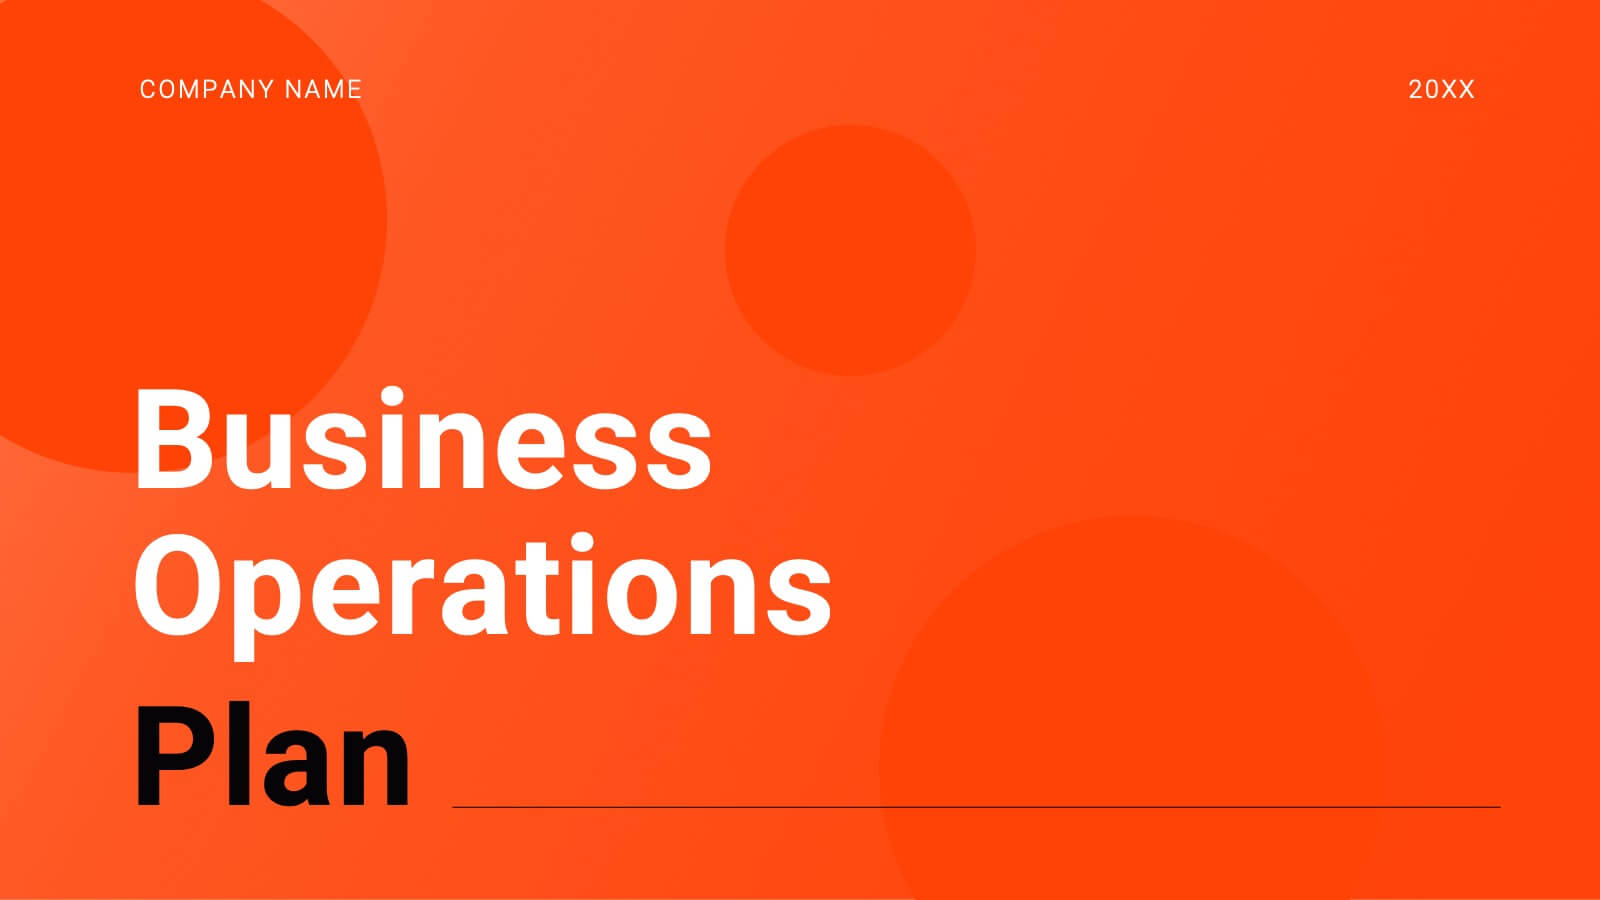
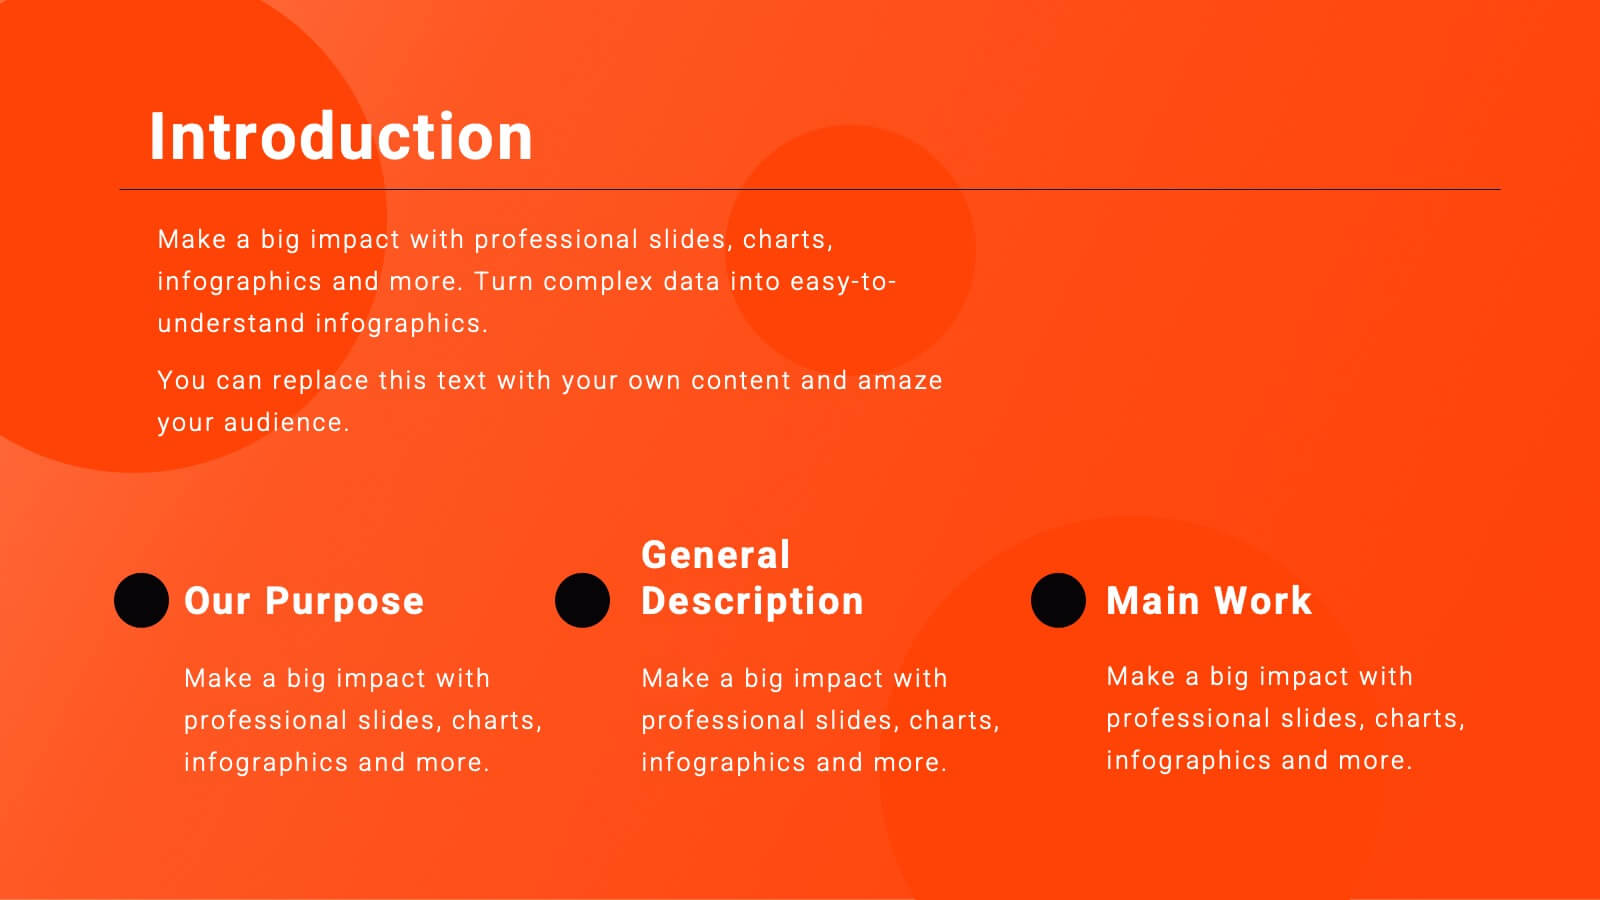
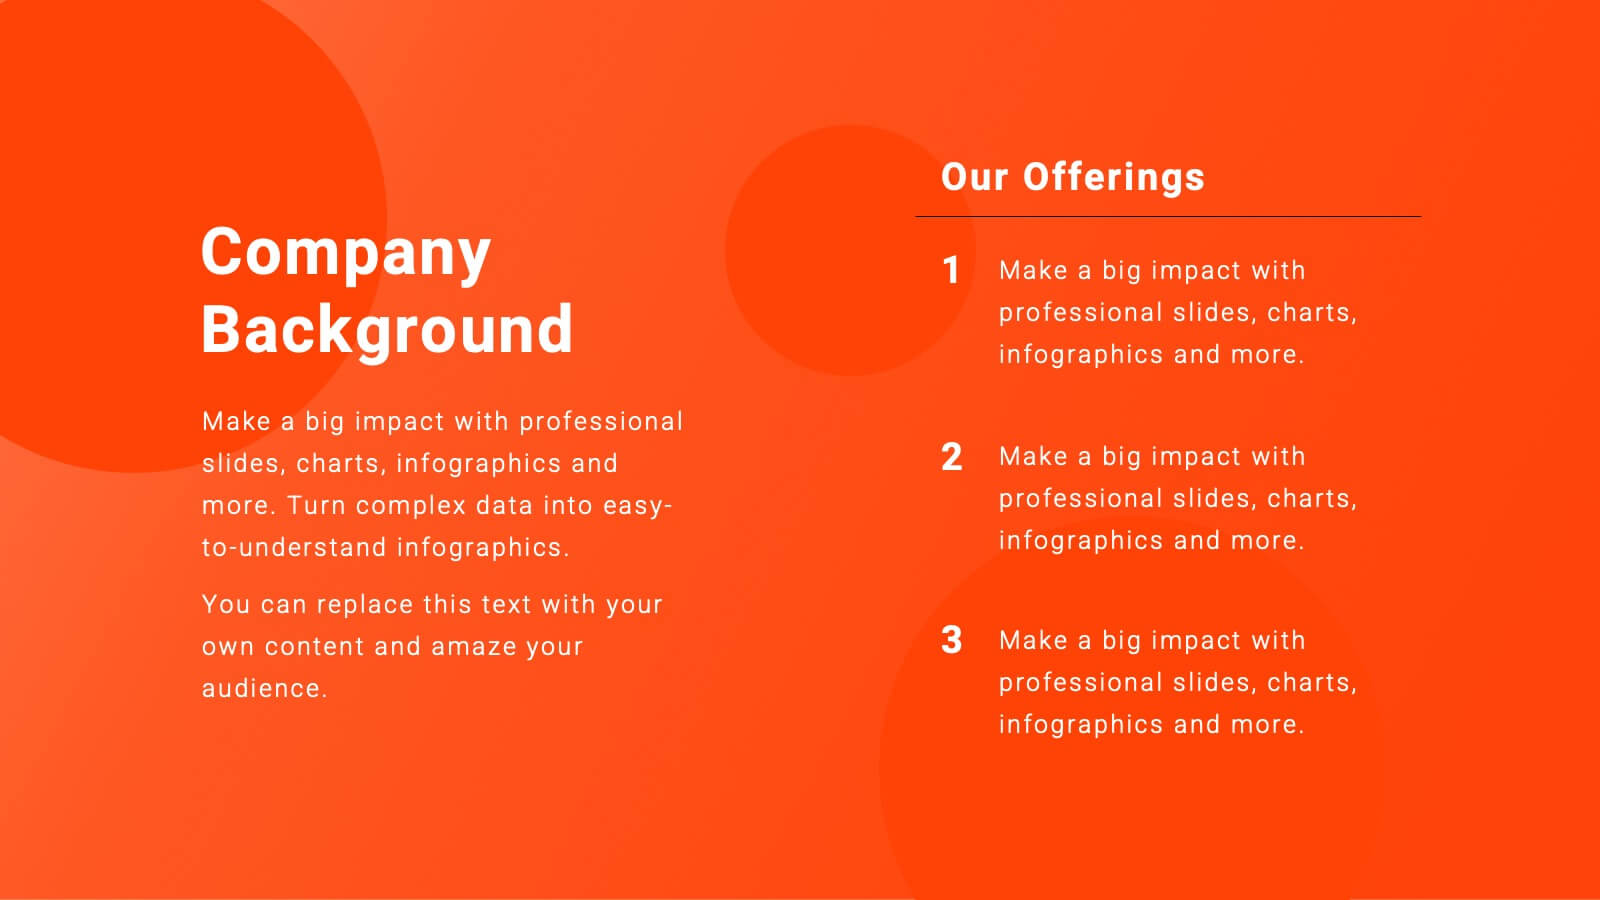
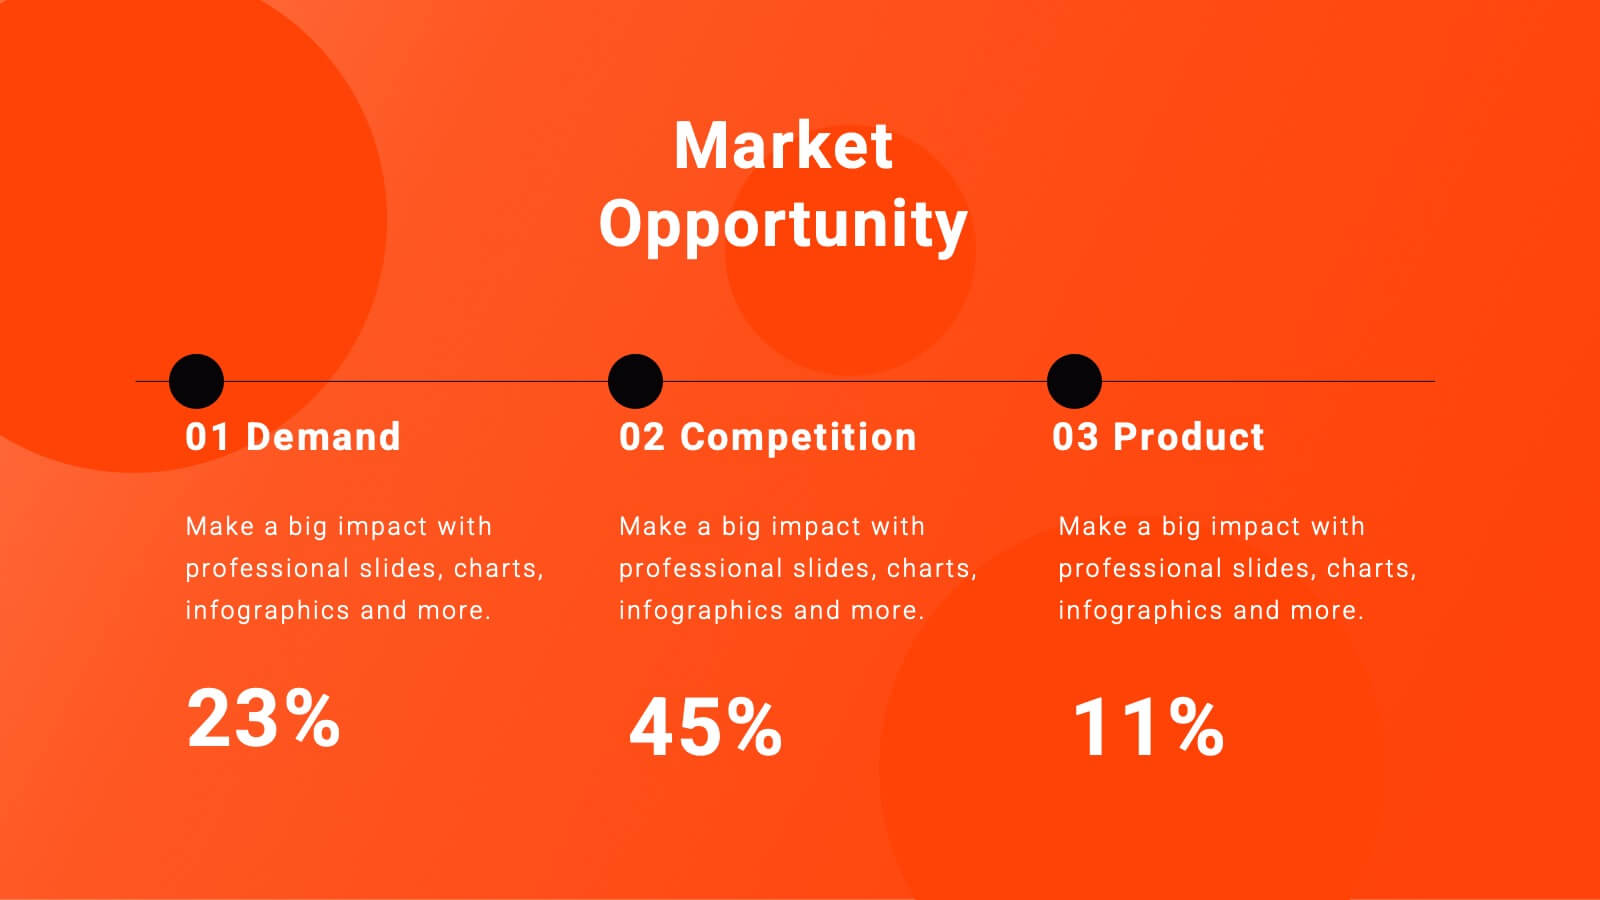
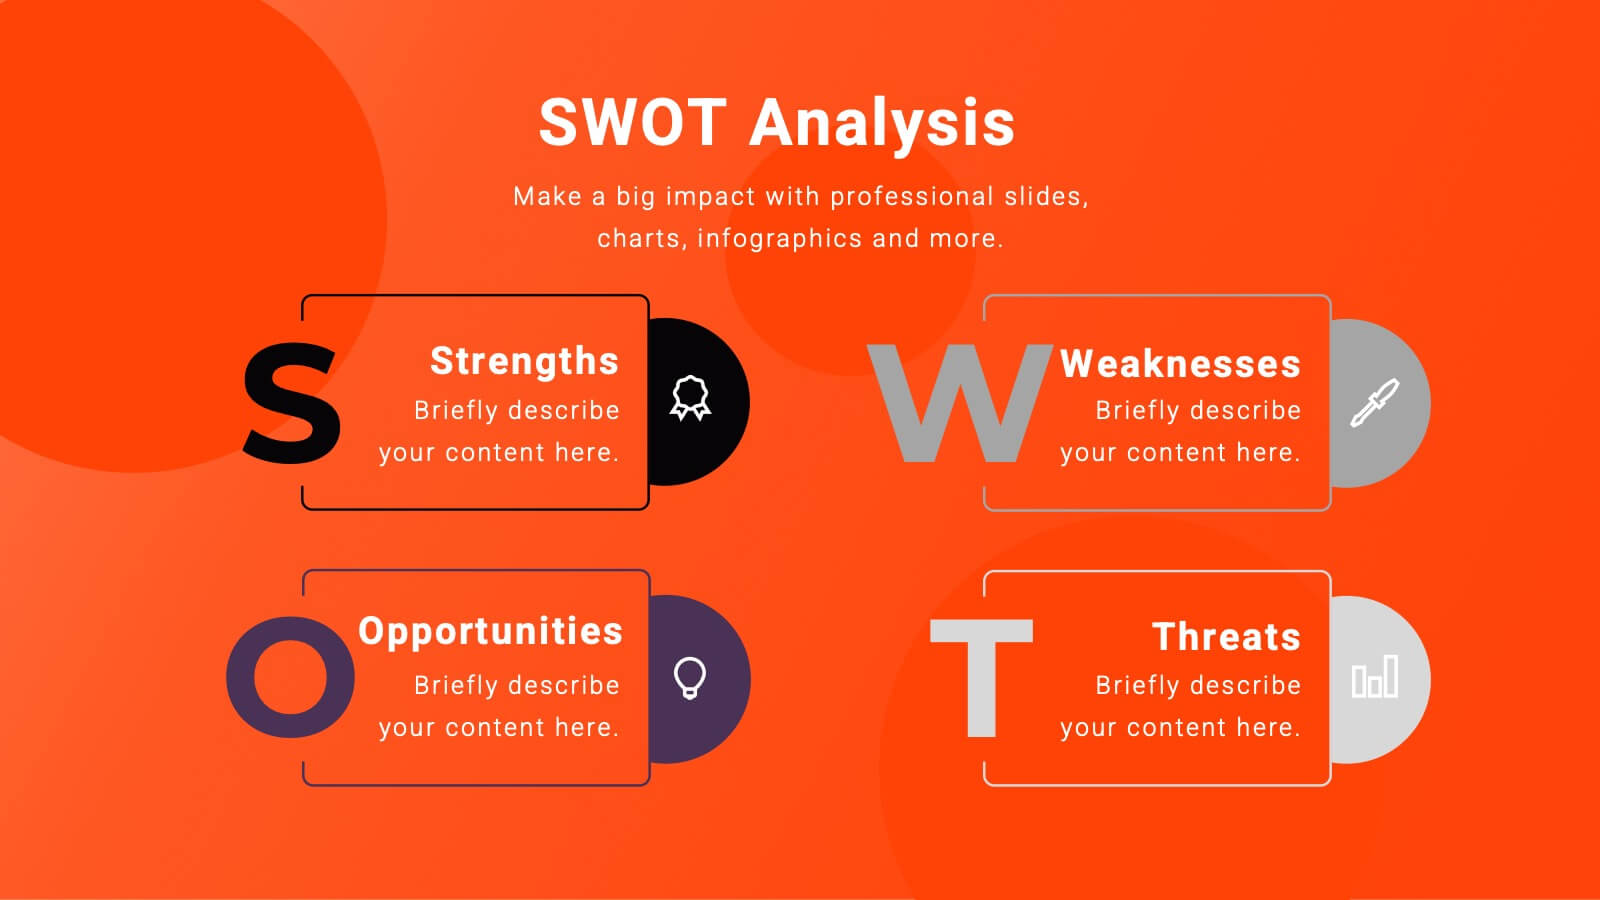
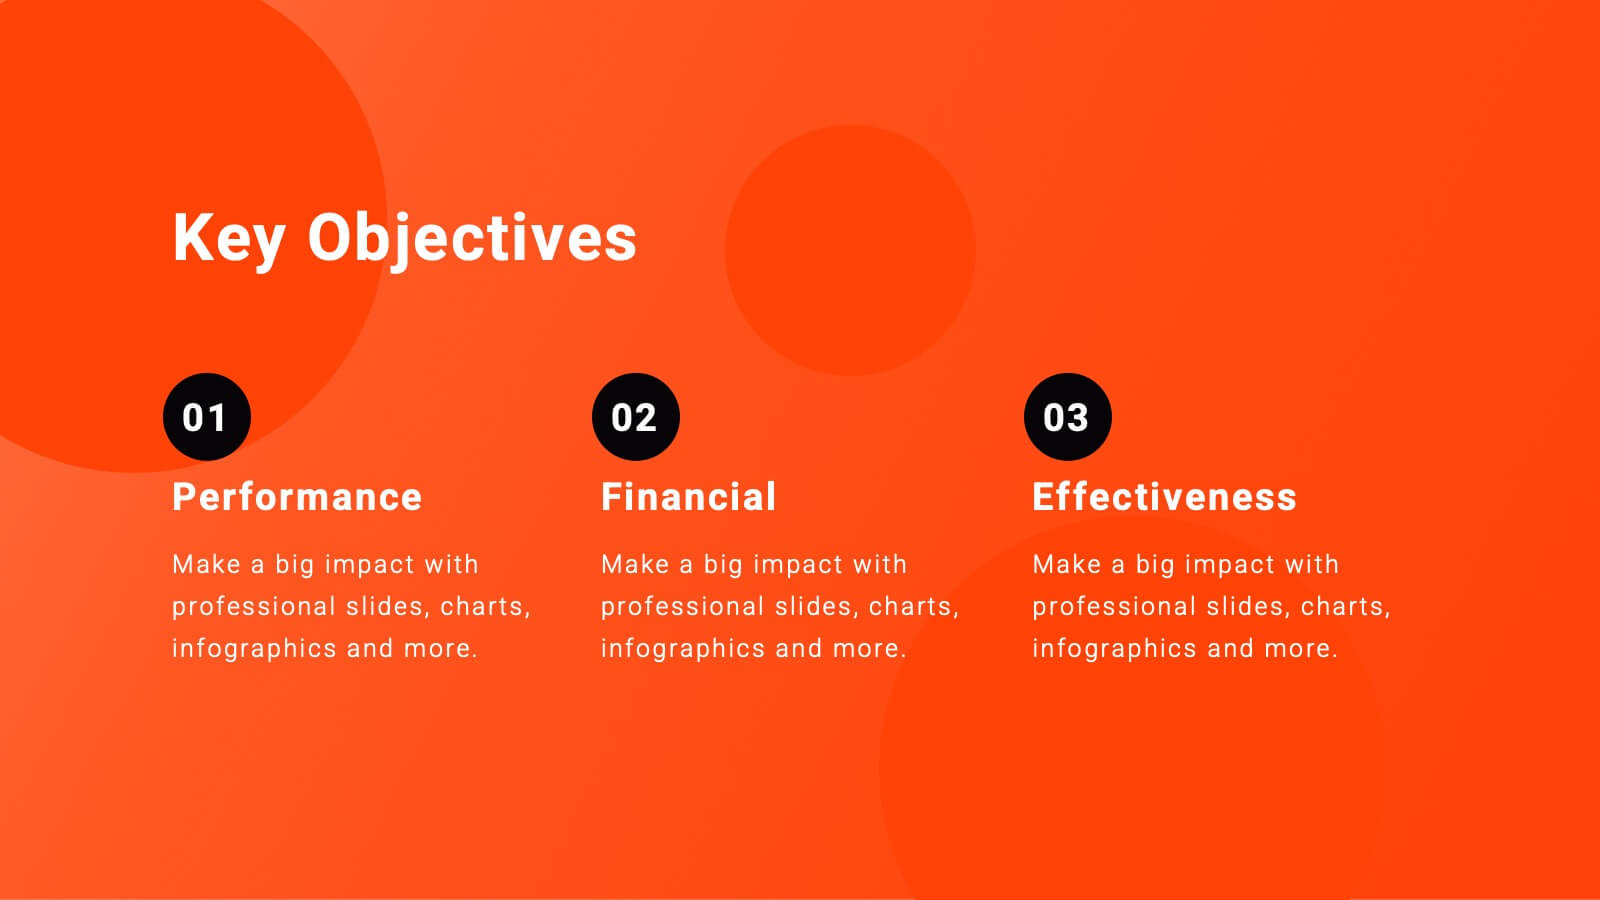
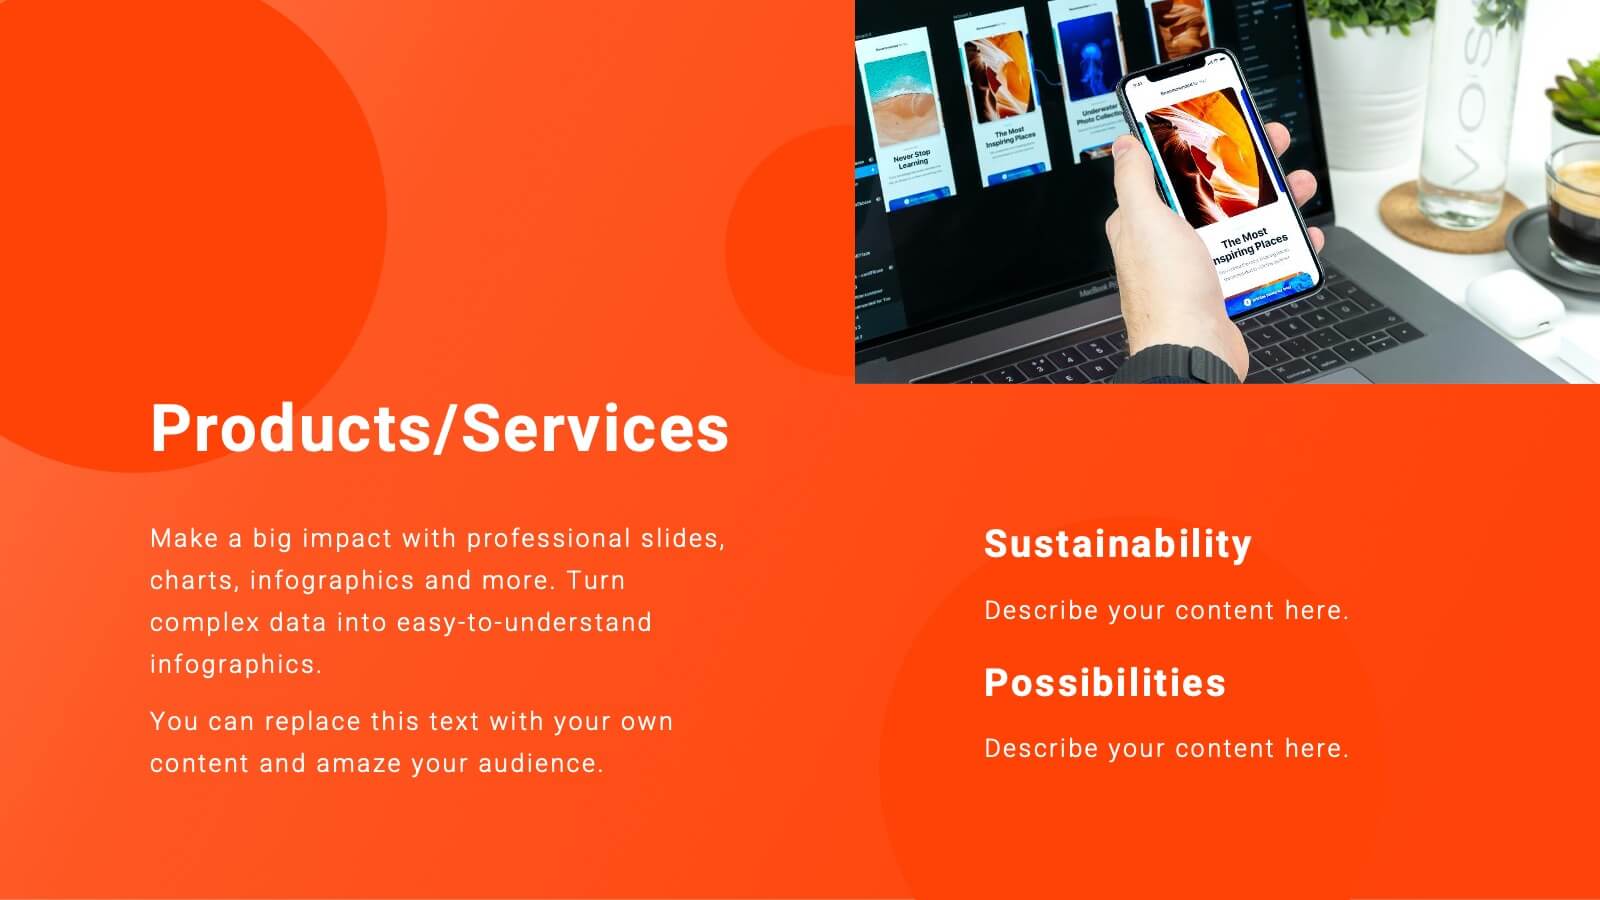
Equinox Business Operations Plan Presentation
Elevate your business operations with this dynamic plan template! Perfect for detailing company background, market opportunities, and strategic objectives. Ideal for business leaders and managers aiming to streamline operations and drive growth. Compatible with PowerPoint, Keynote, and Google Slides, this template ensures your business plan is clear, professional, and impactful. Drive success today!


26 diapositivas
Textures Company Profile Black Presentation
A company profile is a concise document that provides an overview of a business, its history, products or services, achievements, mission, vision, values, and other relevant information. This presentation template is designed for businesses to showcase their brand identity and services in an elegant and professional manner. With a dominant black color theme, this presentation exudes a sense of modernity and class, making it perfect for businesses in various industries. Introduce your company's history, mission, and values in a concise and compelling manner. Utilize the clean and clear typography to maintain a professional and sophisticated look.


4 diapositivas
Business Growth through AIDA Model Presentation
Visualize the buyer’s journey with this engaging AIDA model slide. Featuring rounded 3D-style shapes and clear progression from Attention to Action, this layout is ideal for marketing plans, customer engagement strategies, or sales funnels. Each stage is color-coded and icon-enhanced for clarity. Easily customizable in PowerPoint, Keynote, and Google Slides.


4 diapositivas
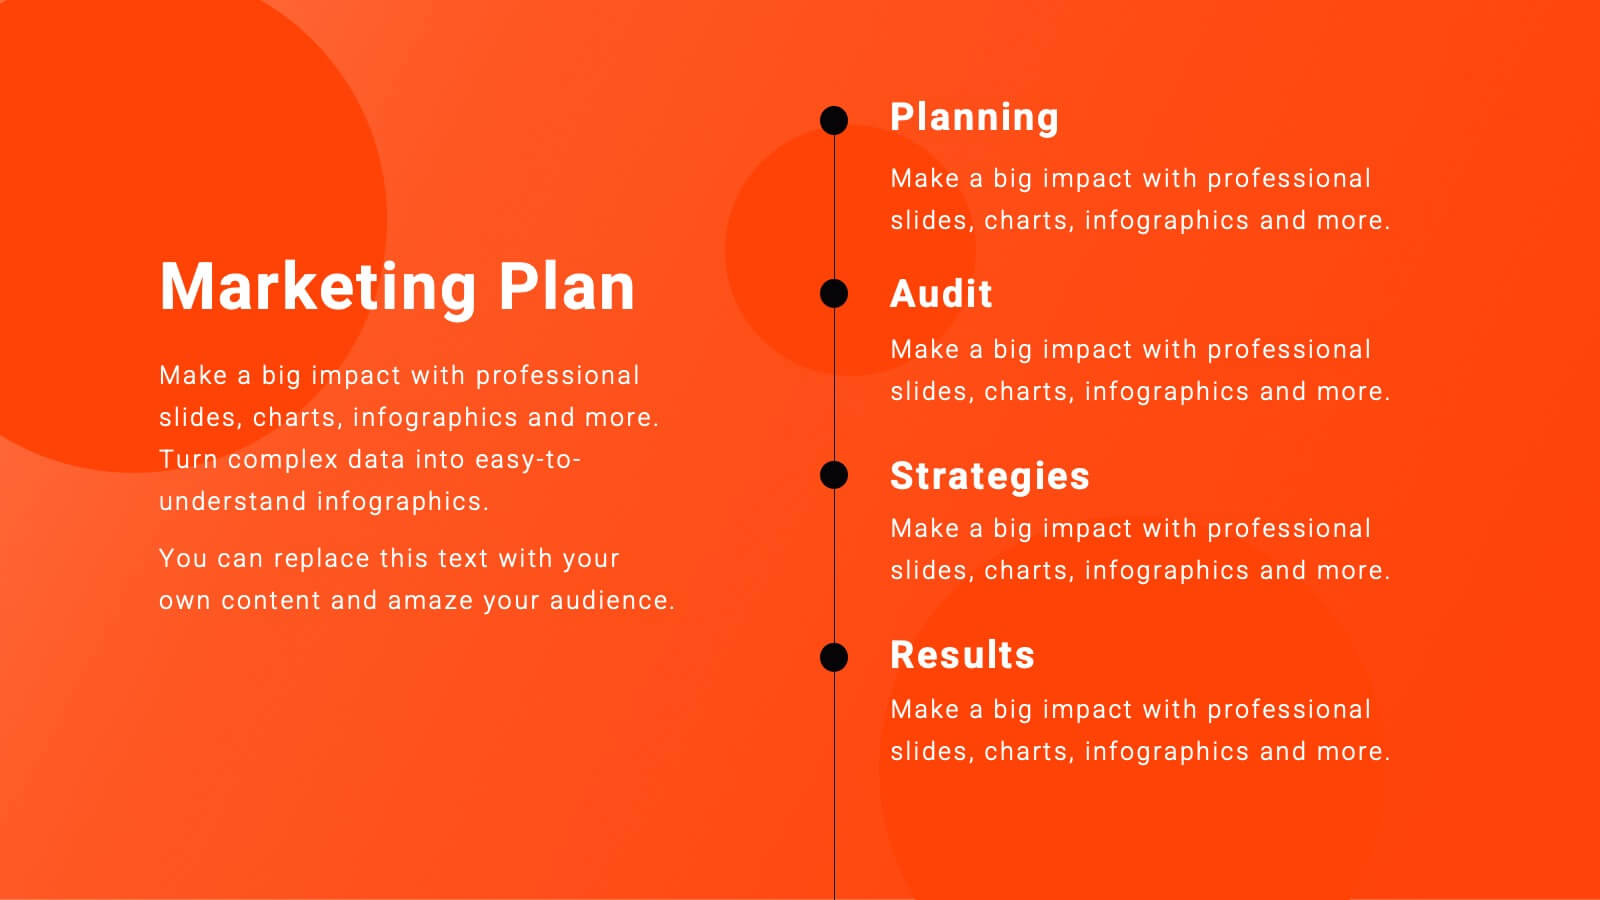
Business Planning Framework Presentation
Turn big ideas into actionable strategies with this modern and structured presentation layout. Perfect for mapping goals, aligning priorities, and showcasing step-by-step planning processes, it helps you communicate strategy with clarity and confidence. Fully editable and compatible with PowerPoint, Keynote, and Google Slides for easy customization and professional results.