


Características


¿Tienes alguna pregunta?
Recomendar


5 diapositivas
Organizational Decision Support System Presentation
Visually showcase team alignment and consensus using the Organizational Decision Support System slide. This layout features a row of team icons paired with "Yes"/"No" speech bubbles, making it perfect for illustrating decision outcomes, vote breakdowns, or approval processes. Easily editable in PowerPoint, Keynote, and Google Slides.


4 diapositivas
US Map with Data Points Presentation
Bring your data to life with a dynamic nationwide view that makes trends instantly clear. This presentation helps you showcase key metrics, highlight regional insights, and compare results across states using clean, modern data markers. It’s perfect for reports, strategy updates, and analytics. Fully compatible with PowerPoint, Keynote, and Google Slides.


8 diapositivas
Business Purpose and Mission Alignment Presentation
Clarify your organization’s direction with this step-by-step alignment slide. Featuring four sequential stages, each with icons, numbers, and customizable text boxes, this layout helps visually communicate how your business goals align with your mission. Perfect for strategic planning, team alignment workshops, and leadership presentations. Fully editable and compatible with PowerPoint, Keynote, and Google Slides.


21 diapositivas
Cascade Marketing Proposal Template Presentation
Ignite your creativity with our dazzling Cascade Marketing Proposal Template Presentation! This captivating design brings your ideas to life, ensuring your presentation stands out. The sleek, dark theme is punctuated by electric blue accents, adding a modern, professional touch. Each slide is meticulously crafted, offering a perfect blend of visuals and content that keeps your audience engaged from start to finish. From the Company Overview to Growth Projections, every aspect of your pitch is highlighted with style and clarity. The template is fully customizable, allowing you to tailor it to your brand's identity effortlessly. Whether you're pitching to investors or presenting internally, this template has everything you need to make a lasting impression. Compatible with PowerPoint, Keynote, and Google Slides, it’s versatile and easy to use. Get ready to electrify your next presentation and leave your audience in awe!


19 diapositivas
Sales Proposal Presentation
Secure your next big deal with our Sales Proposal presentation template, tailored to make your pitch unforgettable. It's a comprehensive toolkit for sales professionals designed to address every aspect of your offering. The slides smoothly guide your audience through your company overview, mission, product or service features, and the solutions you provide to the client's problems. They are meticulously structured to help you outline your value proposition, address customer pain points, and present a convincing case with customer testimonials. The design is not just visually appealing but also conducive to narrative flow, presenting cost and pricing details with clarity, and allowing room for engaging Q&A sessions. This template is ideal for sales pitches, adaptable across PowerPoint, Keynote, and Google Slides. It helps you build a persuasive argument for why your solution is the best fit for the client, providing a professional edge in a competitive marketplace.


20 diapositivas
Moonfern Product Launch Presentation
Introduce your product to the market with confidence using this expertly designed presentation template. Featuring a sleek and modern layout, it covers essential sections such as product overview, target market, and unique selling proposition. Dive into product features, pricing strategy, and competitive analysis to effectively communicate value and strategy. The template also includes slides for marketing plans, distribution channels, and use cases, ensuring a comprehensive approach to your launch. Perfect for PowerPoint, Google Slides, and Keynote, it allows for easy customization, ensuring your presentation aligns seamlessly with your branding and goals.


5 diapositivas
Live Sports Infographics
Immerse in the dynamic realm of athletics with our live sports infographics. Crafted in a medley of energetic blue, spirited yellow, and various vivid hues, this template radiates the inherent in the world of sports. Its creative and vertical layout, optimized for impact, is perfect for sports journalists. Compatible with Powerpoint, Keynote, and Google Slides. The compelling graphics, icons, and dedicated image placeholders are specifically tailored to encapsulate the pulse-pounding moments and diverse statistics of live sports events. This visually striking, data-centric tool is indispensable for those seeking to convey complex sports information.


6 diapositivas
Investment Property Infographics
Step into the world of real estate with enthusiasm! This infographic opens doors to a wealth of opportunities. From the allure of rental income to the tax advantages that can boost your financial gains, we unveil the secrets that make investment properties a wise choice. Becoming a successful investor requires knowing the terrain. Dive into the nuances of property location, type, and market conditions. Gain insights into financing options, from traditional mortgages to innovative strategies. Uncover the art of property valuation, where location, condition, and appreciation potential hold the keys to your success. With this engaging infographic compatible with PowerPoint, Keynote, and Google Slides, sharing your real estate wisdom has never been easier. Empower yourself with the knowledge to unlock the potential of investment properties and set sail on a journey towards financial freedom.


4 diapositivas
Content Calendar and Engagement Plan Presentation
Plan and track content effectively with this calendar-style engagement layout. Visualize posting frequency, engagement goals, and campaign performance in a single view. Ideal for content strategists and marketers managing social or editorial schedules. Fully editable in PowerPoint, Keynote, or Google Slides to suit your unique workflow and branding needs.


6 diapositivas
International Business Strategy World Map Presentation
Showcase your company’s global presence and strategic insights with this dynamic International Business Strategy World Map slide. Each marker corresponds to key business regions, linked to five customizable titles for region-specific data, objectives, or metrics. Clean design with a vertical legend layout keeps the focus on your insights. Fully editable and compatible with PowerPoint, Keynote, and Google Slides.


26 diapositivas
Startup Presentation
Elevate your startup's story with this Startup Presentation template. It features slides for your mission, innovation highlights, market analysis, and growth strategy. Perfect for engaging potential investors and partners. This versatile template is compatible with PowerPoint, Keynote, and Google Slides, making it easily accessible for all your presentation needs.


24 diapositivas
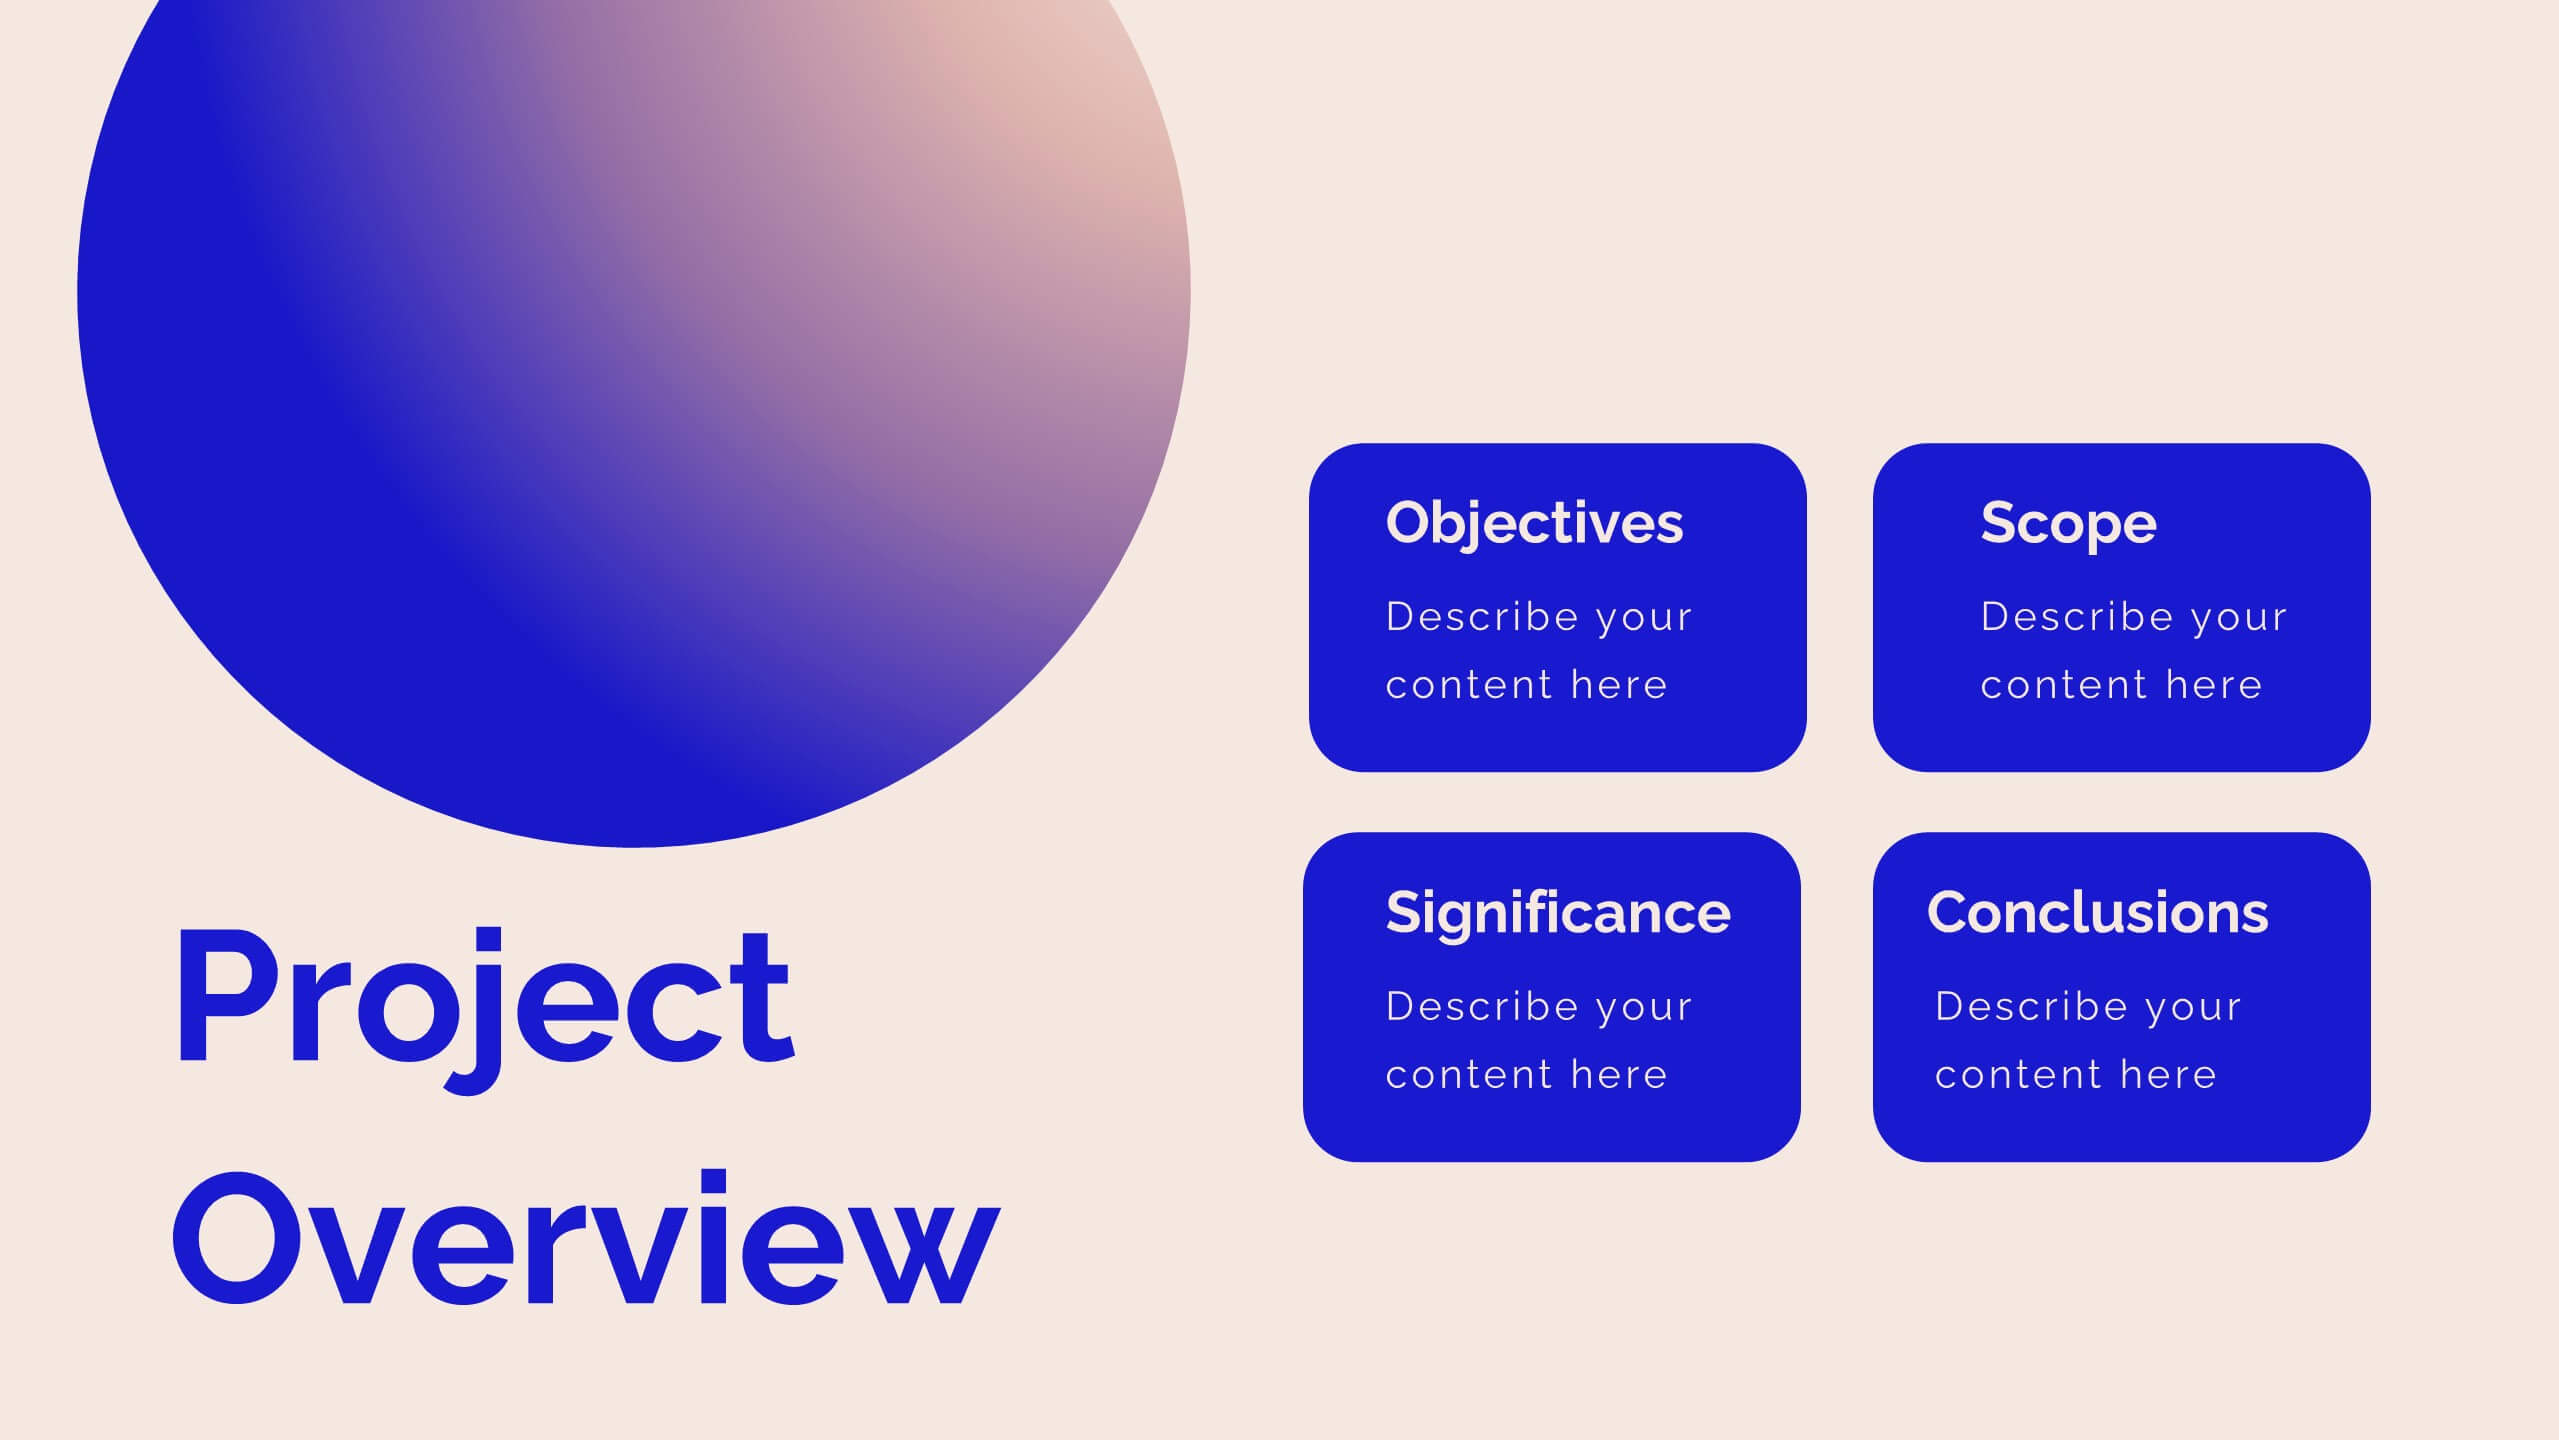
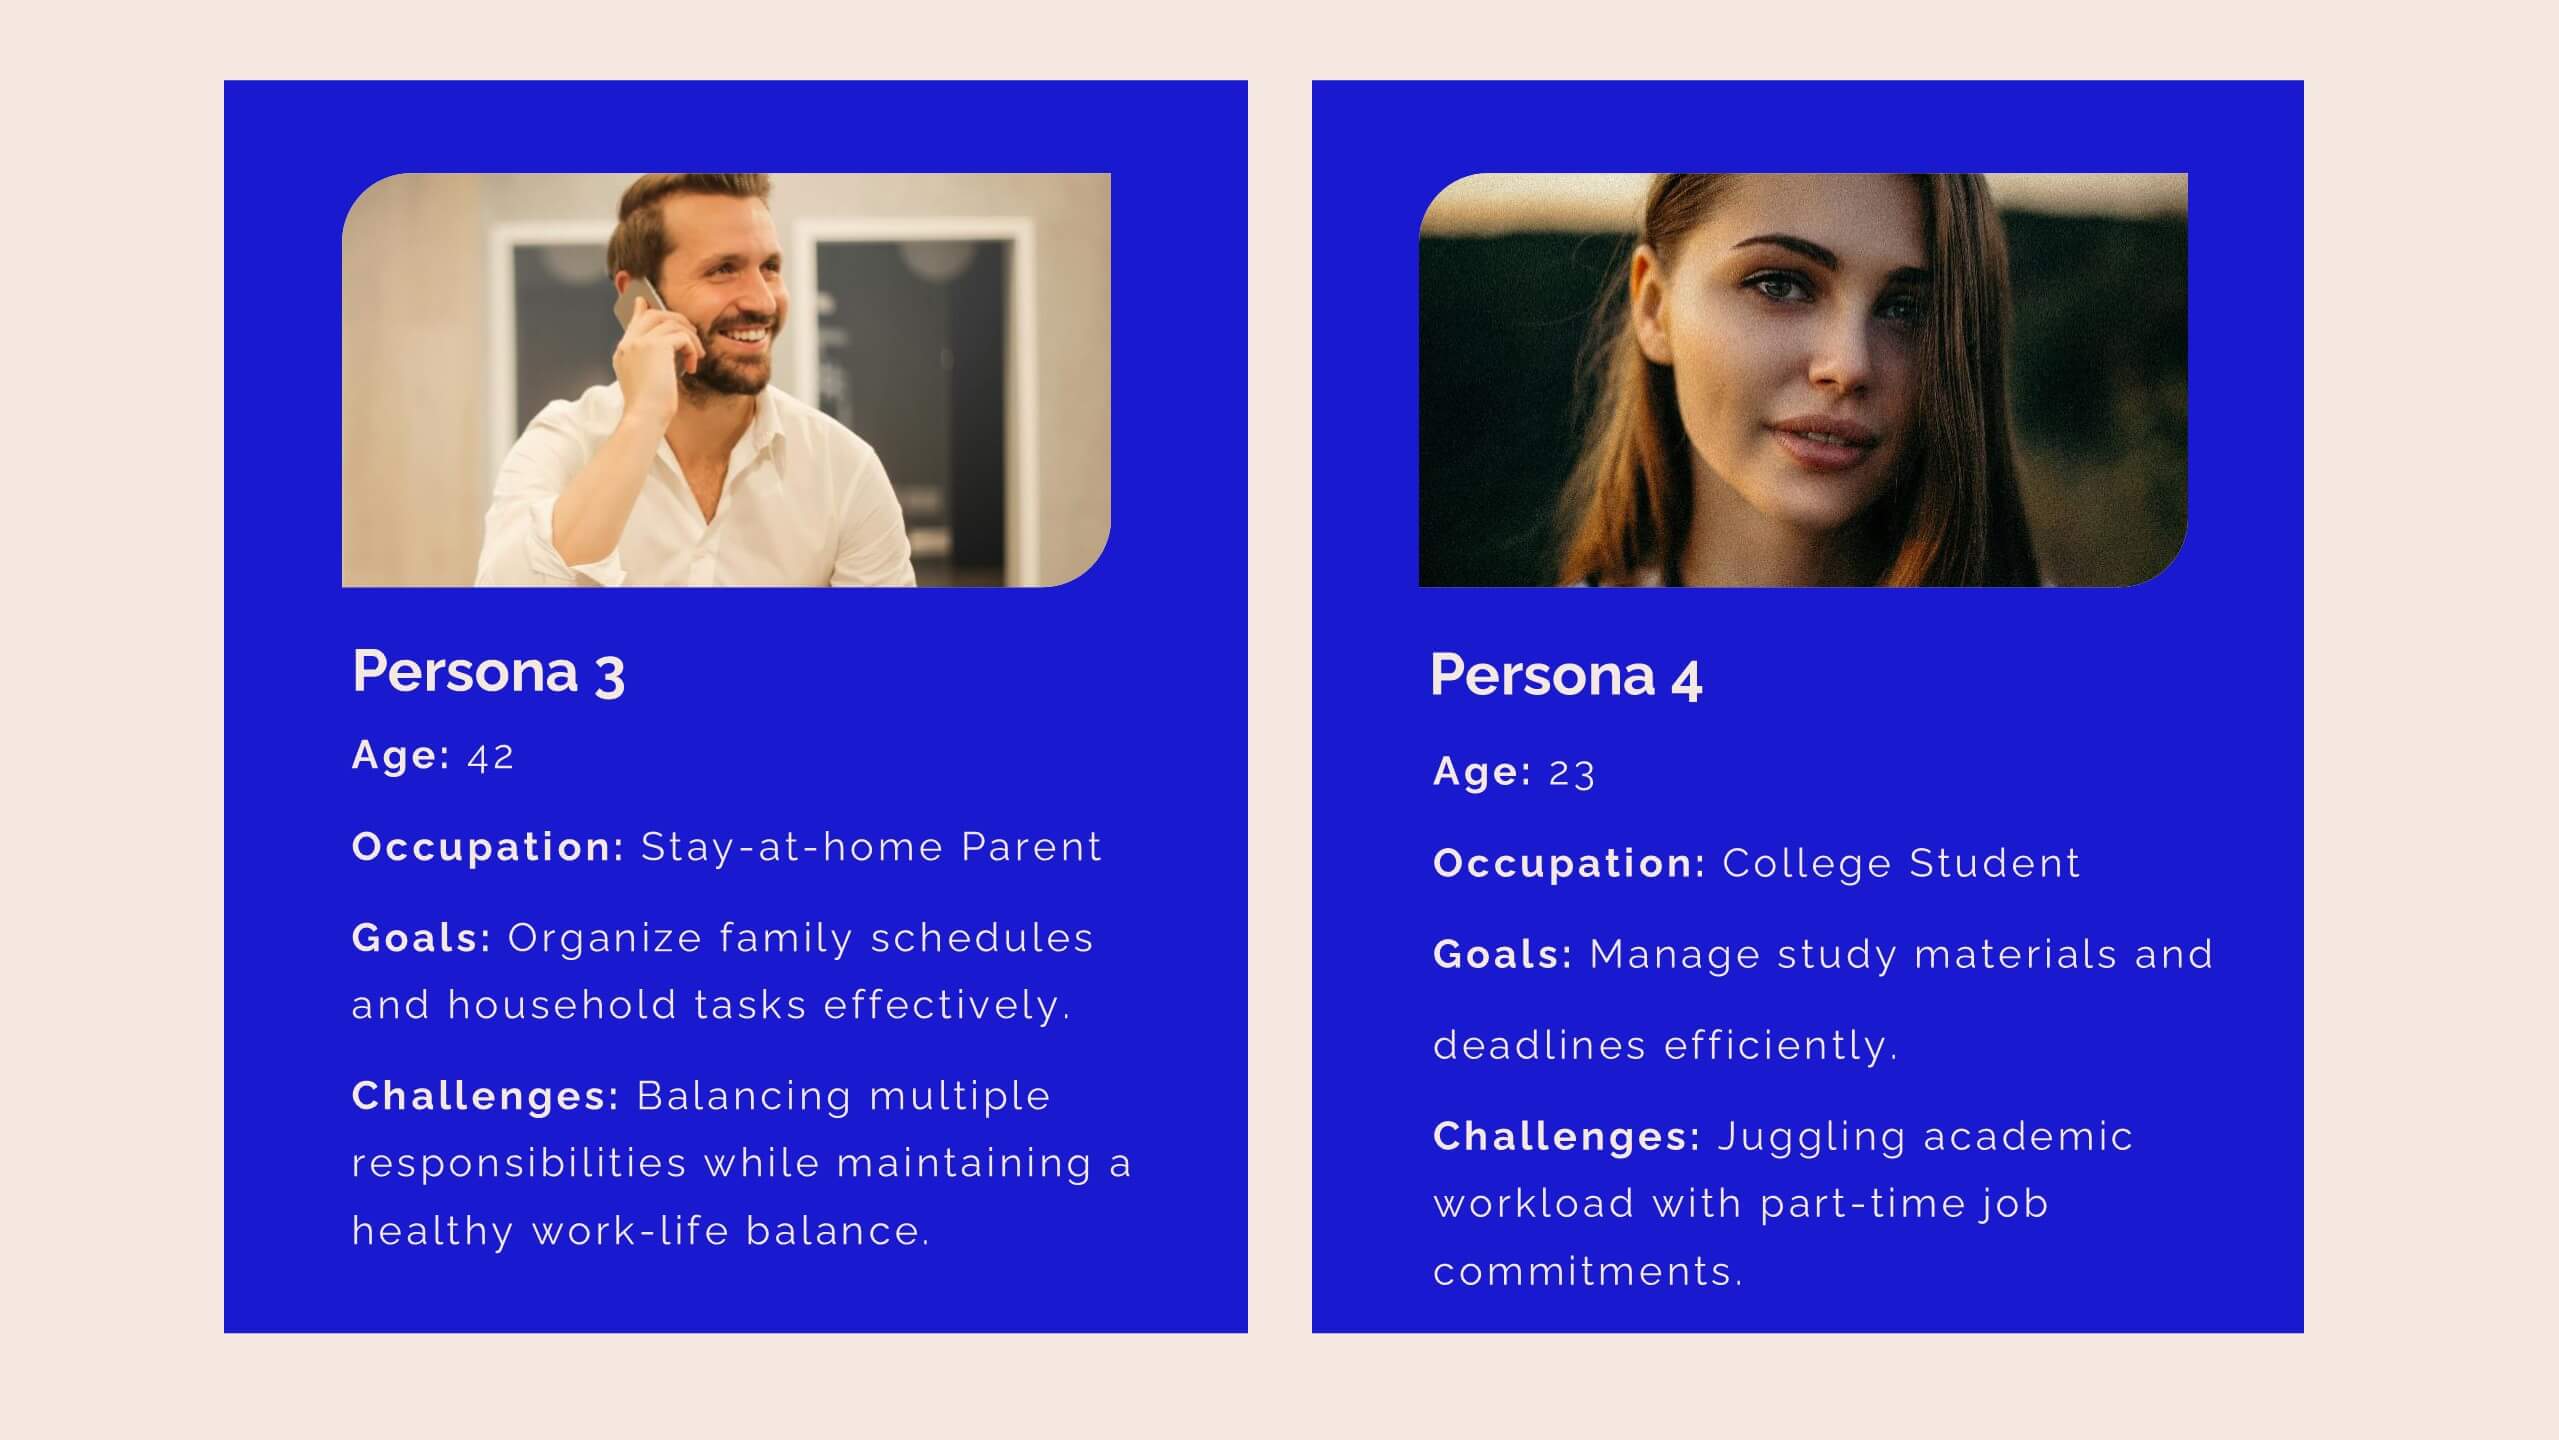
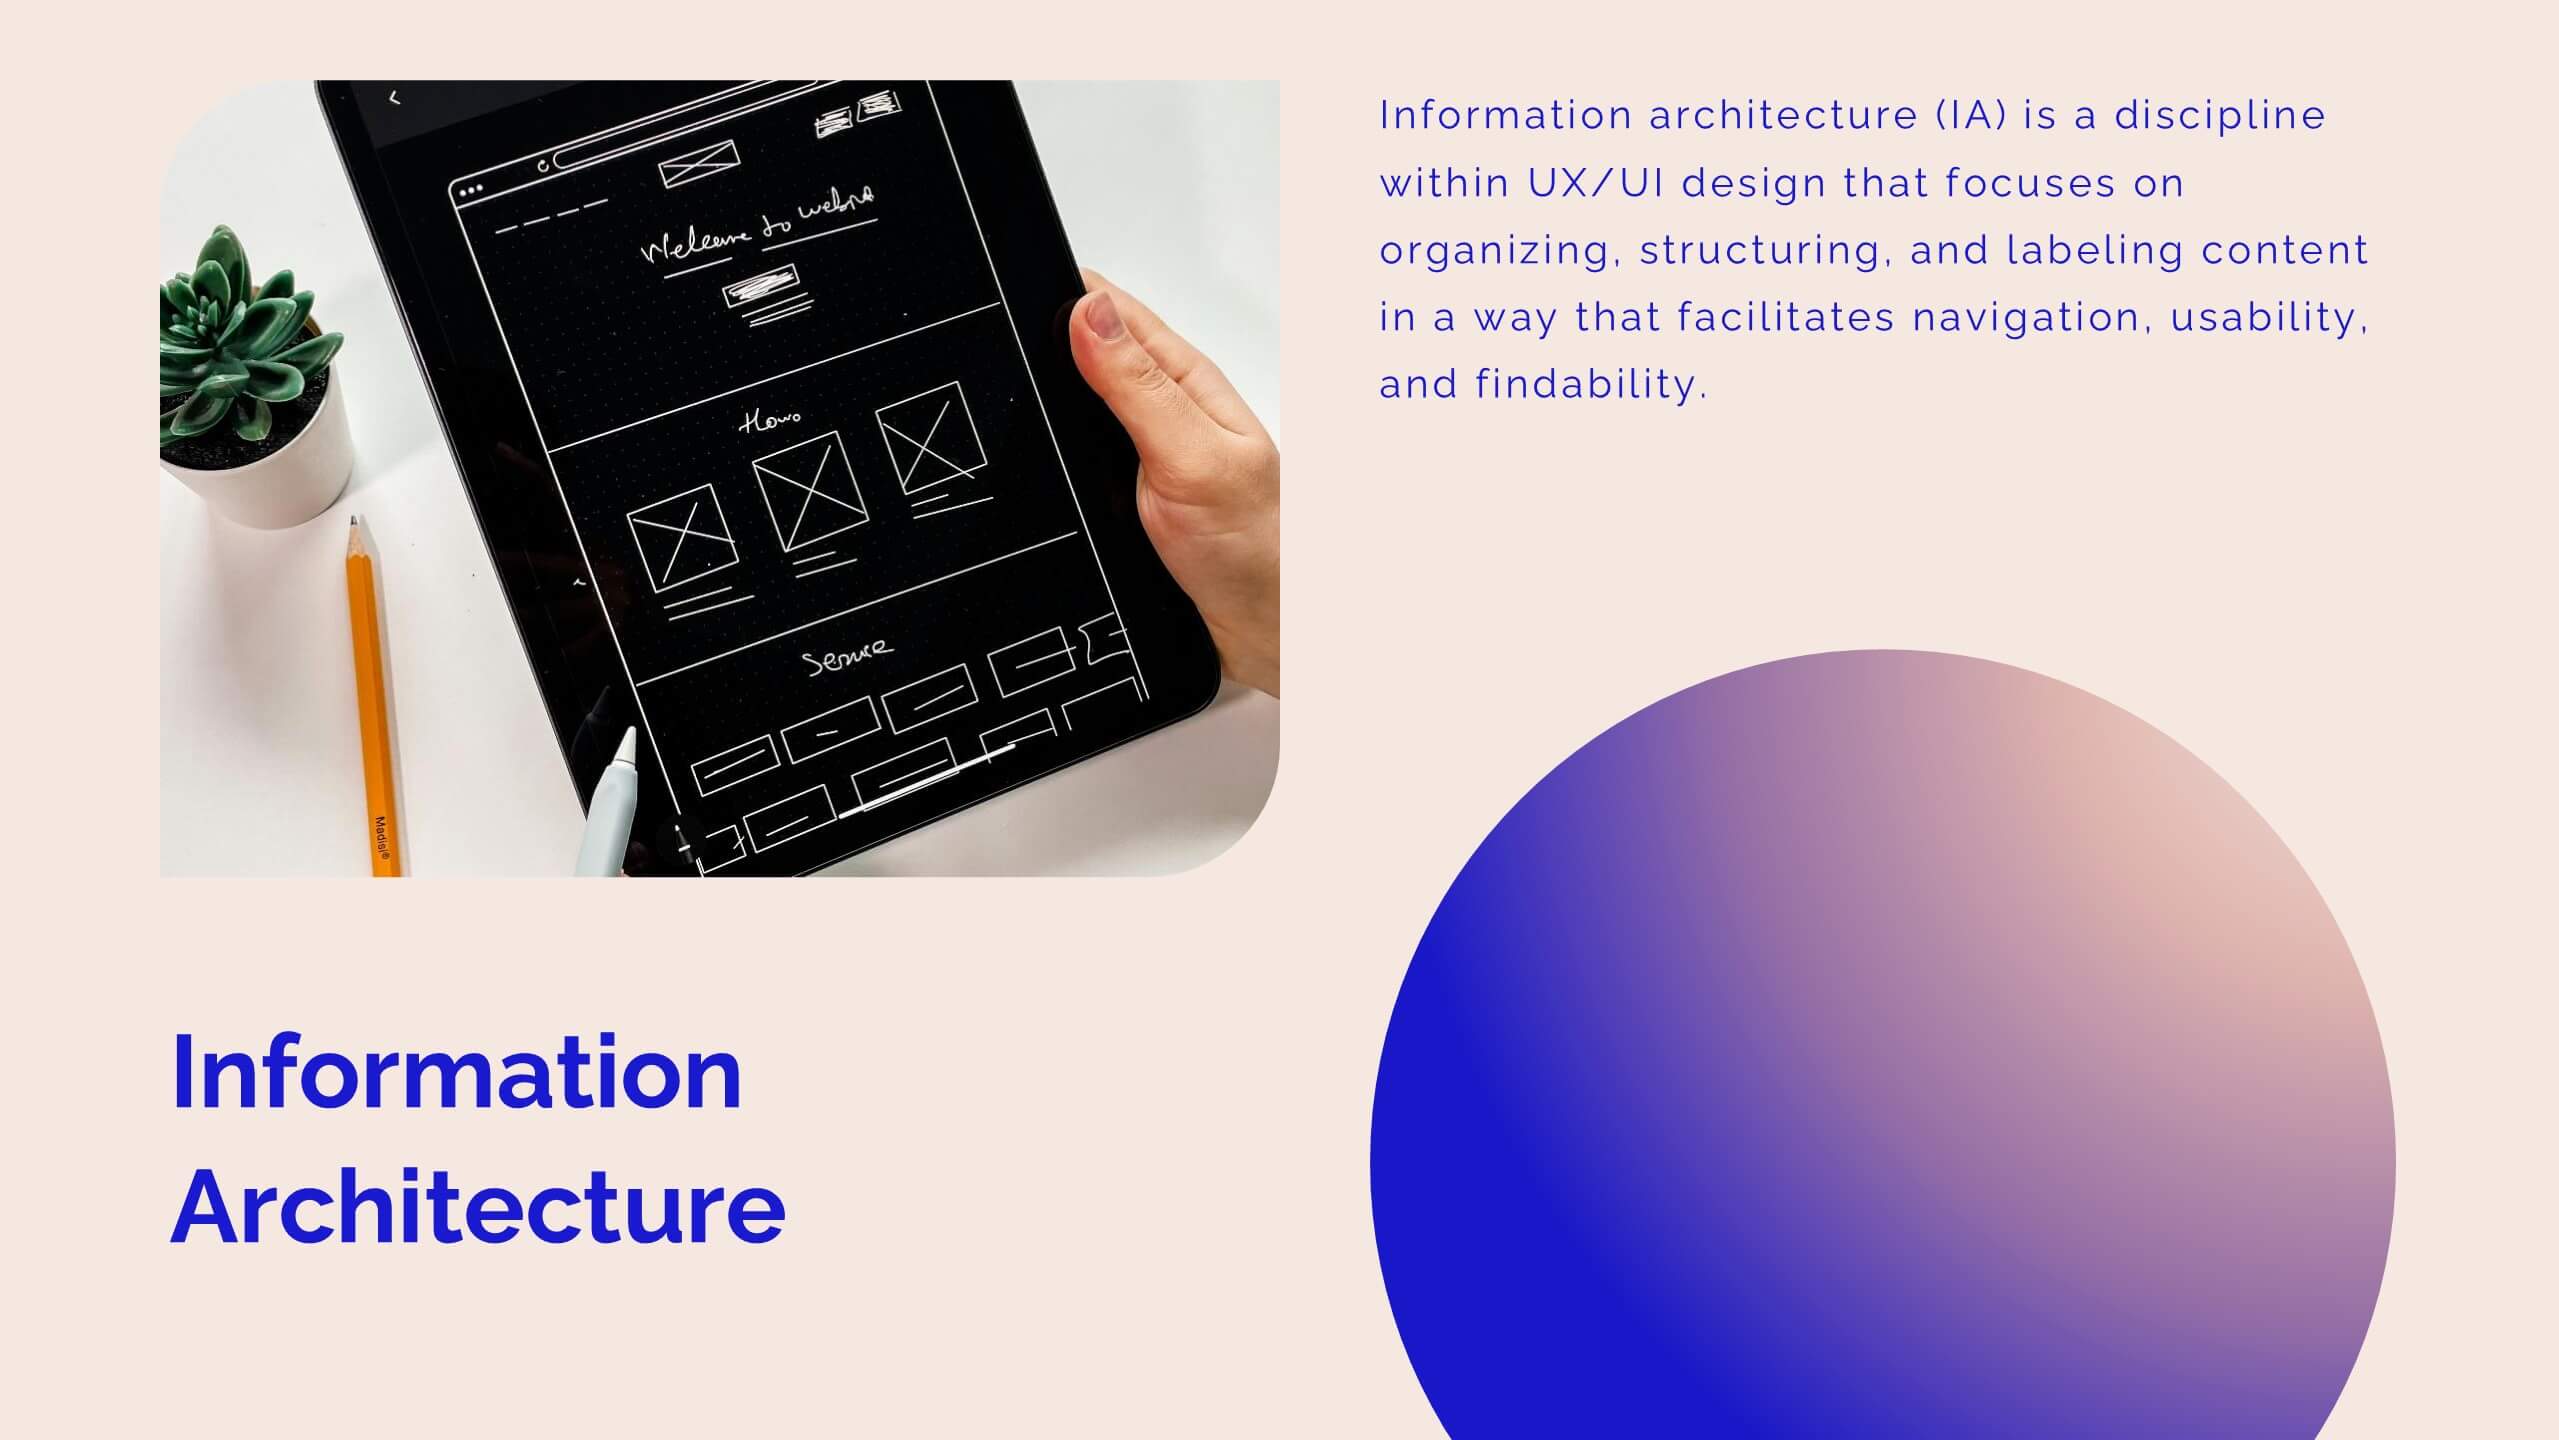
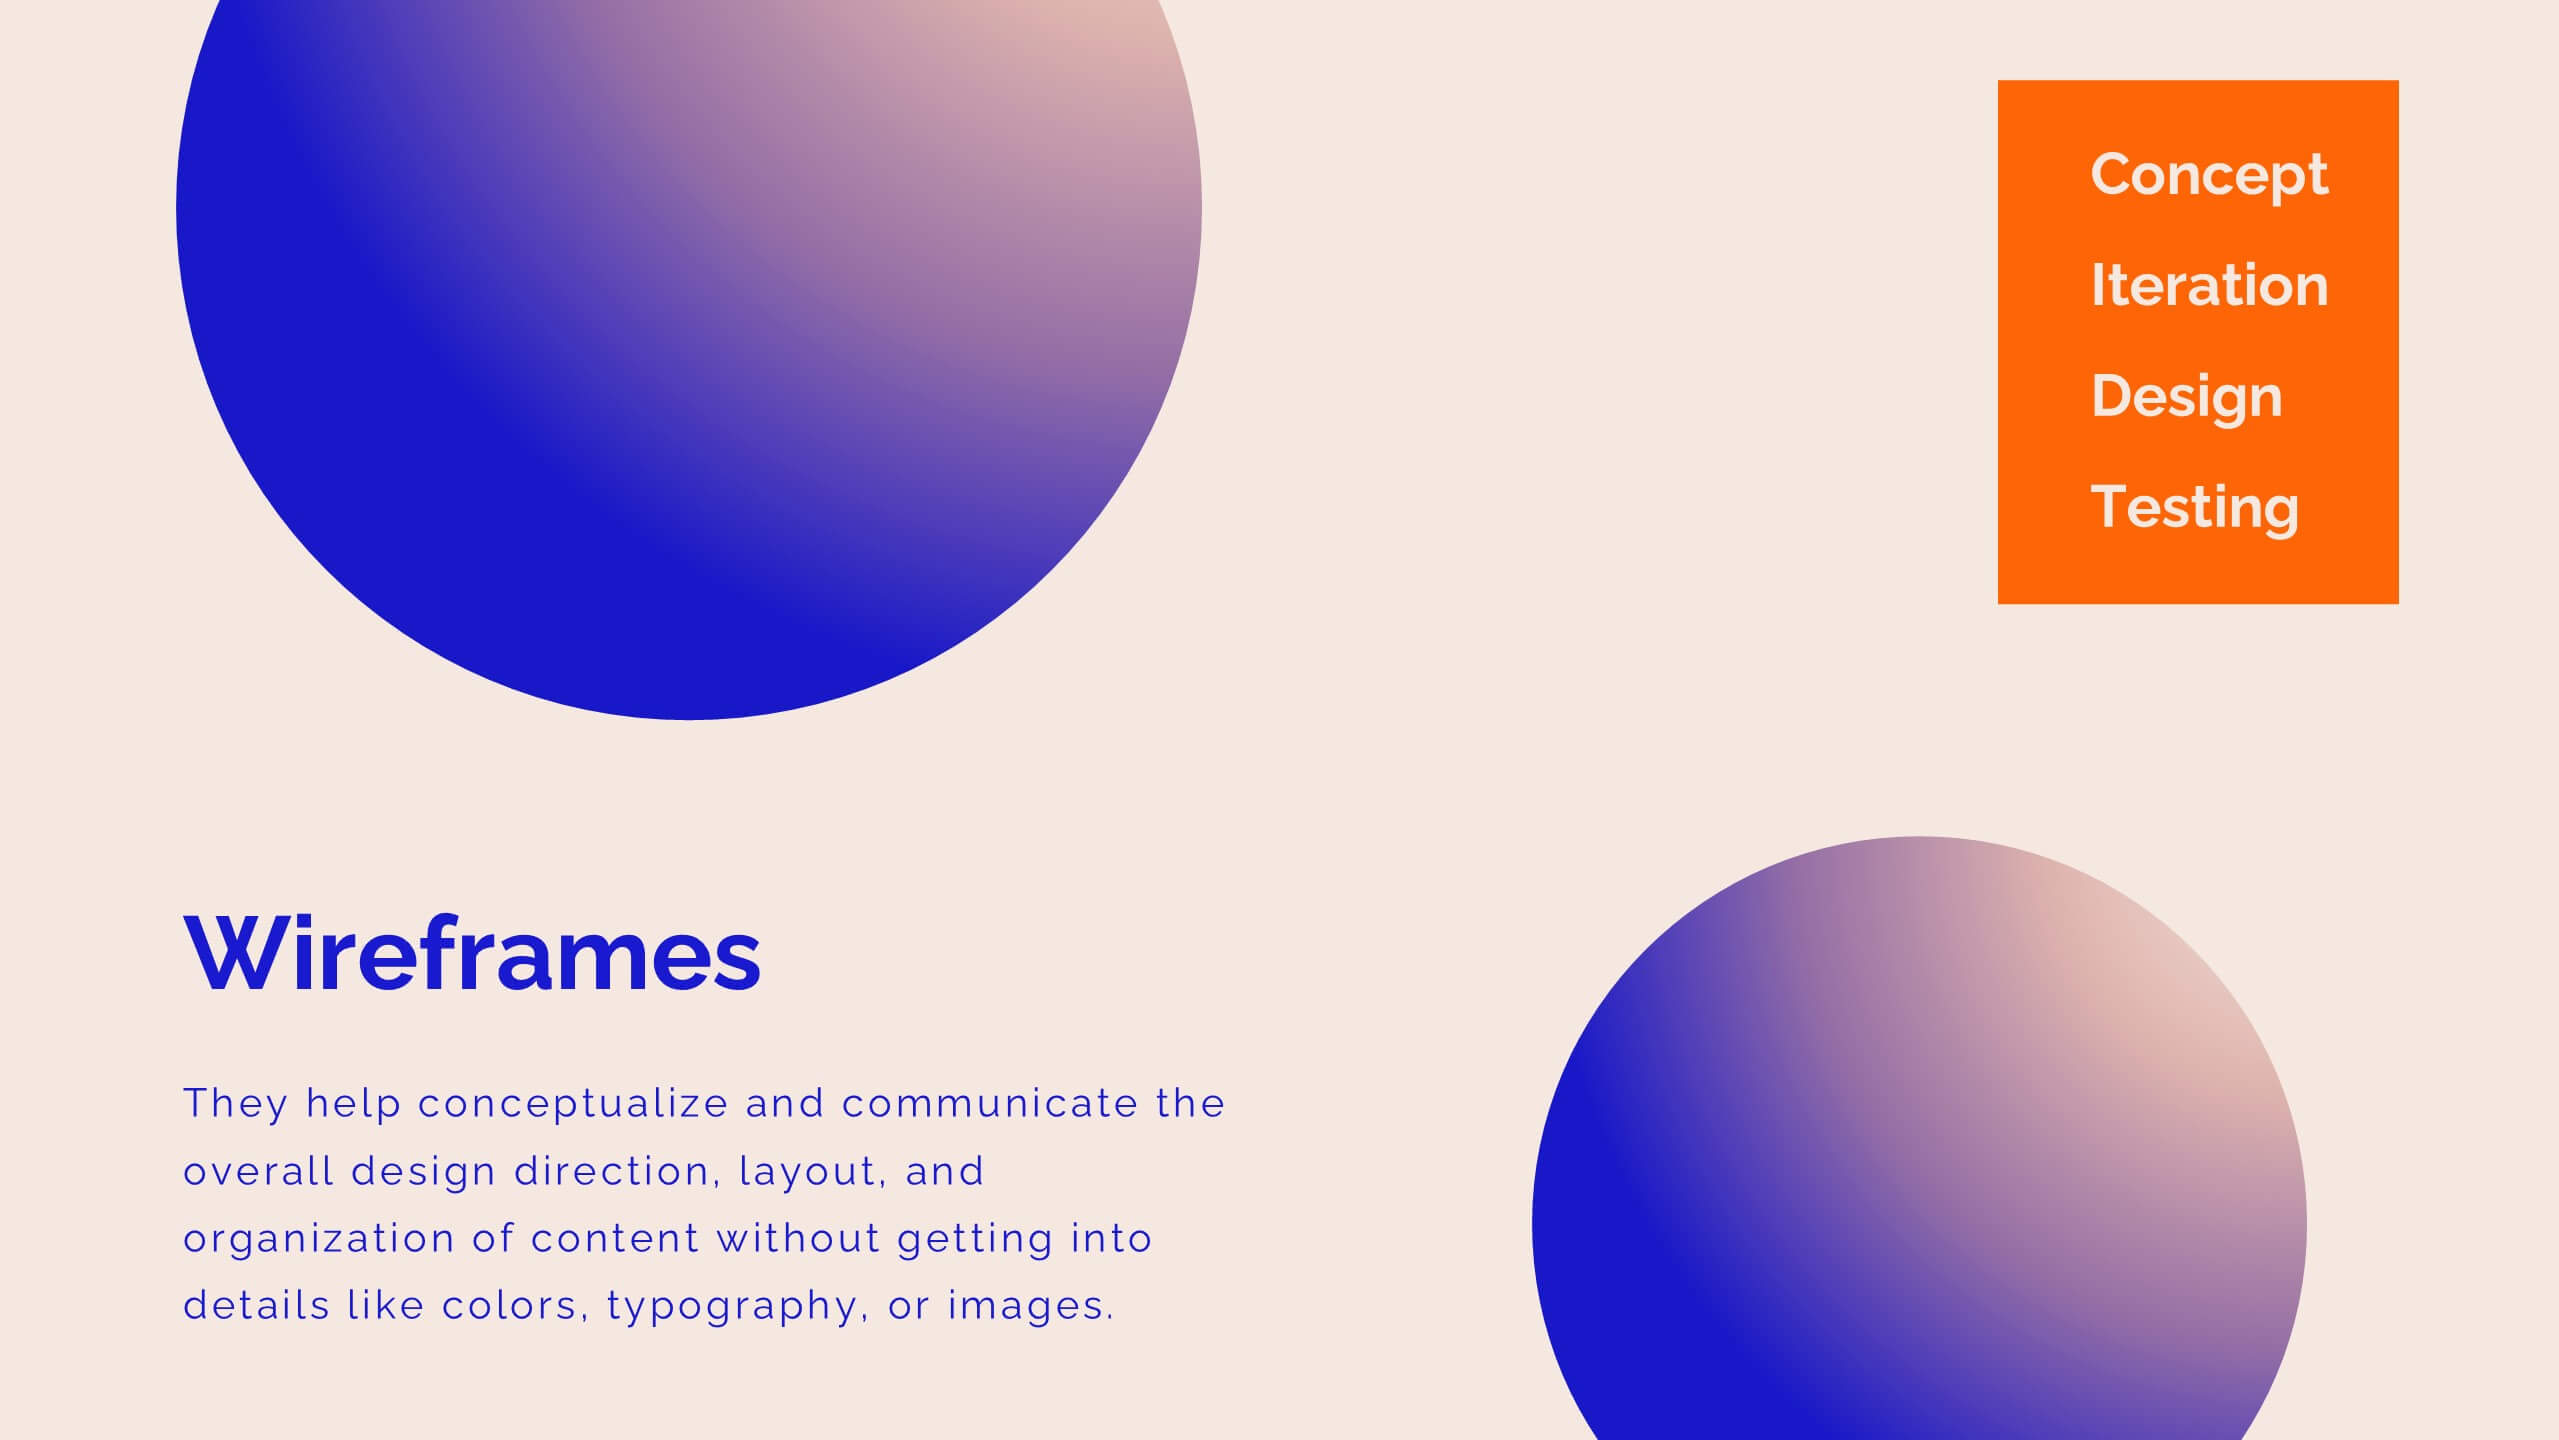
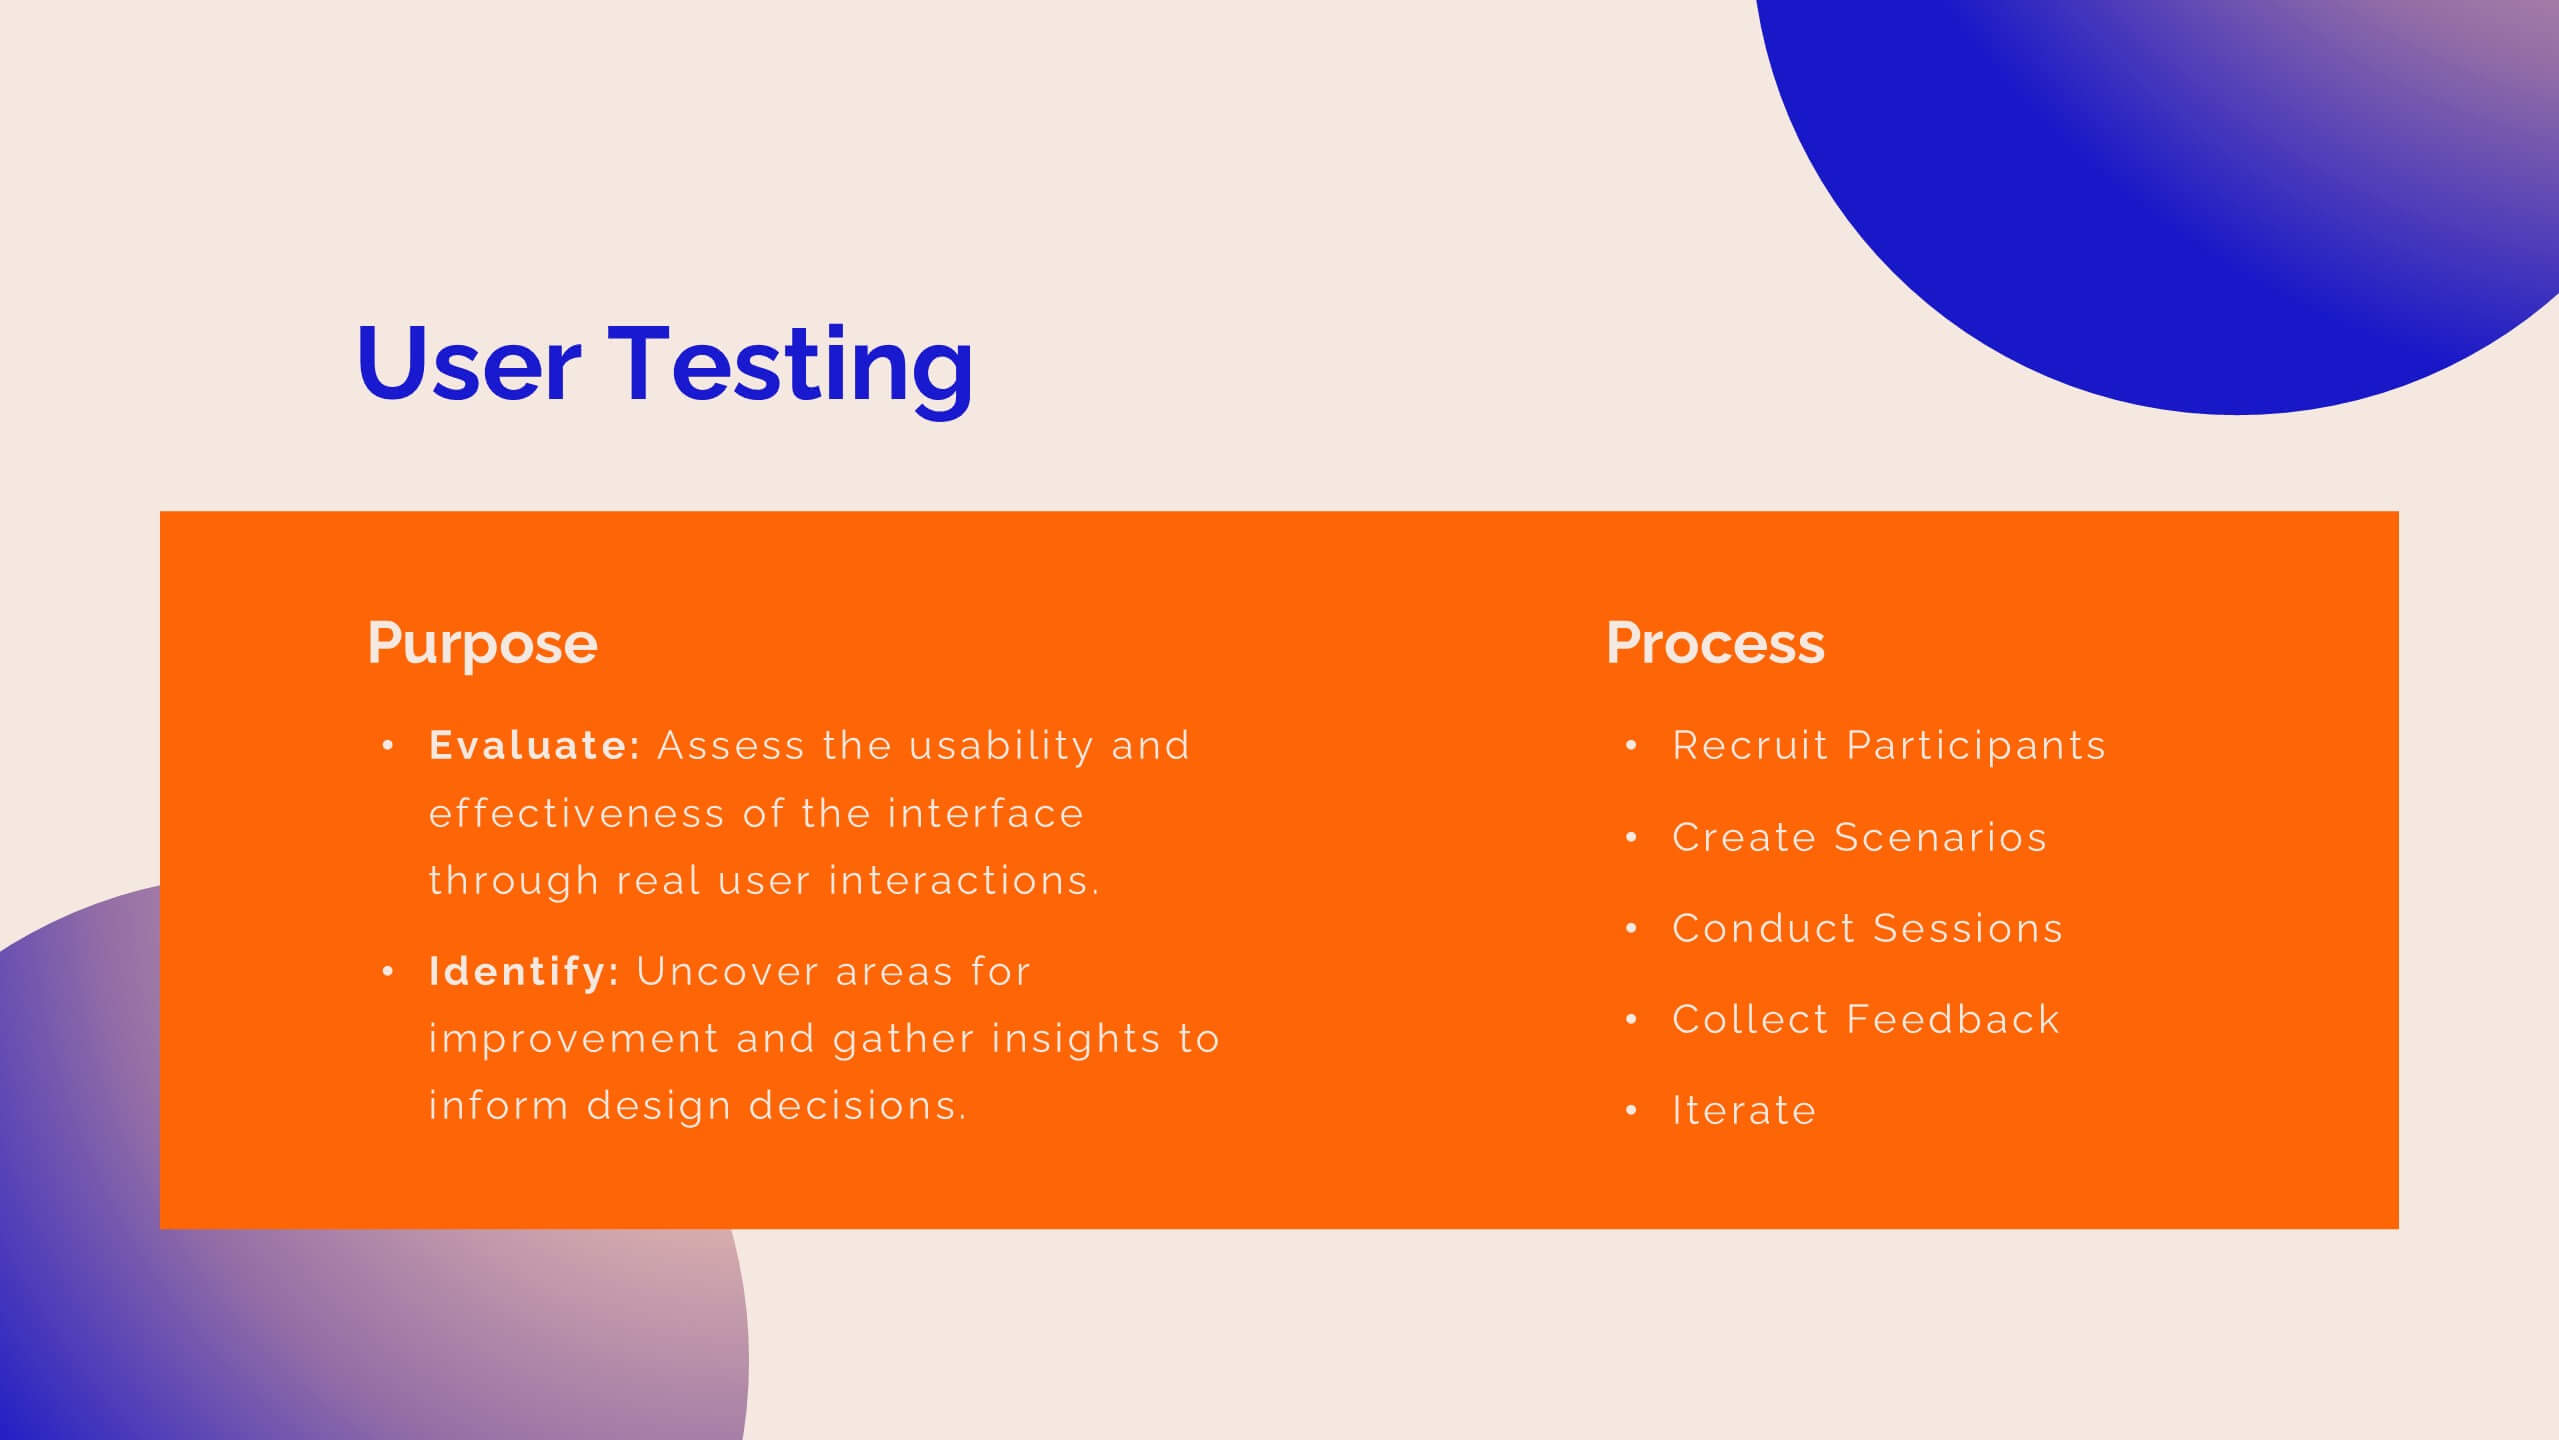
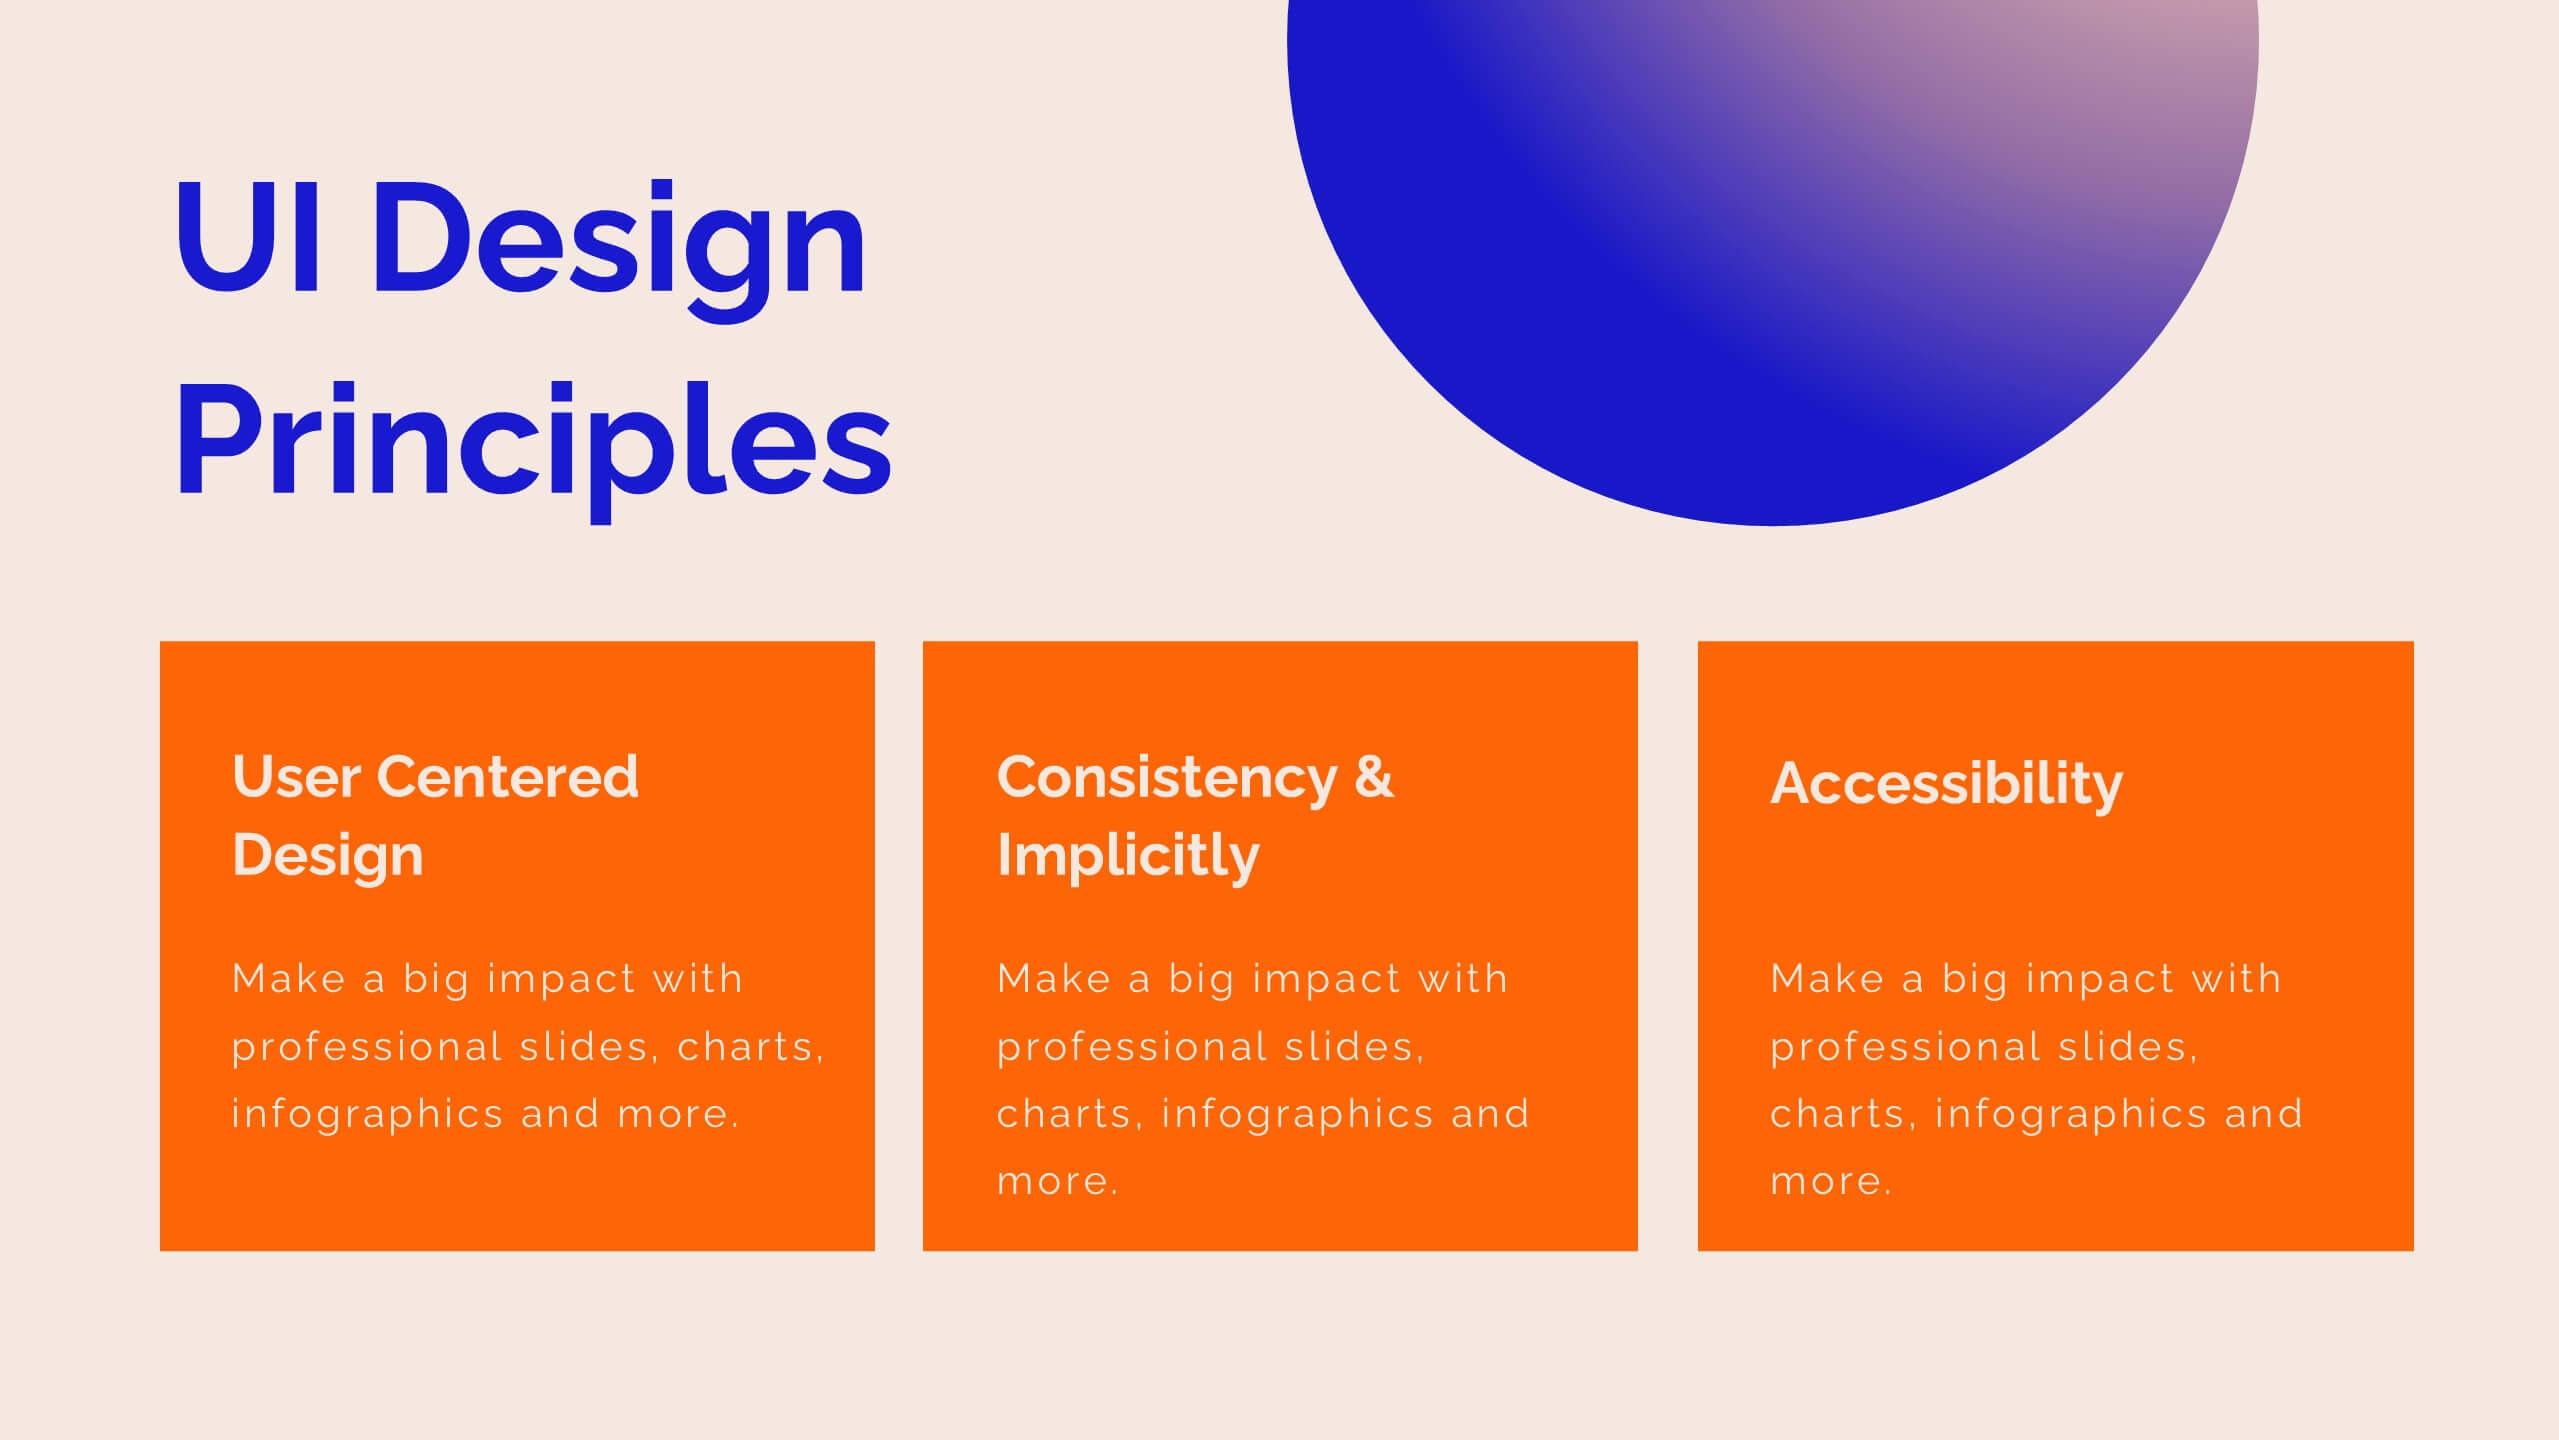
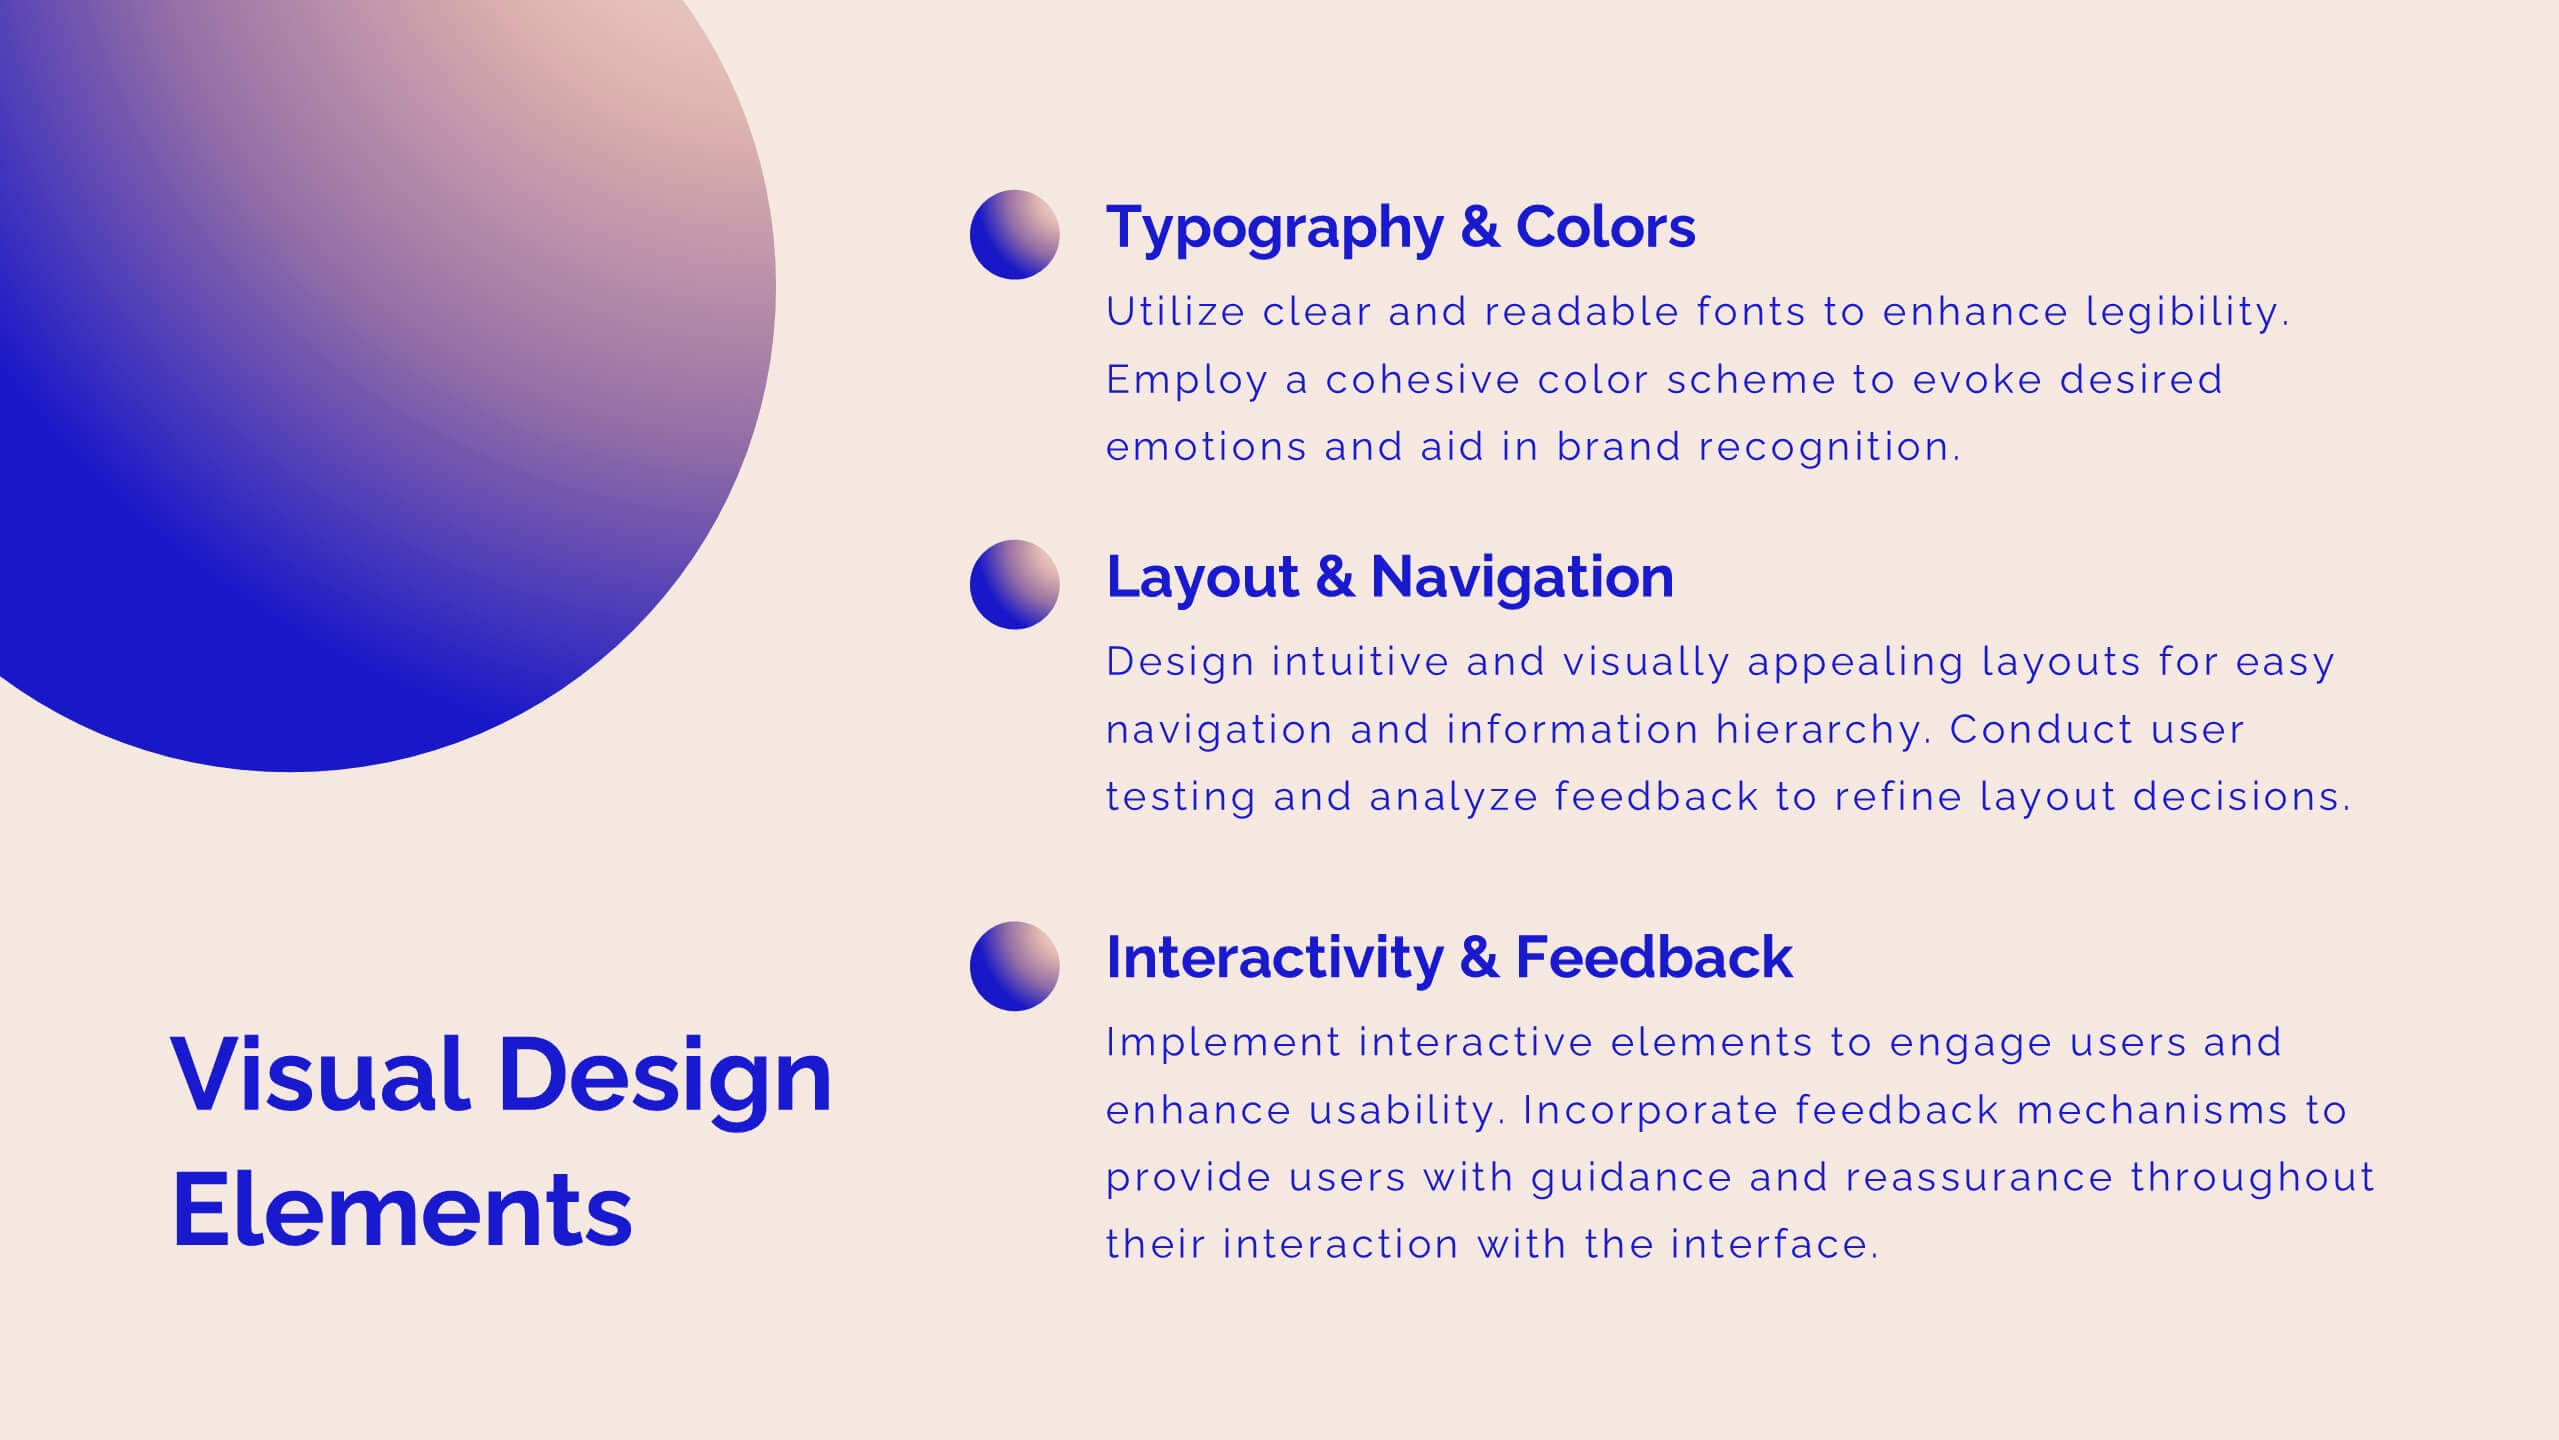
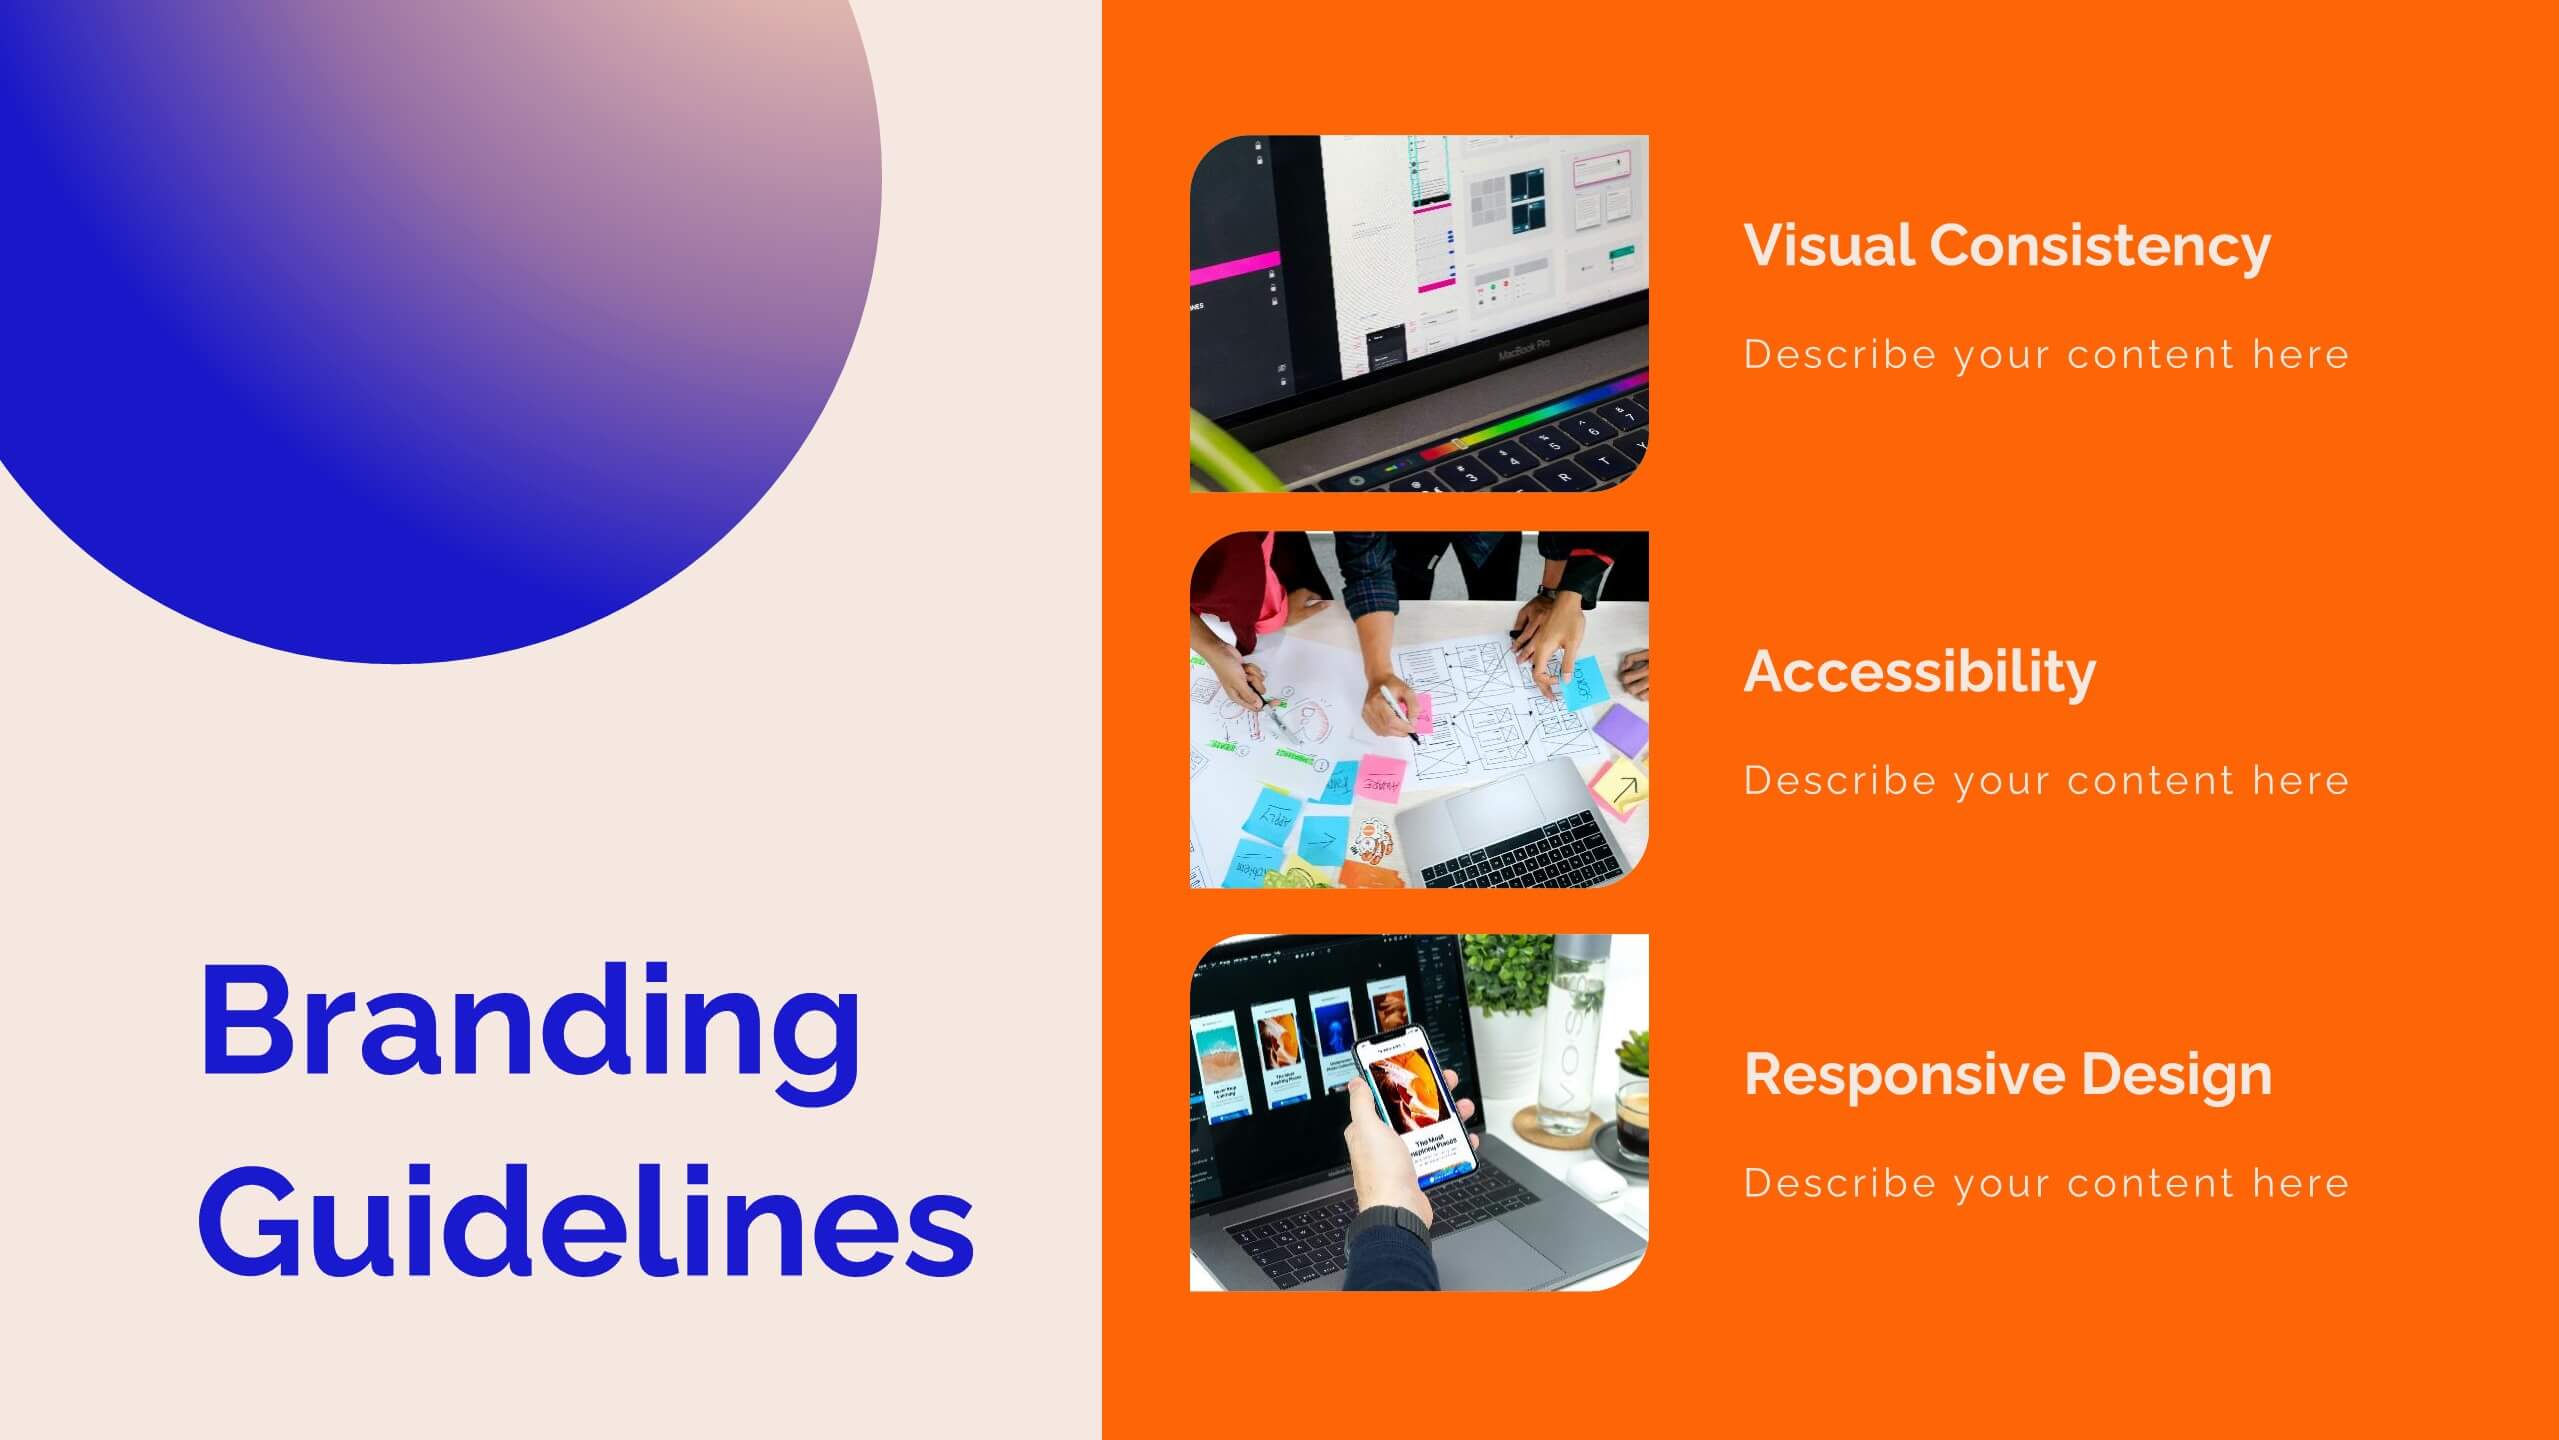
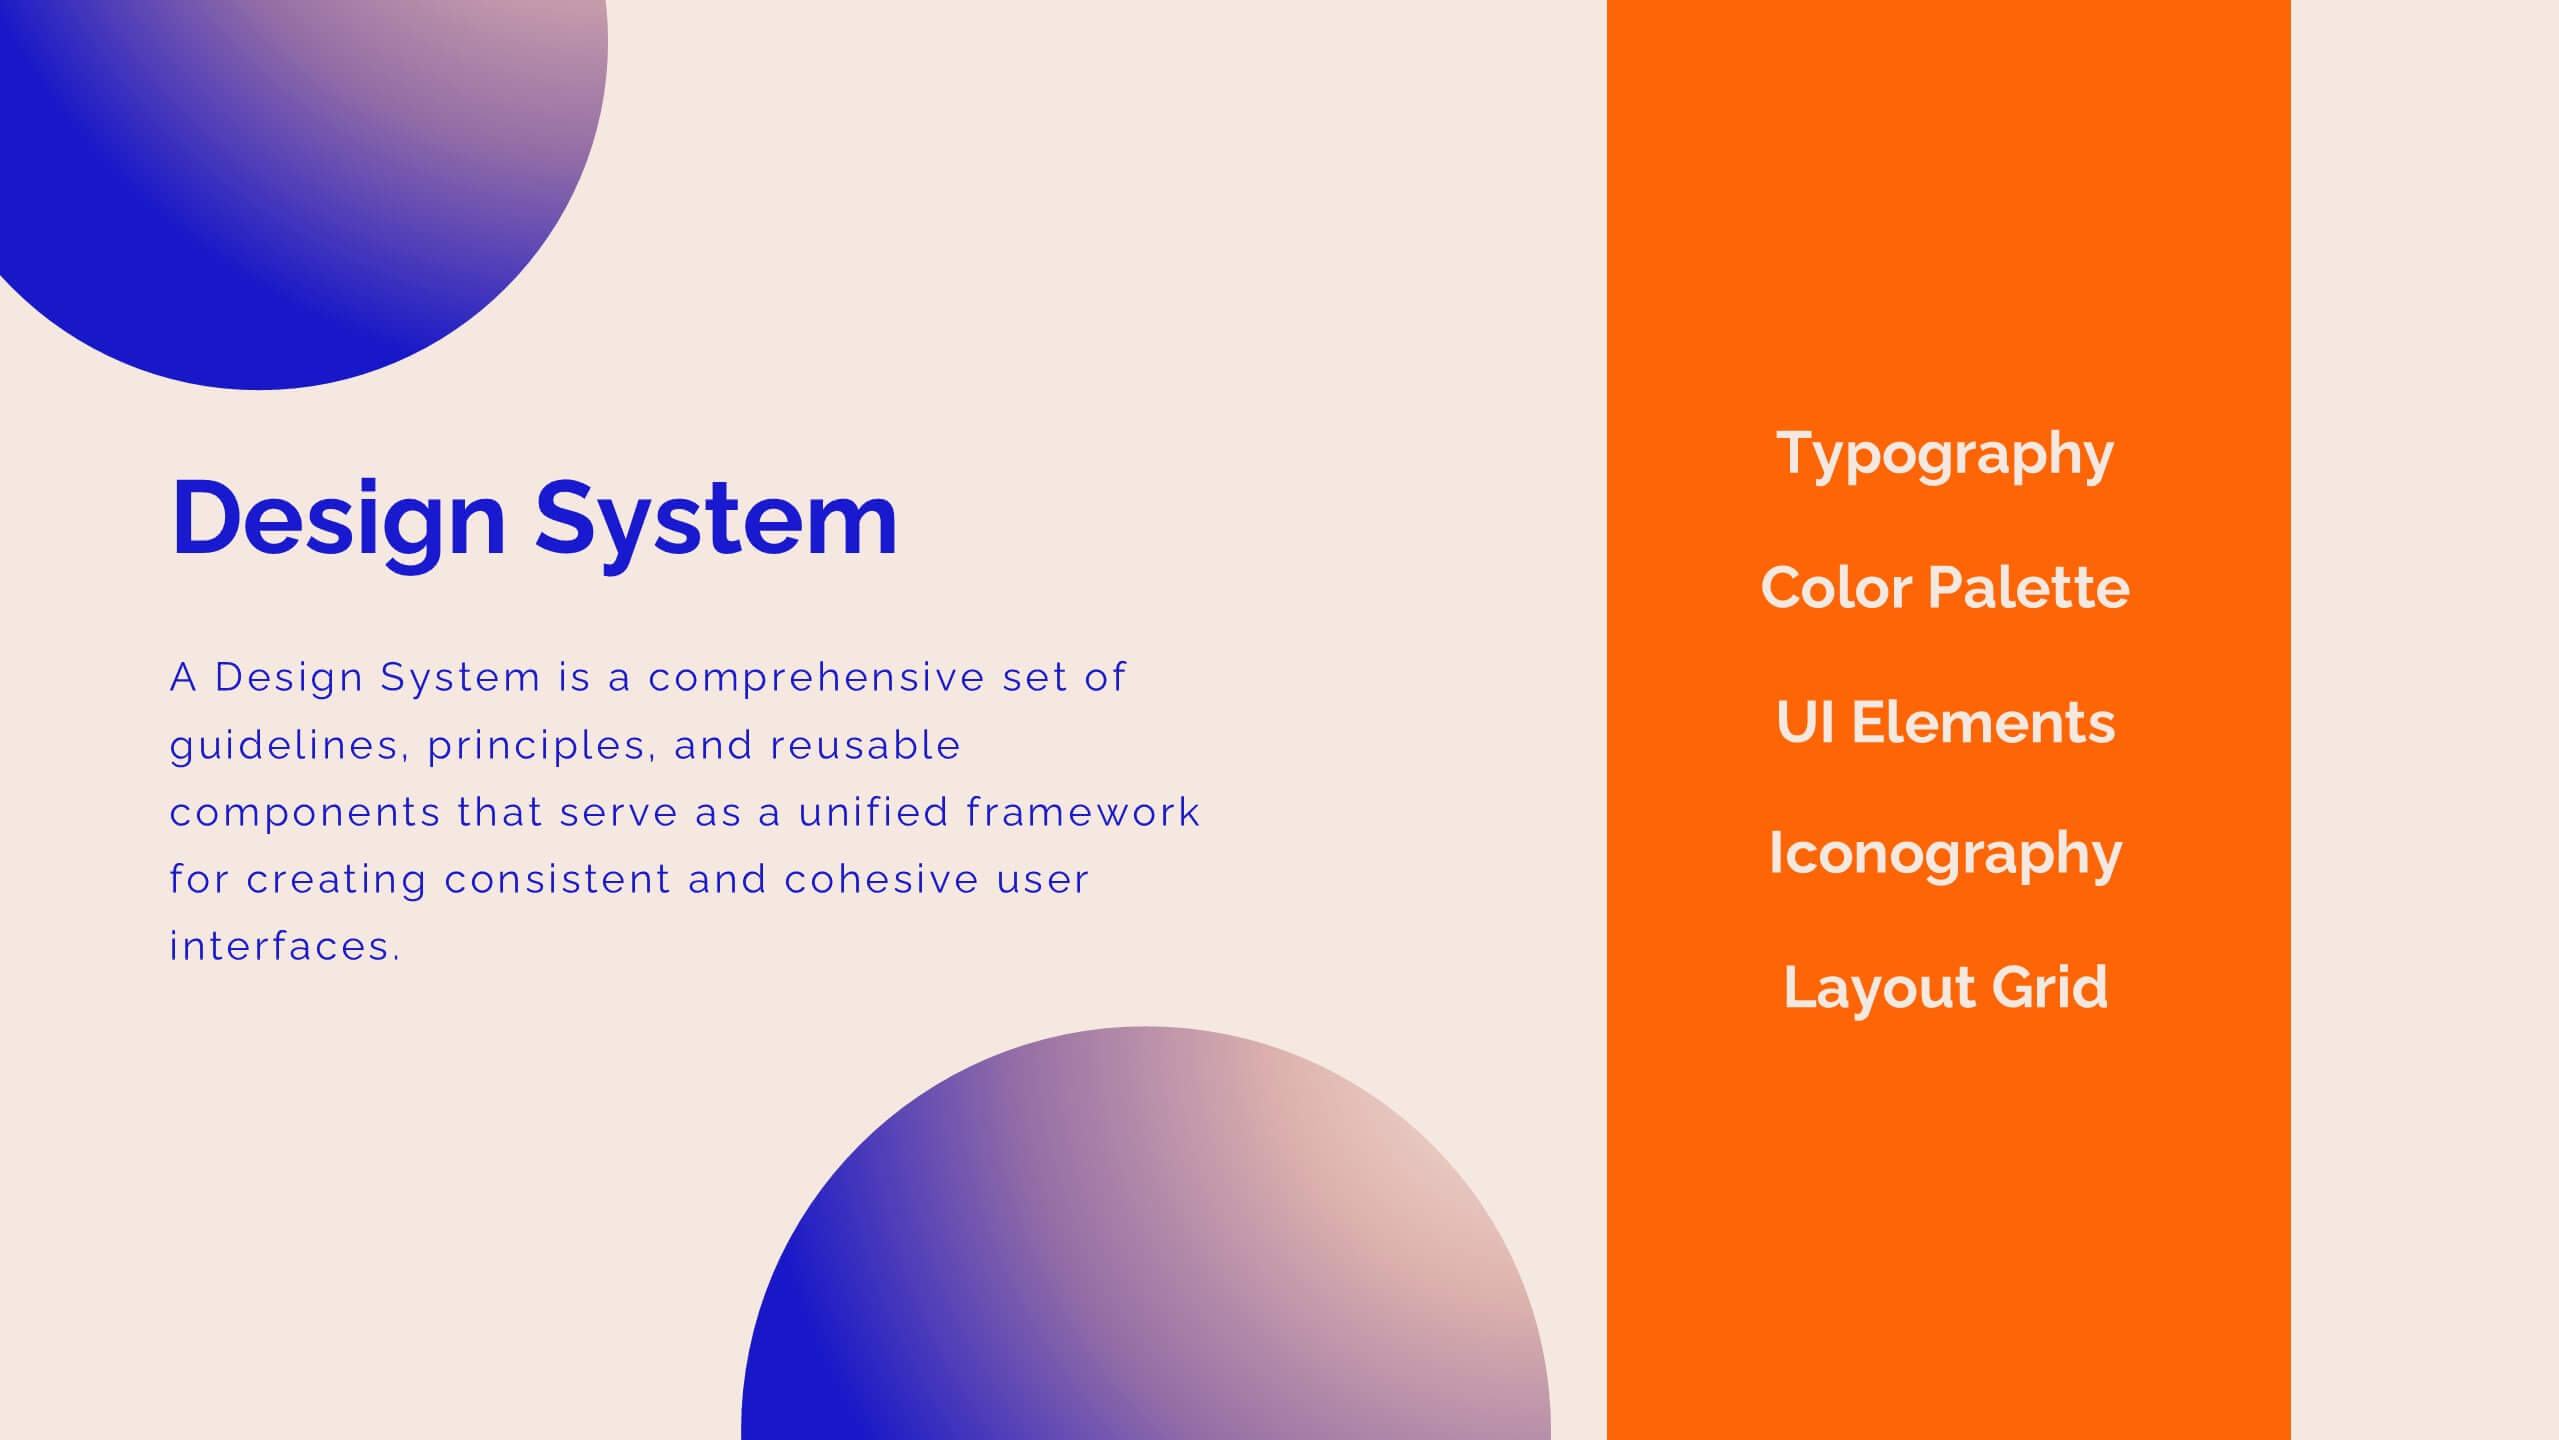
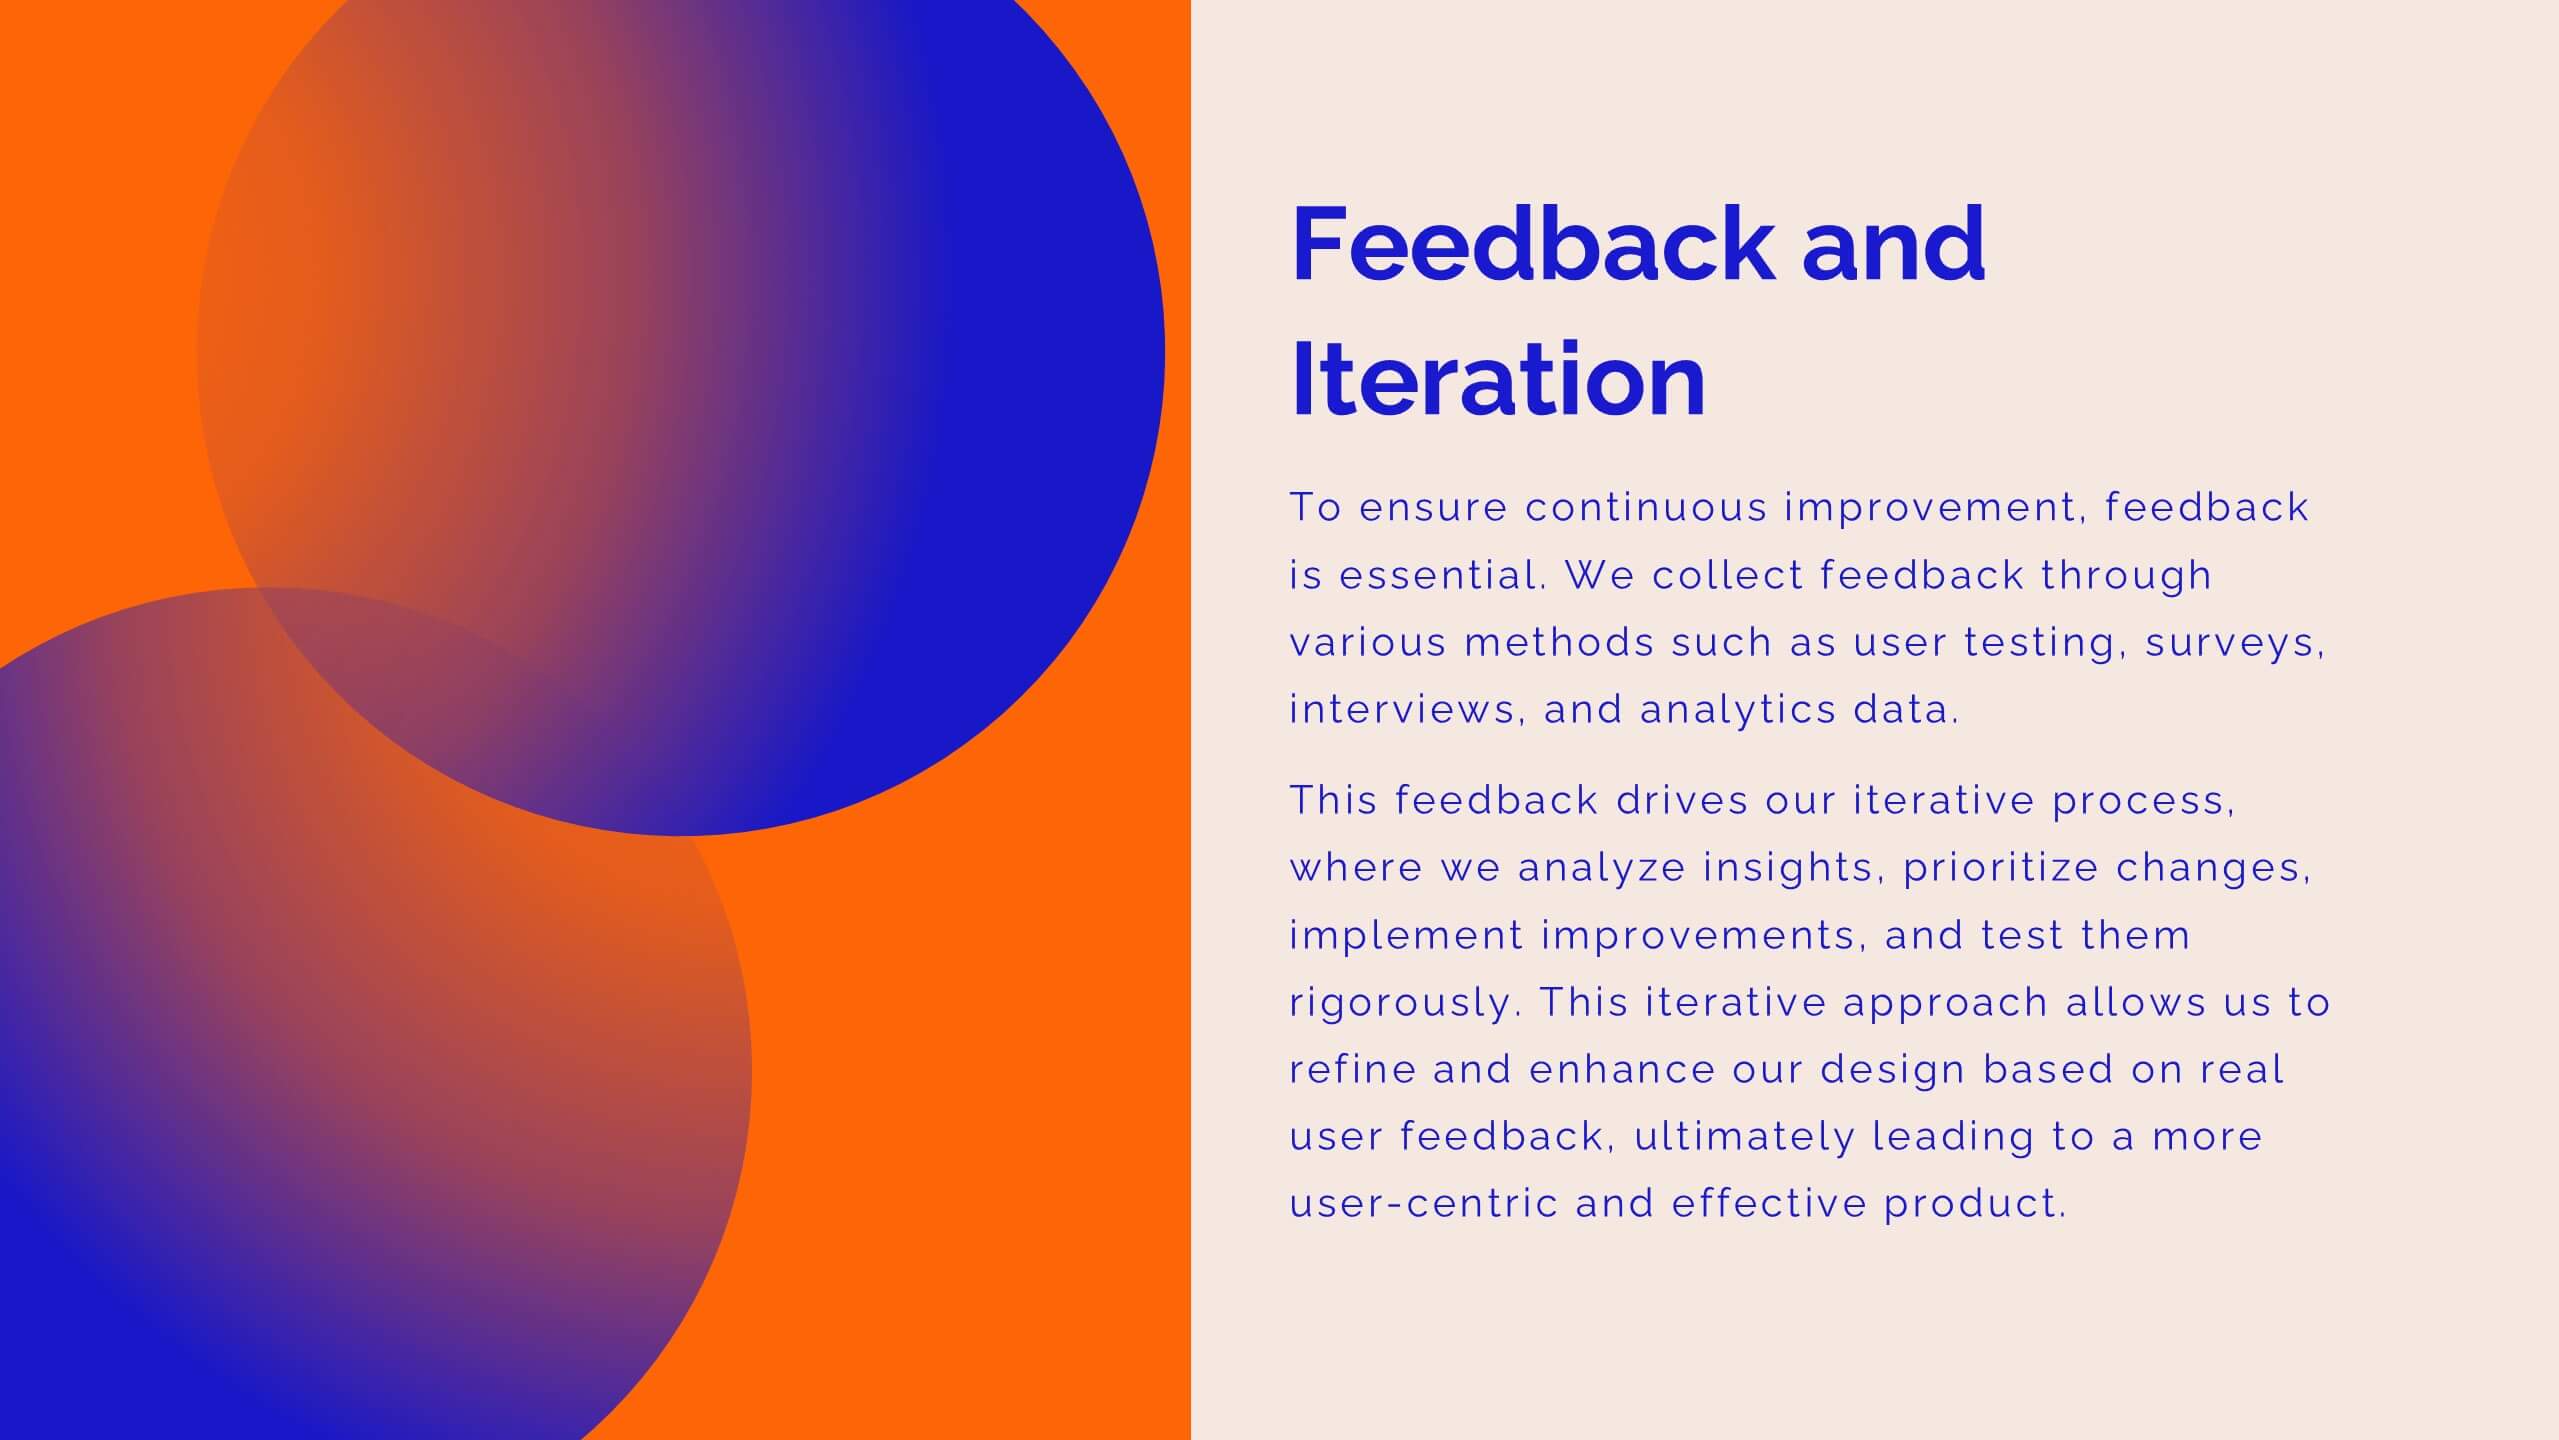
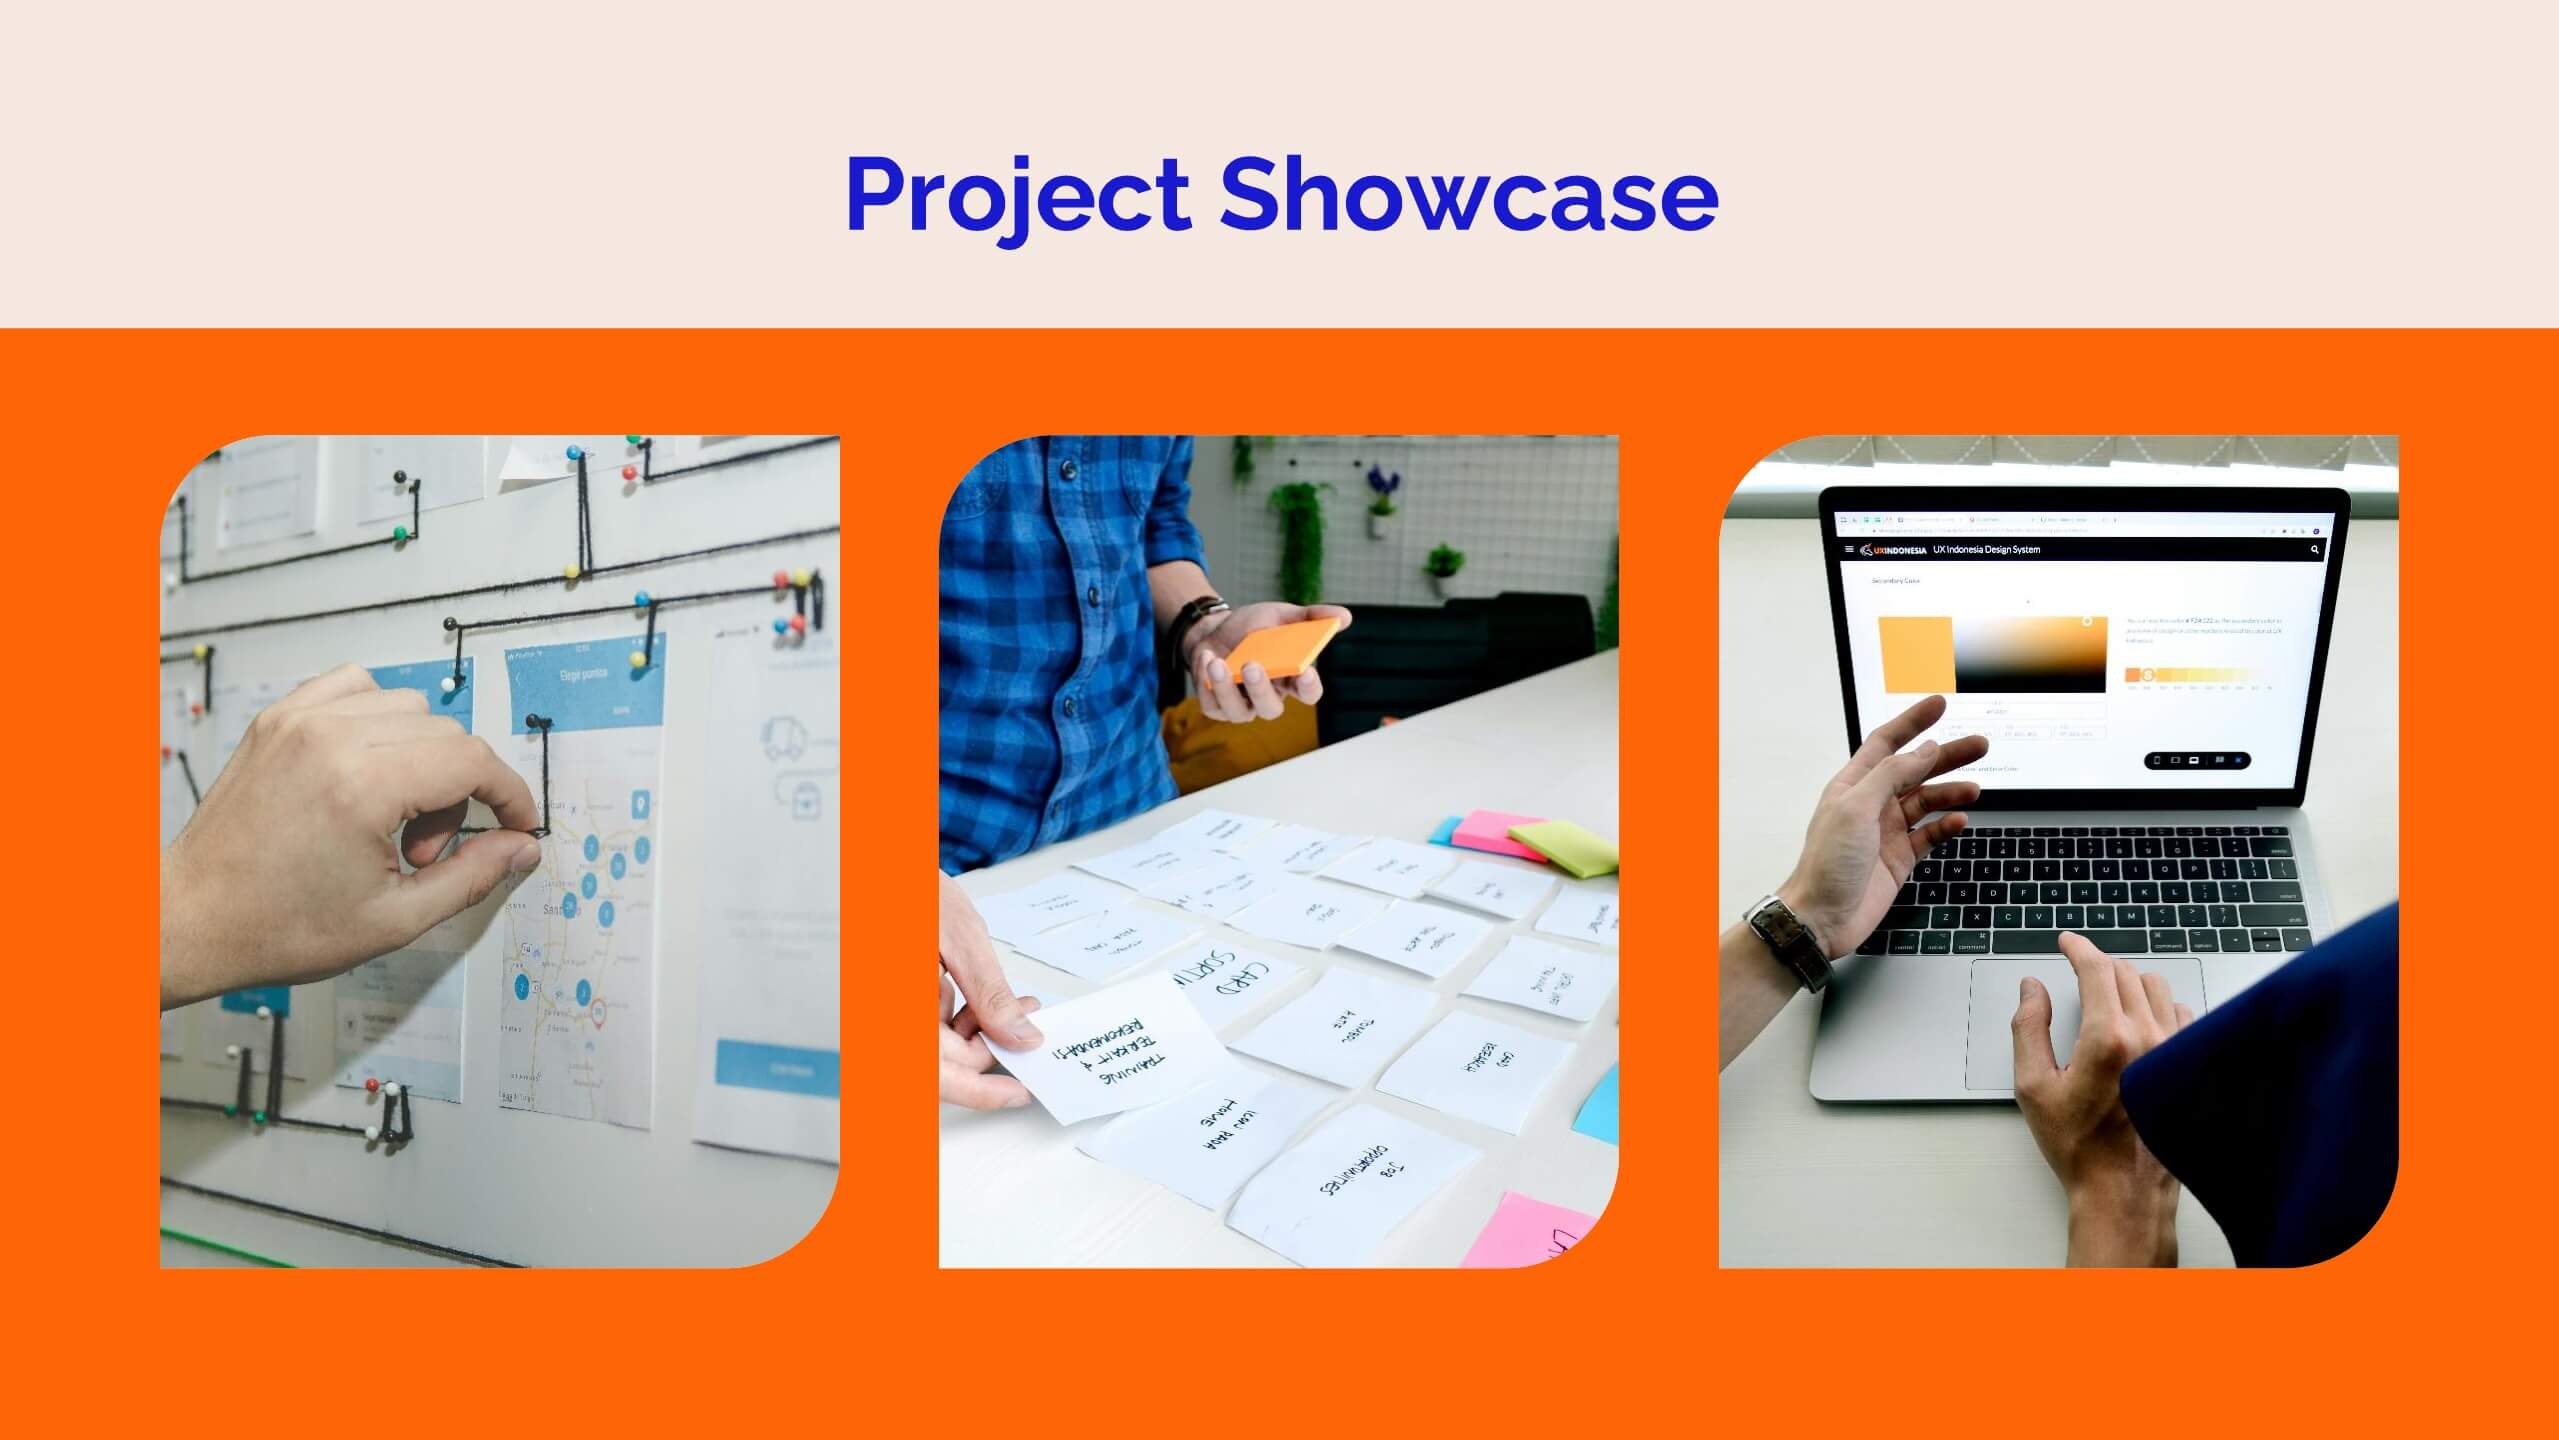
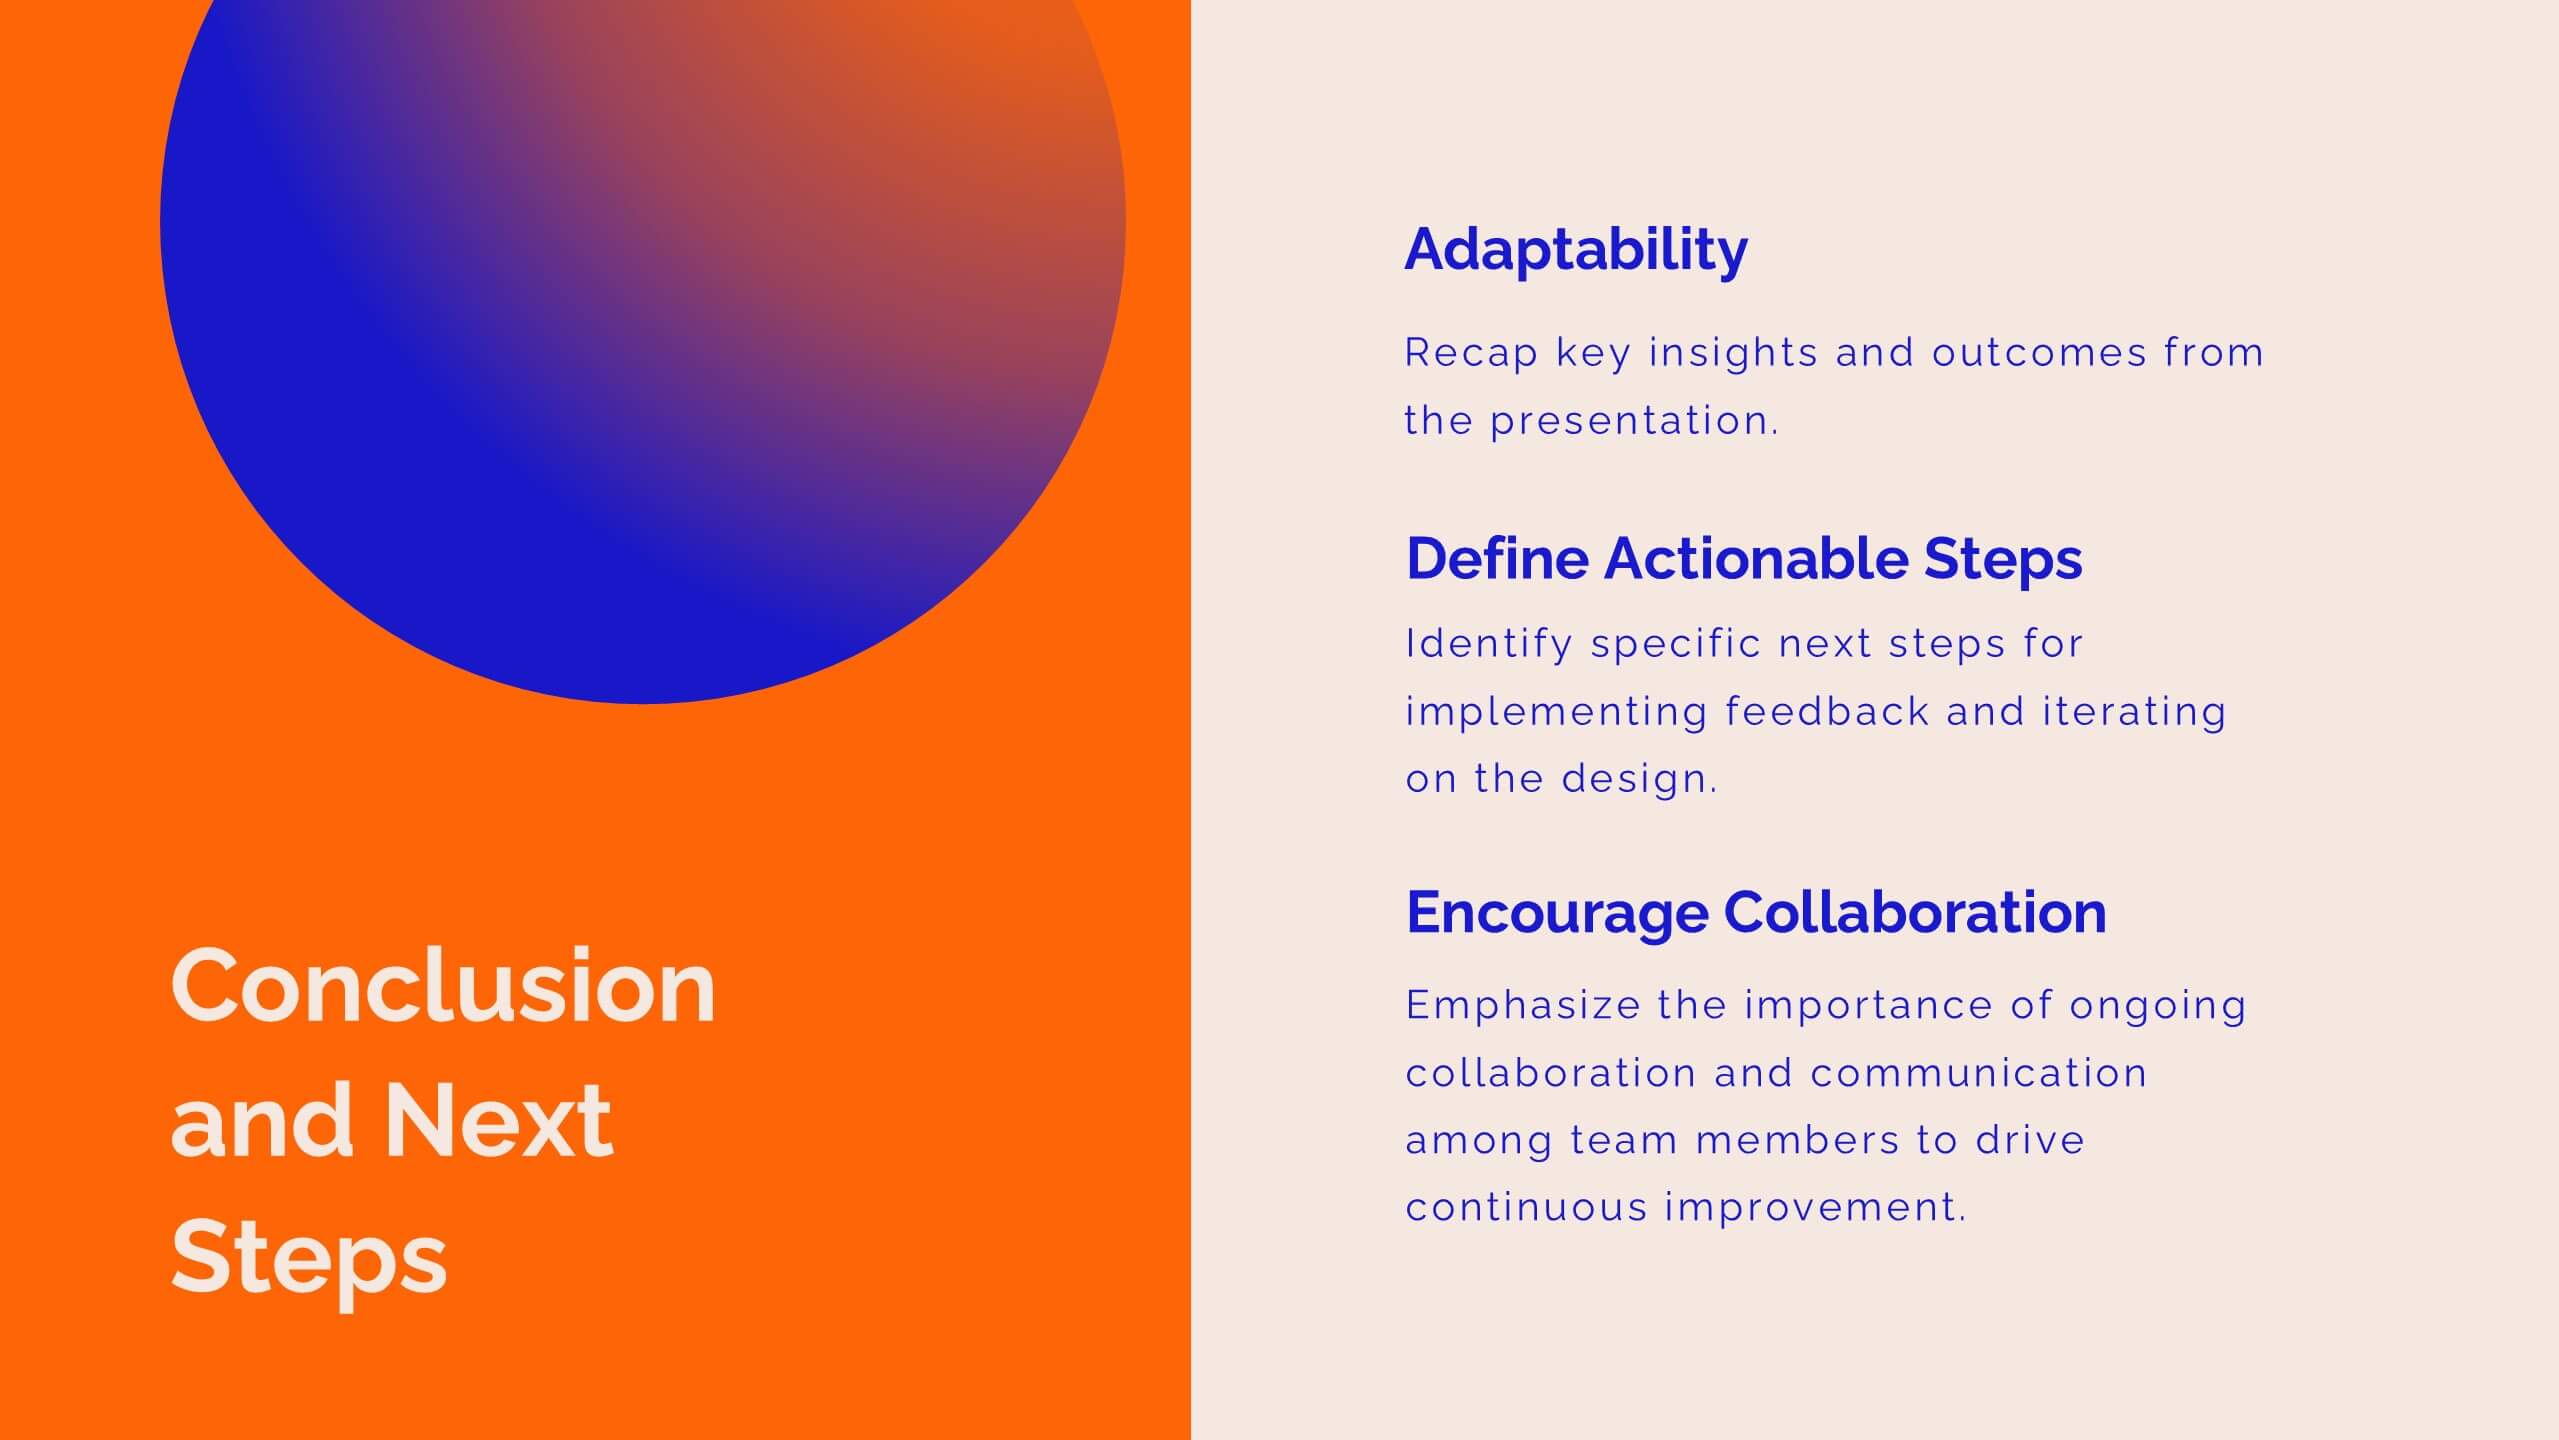
Niobium UX Research Report Presentation
Present your UX research findings with clarity and style using this vibrant UX research report template! It includes sections for user personas, wireframes, user testing, and design principles, making it ideal for sharing research insights. Fully customizable and compatible with PowerPoint, Keynote, and Google Slides, it's perfect for UX professionals and design teams.


7 diapositivas
Funnel Web Infographic
Maximize your insights with our funnel web infographic. This template is a highly informative tool designed to help you illustrate and understand various processes, from sales pipelines to user engagement funnels. This funnel infographic is all about presenting data in an engaging, easy-to-digest manner. Ideal for marketing professionals, business strategists, and anyone looking to visualize multi-step processes. Compatible with Powerpoint, Keynote, and Google Slides. You can add a vibrant yet professional color scheme to ensure attention of information. Present your data in a visually captivating way!


6 diapositivas
Business Value Chain Strategy
Turn your strategy into a winning move with this interactive spin on business value chains. This engaging diagram template helps break down key activities and visualize how each stage adds value—perfect for process optimization or stakeholder presentations. Fully compatible with PowerPoint, Keynote, and Google Slides.


6 diapositivas
Project Overview and Key Takeaways Presentation
Summarize your project outcomes with clarity and impact using this Project Overview and Key Takeaways slide. Featuring a clean layout with a dedicated section for a brief overview and key metrics, plus four hexagonal milestones for your main insights. Perfect for wrap-up reports, client updates, or stakeholder reviews. Fully editable in PowerPoint, Keynote, and Google Slides.


4 diapositivas
Environmental Impact Assessment Presentation
Bring your audience into a greener future with a clean, leaf-inspired design that makes complex sustainability insights feel clear and approachable. This presentation helps you break down key environmental factors, impact areas, and responsible planning in a simple visual flow. Fully editable and compatible with PowerPoint, Keynote, and Google Slides.


4 diapositivas
Organic Farming Overview Presentation
Present your sustainable agriculture strategies with this organic farming overview template, featuring vibrant icons and clean layouts. Perfect for eco-friendly initiatives, farm project plans, and environmental reports. Fully editable in Canva, PowerPoint, and Google Slides, allowing you to adjust colors, icons, and text to align with your branding and goals.