


Características


¿Tienes alguna pregunta?
Recomendar


5 diapositivas
Strategic Planning with Foundational Pillars Presentation
Define the structure behind your strategic vision with the Strategic Planning with Foundational Pillars presentation. This template showcases four strong pillars beneath a classical pediment, symbolizing the stability and balance of your business strategy. Each pillar represents a core principle—perfect for themes like leadership, values, operations, or goals. Clean, modern, and entirely editable in PowerPoint, Keynote, and Google Slides, this visual works great for executive briefings, annual plans, or business consulting pitches.
21 diapositivas
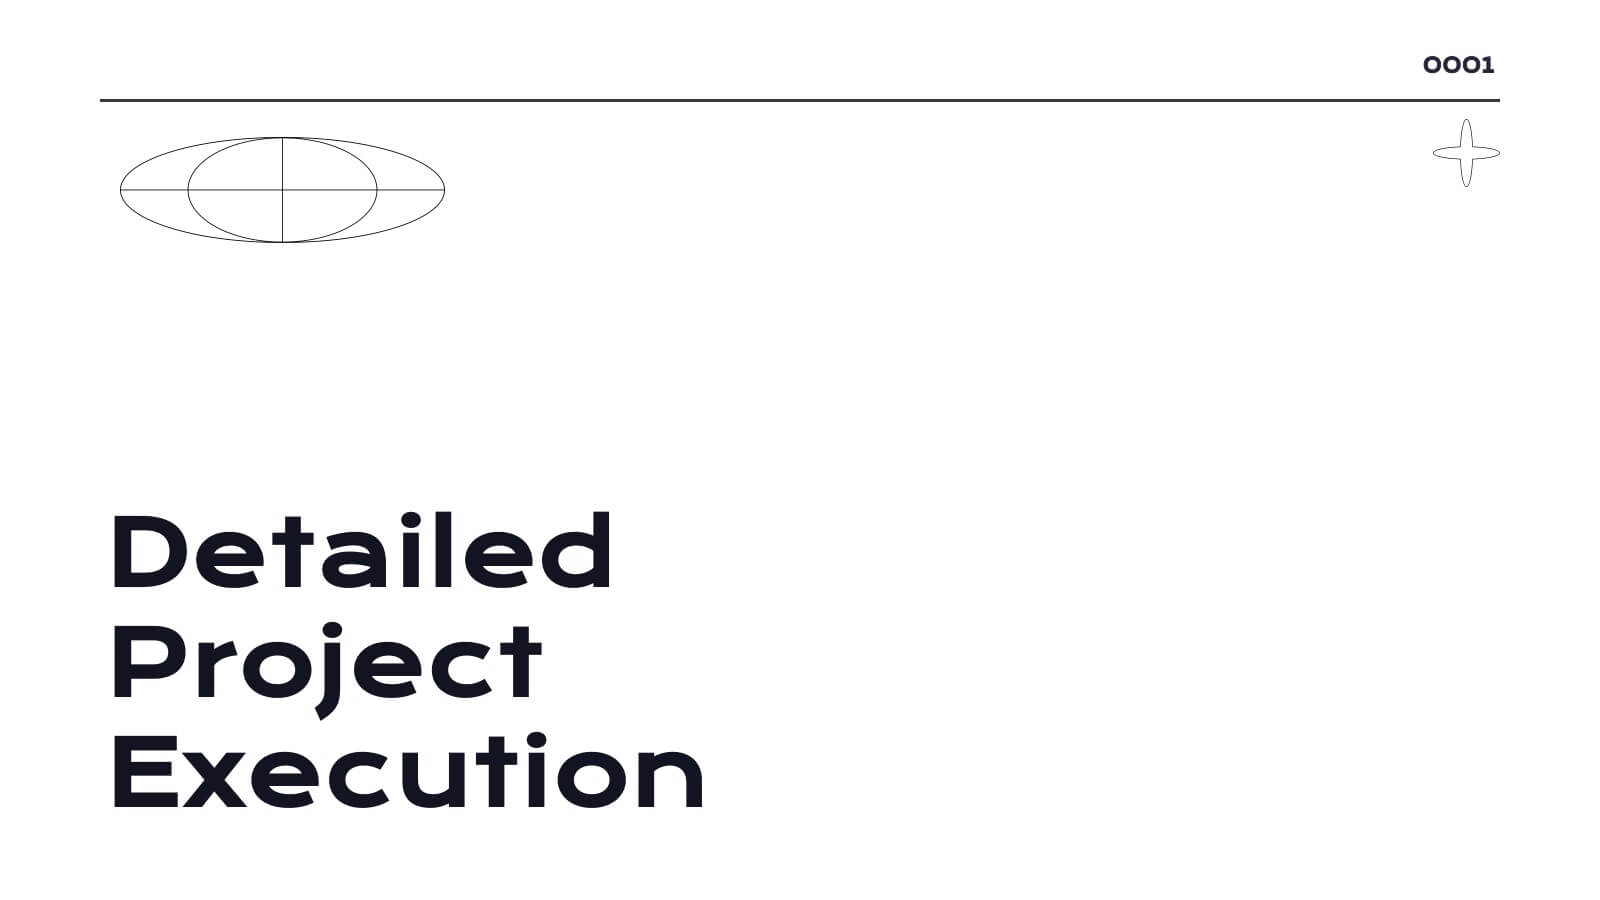
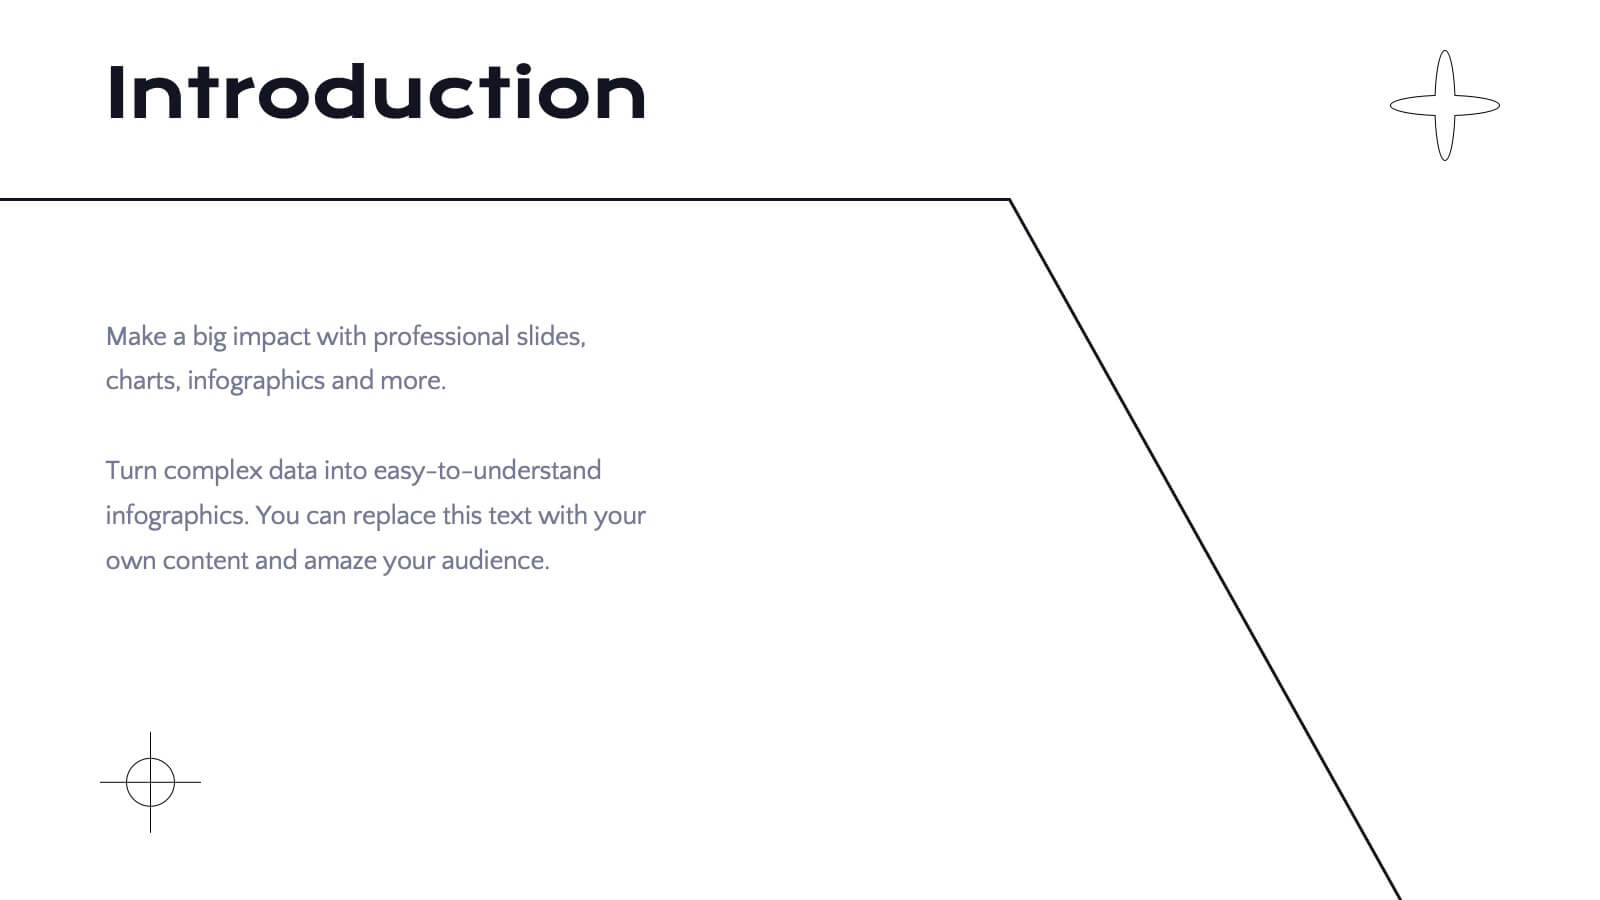
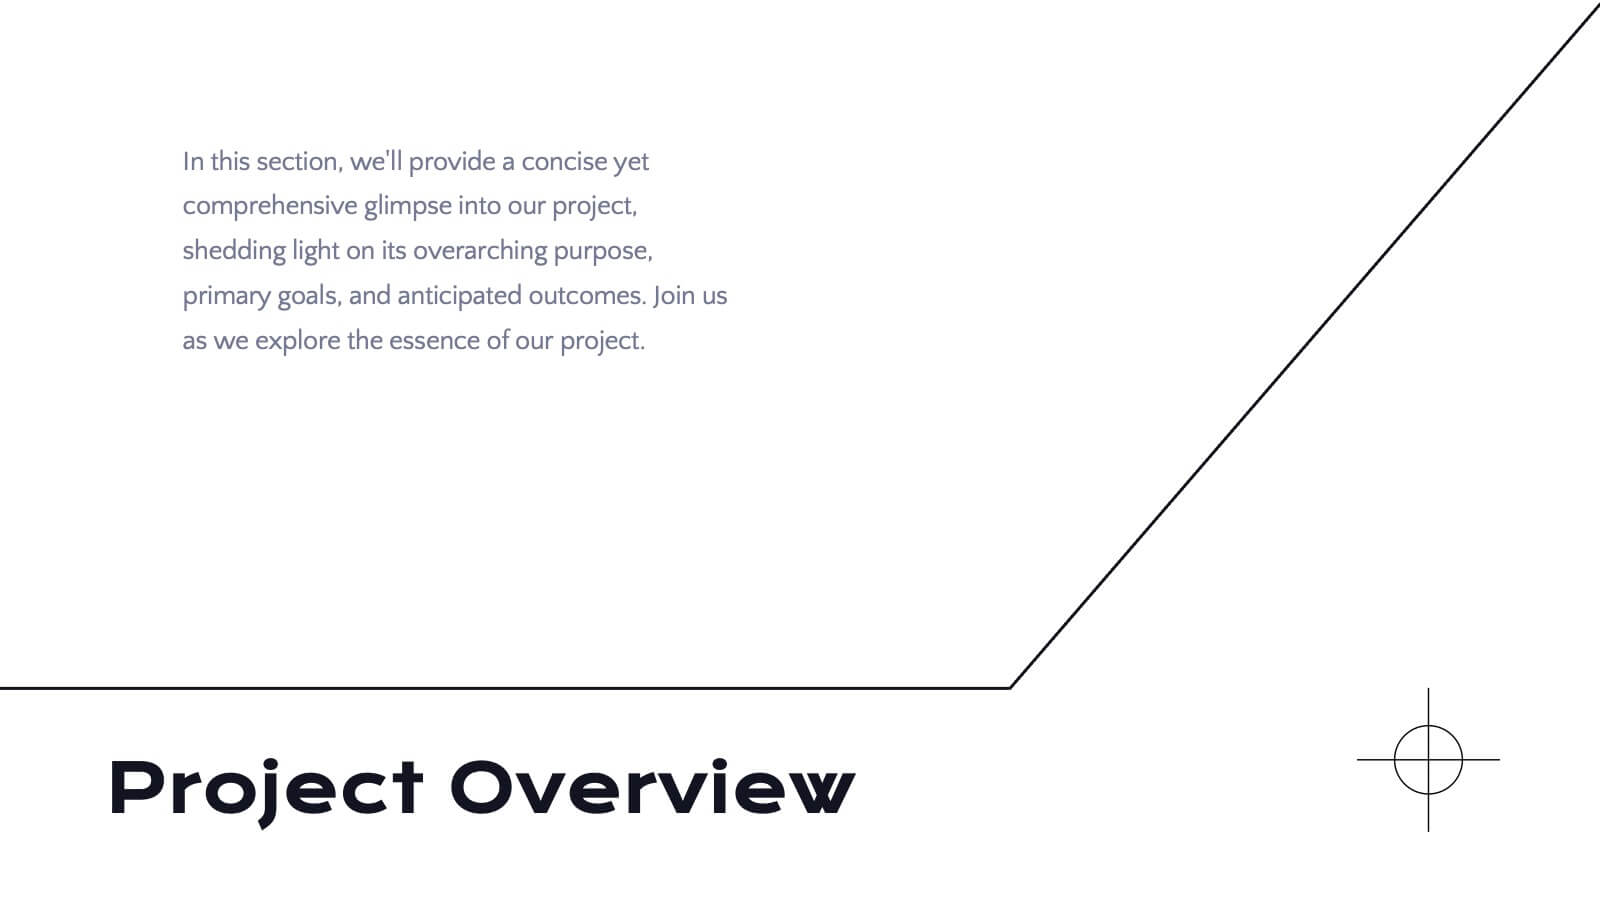
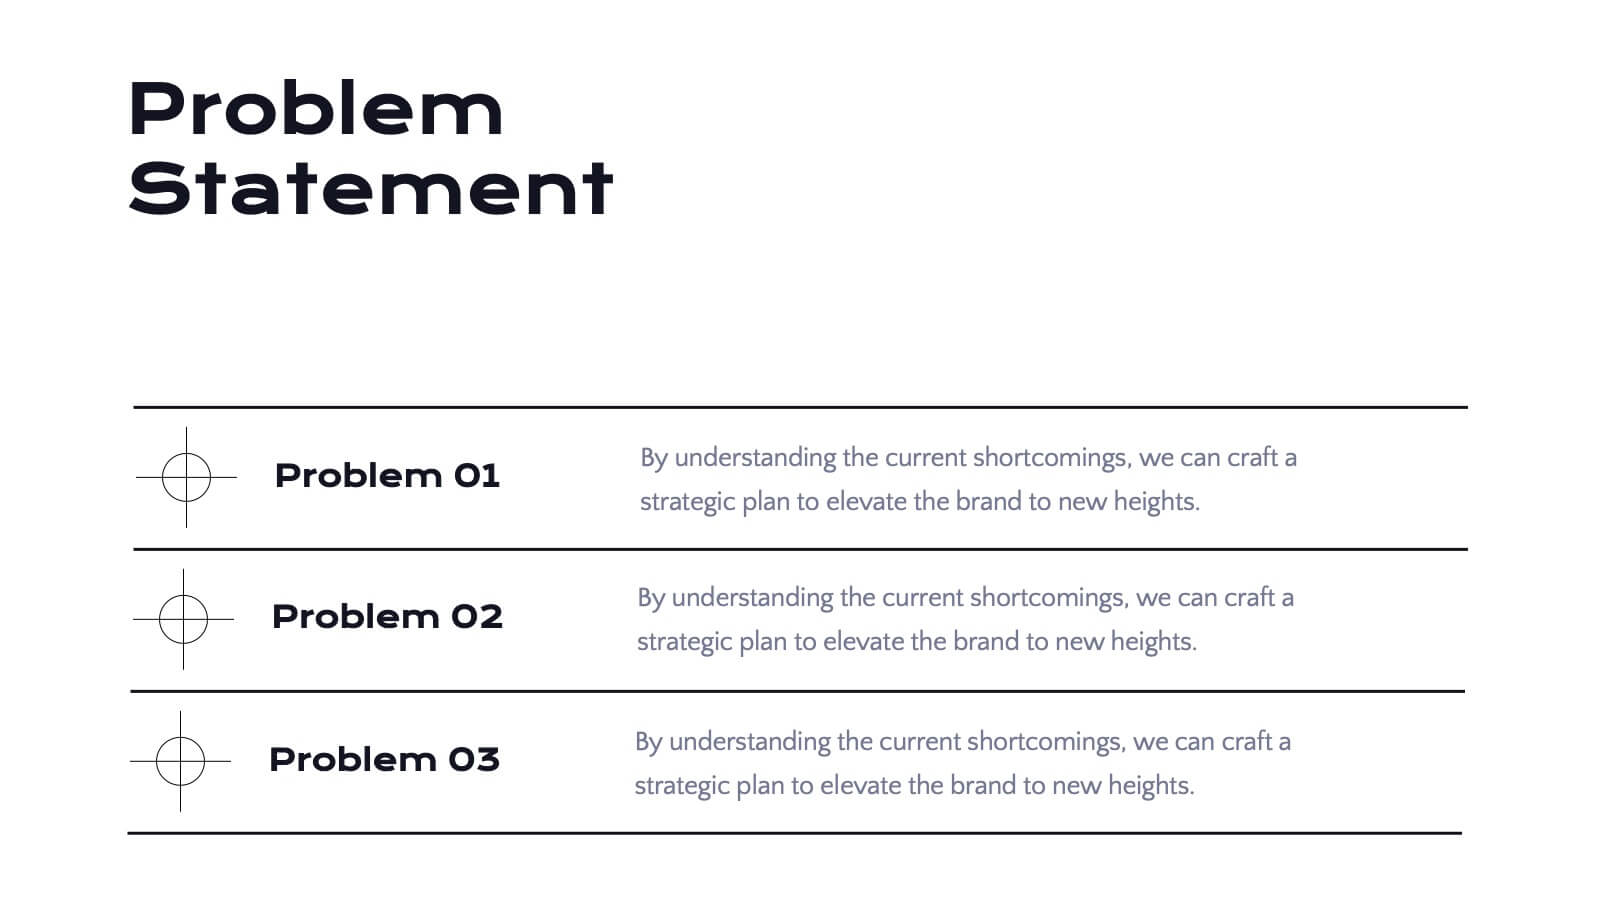
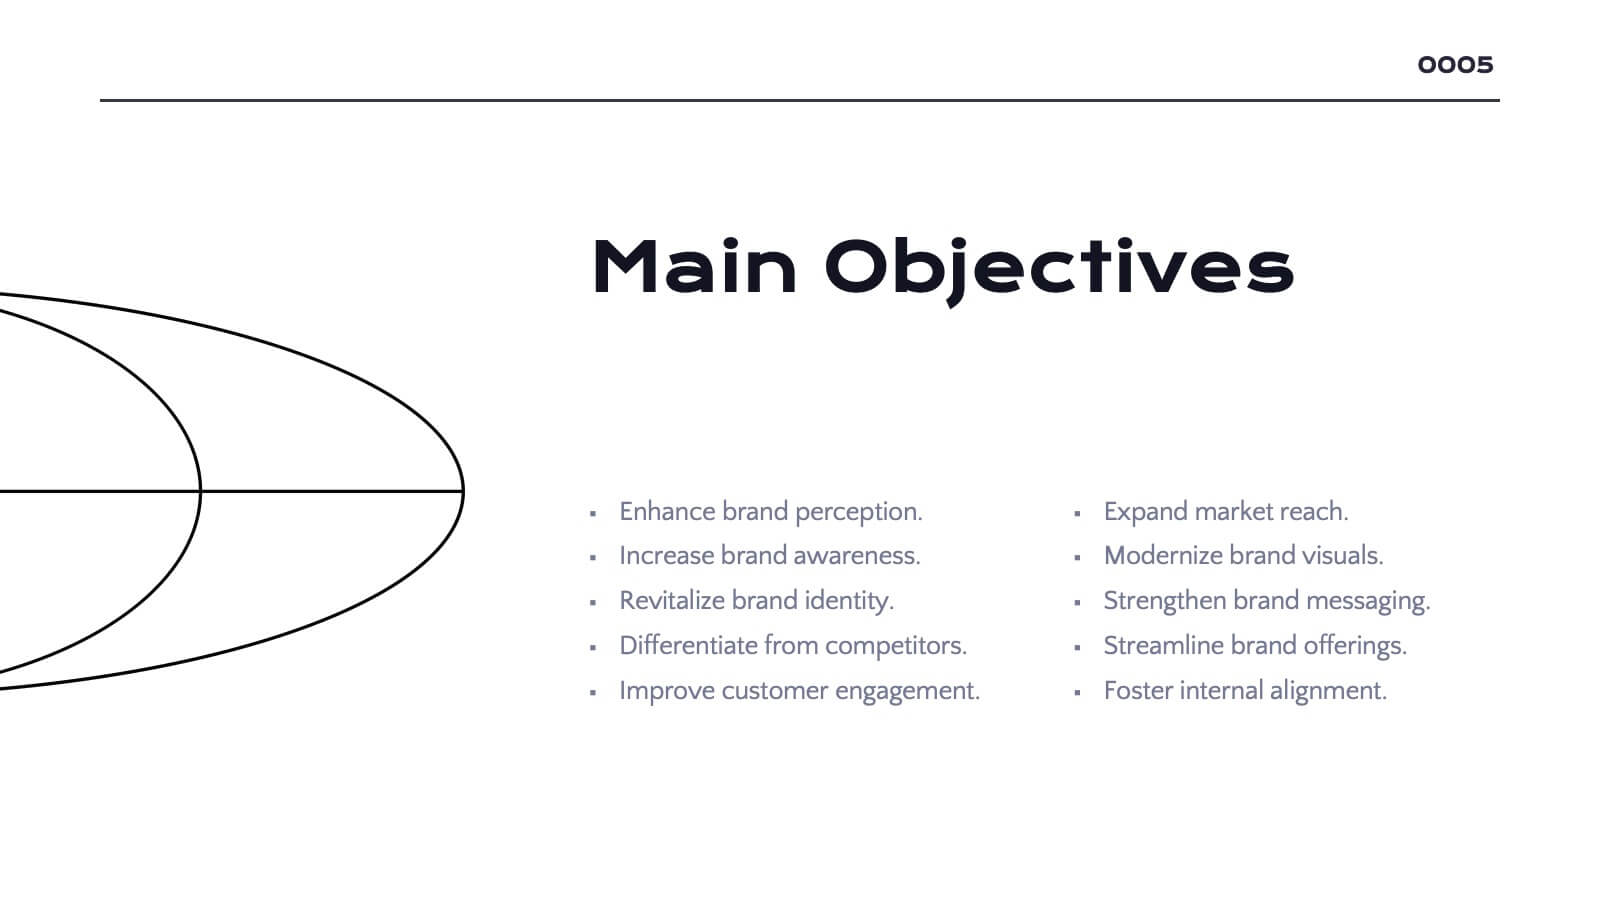
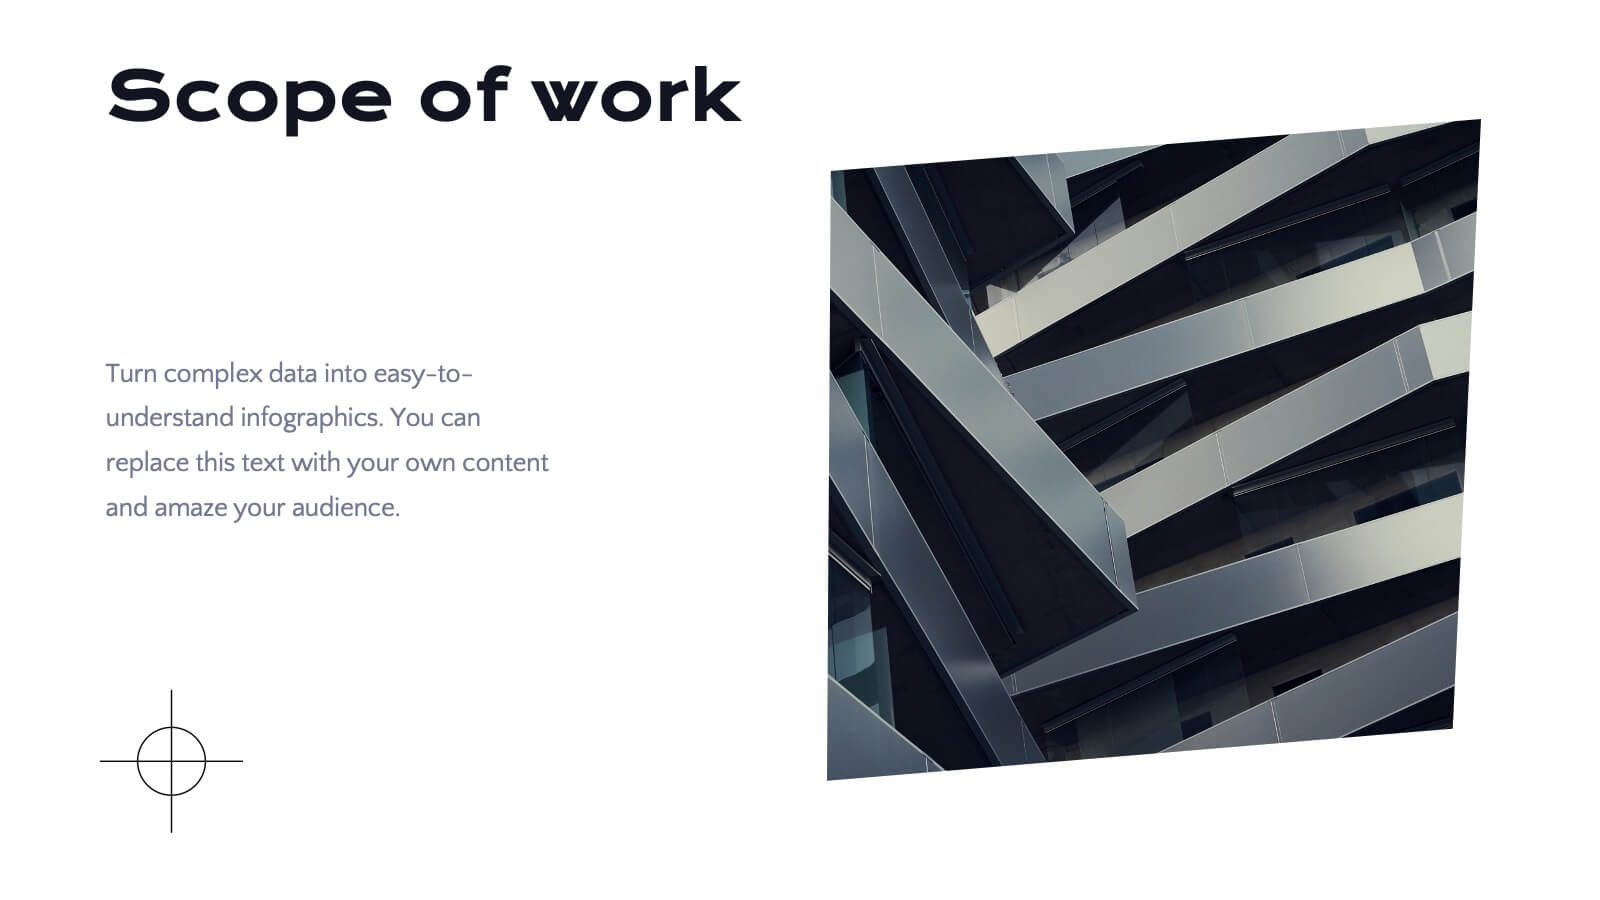
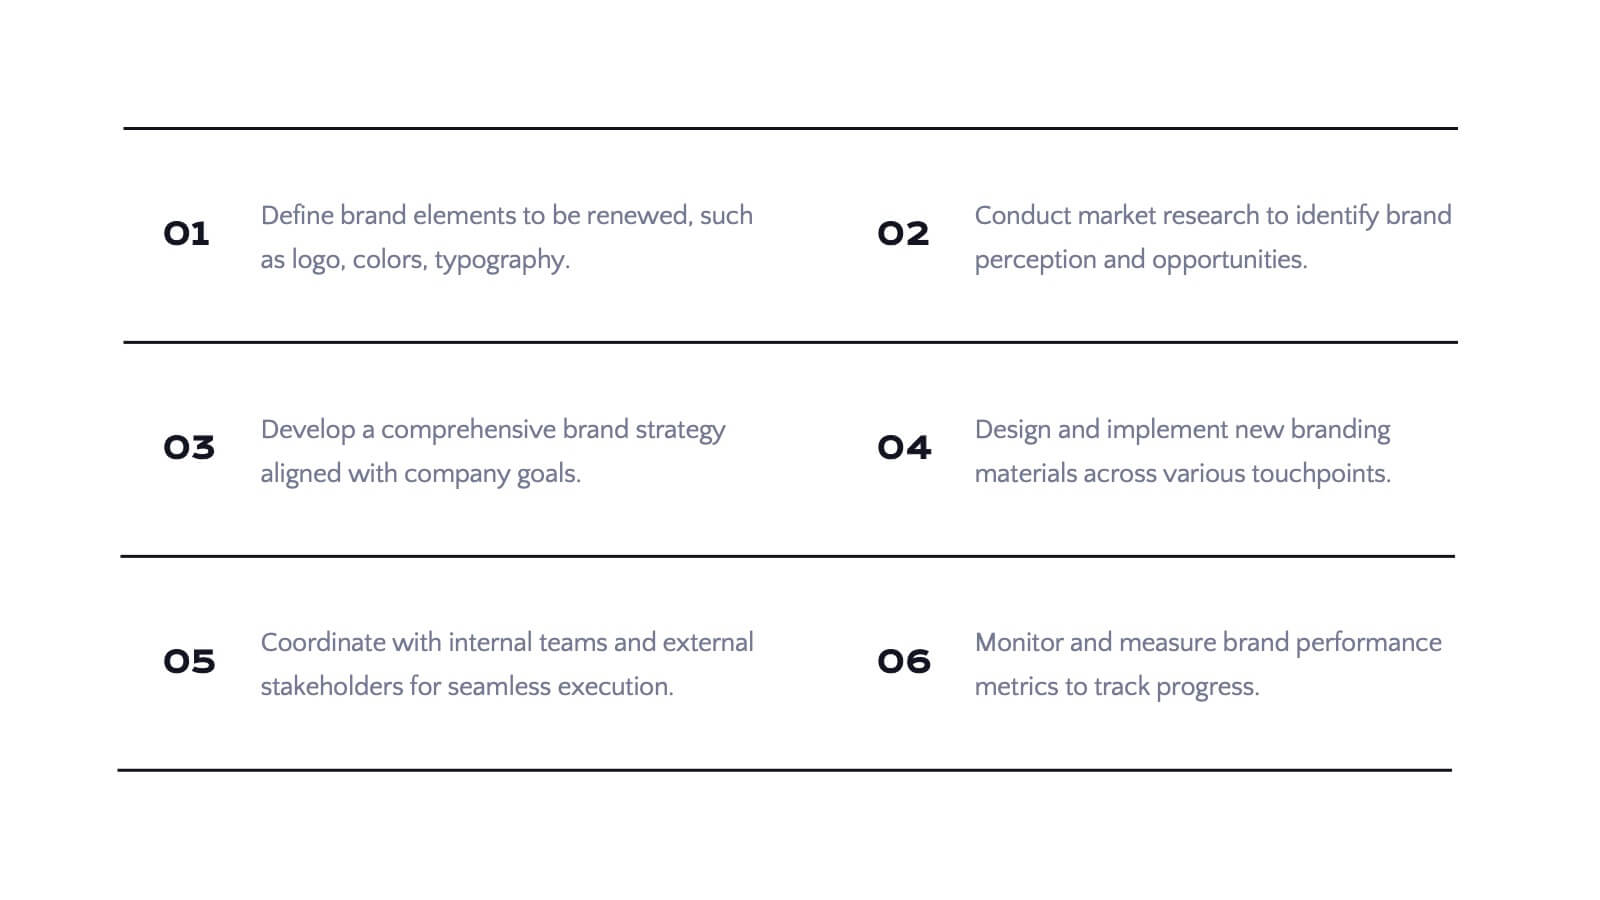
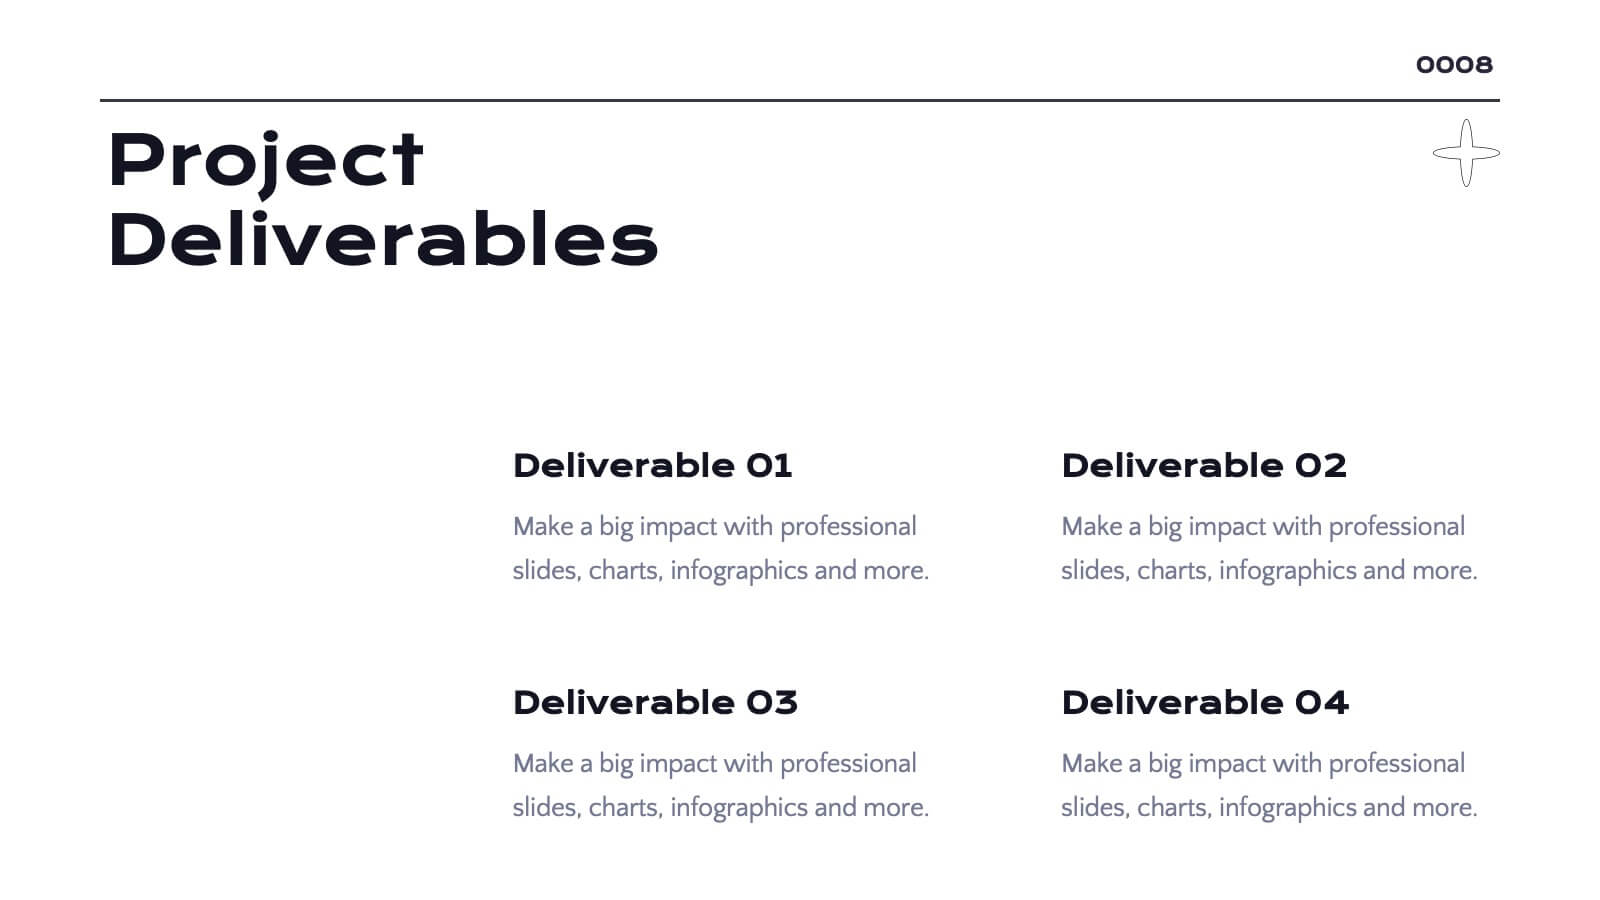
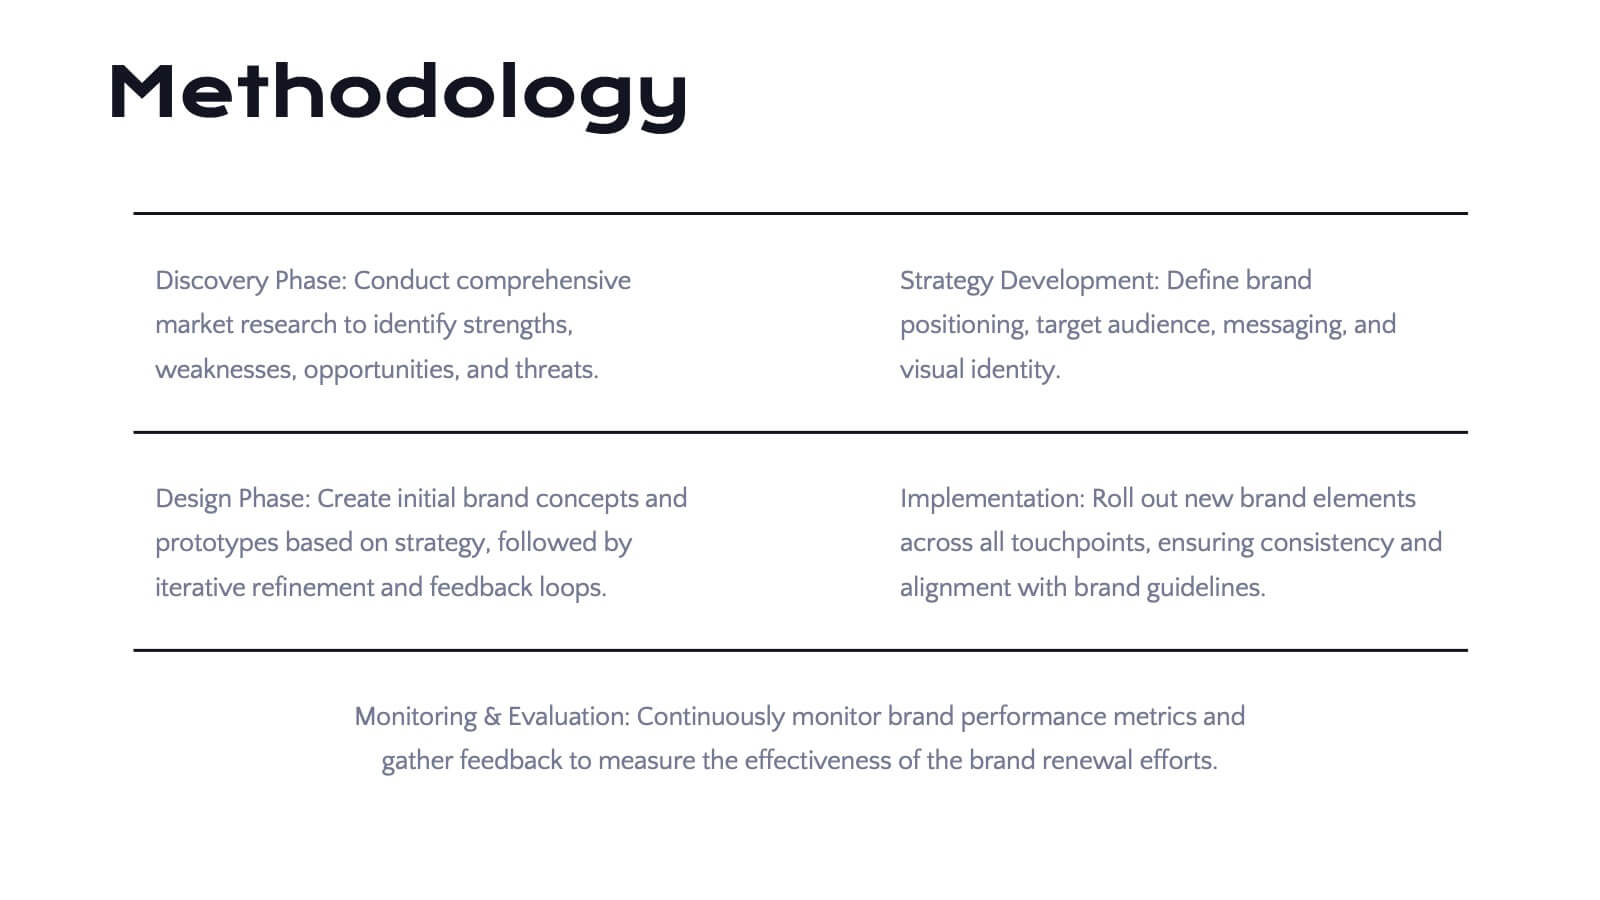
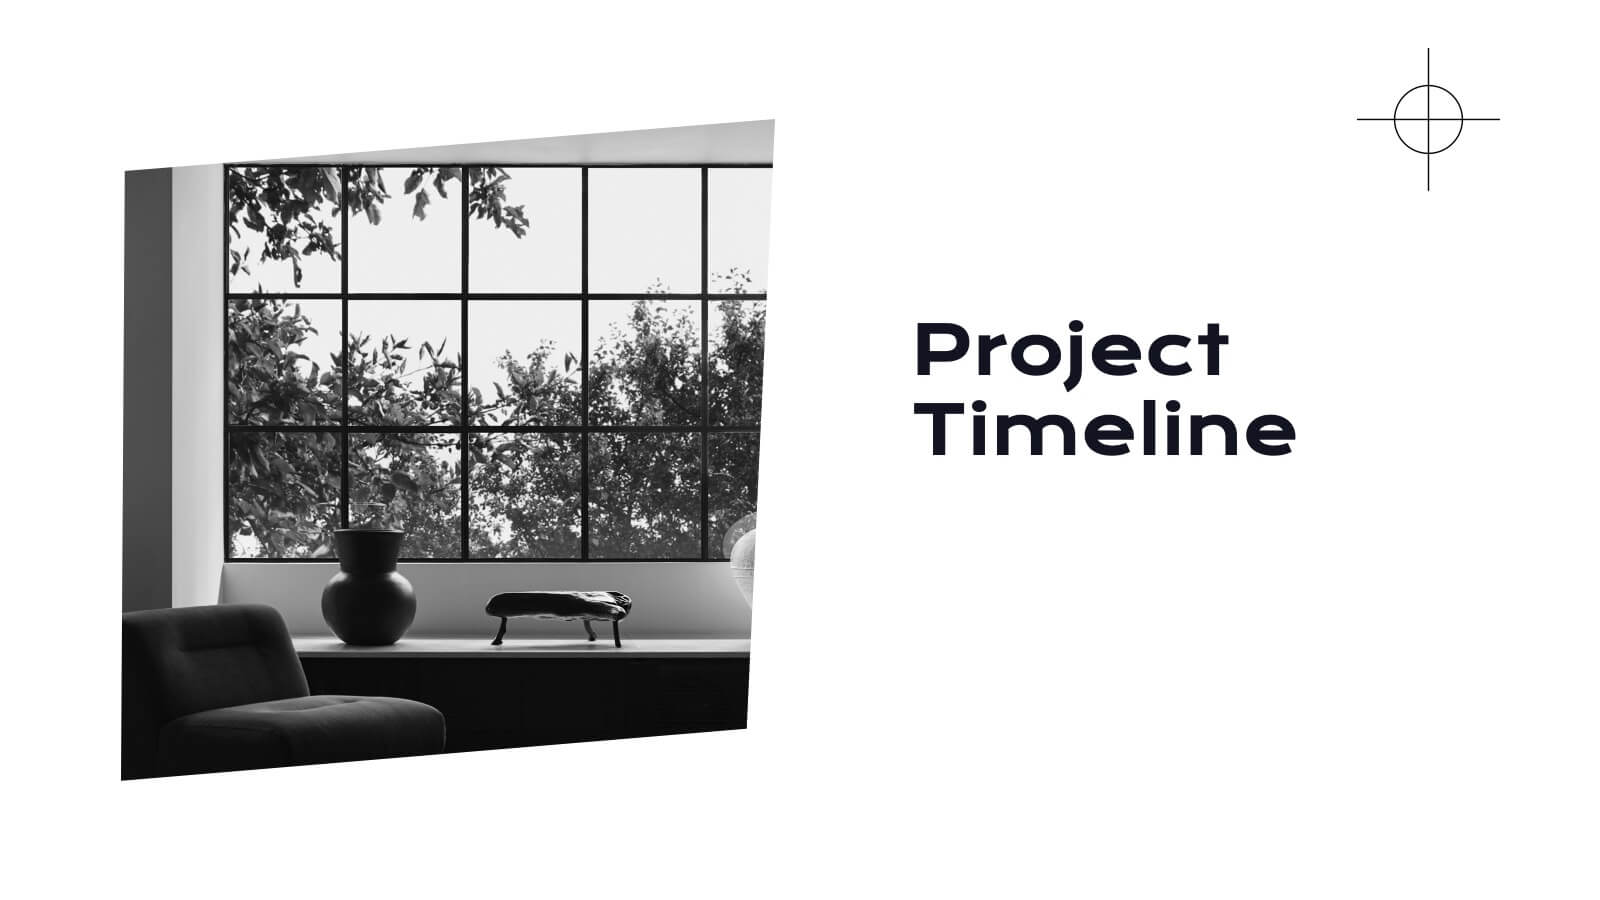
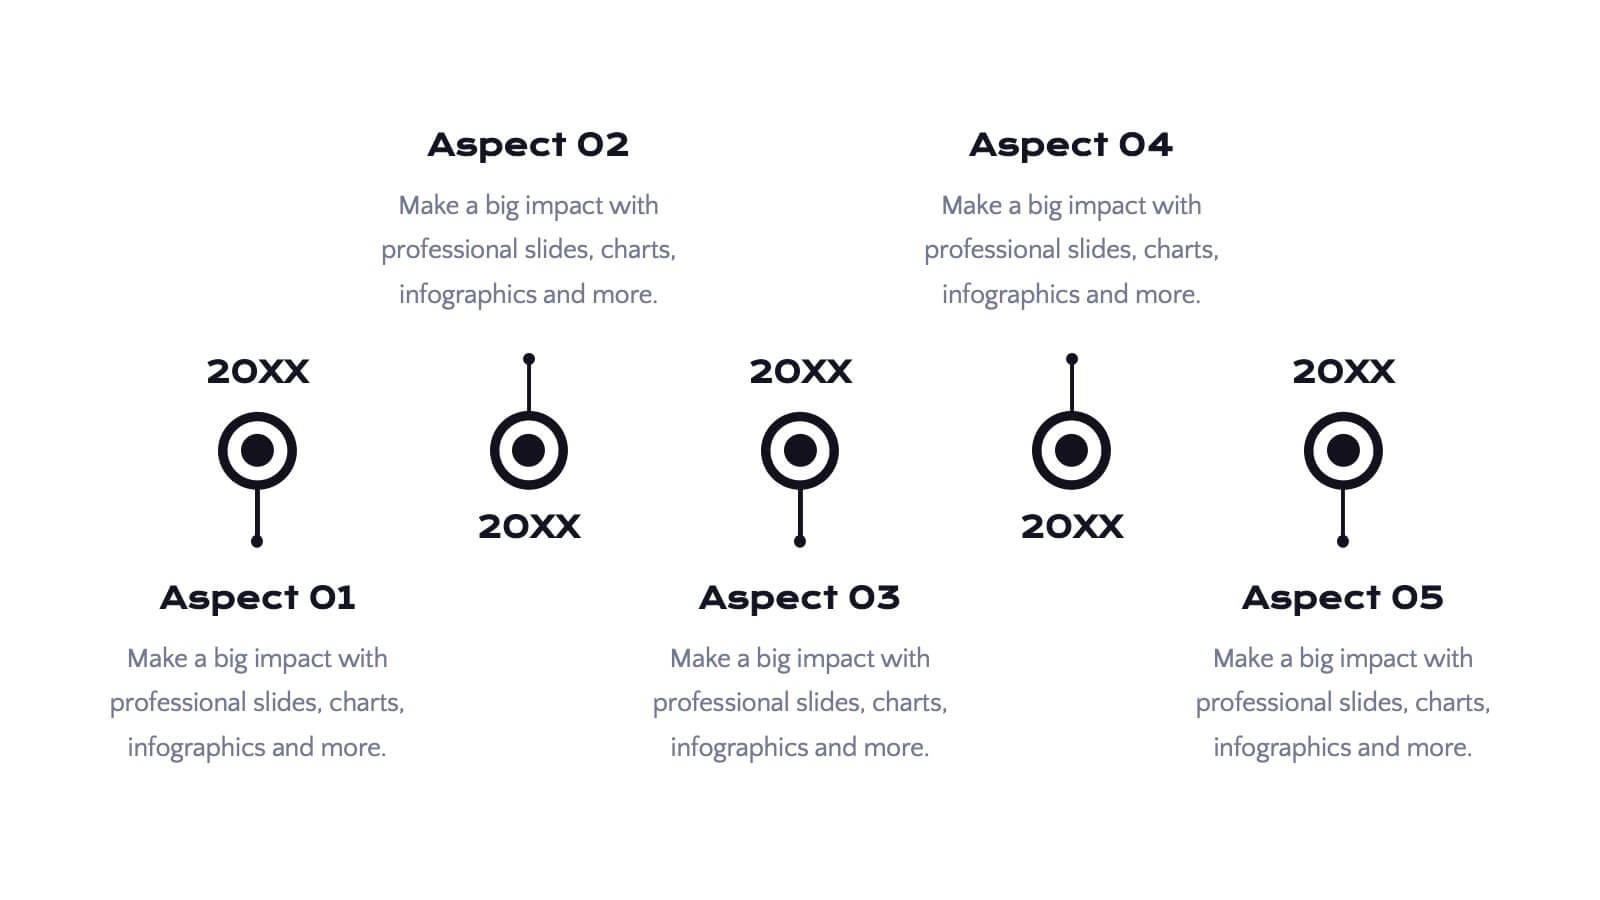
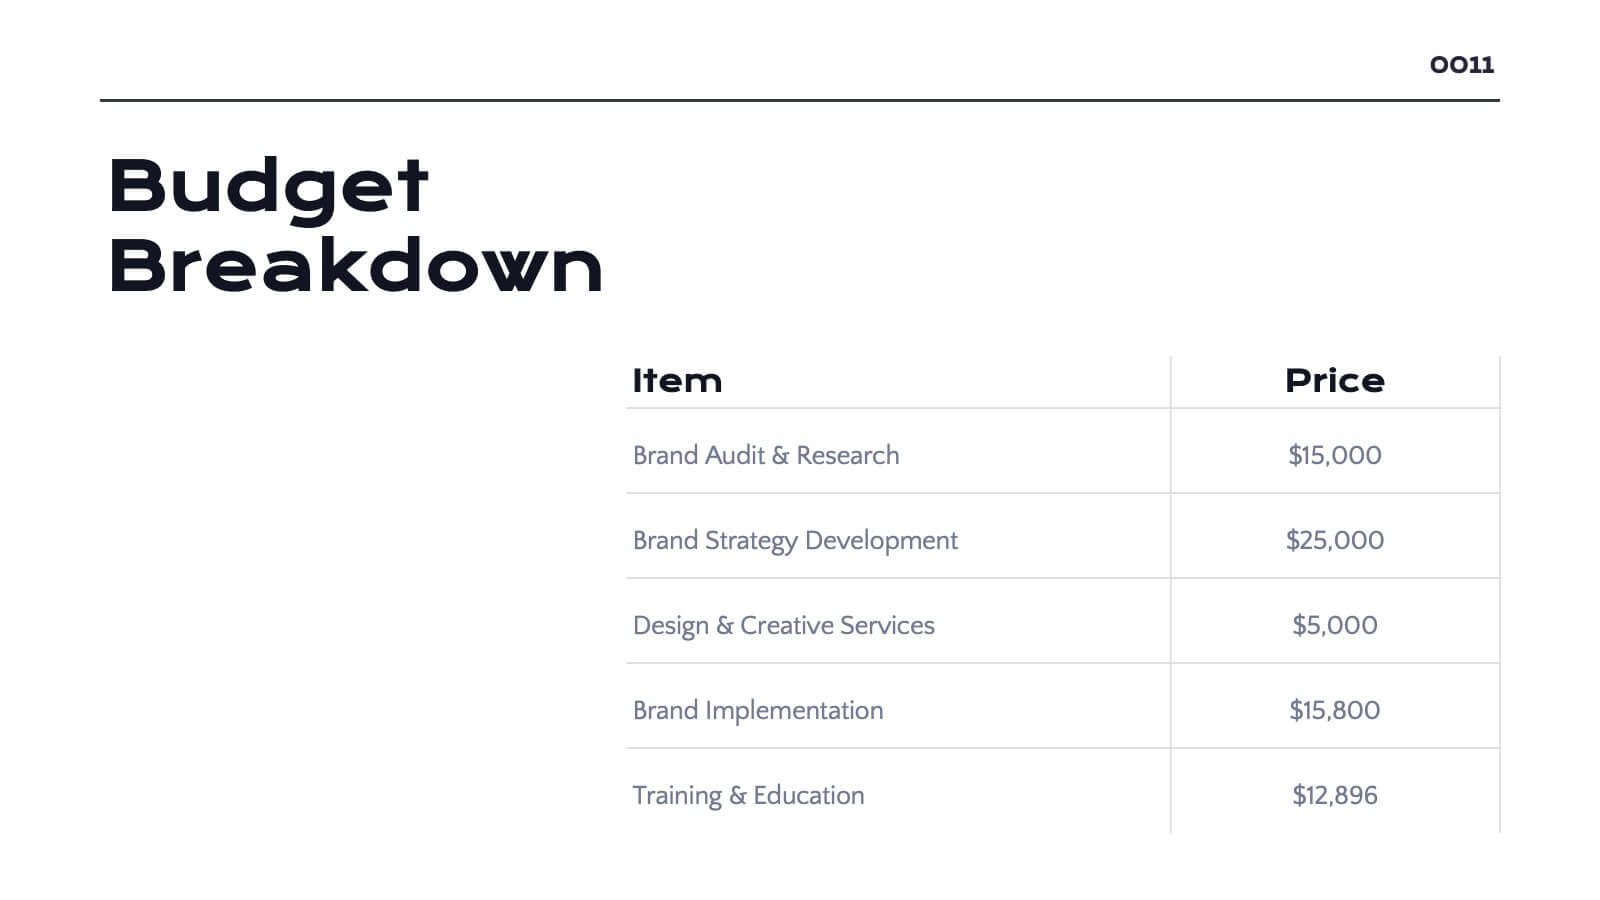
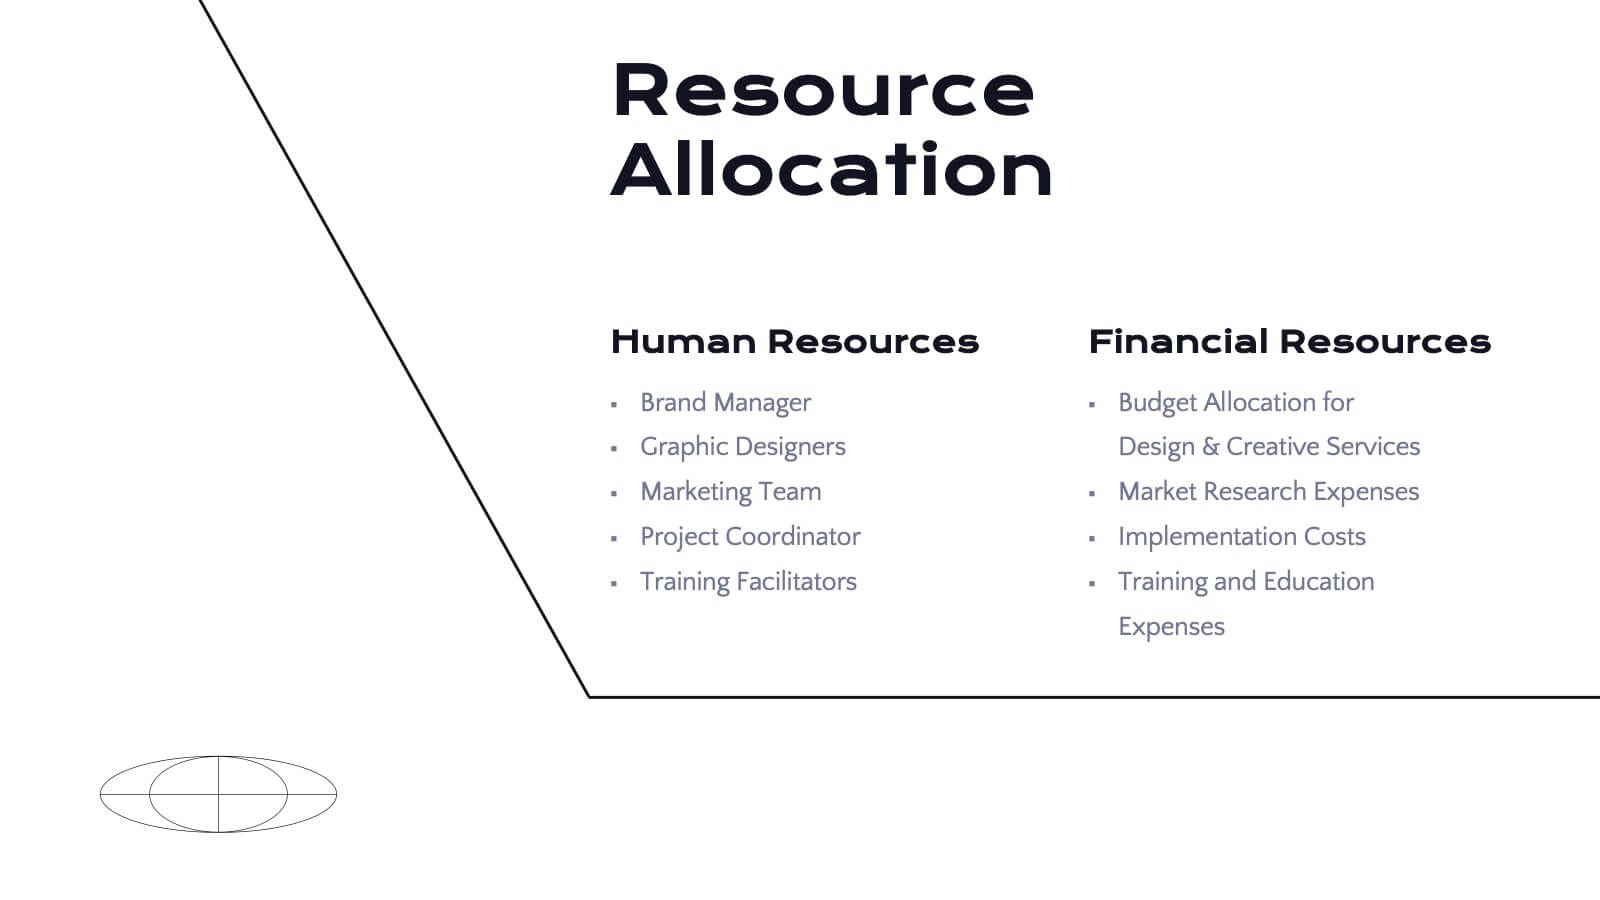
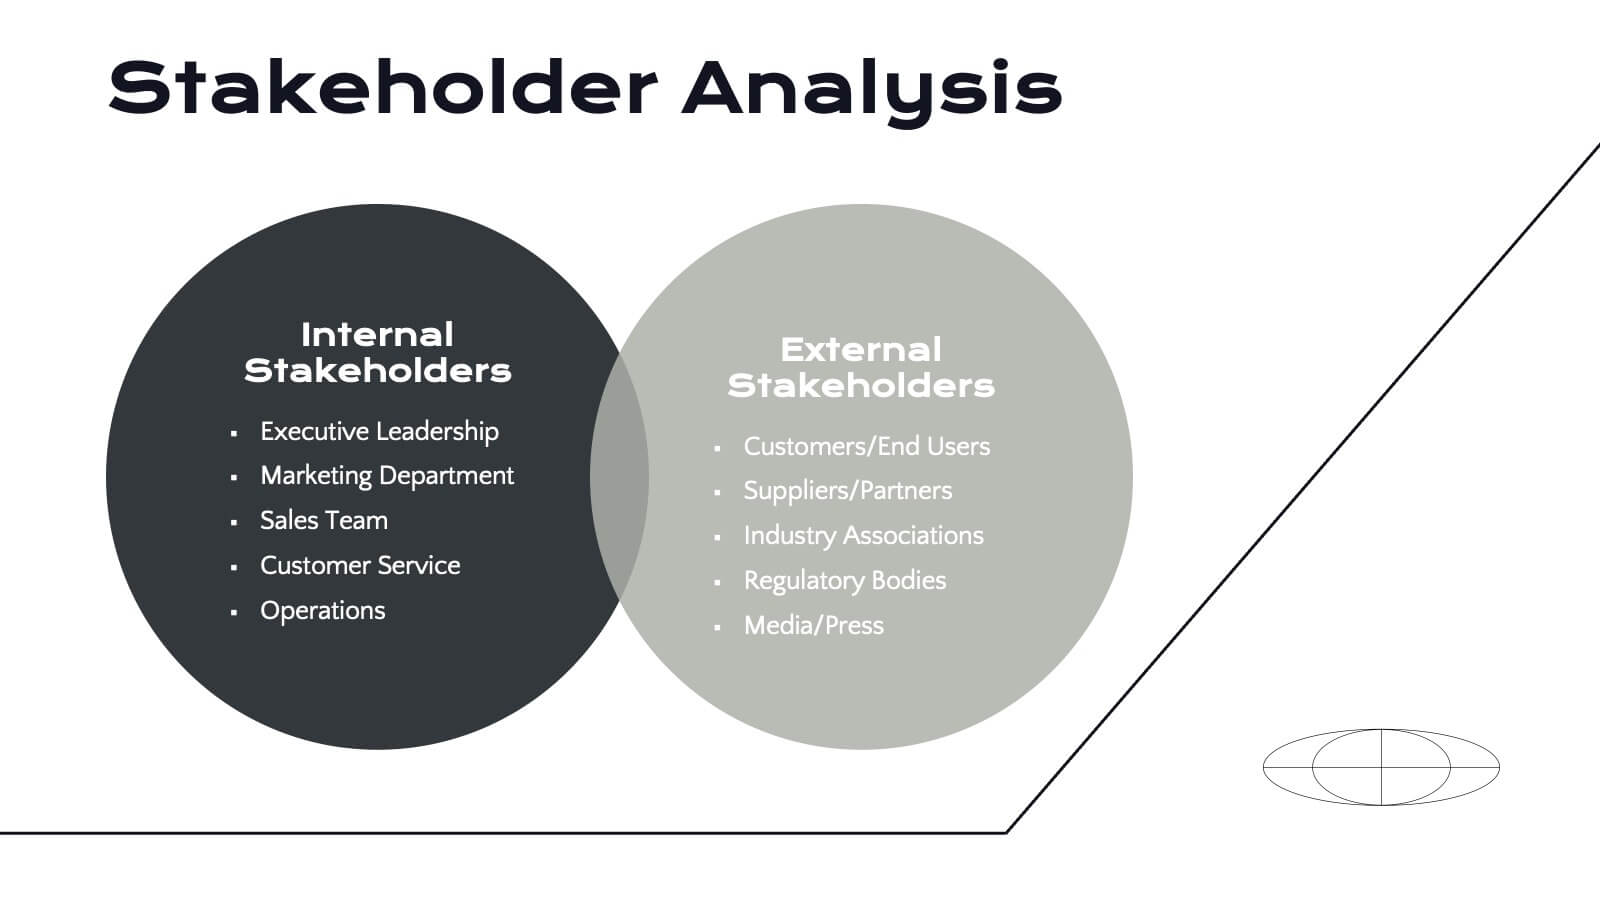
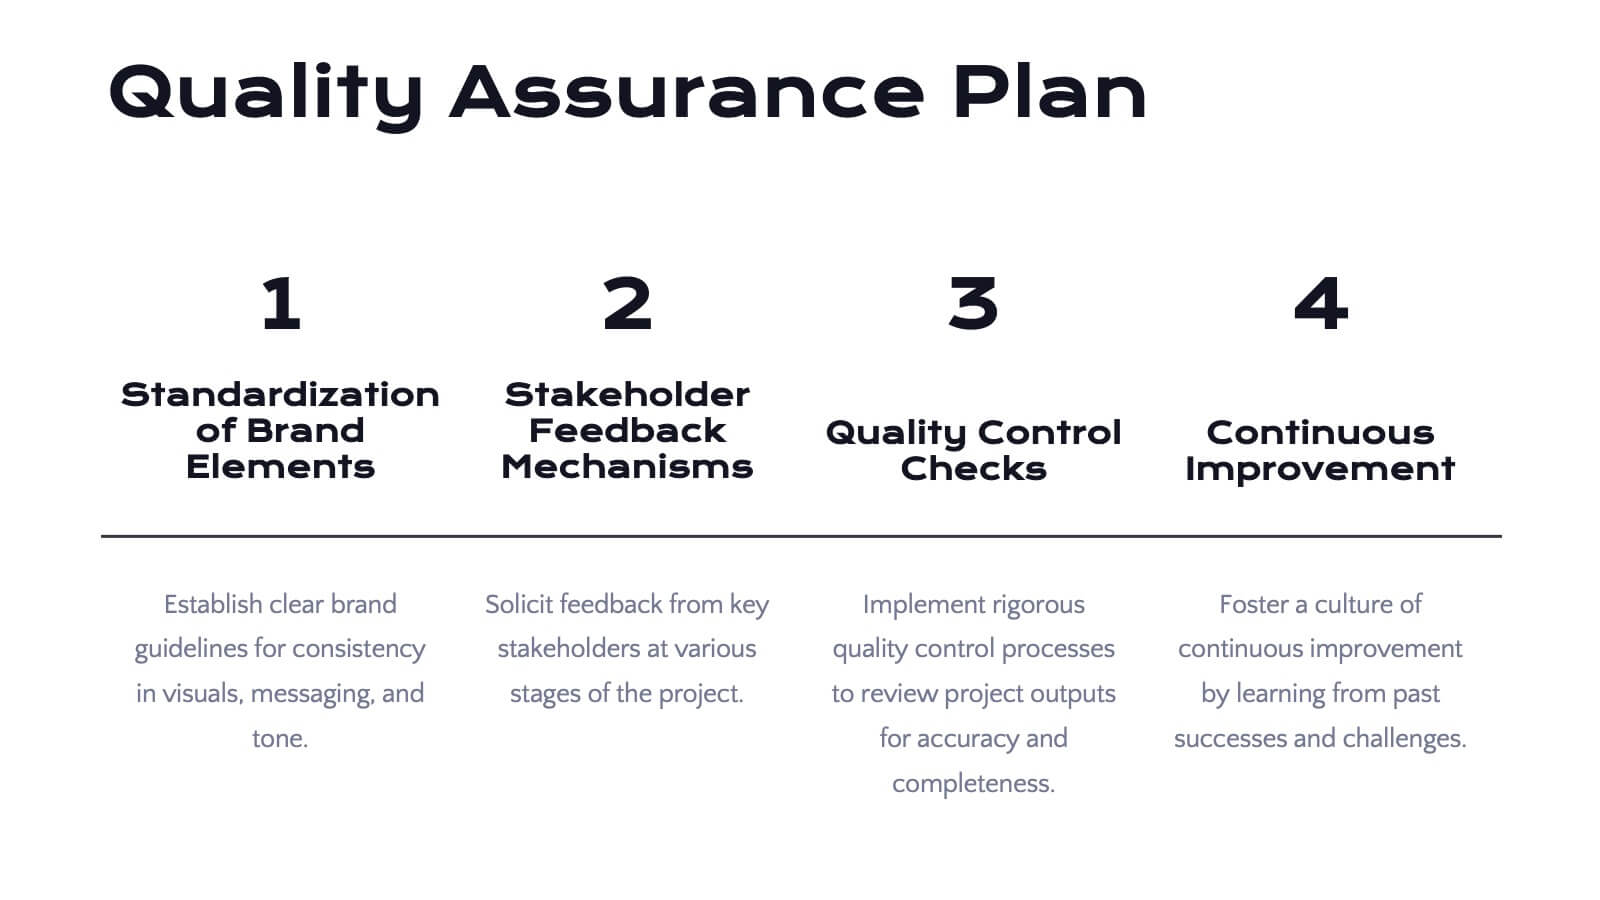
Radiance Detailed Project Execution Plan Presentation
Elevate your project execution presentations with this sleek template, covering everything from objectives to timelines and budget breakdowns. It's perfect for aligning your team and stakeholders. Compatible with PowerPoint, Keynote, and Google Slides, it ensures professionalism and clarity in showcasing your project plans.


26 diapositivas
Minimalist Architecture Company Profile Presentation
Introducing our Minimalist Architecture Company Profile template, the ideal choice for your architecture firm's presentation needs. This template exudes professionalism and modernity. It's the perfect canvas to showcase your architectural expertise and design process. Compatible with Powerpoint, Keynote, and Google Slides. Whether your firm specializes in residential, commercial, or industrial architecture, this template will help you convey your professionalism and design expertise. Elevate your architectural company to new heights with this sleek template.


6 diapositivas
Scalable Data Systems and Analytics Presentation
Break down your cloud data architecture with clarity and flow using this visual diagram template. It helps illustrate how your scalable data systems interact—from ingestion to processing and analytics. Perfect for IT teams and tech presentations. Easily editable and compatible with PowerPoint, Keynote, and Google Slides.


5 diapositivas
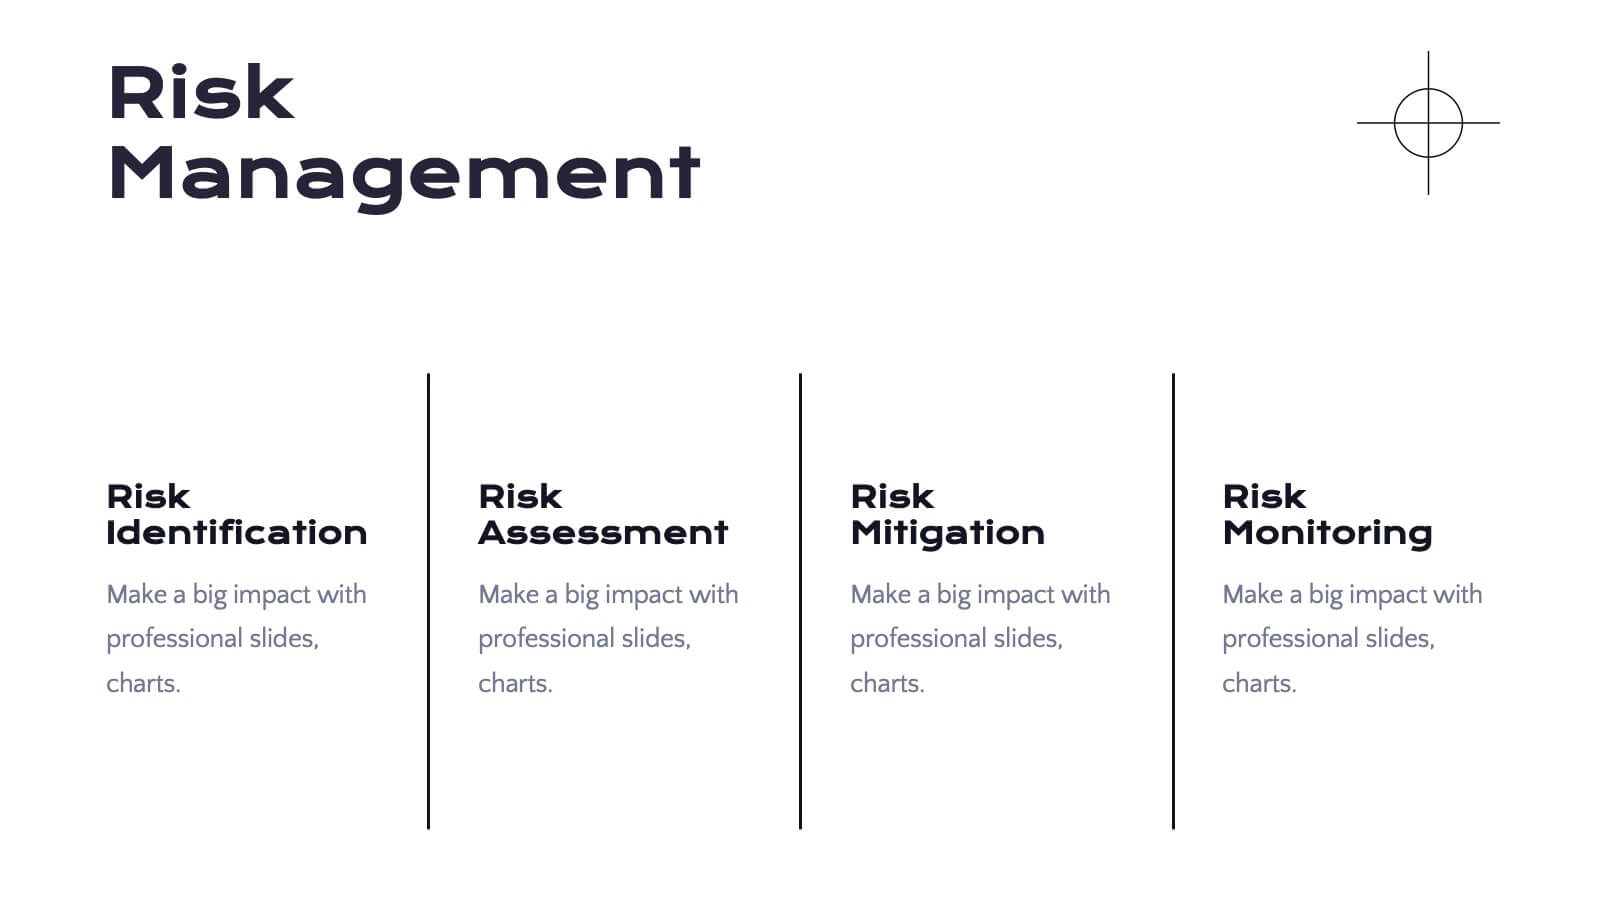
Corporate Risk Assessment Slide Presentation
Streamline complex evaluations with a clean, step-by-step visual that guides your audience through key business risks and mitigation strategies. Ideal for planning sessions or executive reports, this modern design helps simplify communication and enhance decision-making. Fully compatible with PowerPoint, Keynote, and Google Slides for seamless editing and presentation.


4 diapositivas
Left and Right Brain Diagram Presentation
Unlock the perfect blend of logic and creativity with a visual layout that highlights how analytical thinking and imaginative ideas work together. This presentation makes it easy to compare concepts, explain processes, and illustrate dual perspectives with clarity and color. Fully compatible with PowerPoint, Keynote, and Google Slides.


21 diapositivas
Somnara Full-Service Agency Project Plan Presentation
Present your agency’s expertise with a comprehensive project plan template designed to impress clients and stakeholders. This sleek and professional layout allows you to outline your mission and vision, highlight team strengths, and showcase core services with clarity. Use the client testimonials and case studies sections to establish credibility and trust. Visualize your strategic approach with dedicated slides for market analysis, creative process, and execution strategy. The template also includes detailed sections for partnership opportunities, social responsibility initiatives, and a future outlook, ensuring a holistic view of your agency’s capabilities and forward-thinking approach. Fully editable and compatible with PowerPoint, Google Slides, and Keynote, this template is perfect for full-service agencies seeking to elevate their presentations. Customize each slide to reflect your unique value and deliver impactful, results-oriented proposals.


4 diapositivas
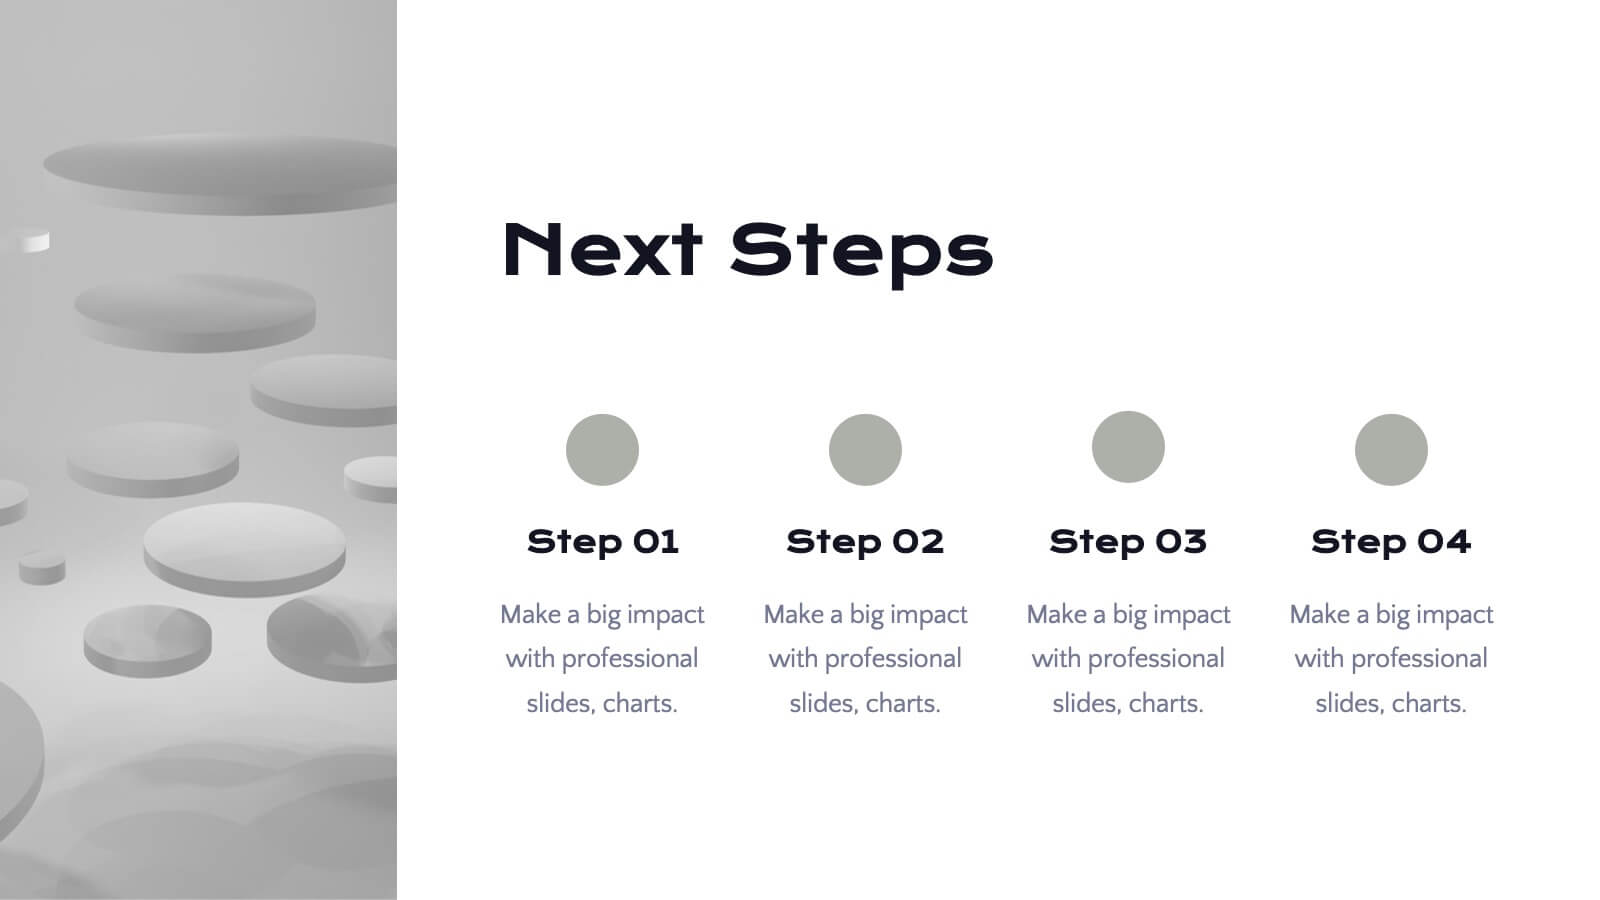
Step-by-Step Process Flowchart Presentation
Simplify complex workflows with this Step-by-Step Process Flowchart presentation. Designed for clarity and structure, this layout guides your audience through each phase of a process using visual arrows and color-coded stages. Ideal for operations, planning, or training. Fully editable in Canva, PowerPoint, and Google Slides.


26 diapositivas
Aedele Presentation Template
We all know how important food is, it's the center of life. We plan our days around food, we travel to eat food and our emotions are often tied up in food. This template was designed for people who love food and know how important it is to stand out from the crowd when it comes to the culinary world. Whether you're an investor, a food critique, a restaurant owner or simply a foodie we have all the classy modern slides you need to really make an impact on your audience and make sure your message doesn't get lost amongst all the other exciting talks and presentations at your next pitch meeting.


4 diapositivas
Feature Comparison Using Harvey Balls Presentation
Easily visualize performance levels with the Feature Comparison Using Harvey Balls Presentation. This slide is perfect for showing side-by-side comparisons across multiple categories, using universally understood Harvey Ball icons to represent completeness or satisfaction. Ideal for product evaluations, vendor selections, or strategic reviews. Fully editable in PowerPoint, Keynote, and Google Slides.


8 diapositivas
Puzzle Piece Strategy Connection Presentation
Align your ideas with clarity using the Puzzle Piece Strategy Connection Presentation. This vertical puzzle layout visually connects four key steps, making it perfect for illustrating strategy alignment, workflow processes, or integrated systems. Easily editable in PowerPoint, Canva, or Google Slides—ideal for team briefings or strategic roadmaps.


21 diapositivas
Dreameon Agency Portfolio Presentation
Showcase your agency's expertise with this sleek and modern portfolio presentation template. Designed to highlight your achievements, creative processes, and client success stories, this template offers a comprehensive layout that communicates professionalism and innovation. From introducing your team and services to detailing case studies and market analysis, each slide is meticulously crafted to leave a lasting impression. Display your strategy development, social media impact, and measurement analytics effectively, ensuring a cohesive narrative that resonates with your audience. Easily customizable and compatible with PowerPoint, Google Slides, and Keynote, this template is perfect for agencies looking to pitch their capabilities, attract new clients, or present project achievements with confidence.


4 diapositivas
Agricultural Market Trends Presentation
Highlight industry insights with this Agricultural Market Trends presentation template, featuring tractor and landscape graphics for a modern, rural-inspired look. Perfect for market reports, crop production analysis, or agribusiness proposals. Fully editable in Canva, PowerPoint, and Google Slides, allowing you to customize icons, text, and colors to match your brand.


6 diapositivas
Root Cause Investigation Framework Presentation
Uncover the "why" behind your challenges with the Root Cause Investigation Framework Presentation. Designed around the classic fishbone (Ishikawa) diagram, this slide helps teams visually identify and organize contributing factors across multiple categories. With editable sections and bold color coding, it’s ideal for quality management, Six Sigma, and process improvement. Compatible with PowerPoint, Keynote, and Google Slides.


4 diapositivas
AI Trends and Use Cases Presentation
Step into the future with a clean, modern layout that makes complex technology easy to grasp and exciting to explore. This presentation helps you break down emerging innovations, real-world applications, and industry opportunities using clear visuals and structured sections. Fully customizable and compatible with PowerPoint, Keynote, and Google Slides.
8 diapositivas
3-Step Arrow Process Flow Presentation
Kickstart your message with a bold, directional visual that makes every step feel clear and intentional. This presentation showcases a simple three-stage progression ideal for explaining workflows, strategies, or business processes with clarity and impact. Easy to customize and fully compatible with PowerPoint, Keynote, and Google Slides.


6 diapositivas
Company Expansion Timeline Presentation
Show your company’s growth story in a way that’s both professional and visually captivating. This presentation template helps you outline milestones, future goals, and expansion phases with clarity and style. Fully customizable and compatible with PowerPoint, Keynote, and Google Slides for effortless editing and polished results.