


Características


¿Tienes alguna pregunta?
Recomendar


23 diapositivas
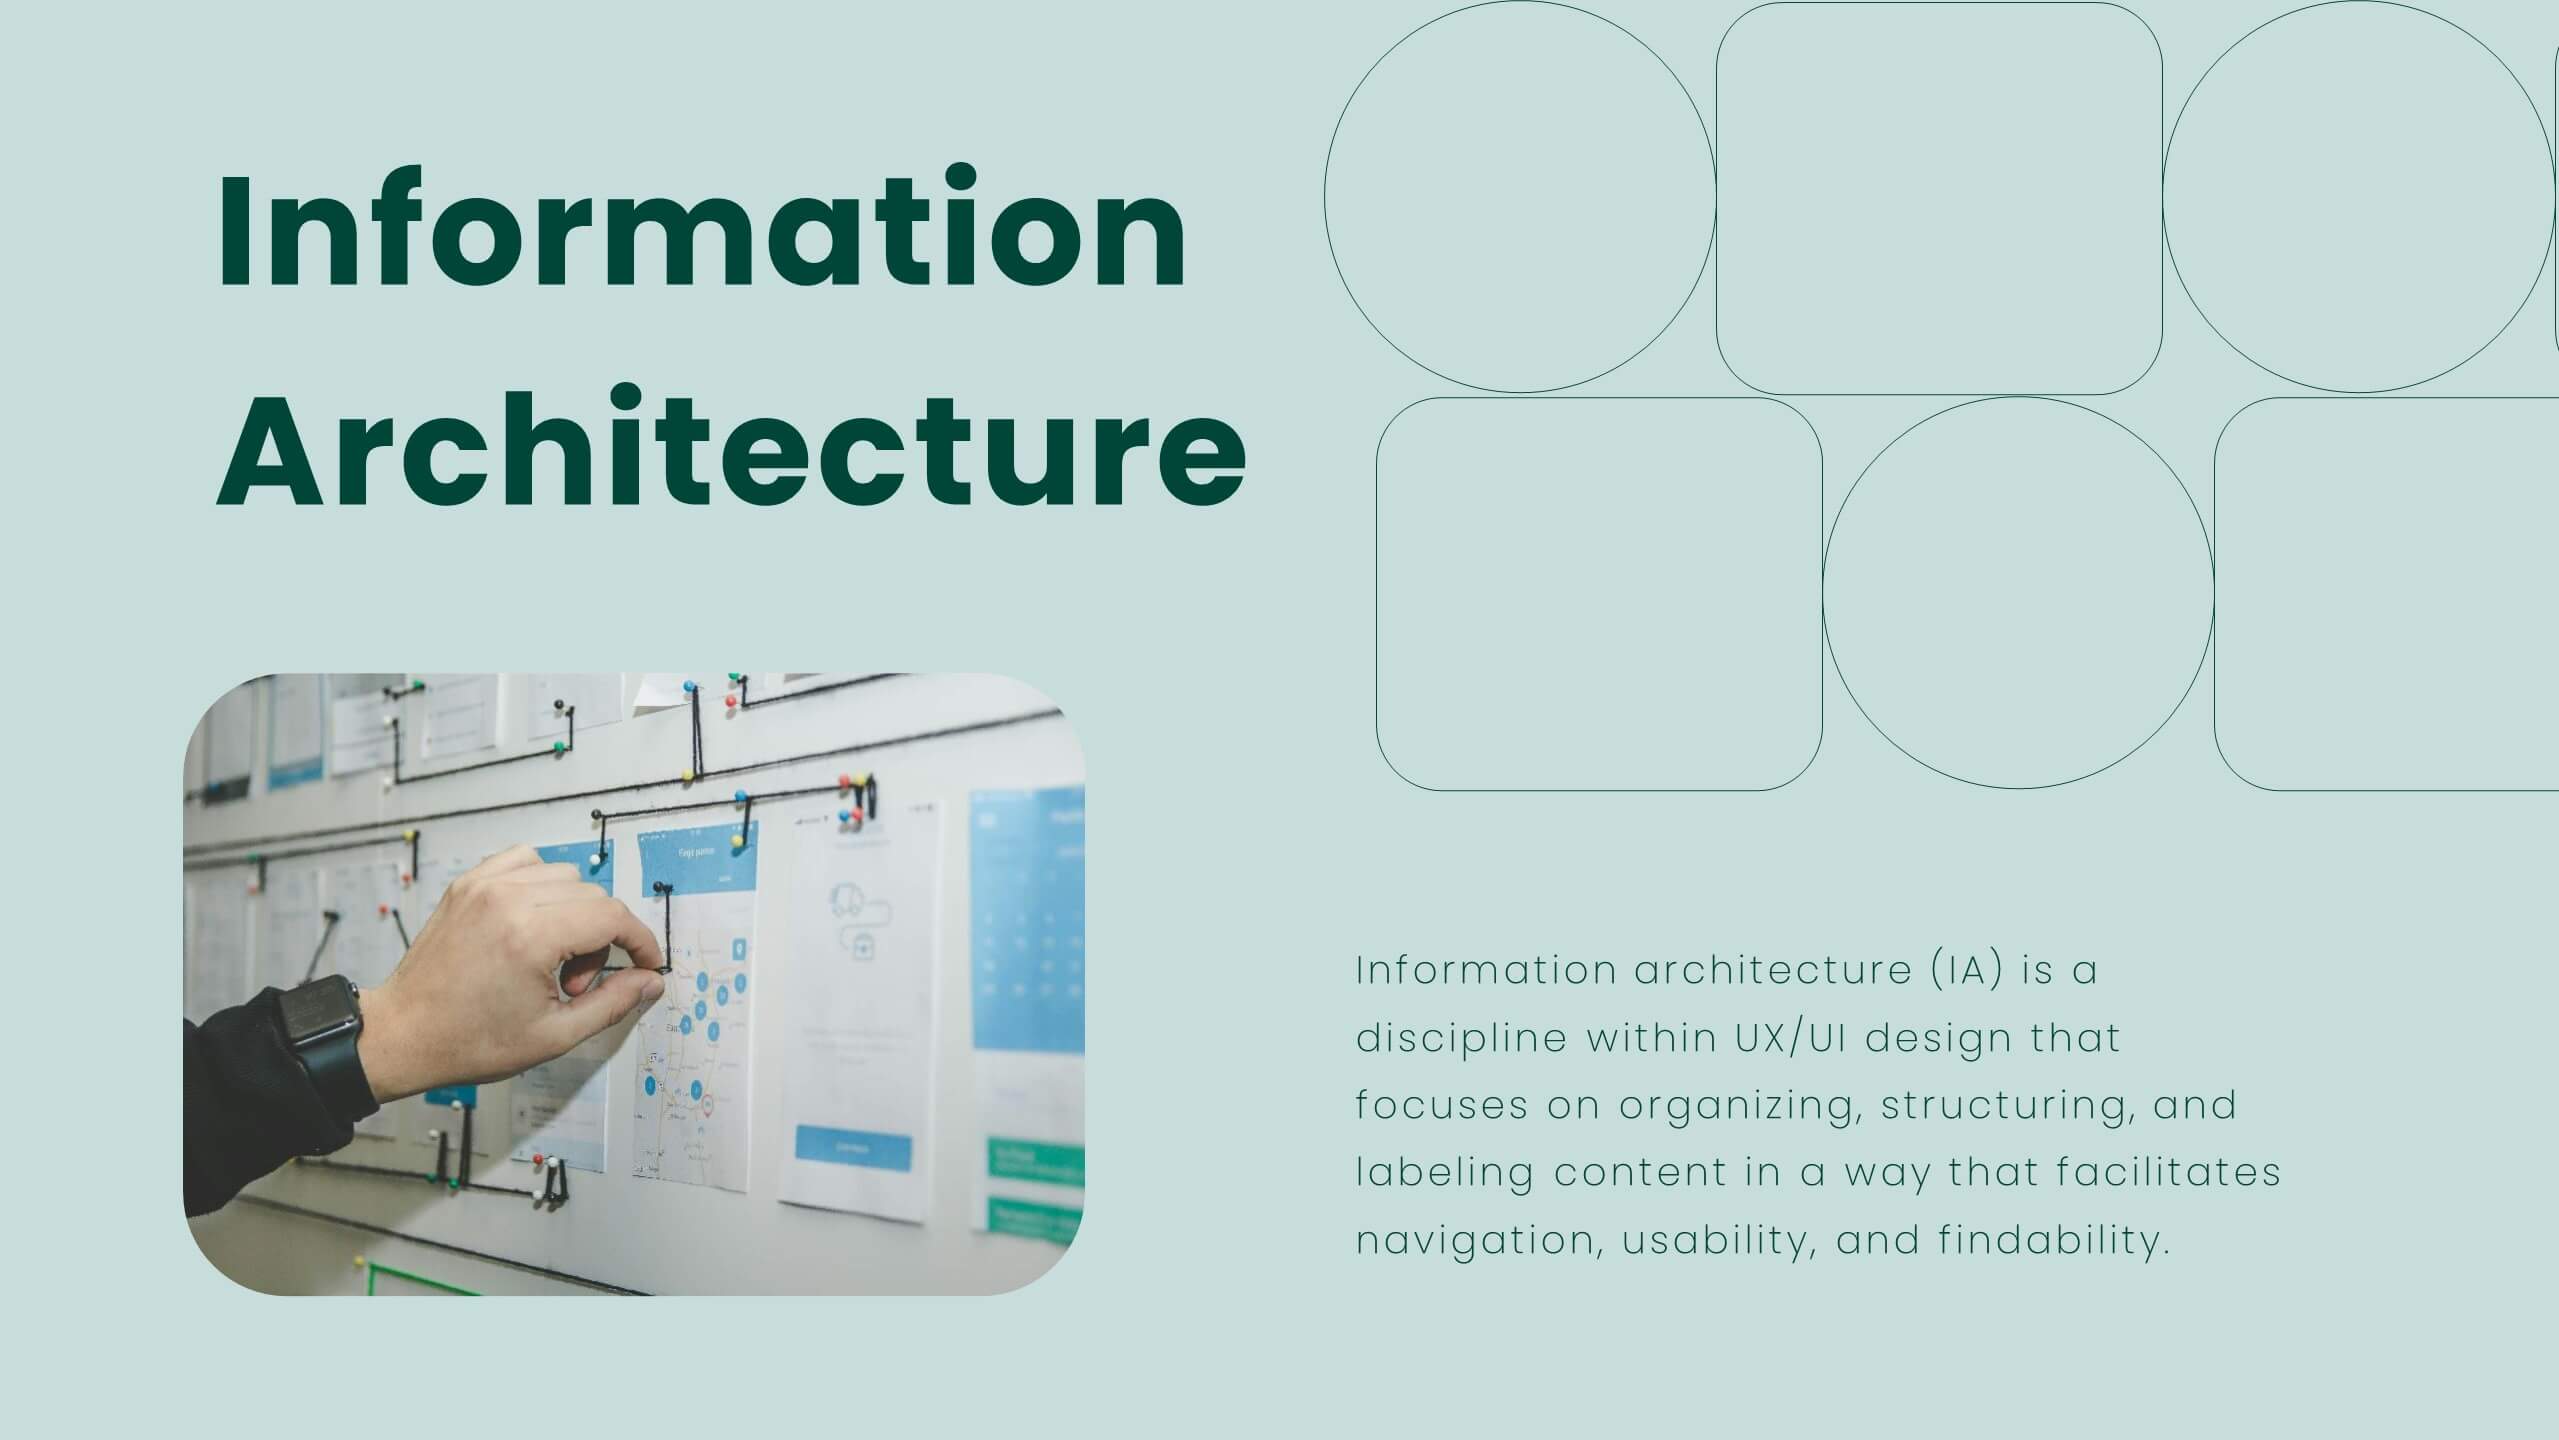
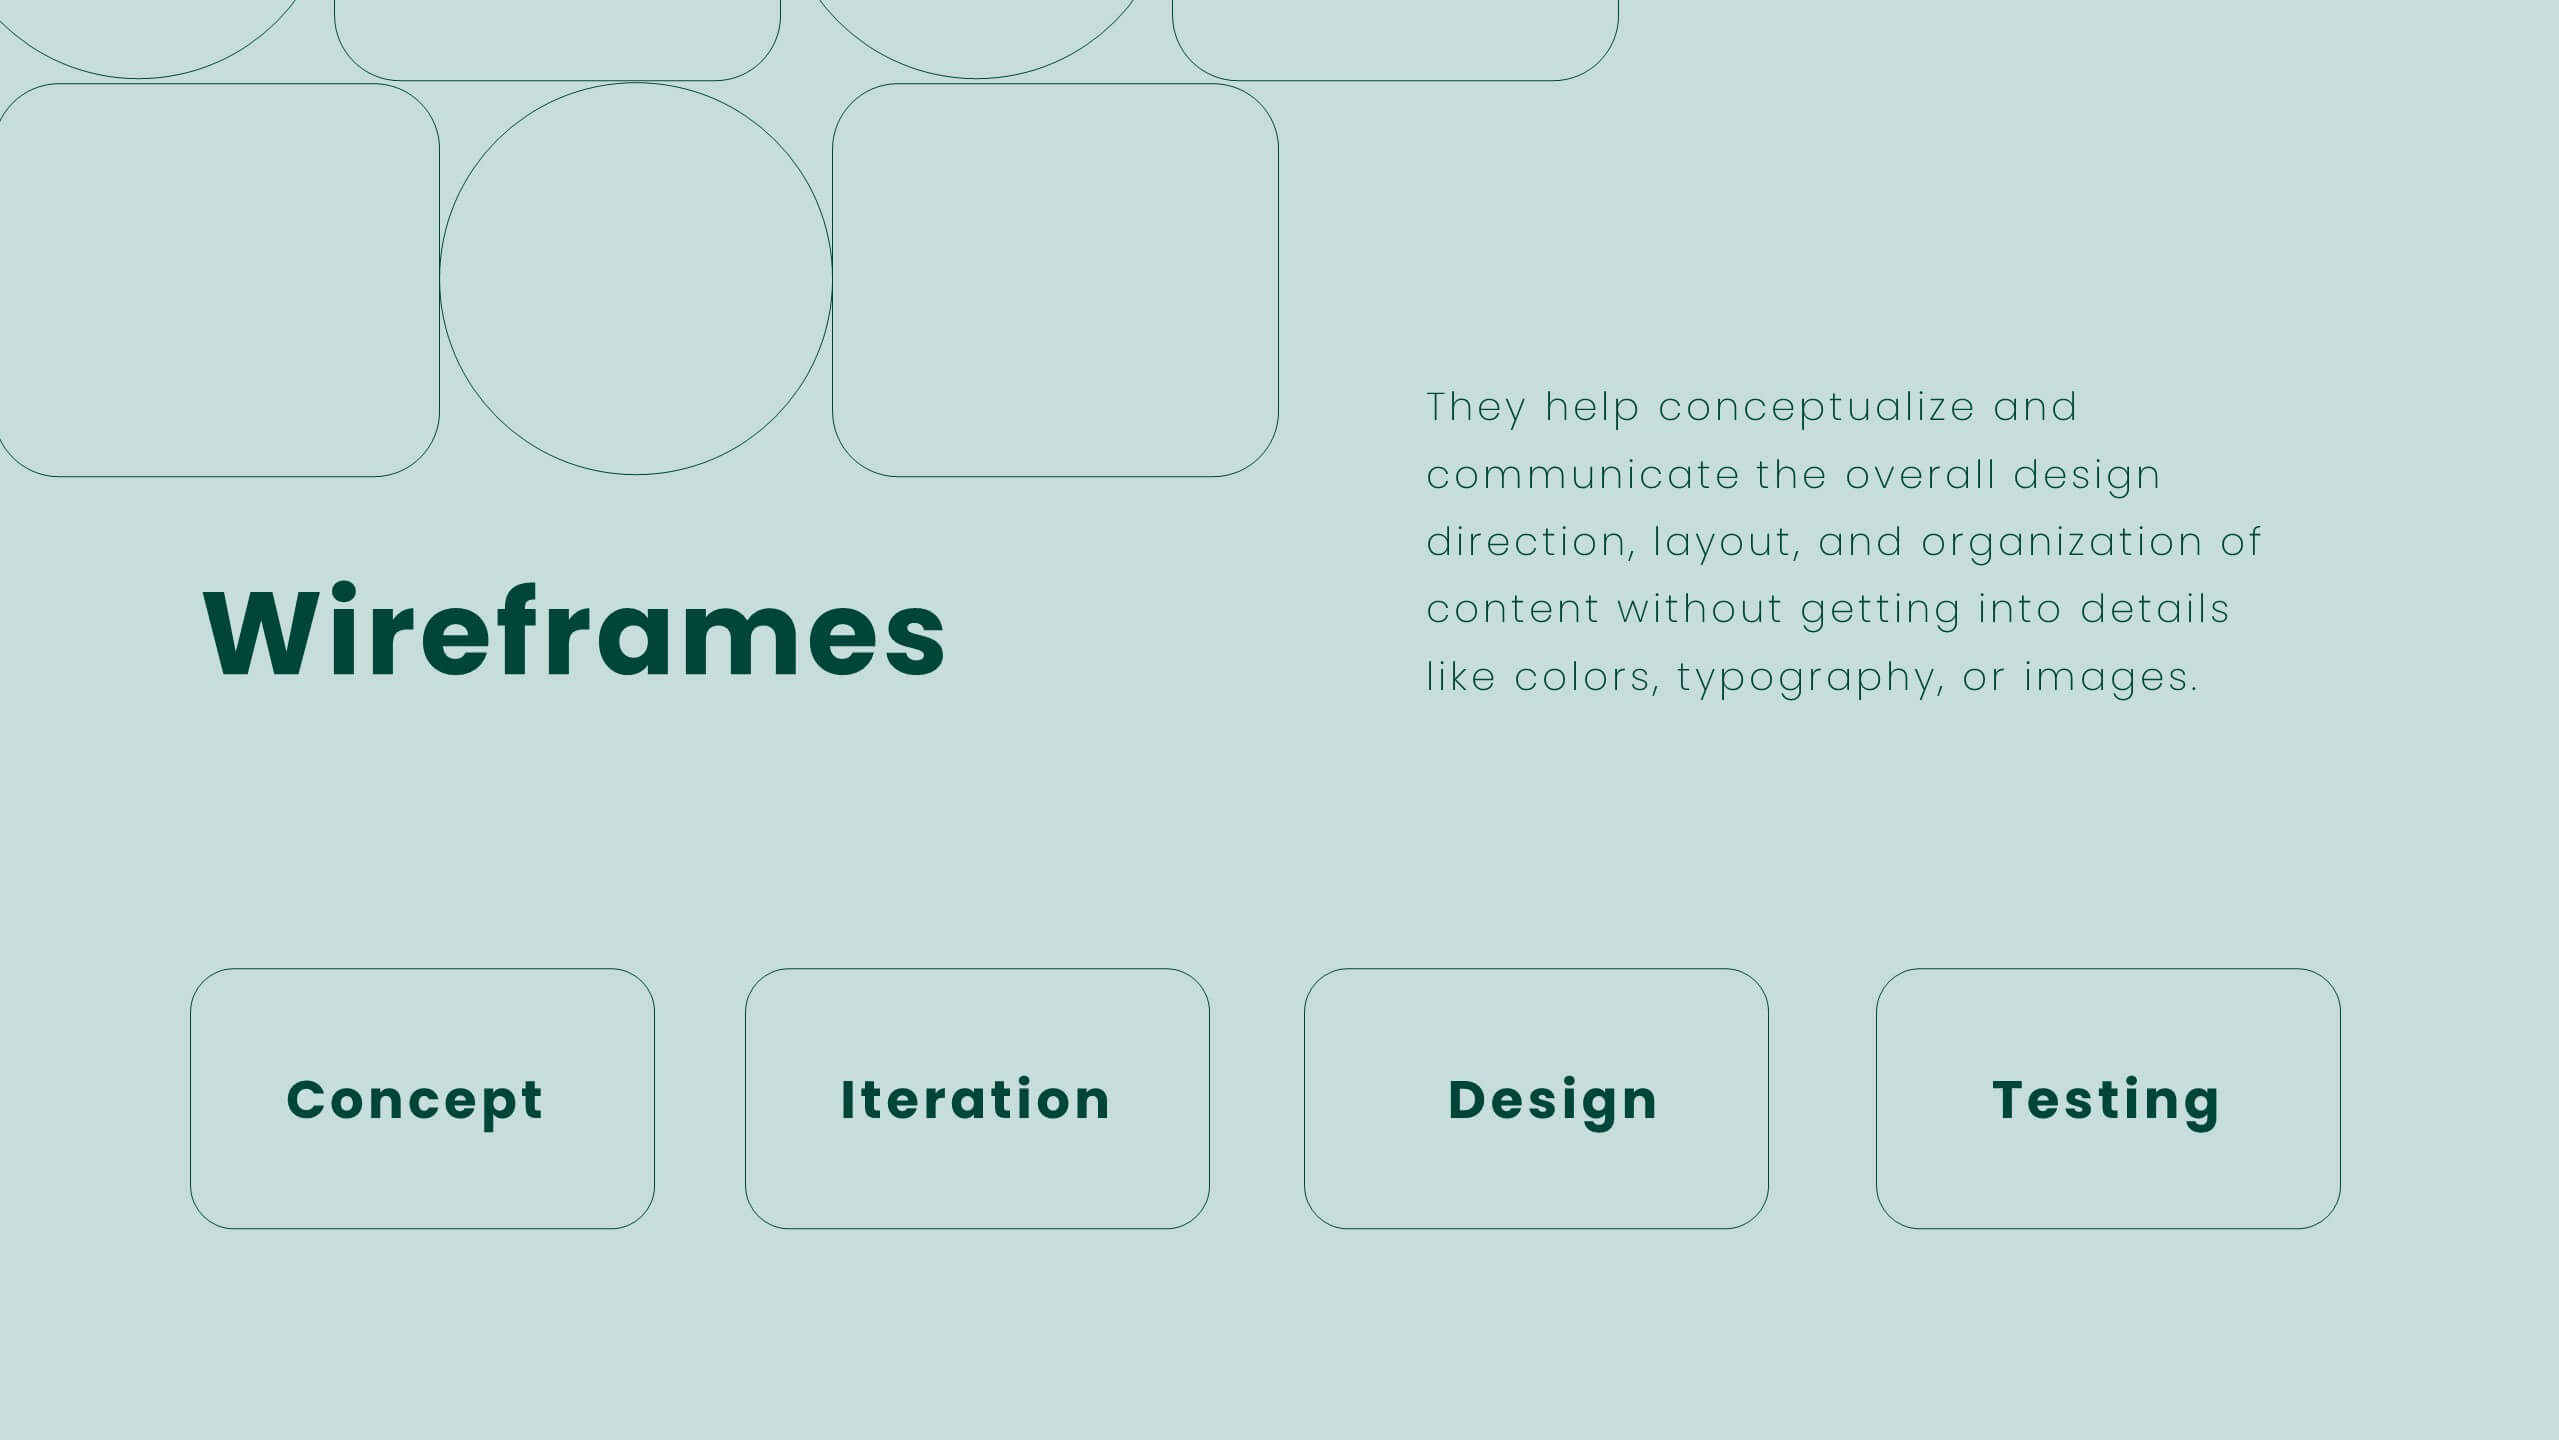
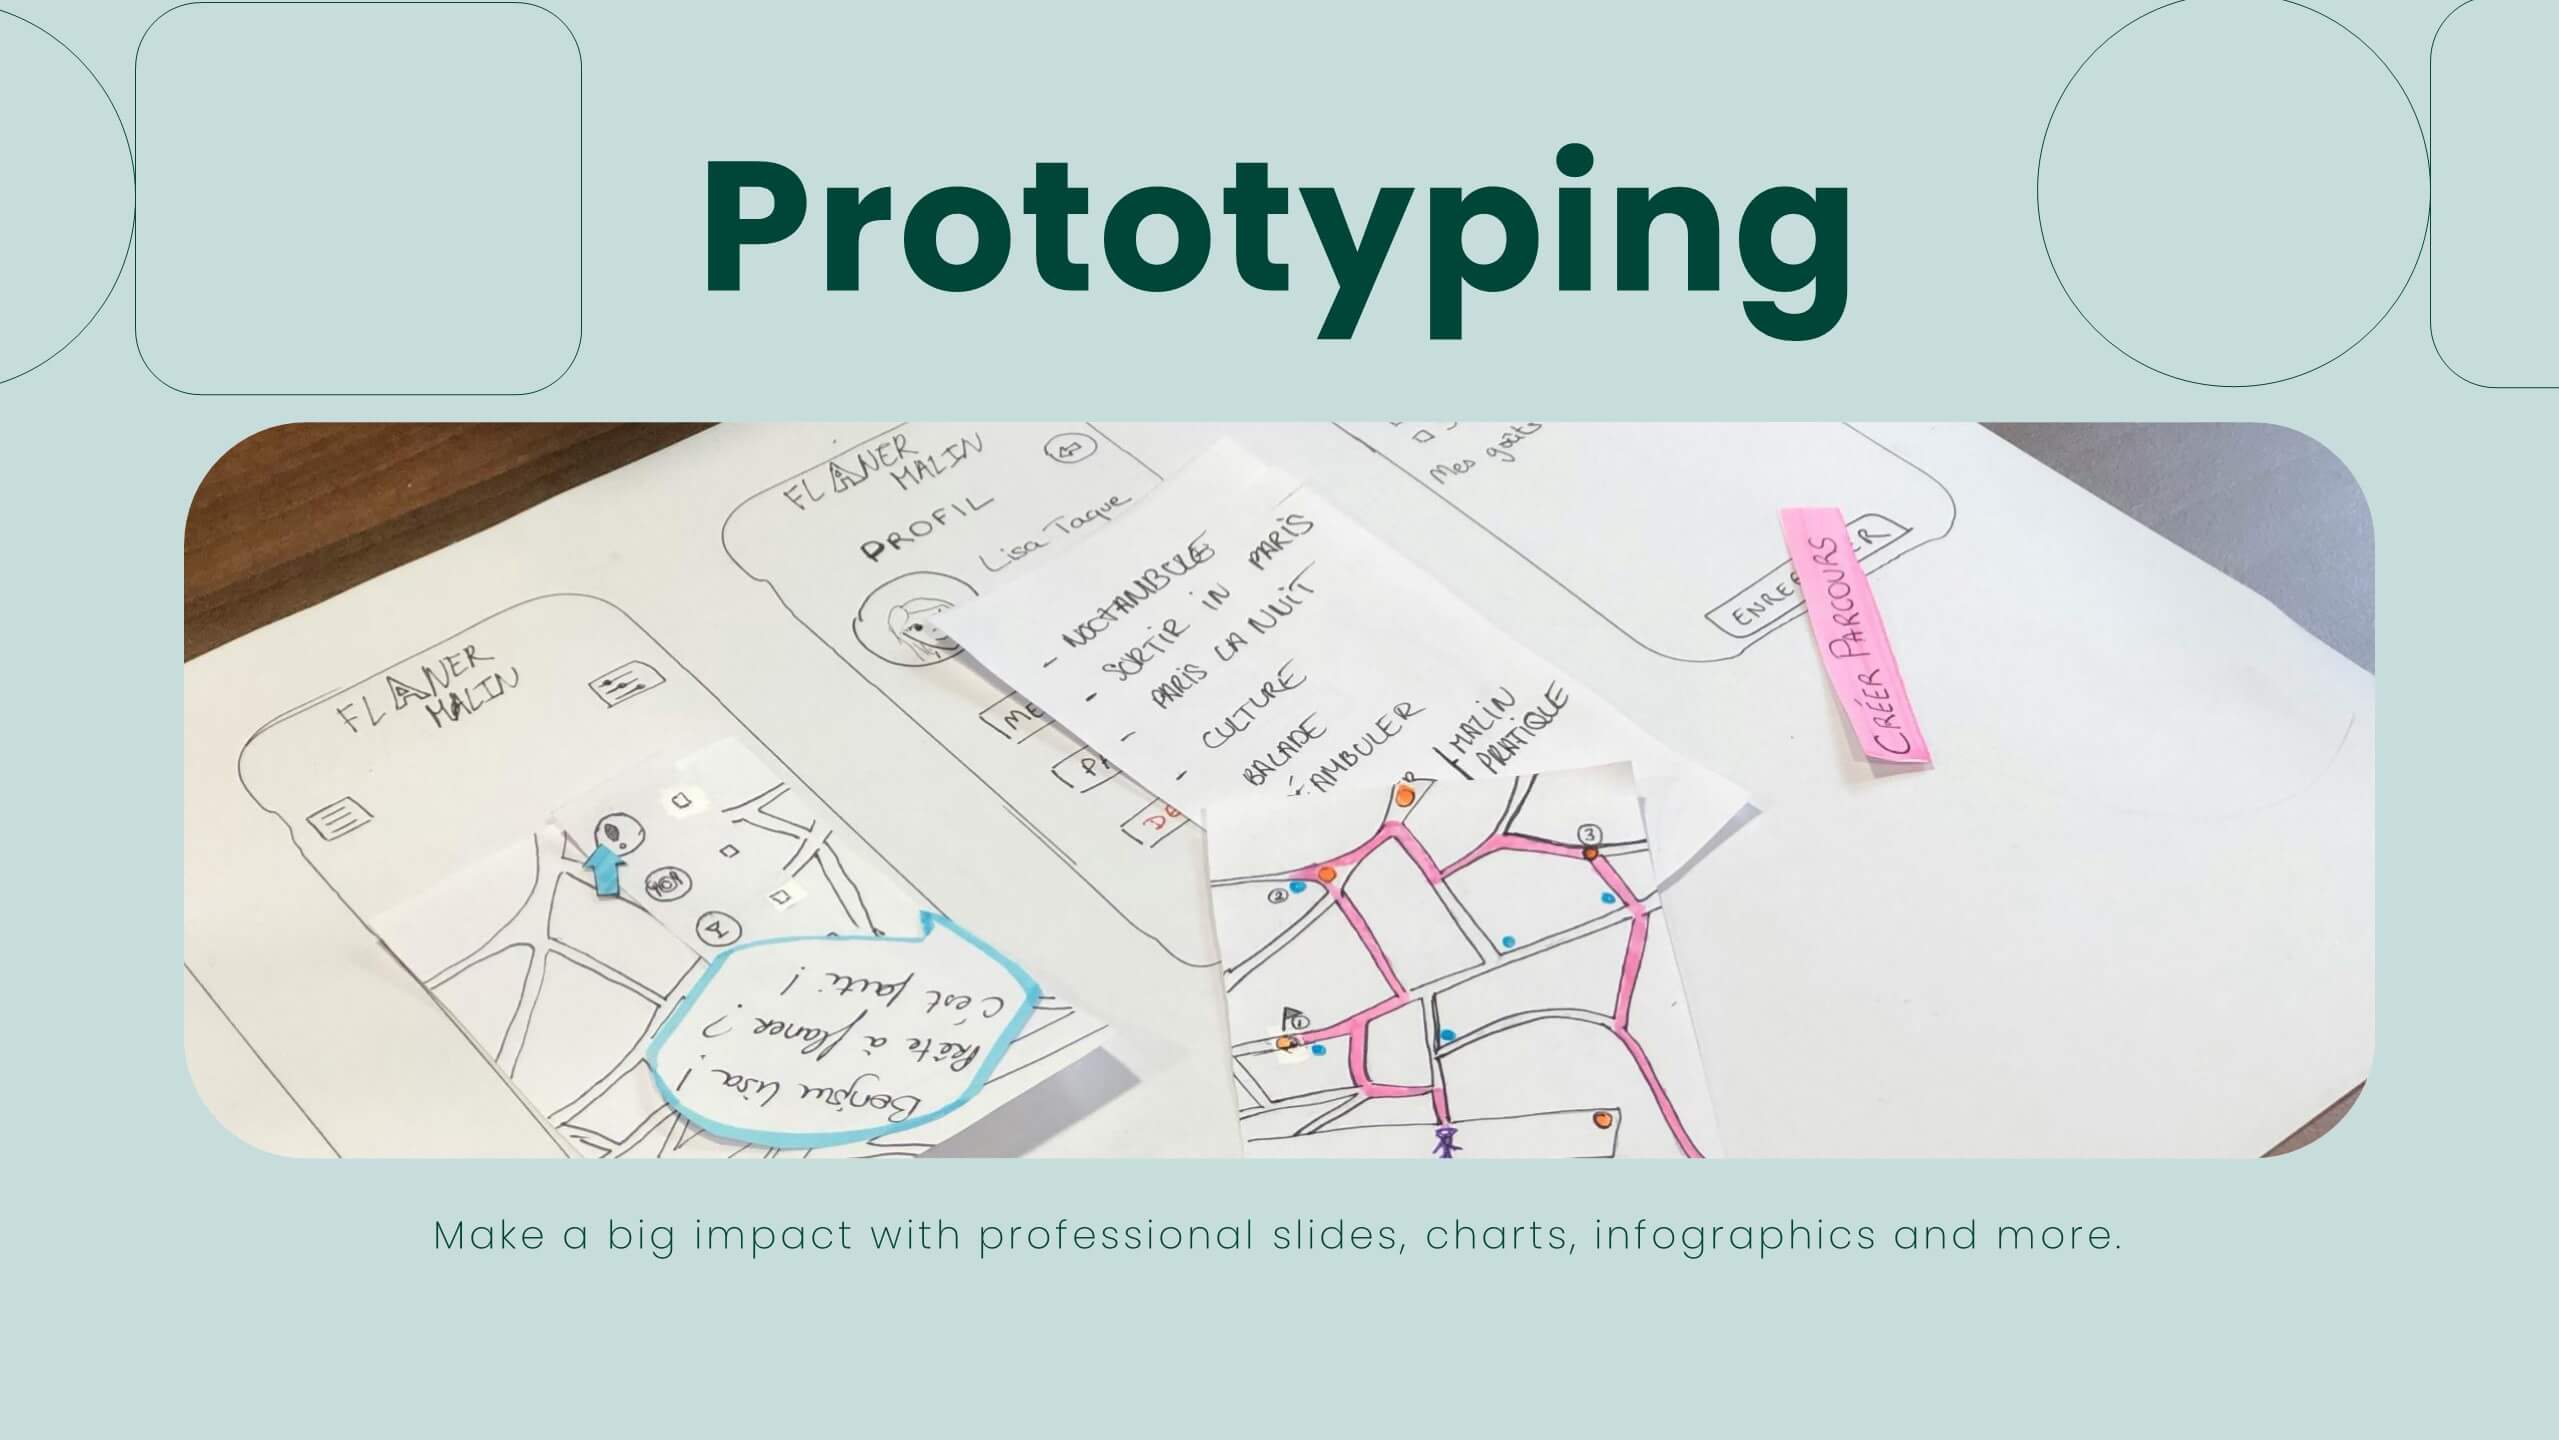
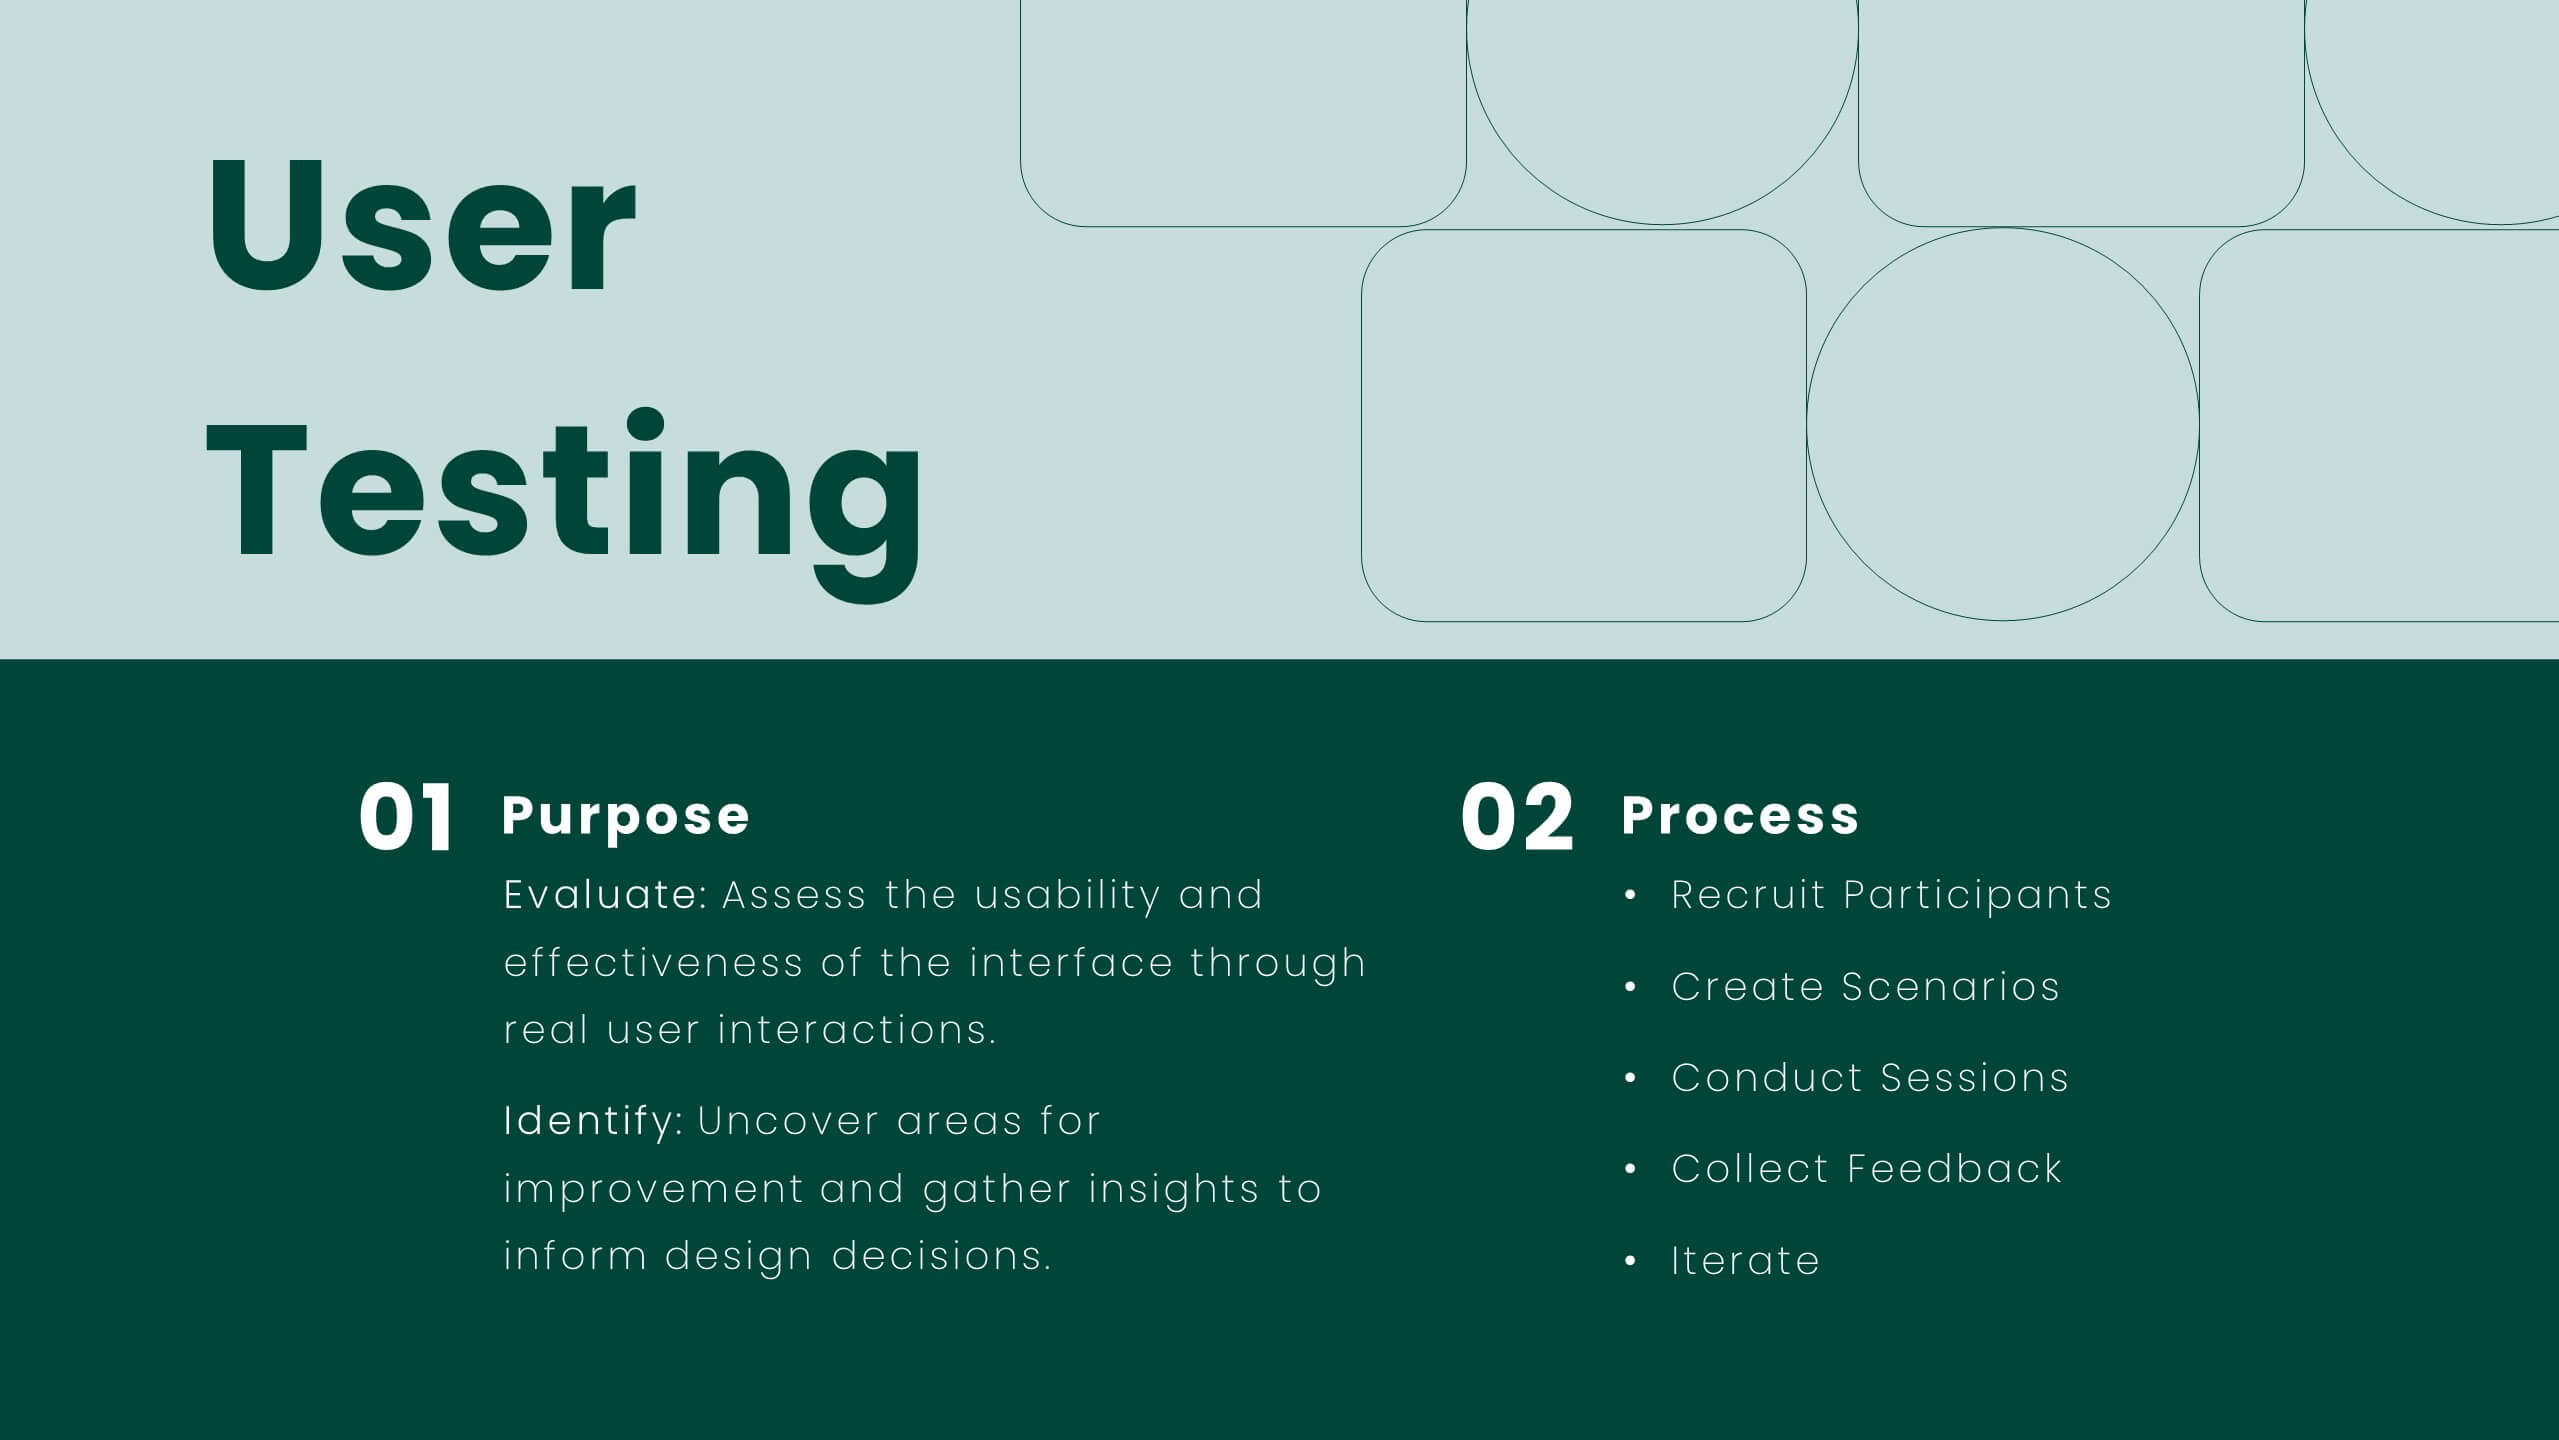
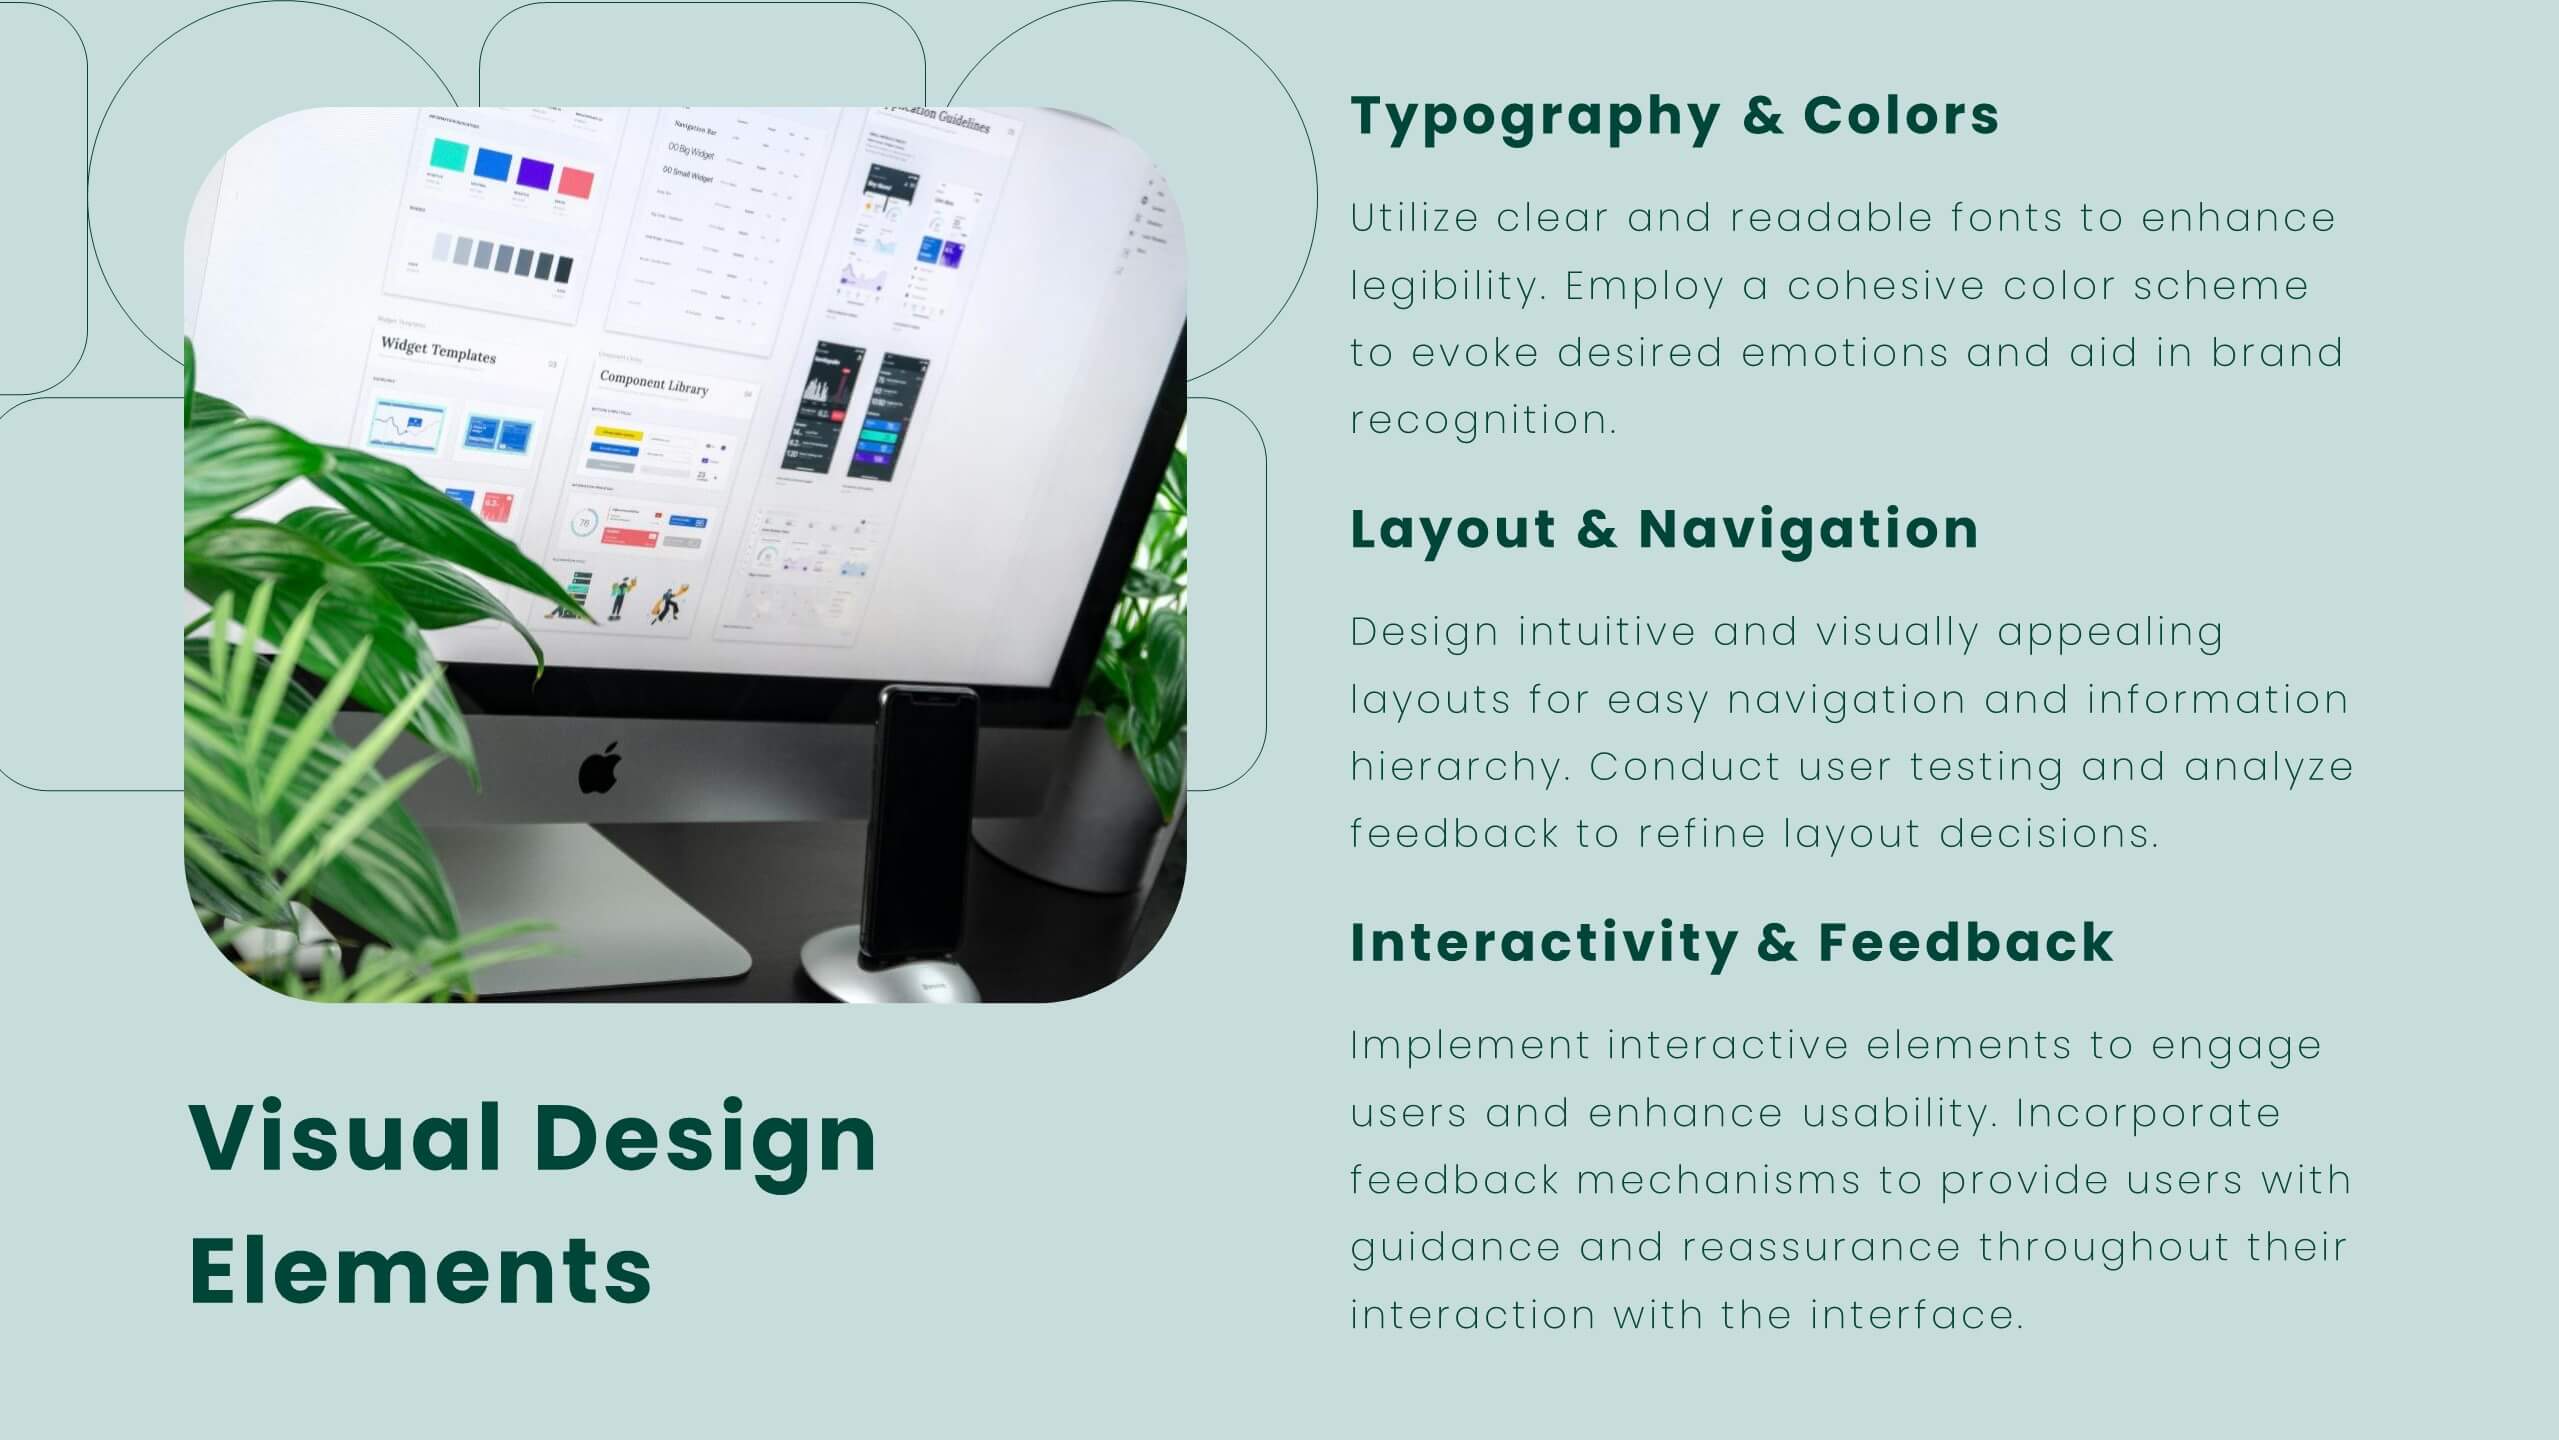
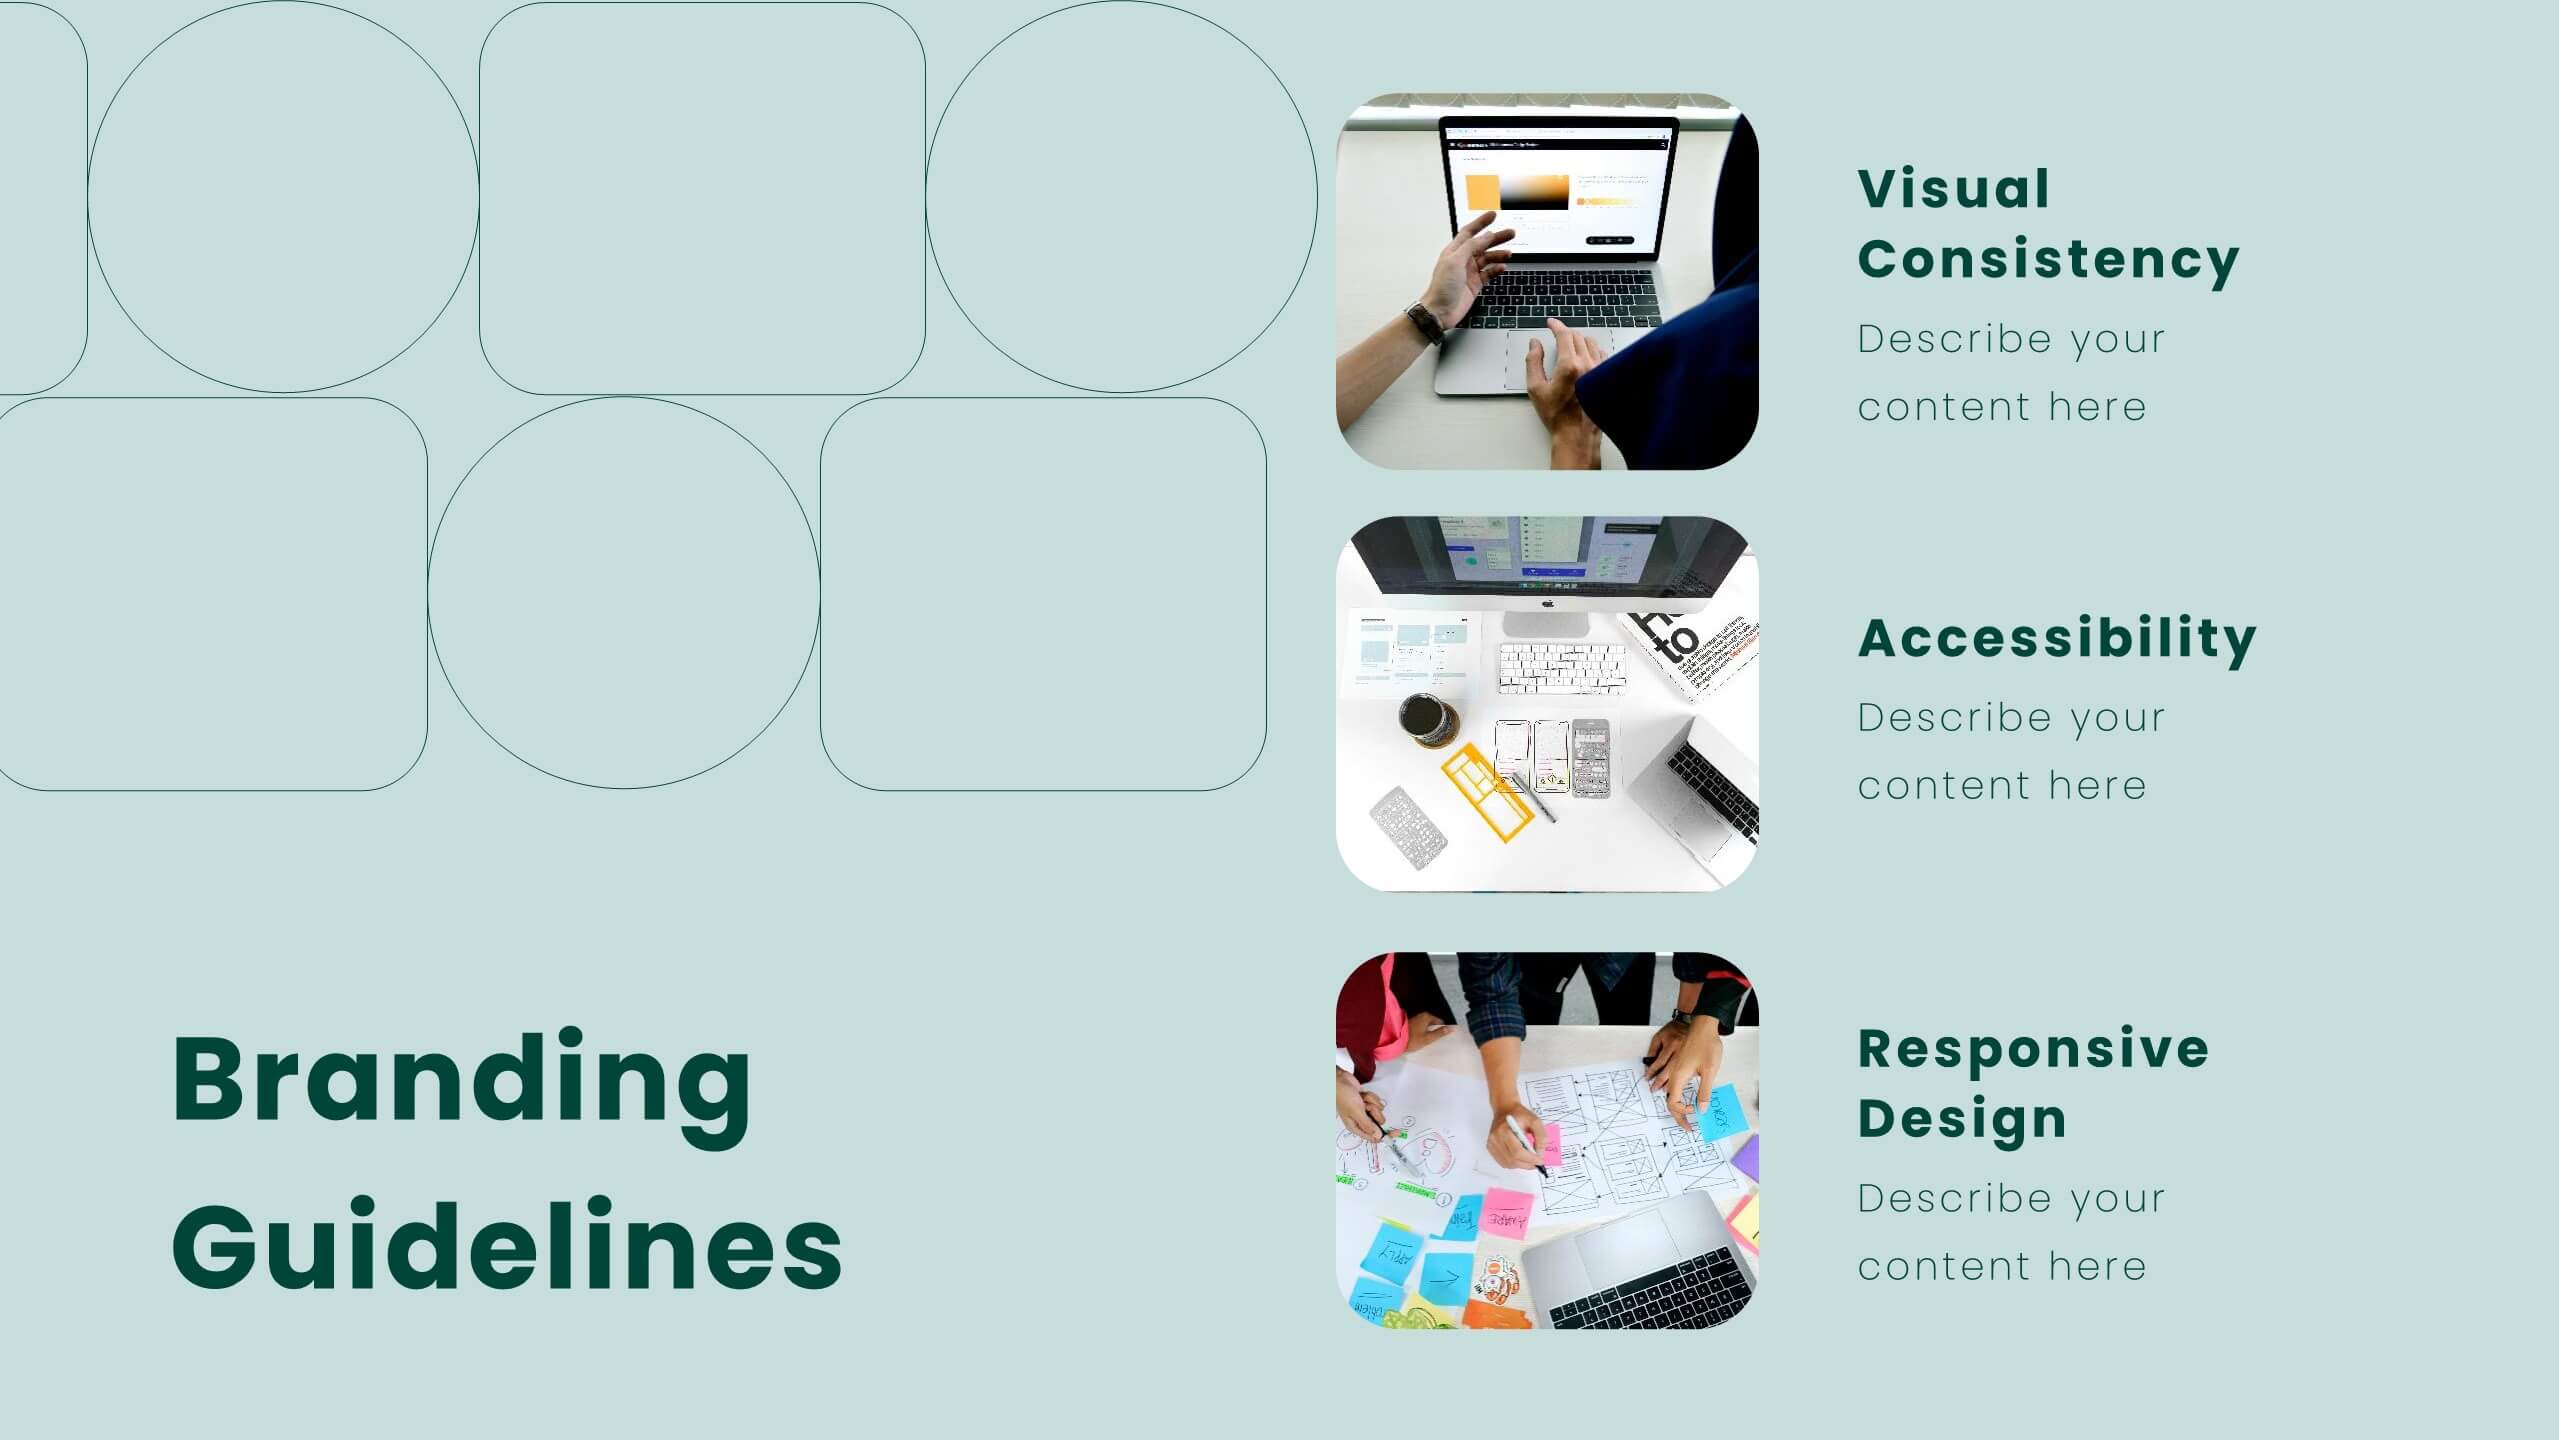
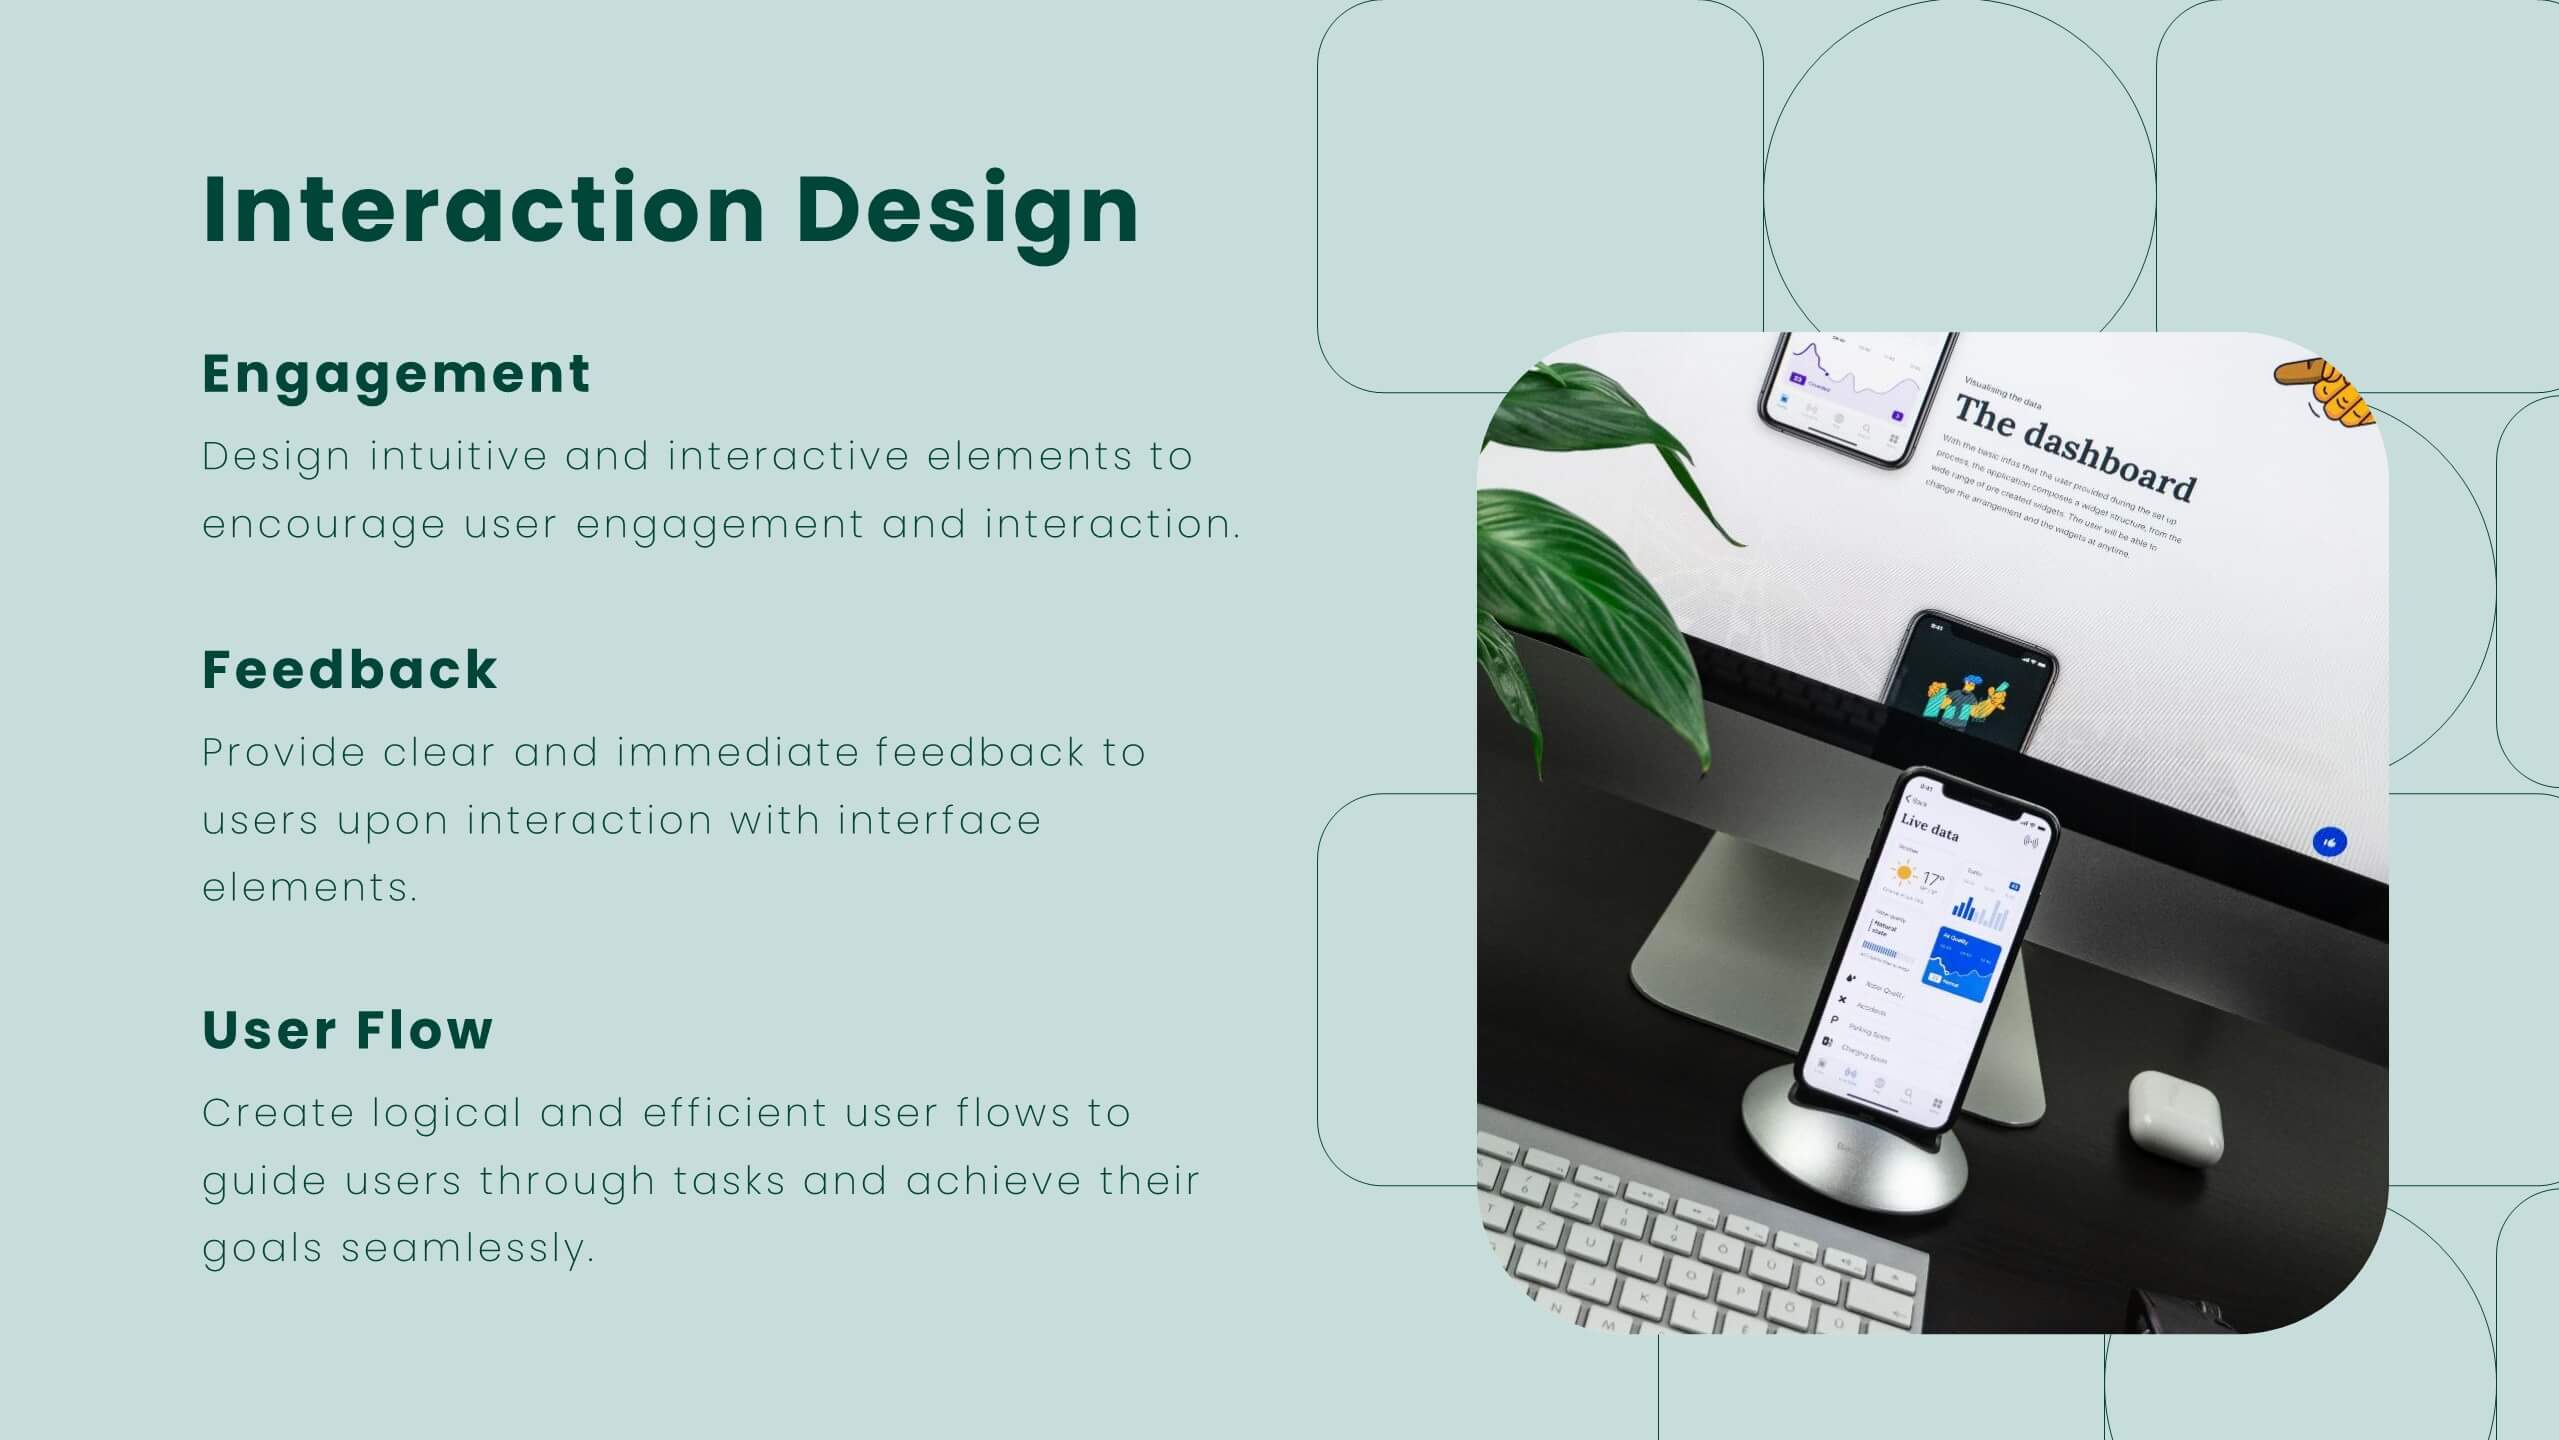
Lumina UX Case Study Presentation
Create compelling UX case studies with this modern template. Cover user research, personas, wireframes, and prototyping. Perfect for showcasing UI design principles, responsive design, and usability guidelines. Highlight feedback, iteration, and project showcase. Compatible with PowerPoint, Keynote, and Google Slides. Elevate your UX presentations and impress stakeholders with clear, detailed insights.


8 diapositivas
Workforce Skills Gap Analysis Presentation
Identify and Bridge Workforce Skill Gaps! This Workforce Skills Gap Analysis template provides a structured approach to assess, compare, and close competency gaps within an organization. Designed with interactive bar chart visuals, it enables HR professionals, managers, and training specialists to track employee skill levels, identify gaps, and align workforce development strategies. Fully customizable in PowerPoint, Keynote, and Google Slides, this template ensures a clear and data-driven approach to workforce planning and professional growth.


3 diapositivas
Corporate Sustainabilitiy Management Strategy Presentation
Drive your company’s future with a presentation that blends strategy, innovation, and sustainability. Designed to communicate eco-friendly initiatives and long-term business goals, it helps visualize performance, impact, and growth clearly. Fully customizable and compatible with PowerPoint, Keynote, and Google Slides for seamless, professional, and engaging sustainability presentations.


3 diapositivas
Financial Market Performance Overview Presentation
Analyze trends with clarity using the Financial Market Performance Overview presentation template. This layout features a storefront-style visual paired with pie charts and a trend graph, ideal for displaying key financial metrics, market breakdowns, or investment summaries. Perfect for analysts, economists, and finance teams aiming to convey insights with simplicity and style. Fully editable and compatible with PowerPoint, Keynote, and Google Slides.


6 diapositivas
Business Plan Next Steps Presentation
Map out your strategy with the Business Plan Next Steps Presentation template. This visually structured layout helps outline key actions, milestones, and priorities for business growth and execution. Ideal for entrepreneurs, executives, and project managers, this slide ensures clarity and alignment on upcoming initiatives. Fully customizable in PowerPoint, Keynote, and Google Slides for easy integration into your planning process.


10 diapositivas
Risk Management Plan Presentation
The "Risk Management Plan Presentation" template is designed to outline strategic steps for identifying, assessing, managing, and monitoring business risks. Each segment of the plan is clearly labeled and represented on a segmented wheel, with A identifying risks, B assessing them, C managing responses, and D monitoring and reporting outcomes. The clean and straightforward design ensures key risk management strategies are communicated effectively to stakeholders. This visual tool is perfect for business meetings or training sessions, helping teams understand their roles in mitigating risks and ensuring that the business maintains a proactive approach to challenges.


4 diapositivas
Meeting Agenda Slide Presentation
Start your presentation with structure and clarity using this sleek, professional layout designed to outline key discussion points with style. Perfect for business meetings, workshops, or team updates, it keeps information clear and visually balanced. Fully compatible with PowerPoint, Keynote, and Google Slides for effortless editing and customization.


21 diapositivas
Crystalhearth UX Design Presentation
This professional template simplifies UX/UI design presentations, covering user research, personas, journey mapping, wireframes, and usability guidelines. Showcase visual elements, branding, accessibility, and responsive design. Ideal for illustrating the iterative process, testing insights, and project showcases. Fully customizable and compatible with PowerPoint, Keynote, and Google Slides.


6 diapositivas
Customer Support Team Infographic
The set of slides presented is meticulously designed to encapsulate the essence of customer support team operations, highlighting various key aspects such as teamwork, communication channels, customer interaction points, and support strategies. Each slide utilizes a clean and professional design, integrating soft color palettes and structured layouts to clearly convey complex information in an accessible way. These slides are particularly useful for customer support teams looking to present or revamp their strategy, showcasing how they handle customer queries and feedback across different platforms. The visual elements such as graphs, hierarchical diagrams, and process flows are strategically used to illustrate the team’s structure, response processes, and efficiency metrics, making it easier for stakeholders to grasp the effectiveness of customer support initiatives. Such a collection is indispensable for training new team members, demonstrating the team's impact on customer satisfaction, and internal reviews to improve service delivery. By using these slides, teams can ensure a consistent understanding of goals, roles, and procedures, which is crucial for maintaining high standards of customer service and team alignment.


5 diapositivas
Business Investment in Africa Map Presentation
Explore promising markets with the "Business Investment in Africa Map" template, designed to provide a visual overview of investment opportunities across the continent. It features a map with marked regions, each linked to specific data points about business prospects. Ideal for investors or companies looking at market penetration or expansion within Africa, this layout helps in making data-driven decisions by providing a clear, concise visual representation of key information.


7 diapositivas
Skills Gap Analysis Tool Infographic
Optimize workforce potential with our Skills Gap Analysis Tool Infographic, designed for HR professionals, team leaders, and organizational development experts. This infographic provides a visual representation of the skills present within a team and identifies areas requiring development. Our infographic lays out a systematic approach to assessing competency levels across various skill sets, highlighting strengths and gaps in your team's abilities. It includes segments for rating proficiency, mapping skill distribution, and planning for training or recruitment to bridge any gaps. With this tool, you can create a clear and actionable skills inventory that supports strategic workforce planning and personal development. This SEO-optimized infographic is crafted to guide you in aligning your team's skills with organizational goals. Leverage this infographic to conduct comprehensive skills gap analyses, ensuring your team has the capabilities to meet current and future challenges effectively.


7 diapositivas
Vision Infographic
Elevate your presentations with our range of Slide Templates, tailored to showcase long-term objectives and strategies. These designs vary from simple and clean to bold and engaging, ensuring that every slide effectively communicates your forward-looking plans. Each template is crafted for easy customization to suit your brand's style, including areas for essential details, data representation, and motivational elements. They are perfect for aligning your team, engaging stakeholders, and promoting strategic discussions. Ideal for business presentations, team meetings, and motivational sessions, these templates offer a professional way to present your future goals and engage your audience effectively.


6 diapositivas
Stakeholder Analysis and Engagement
Effectively map out internal and external stakeholders with this structured hexagon-based layout. This presentation highlights six key groups—Employee, Manager, Shareholder, Society, Media, and Customer—centered around your company. Ideal for corporate strategy, stakeholder engagement, or CSR planning. Fully customizable in PowerPoint, Keynote, and Google Slides.
6 diapositivas
Performance Tracking Heat Map Presentation
Turn performance data into bold visual stories with a sleek, bubble-style layout that highlights progress and key metrics. Ideal for showcasing results, performance reviews, or KPI tracking, this presentation helps audiences grasp insights quickly. Fully compatible with PowerPoint, Keynote, and Google Slides for seamless editing and customization.


8 diapositivas
4-Quadrant Matrix Presentation
The "4-Quadrant Matrix Presentation" template is meticulously designed for strategic analysis and planning, perfect for visualizing business data across four key areas. Each quadrant highlights a distinct category, allowing for a comprehensive breakdown of information such as performance metrics, risk assessments, market trends, or operational efficiency. The template is color-coded to distinguish between the quadrants, making it visually engaging and easy to understand. Icons within each quadrant can be customized to symbolize different business functions or data points, enhancing the clarity and effectiveness of the presentation. This tool is ideal for executives, managers, and analysts who need to present complex data in a structured and insightful way, enabling informed decision-making and strategic planning in corporate settings.


4 diapositivas
Annual Report Summary Slide
Present key performance metrics with confidence using this Annual Report Summary Slide. Designed with bold percentage visuals and clear titles, it helps break down quarterly or category results in a clean, professional format. Ideal for financial overviews, sales performance, or strategic summaries. Fully editable in PowerPoint, Keynote, and Google Slides.


6 diapositivas
Strategy Planning with Business Model Canvas Presentation
Streamline your strategy planning with this Business Model Canvas template. Designed to help entrepreneurs, business owners, and teams outline key business elements, this slide organizes essential components like value propositions, customer segments, revenue streams, and cost structures. Fully editable in PowerPoint, Keynote, and Google Slides, allowing seamless customization to match your branding and business needs.