


Características


¿Tienes alguna pregunta?
Recomendar


30 diapositivas
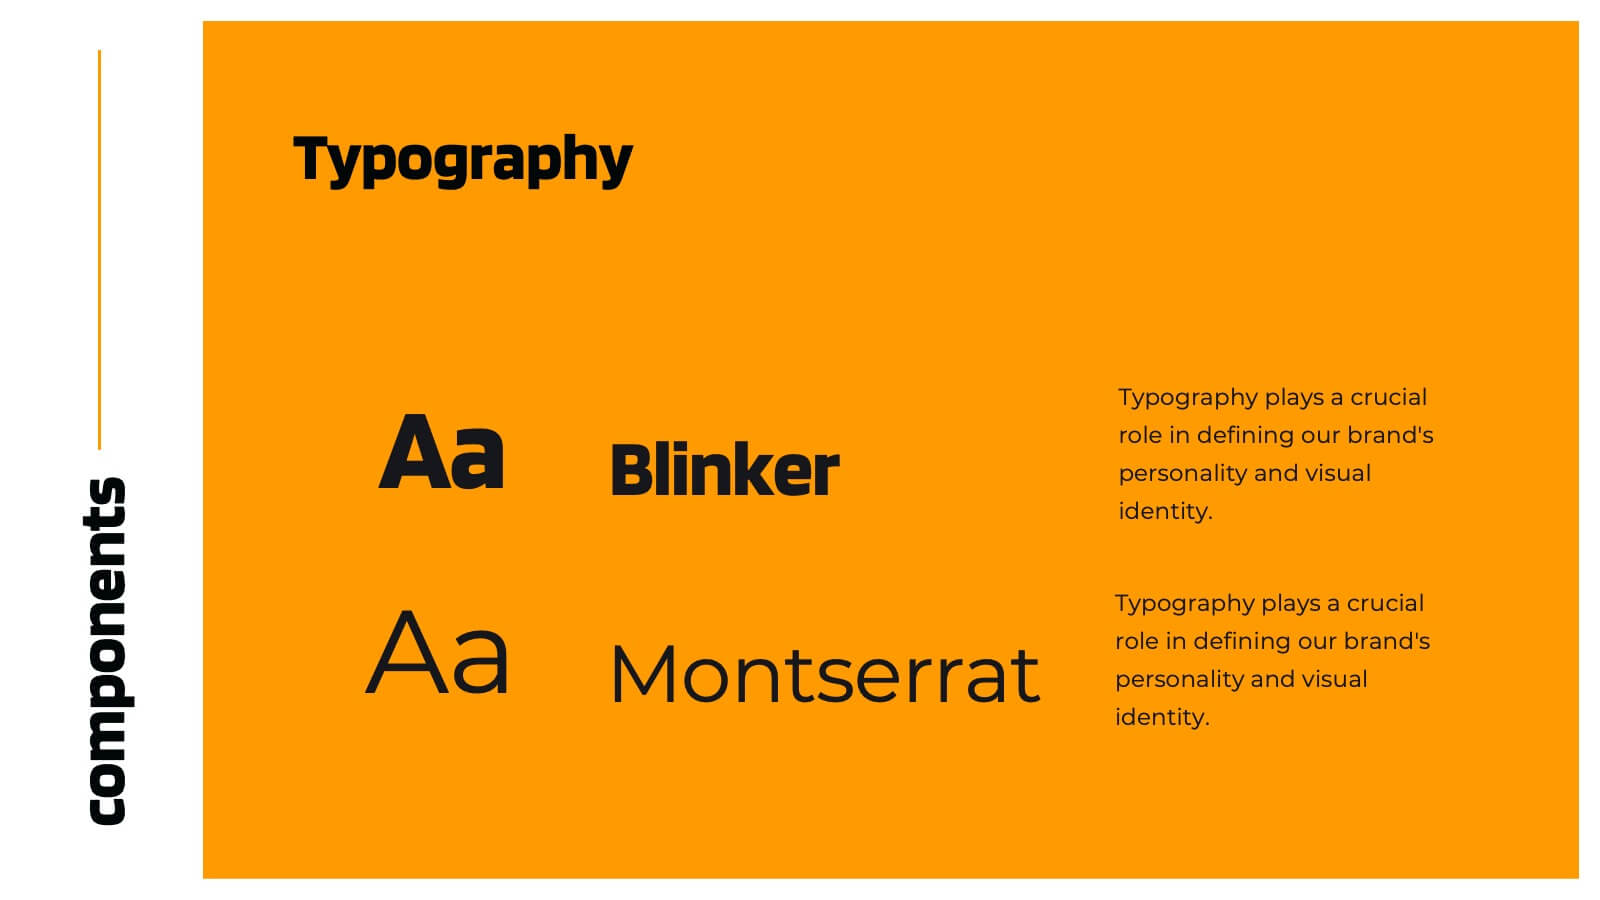
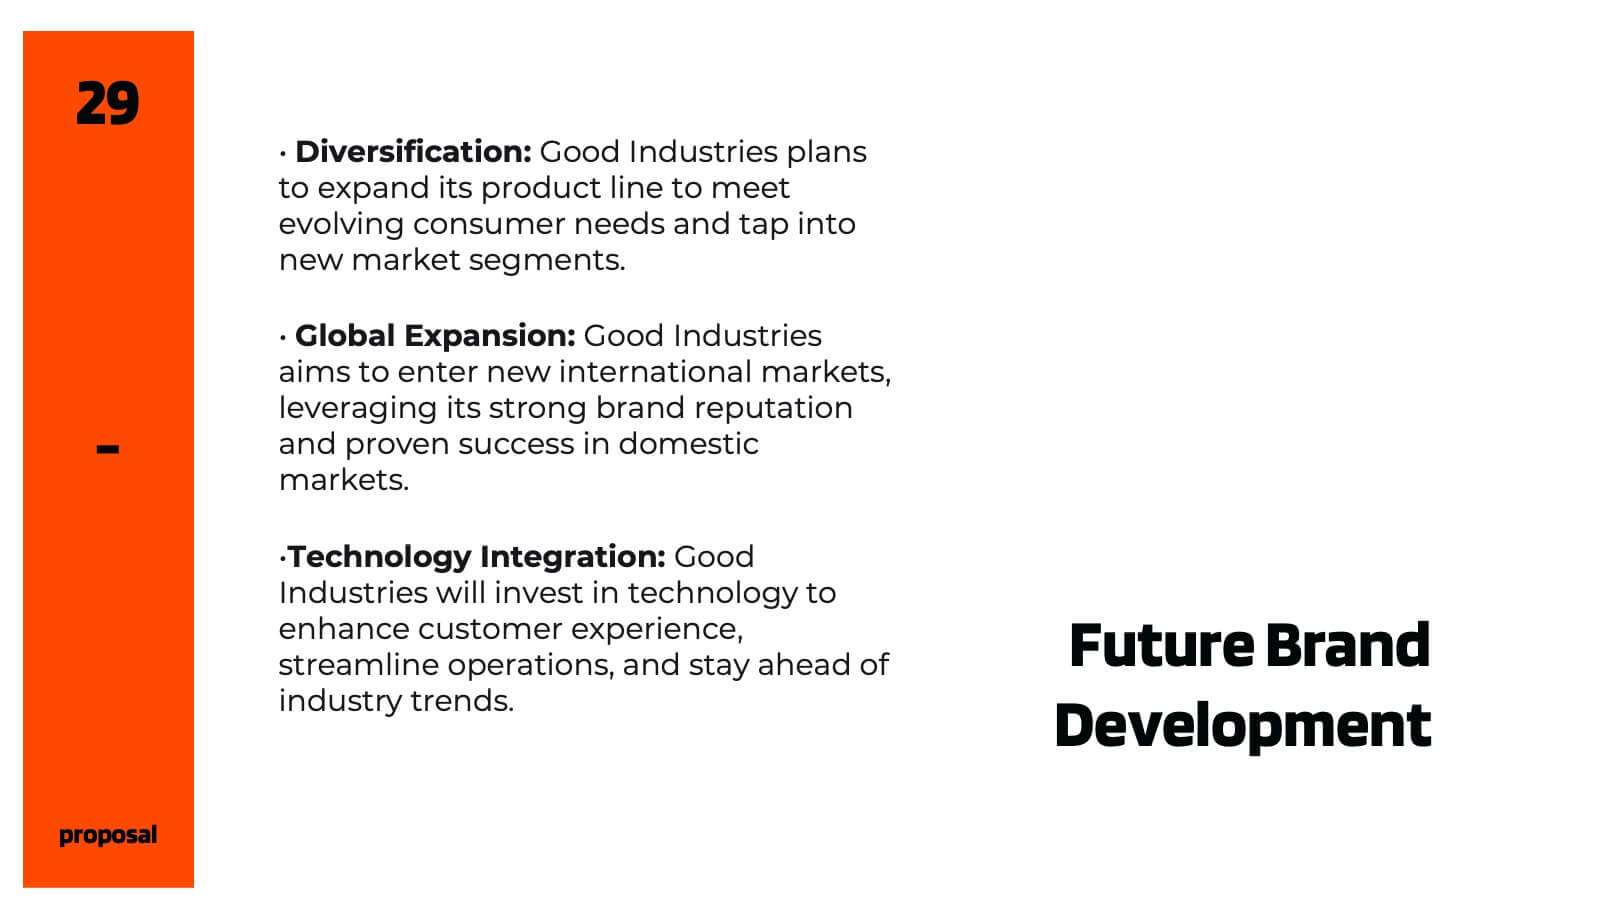
Chromalight Brand Guidelines Proposal Presentation
Elevate your brand's story with this visually engaging presentation template that embodies modern, professional aesthetics. From mission and vision statements to brand identity and market positioning, each slide is crafted to showcase your brand's core essence. Ideal for brand strategists and marketers, this template is compatible with PowerPoint, Keynote, and Google Slides.


7 diapositivas
Porter's Five Forces Analysis Infographic
Unveil the key elements influencing your industry with Porter's Five Forces Analysis Infographic. Drenched in vibrant shades of yellow, blue, and white, this template offers a lucid visualization of the five crucial forces that determine the competitive intensity in the market. Ideal for business analysts, strategy planners, or management students, it offers a nuanced understanding of market dynamics. Its engaging design captures attention while facilitating comprehensive discussions on potential opportunities or threats. With compatibility across PowerPoint, Keynote, and Google Slides, it promises smooth transitions during presentations.


6 diapositivas
Big Data Solutions Infographics
Discover the power of Big Data Solutions with our customizable infographic template. This template is fully compatible with popular presentation software like PowerPoint, Keynote, and Google Slides, allowing you to easily customize it to illustrate and communicate various aspects of big data solutions. The Big Data Solutions infographic template offers a visually engaging platform to explain the principles, technologies, and benefits of harnessing big data for insights and decision-making. Whether you're a data professional, business leader, or simply interested in the world of big data, this template provides a user-friendly canvas to create informative presentations and educational materials. Deepen your understanding of Big Data Solutions with this SEO-optimized infographic template, thoughtfully designed for clarity and ease of use. Customize it to showcase data sources, analytics tools, data storage options, and the real-world applications of big data in various industries, ensuring that your audience gains valuable insights into this transformative field. Start crafting your personalized infographic today to explore the world of Big Data Solutions.


20 diapositivas
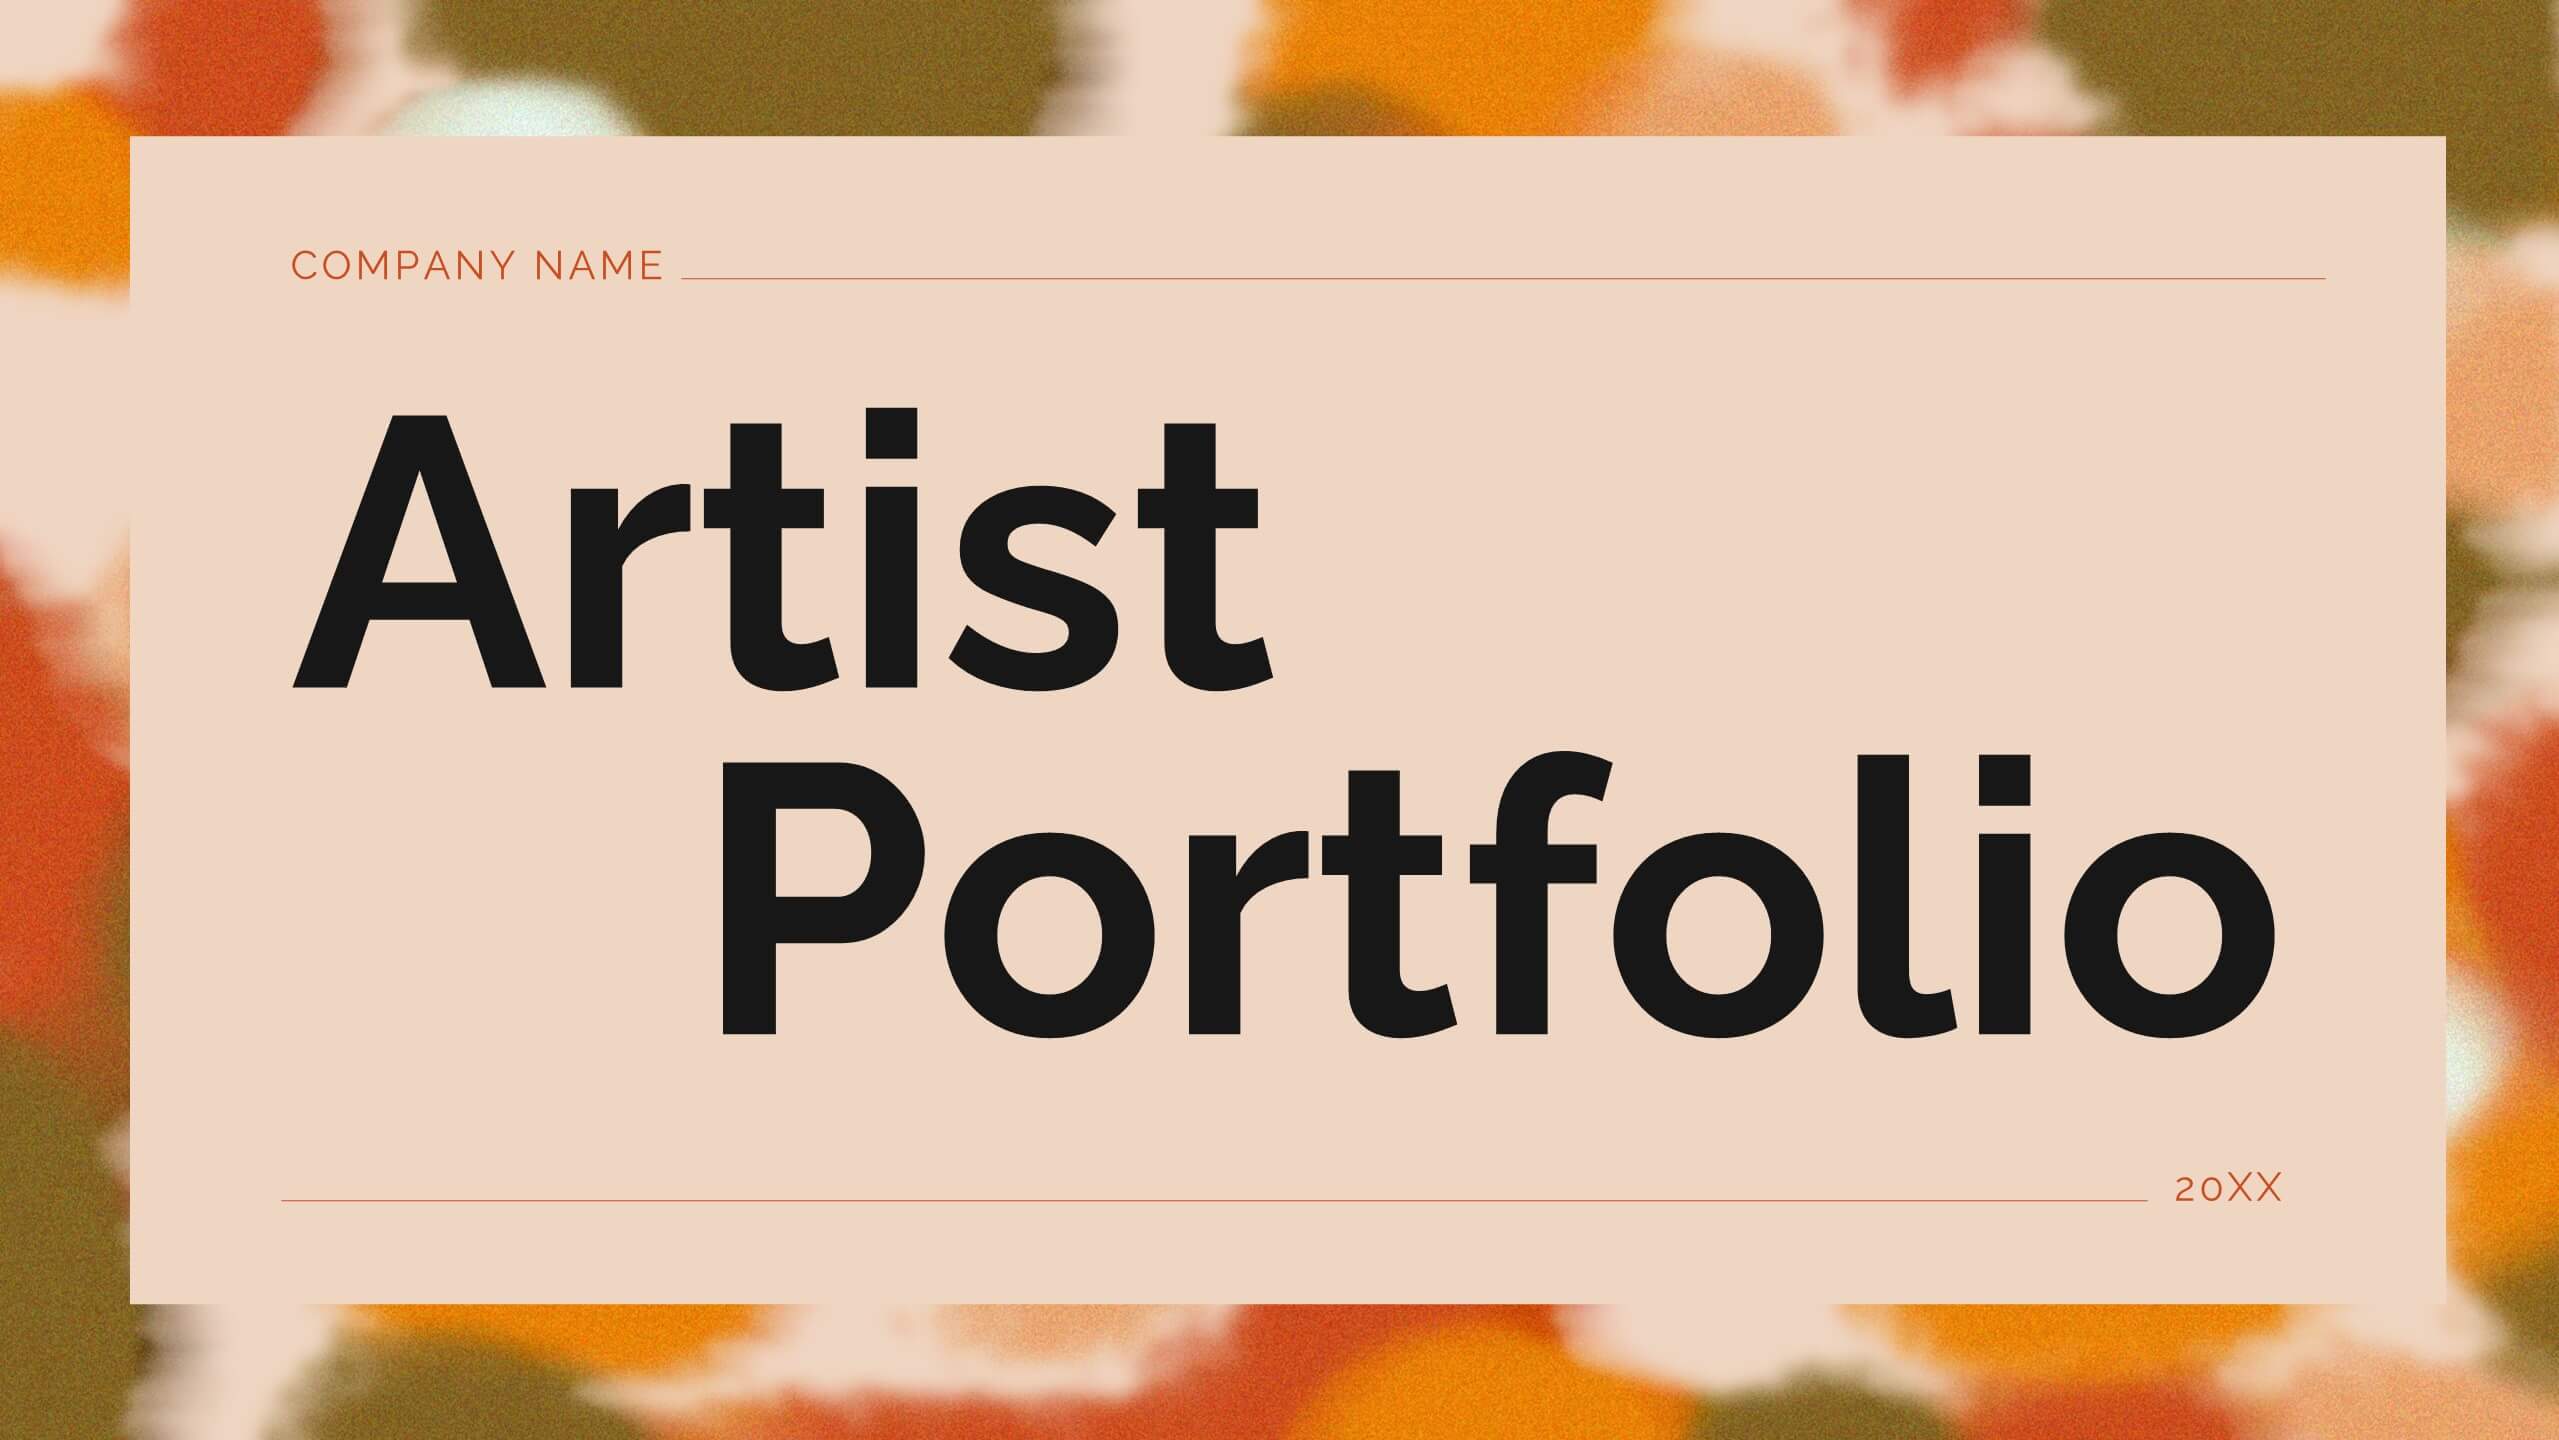
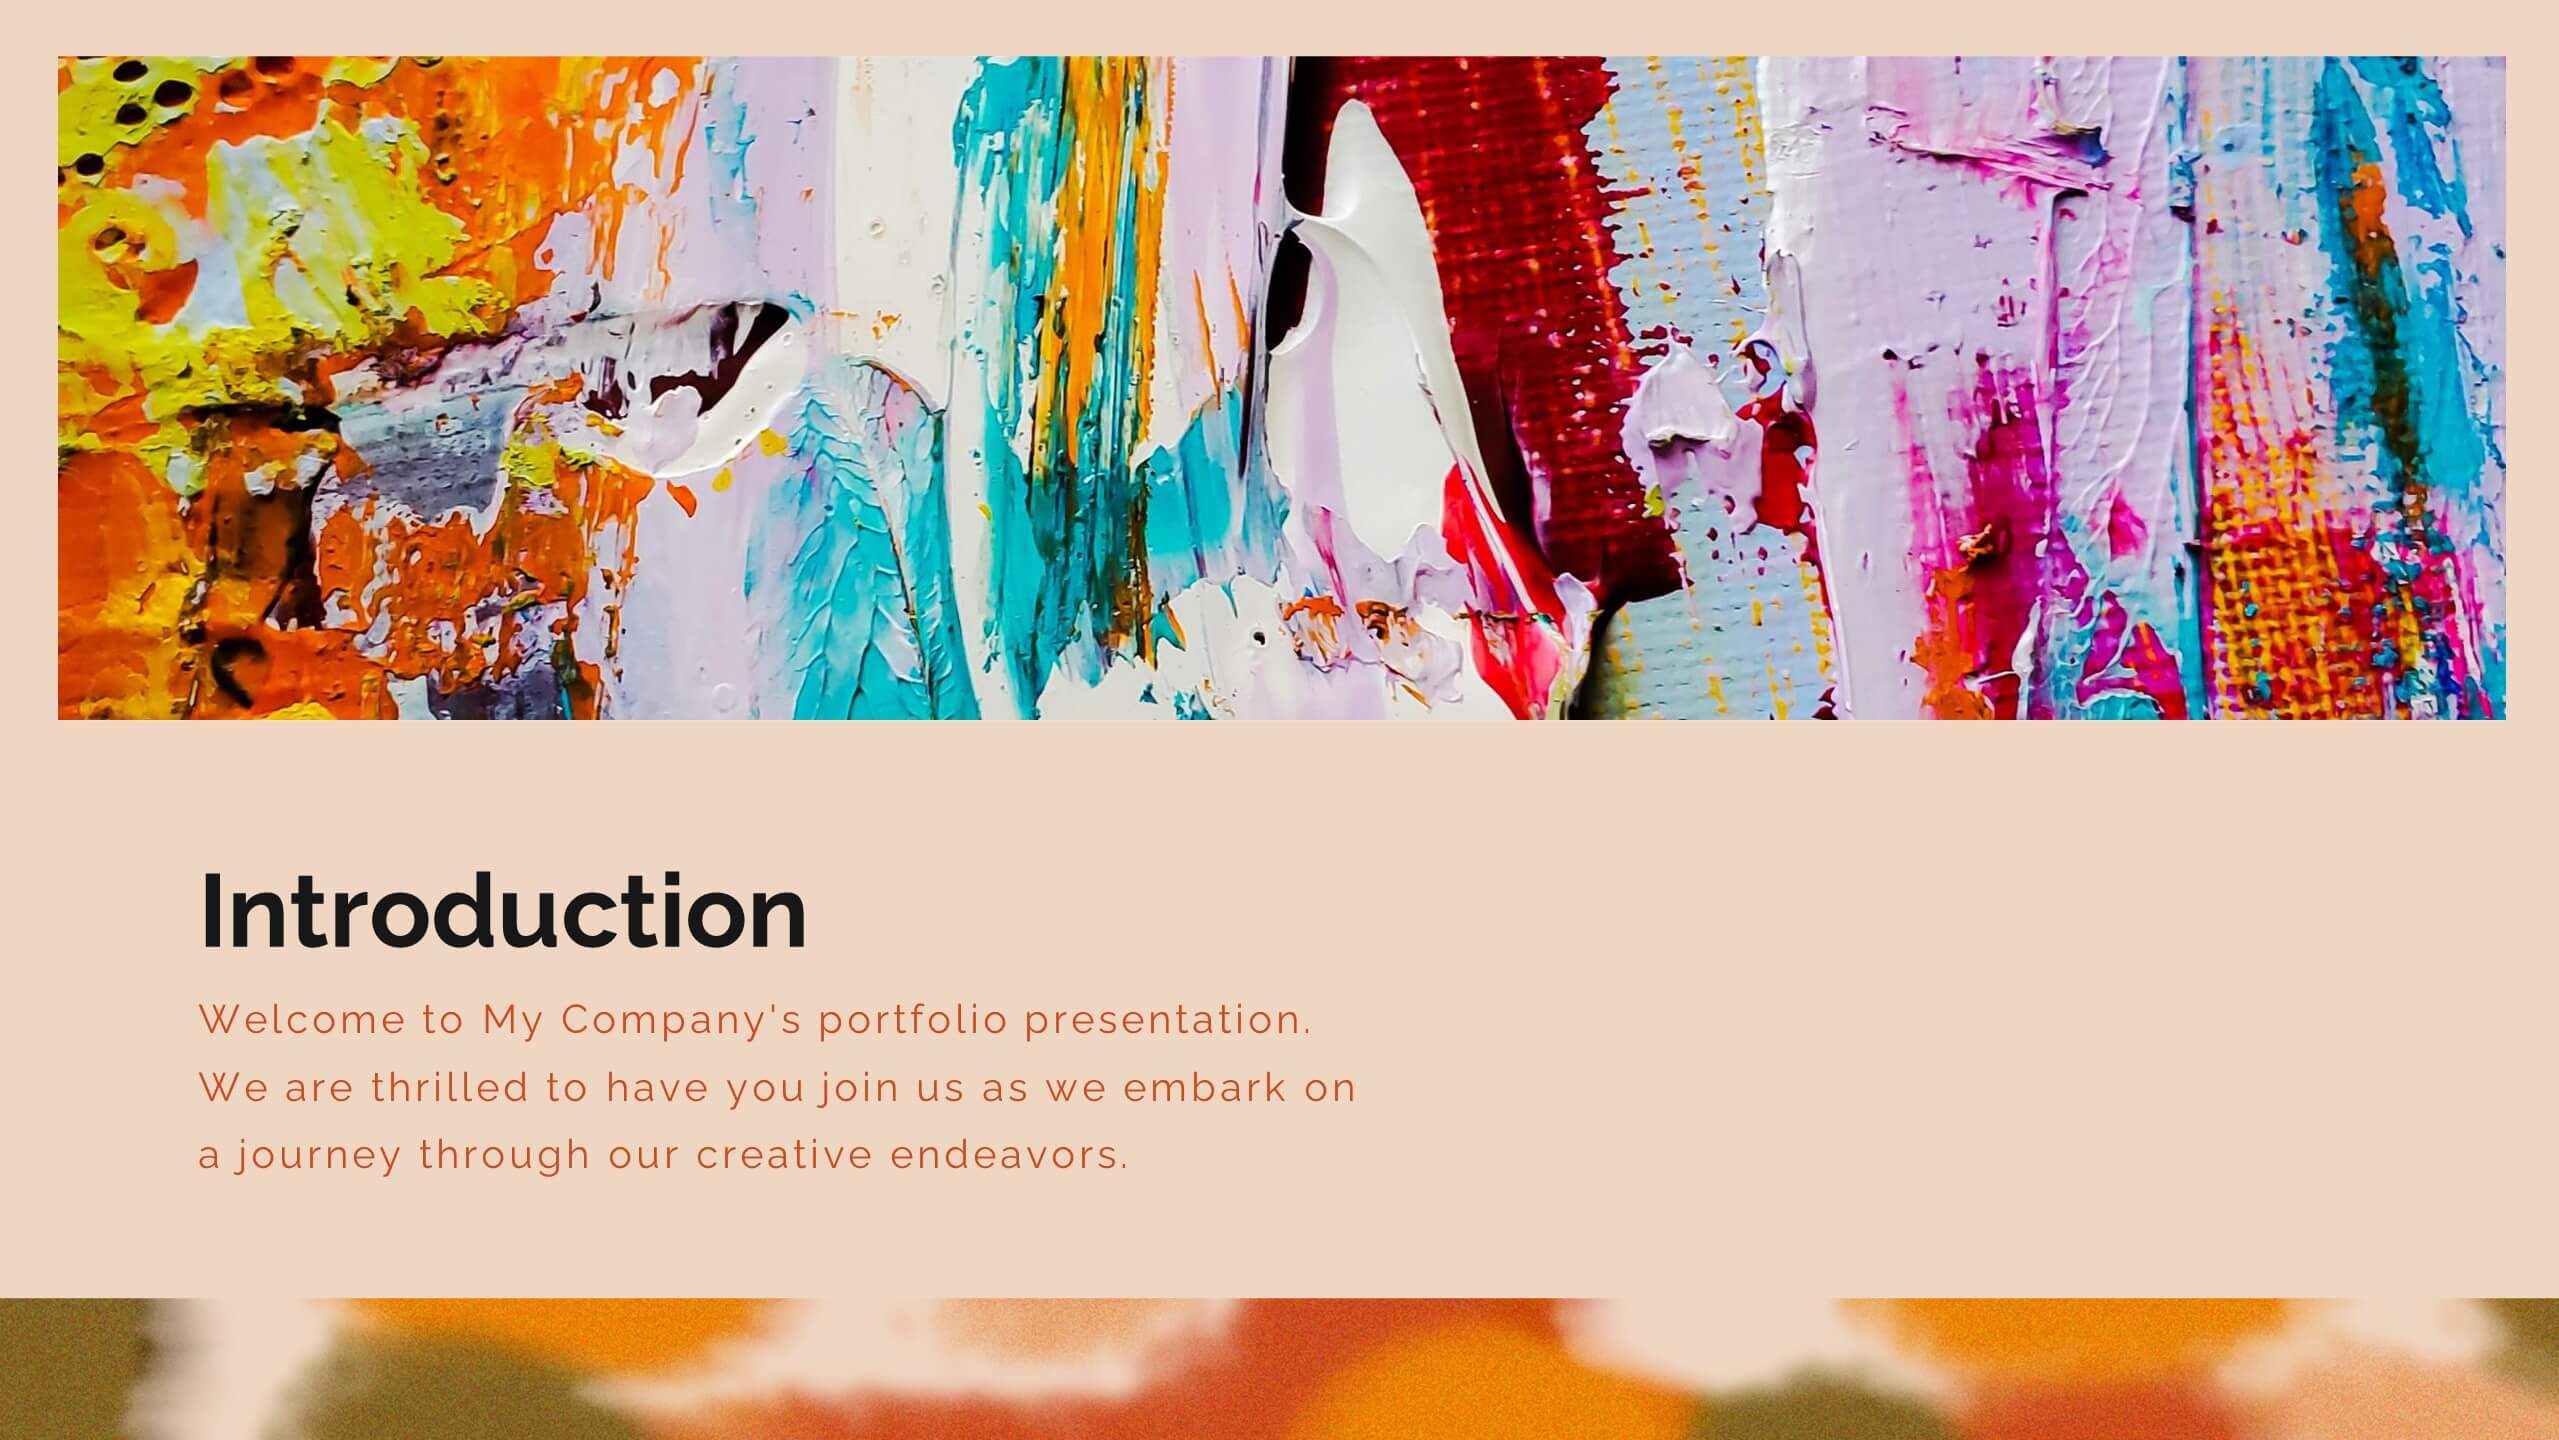
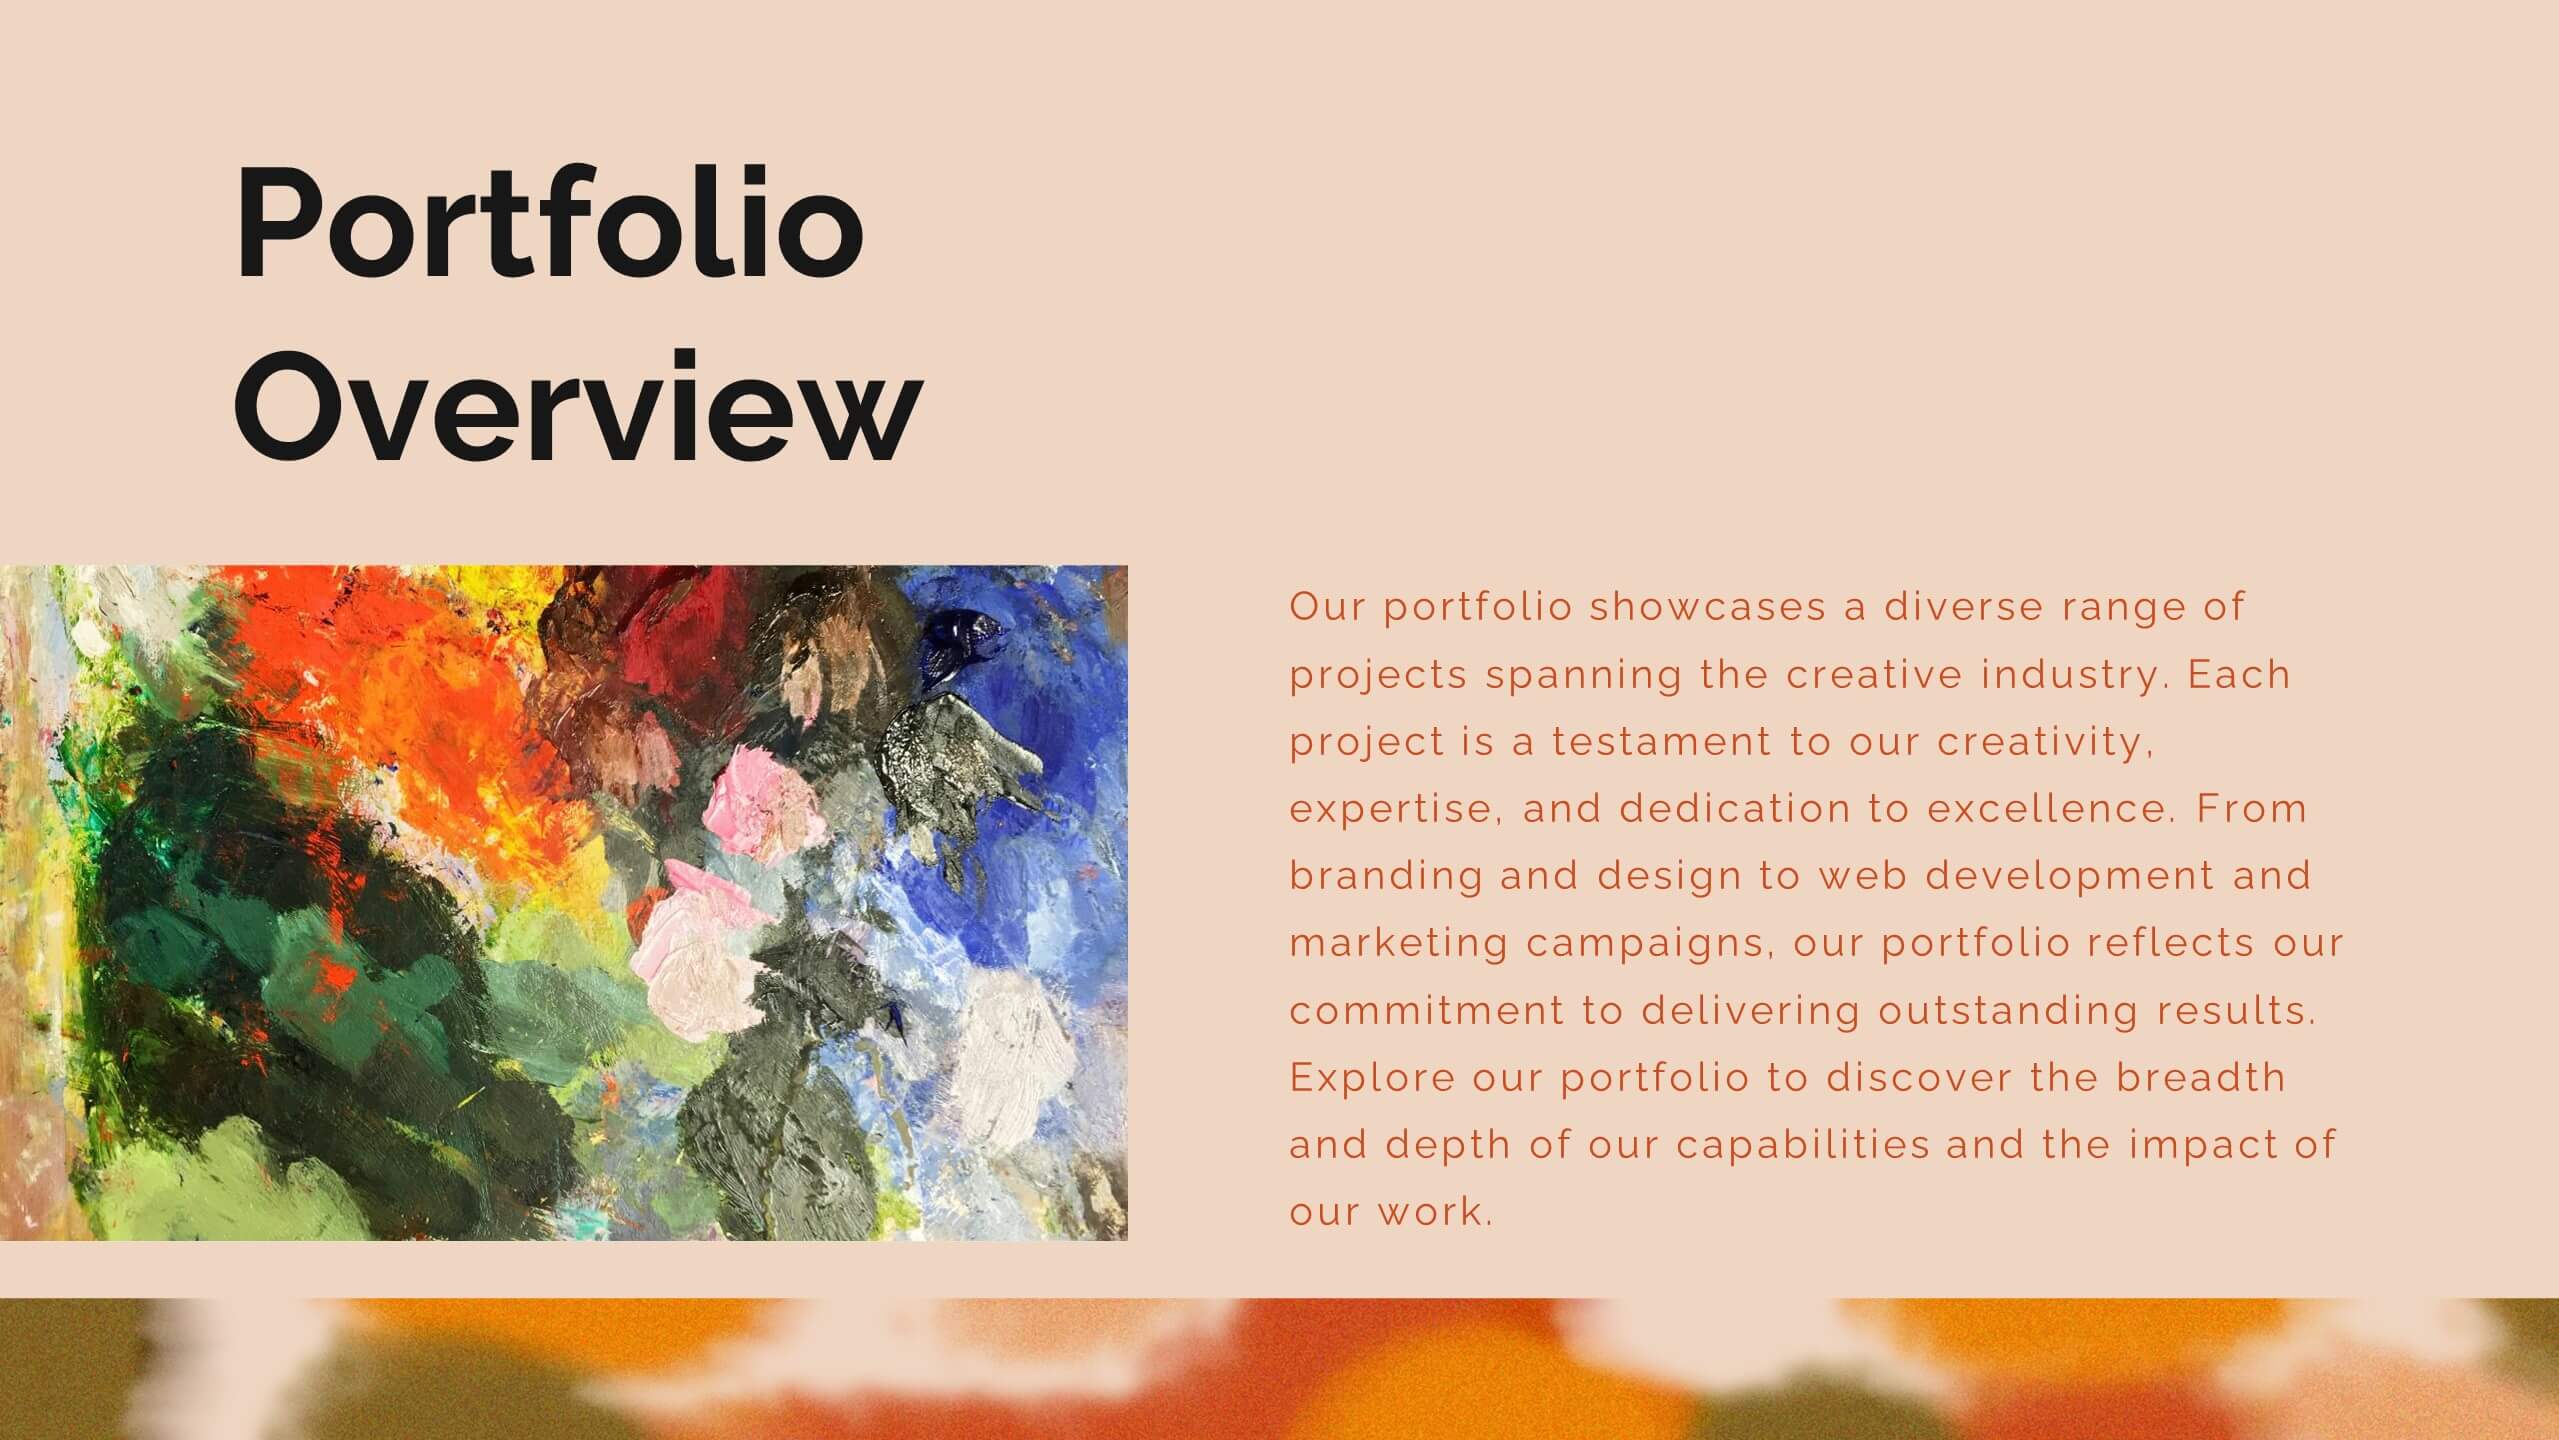
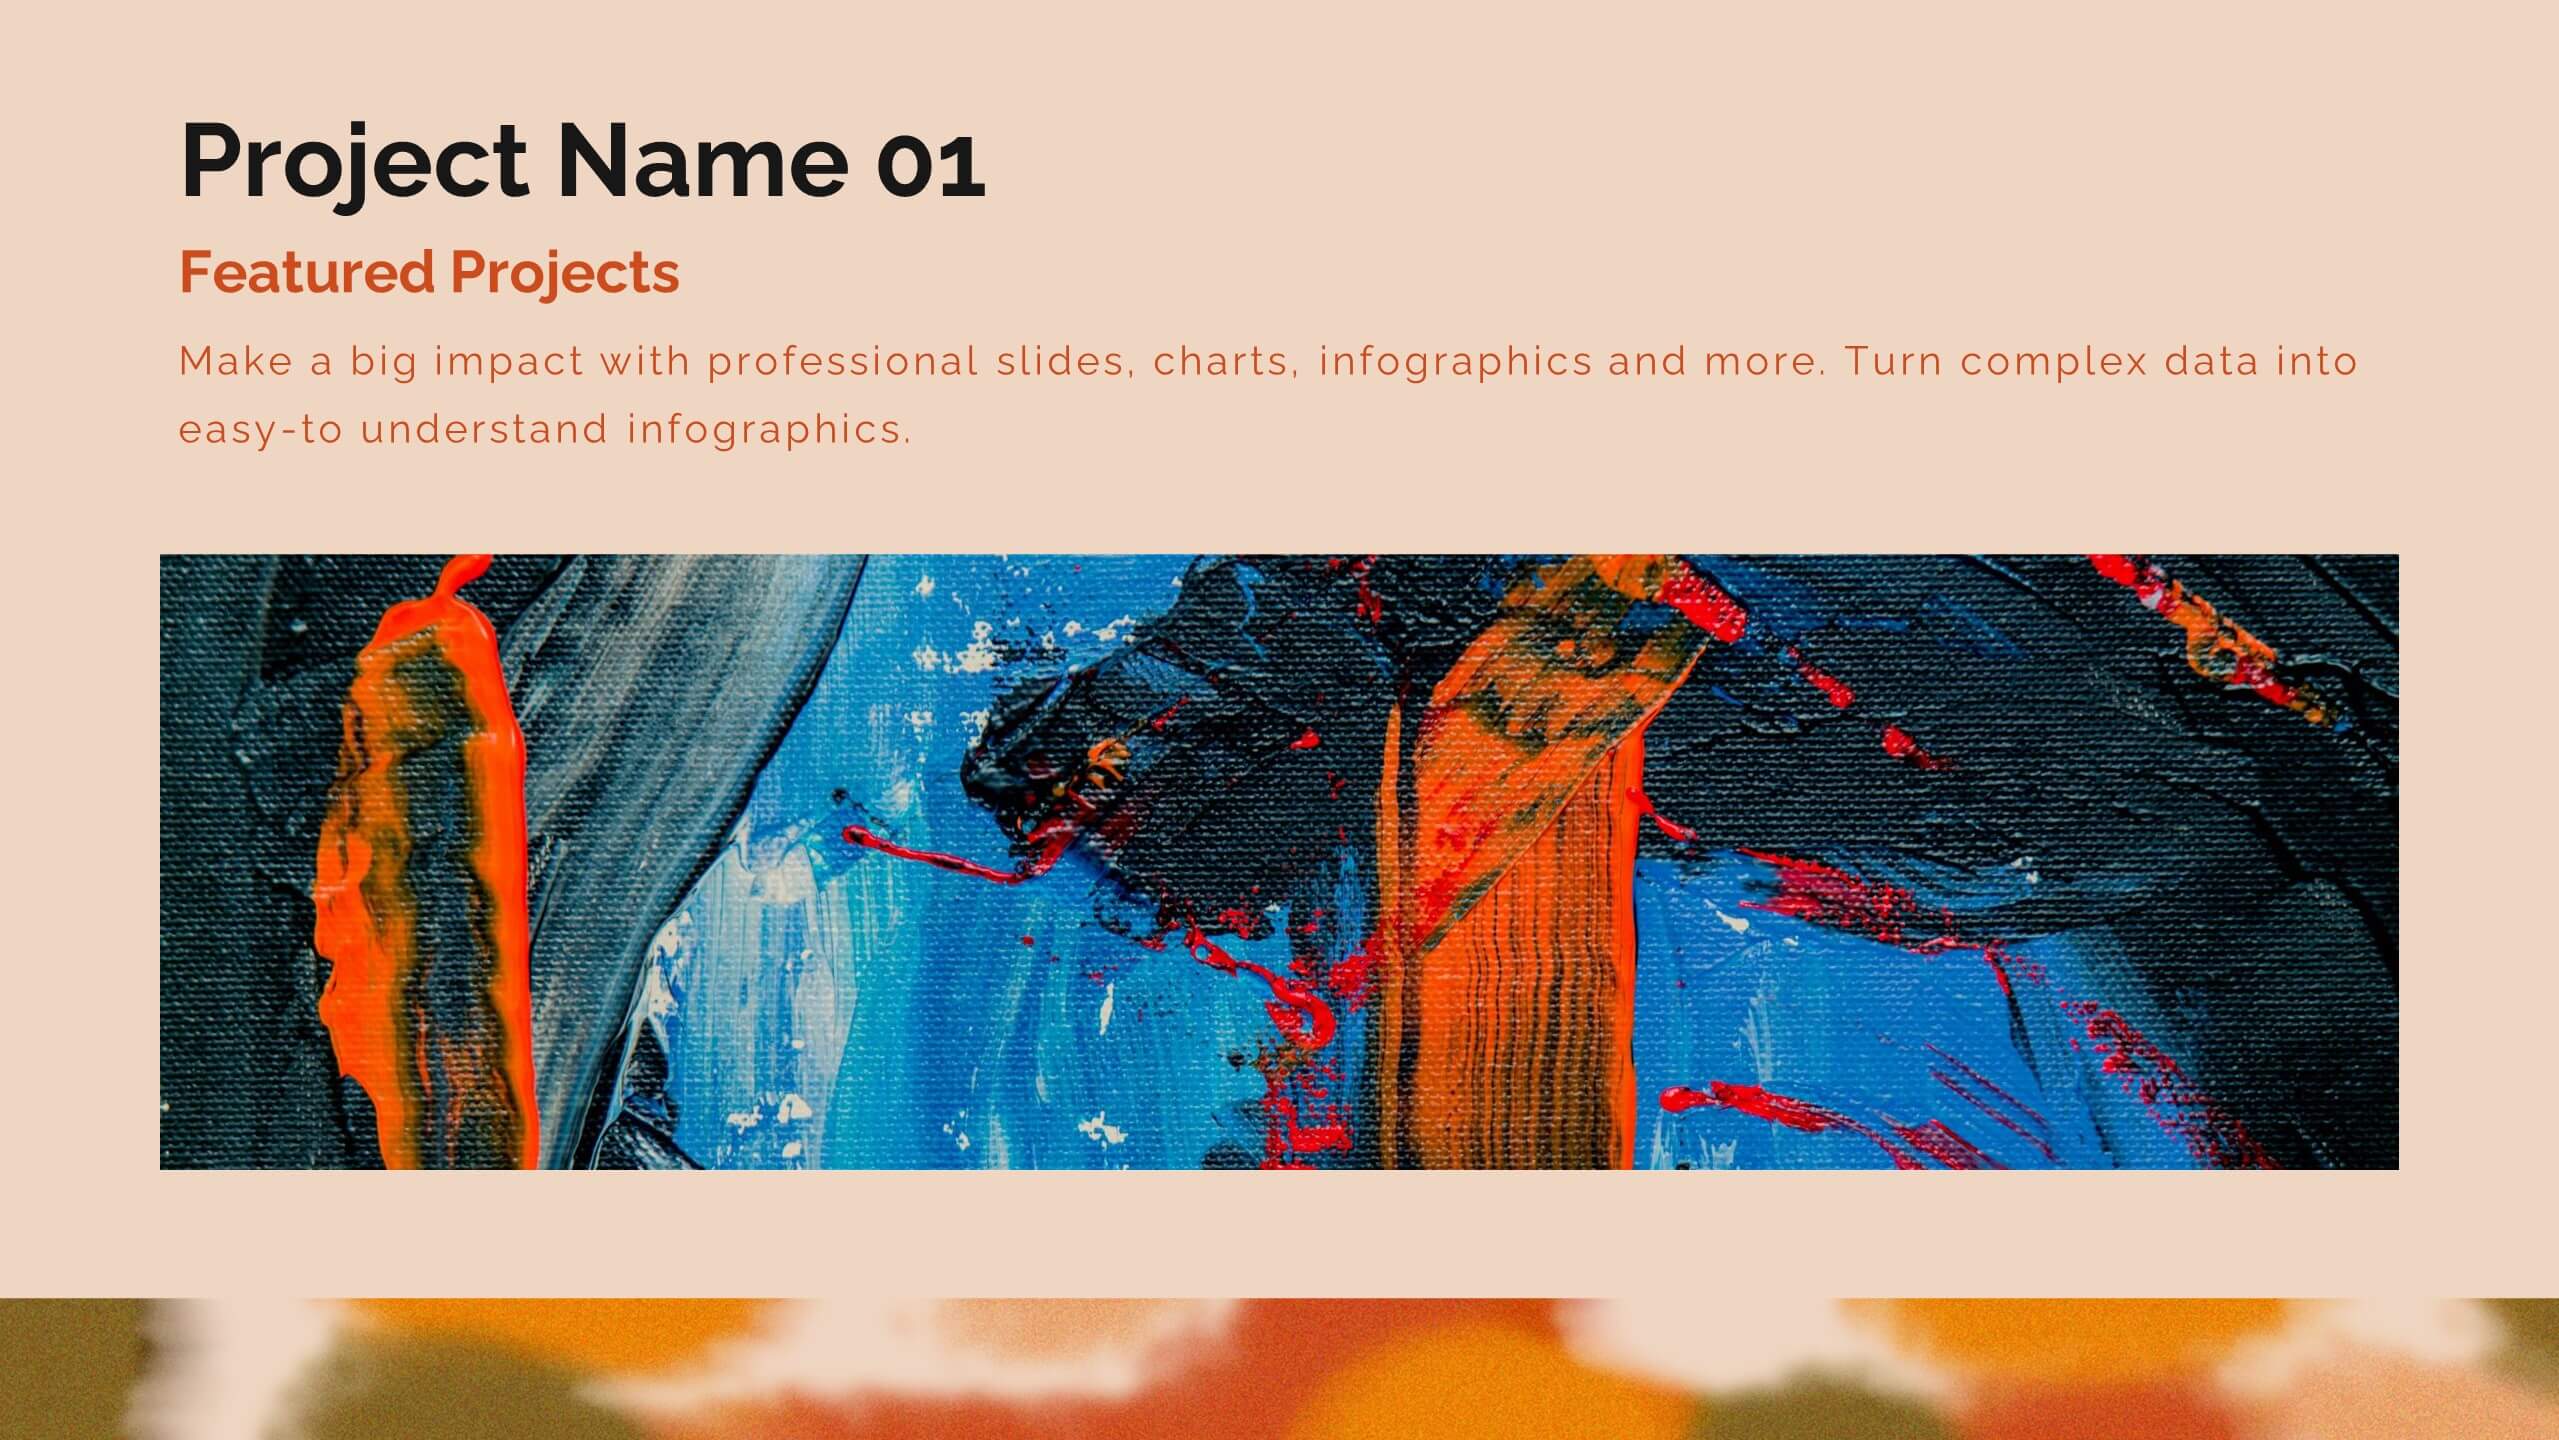
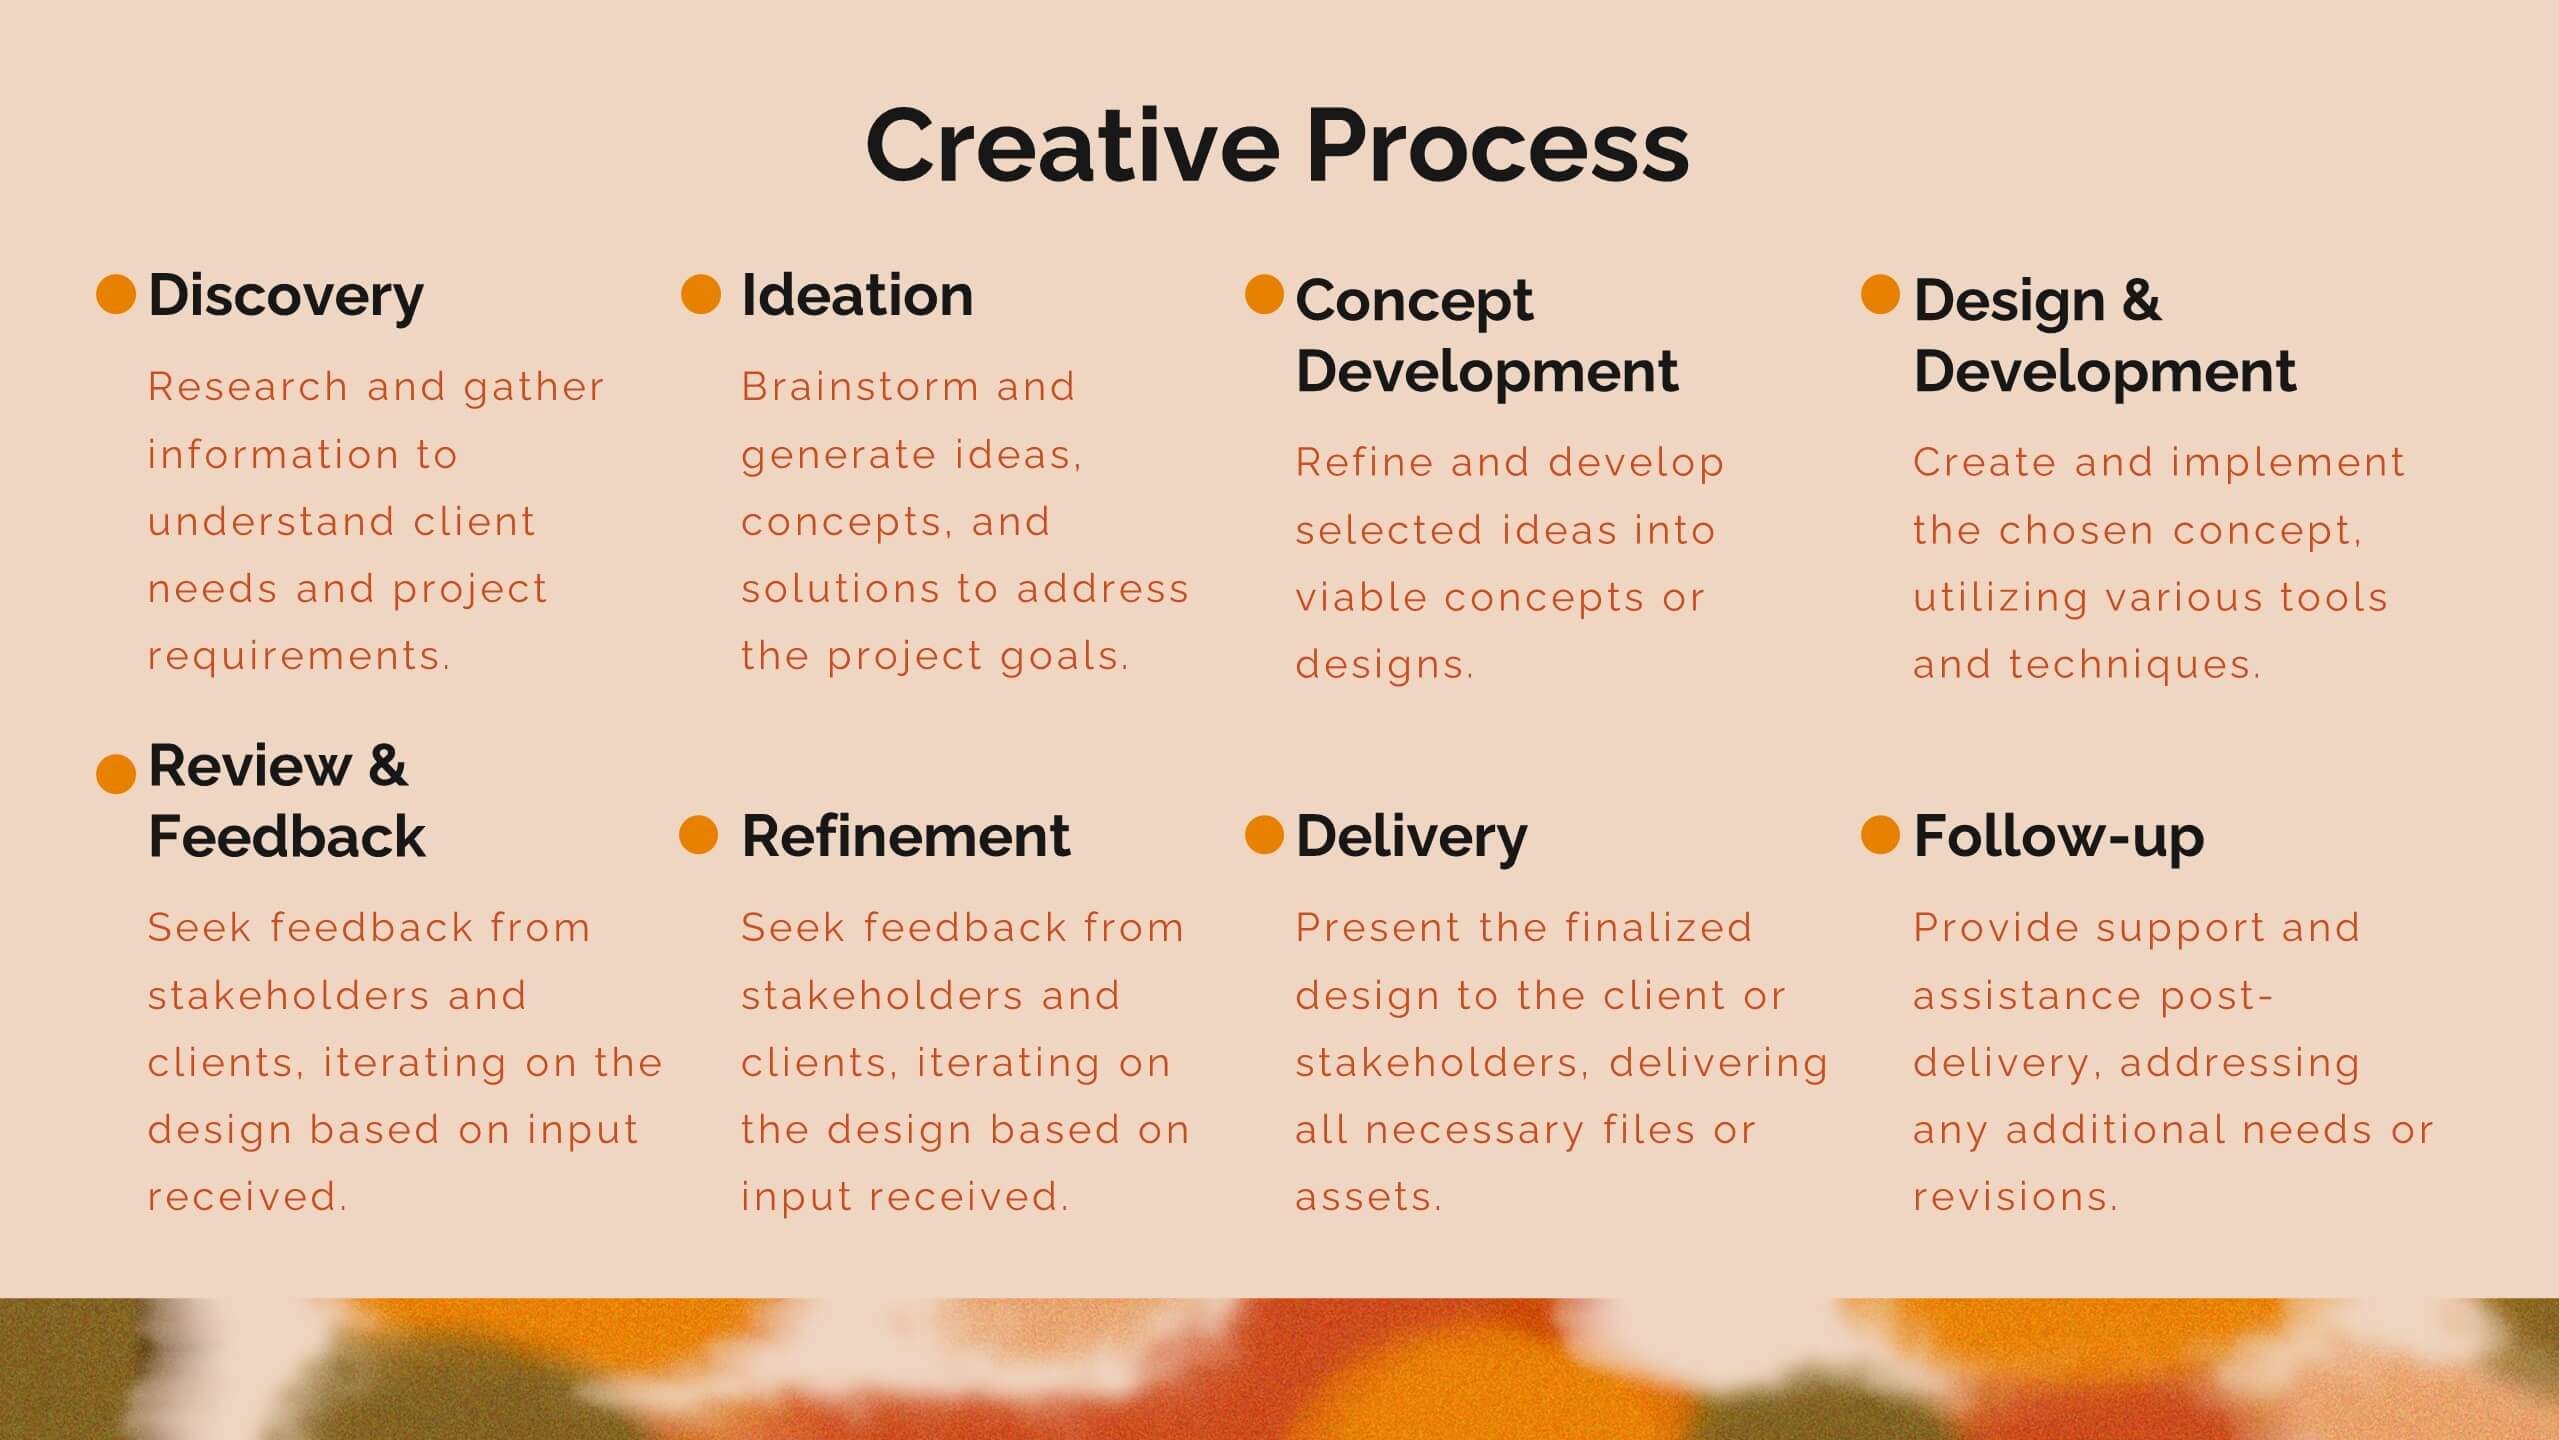
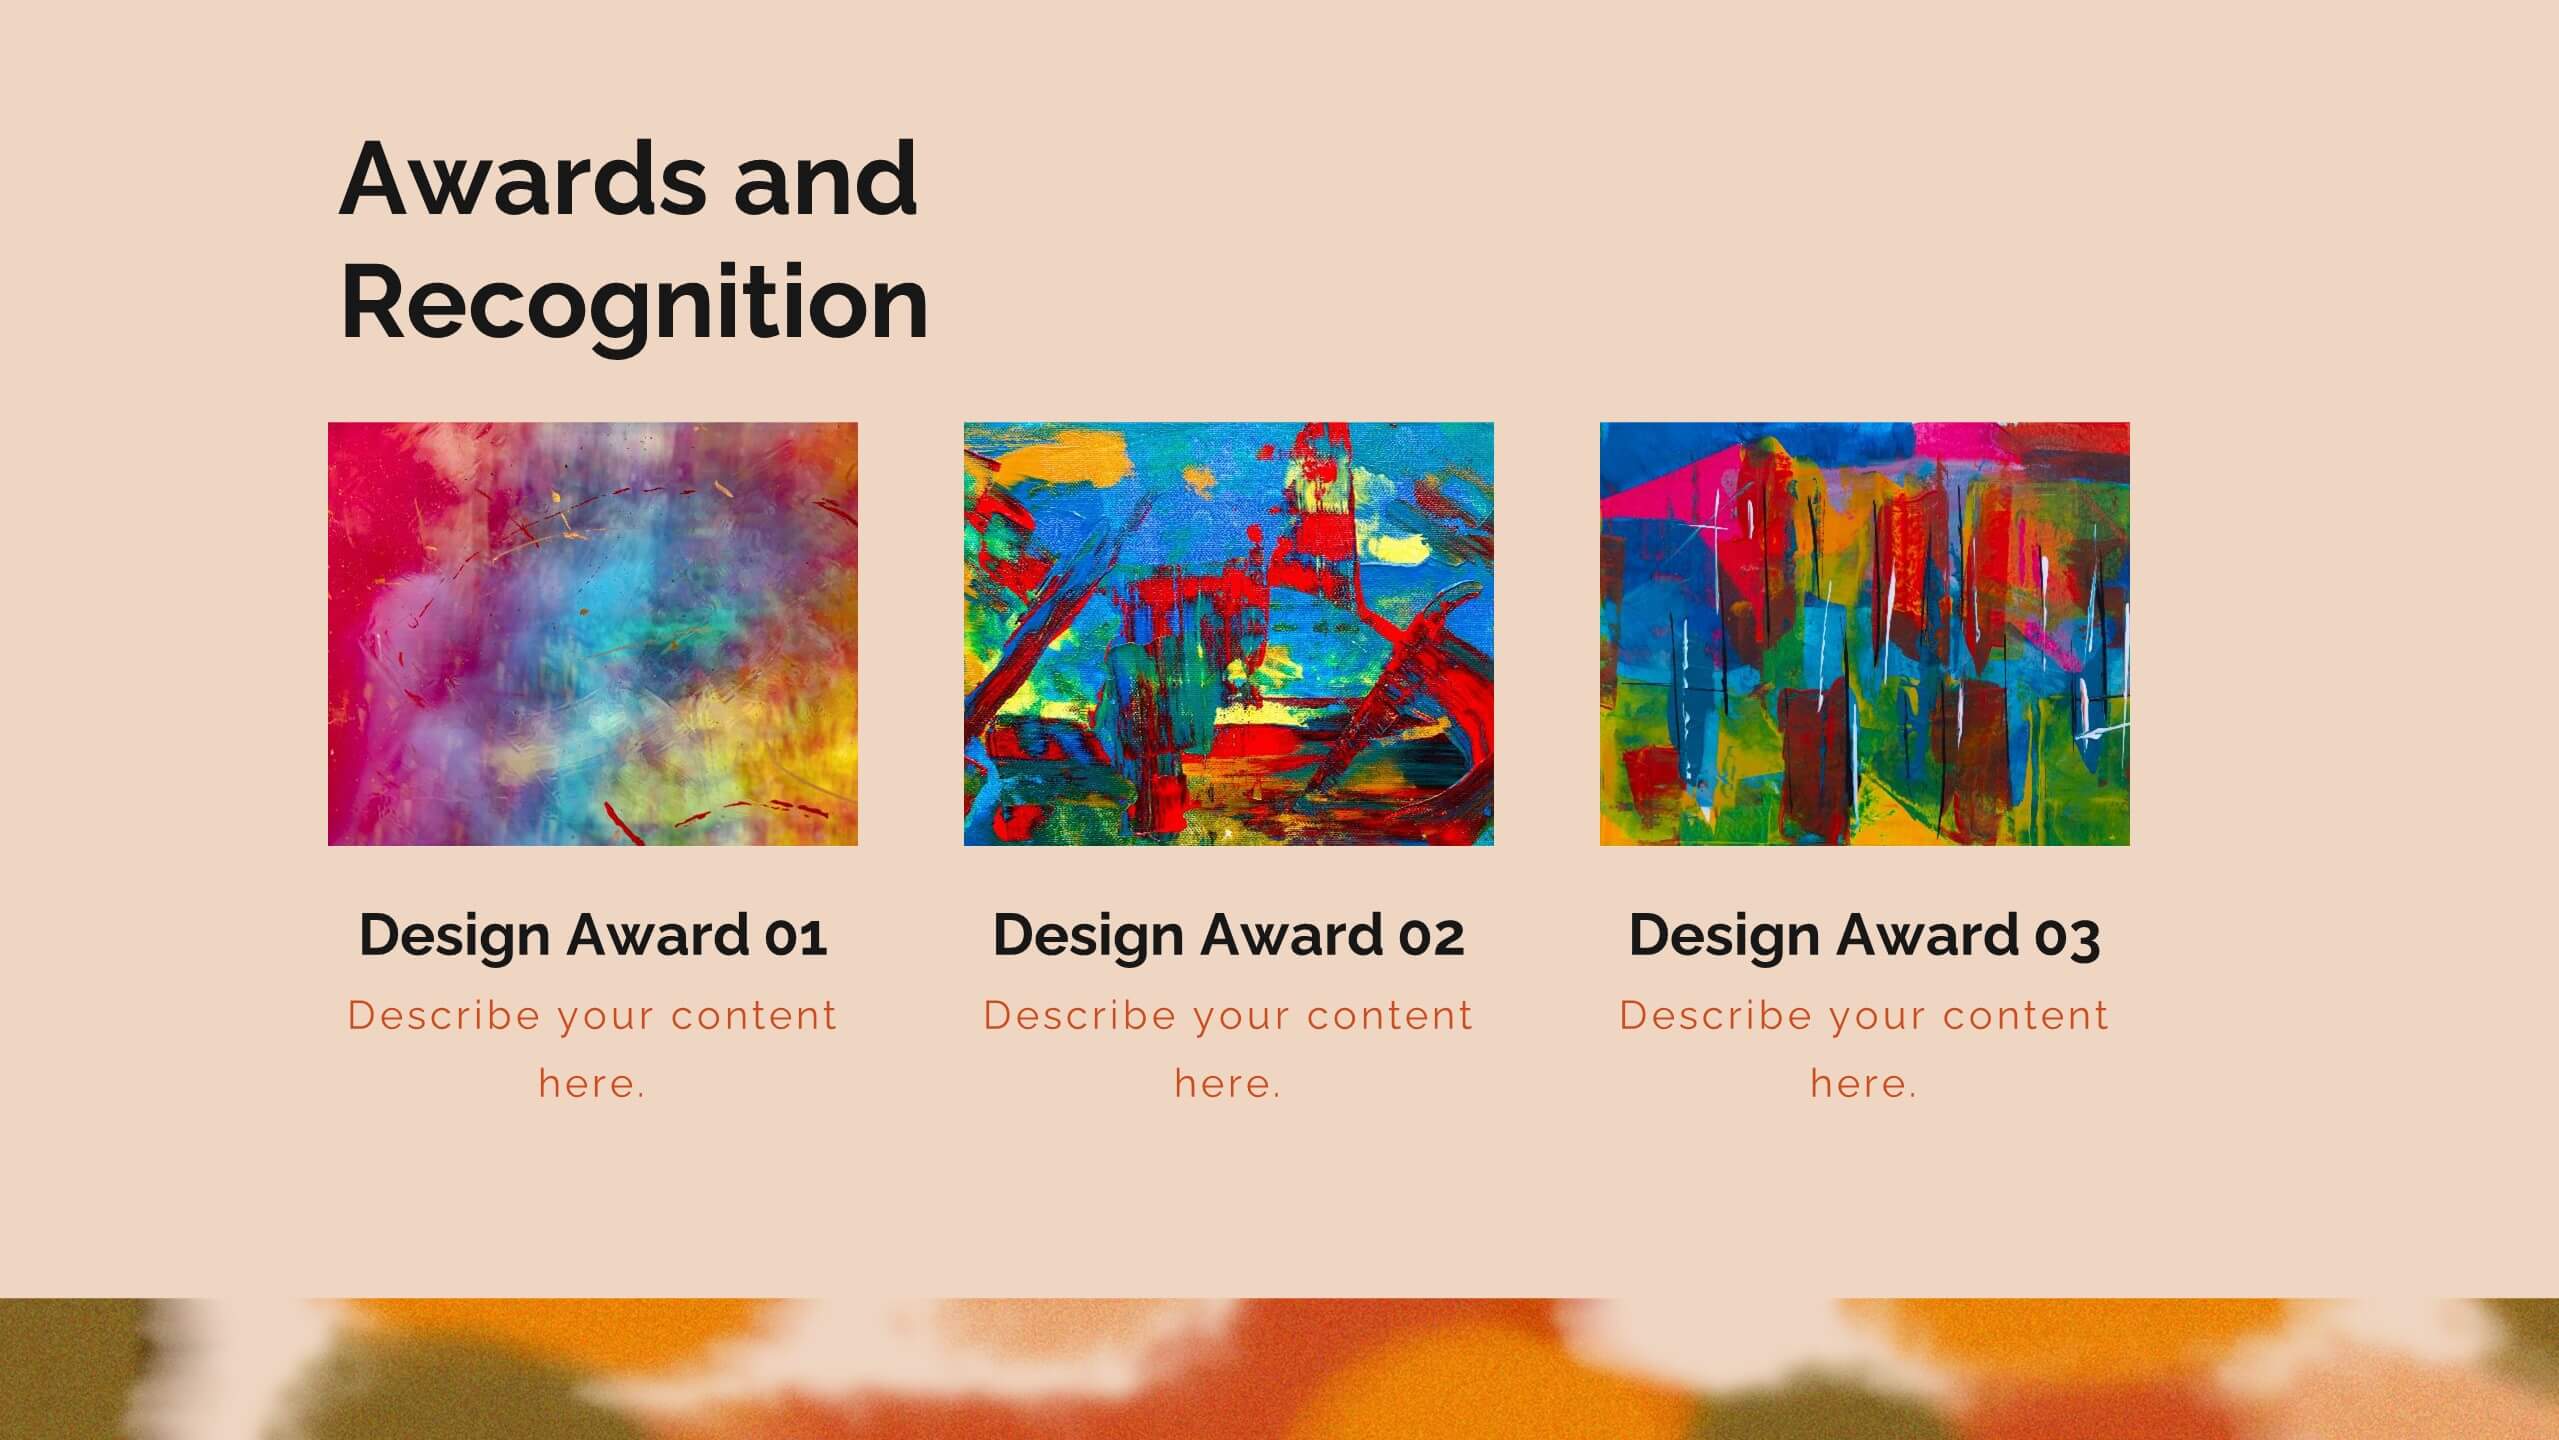
Zenith Artist Portfolio Presentation
Showcase your artistic journey with this captivating portfolio template! Perfect for presenting your projects, creative process, and client testimonials. Ideal for artists aiming to highlight their work and achievements. Compatible with PowerPoint, Keynote, and Google Slides, this template ensures your portfolio is visually stunning and professionally presented. Make your art stand out!


4 diapositivas
Sales Performance Heat Map Overview Presentation
Get a quick visual pulse on your data with the Sales Performance Heat Map Overview Presentation. Ideal for showing activity levels or trends across time, this slide uses a gradient color scale to help teams identify high and low performance instantly. Fully editable in Canva, PowerPoint, Keynote, and Google Slides—great for sales managers, team leads, and marketing analysts.


8 diapositivas
Professional Business Executive Summary Presentation
Make your insights stand tall with a bold, clean layout that feels like a data-driven story in motion. This executive summary slide is perfect for breaking down complex ideas into three clear steps, using sleek vertical bars to add visual rhythm. Compatible with PowerPoint, Keynote, and Google Slides for easy editing.


12 diapositivas
Attention Interest Desire Actions Presentation
Spark curiosity from the very first slide with a bold, layered visual that turns complex ideas into a clear, memorable journey. This presentation walks viewers through each stage of your message, helping you build momentum and guide decisions with ease. Fully editable and compatible with PowerPoint, Keynote, and Google Slides.


4 diapositivas
Buyer Persona Research and Profile Map Presentation
Make your audience feel like they already know your ideal customer. This creative template helps you visually map out key buyer persona data, such as demographics, goals, behavior, and pain points. Perfect for marketing strategy and customer research presentations. Fully compatible with PowerPoint, Keynote, and Google Slides for seamless editing.


6 diapositivas
Product Pricing Table Comparison
Make your pricing pitch clear and compelling with this vibrant comparison table template designed for easy decision-making. Whether you're showcasing subscription plans, service tiers, or product bundles, this slide helps highlight key features and value differences at a glance. Fully editable in PowerPoint, Keynote, and Google Slides.


8 diapositivas
Business Growth with TAM SAM SOM Framework Presentation
Illustrate Your Market Expansion Strategy with this Business Growth with TAM SAM SOM Framework presentation template. Clearly differentiate Total Addressable Market (TAM), Serviceable Available Market (SAM), and Serviceable Obtainable Market (SOM) to help businesses, entrepreneurs, and investors make informed growth decisions and target market opportunities. This visually engaging and fully customizable template is compatible with PowerPoint, Keynote, and Google Slides, making it ideal for business planning, market research, and investor presentations.


7 diapositivas
Social Network Infographic Presentation
A Social Network Infographic is a visual representation of data that shows the connections and relationships between individuals, groups, or organizations within a social network. Use this template to illustrate the structure of a social network, and to analyze patterns and trends in the interactions between users. This Infographic includes a visual representation of networking, in graphs and diagram, with icons representing individuals and lines representing connections between them. This template can be customized with different colors, fonts, and text in Powerpoint, Keynote, and Google Slides.


7 diapositivas
Safety Infographics Presentation Template
Our safety infographic is a visual representation of information related to safety, designed to present important safety concepts and practices in a simple and visually appealing way. Safety infographics are used to promote safety in various settings, such as workplaces, public spaces, schools, and homes. This template will present your information in the form of images, charts, graphs, and other visual elements. The main goal of our safety infographics is to help you increase safety awareness and promote safe behavior. Present safety information in an engaging and easily understandable format!


2 diapositivas
Creative Gratitude Slide Presentation
Express gratitude in style with this creative thank-you slide template! Featuring bold typography and modern geometric elements, this design adds a unique touch to your presentations. Ideal for business pitches, creative projects, and professional meetings. Fully customizable and compatible with PowerPoint, Keynote, and Google Slides for effortless personalization.


8 diapositivas
Health and Safety Training
Create impactful safety briefings with this visual slide designed around a caution-sign layout. Perfect for outlining training modules, compliance steps, or workplace hazard procedures, it presents four key points using icons and color-coded elements. Fully customizable in PowerPoint, Keynote, and Google Slides.


6 diapositivas
Future Trends in Tech Presentation
Forecast innovation with clarity using this Future Trends in Tech Presentation. Designed with a modern silhouette head and brain visualization, this slide emphasizes key trend comparisons using icon-labeled callouts and bold percentage highlights. Ideal for tech forecasting, AI adoption, or market prediction topics. Fully editable in PowerPoint, Keynote, and Google Slides—available in both light and dark modes.


21 diapositivas
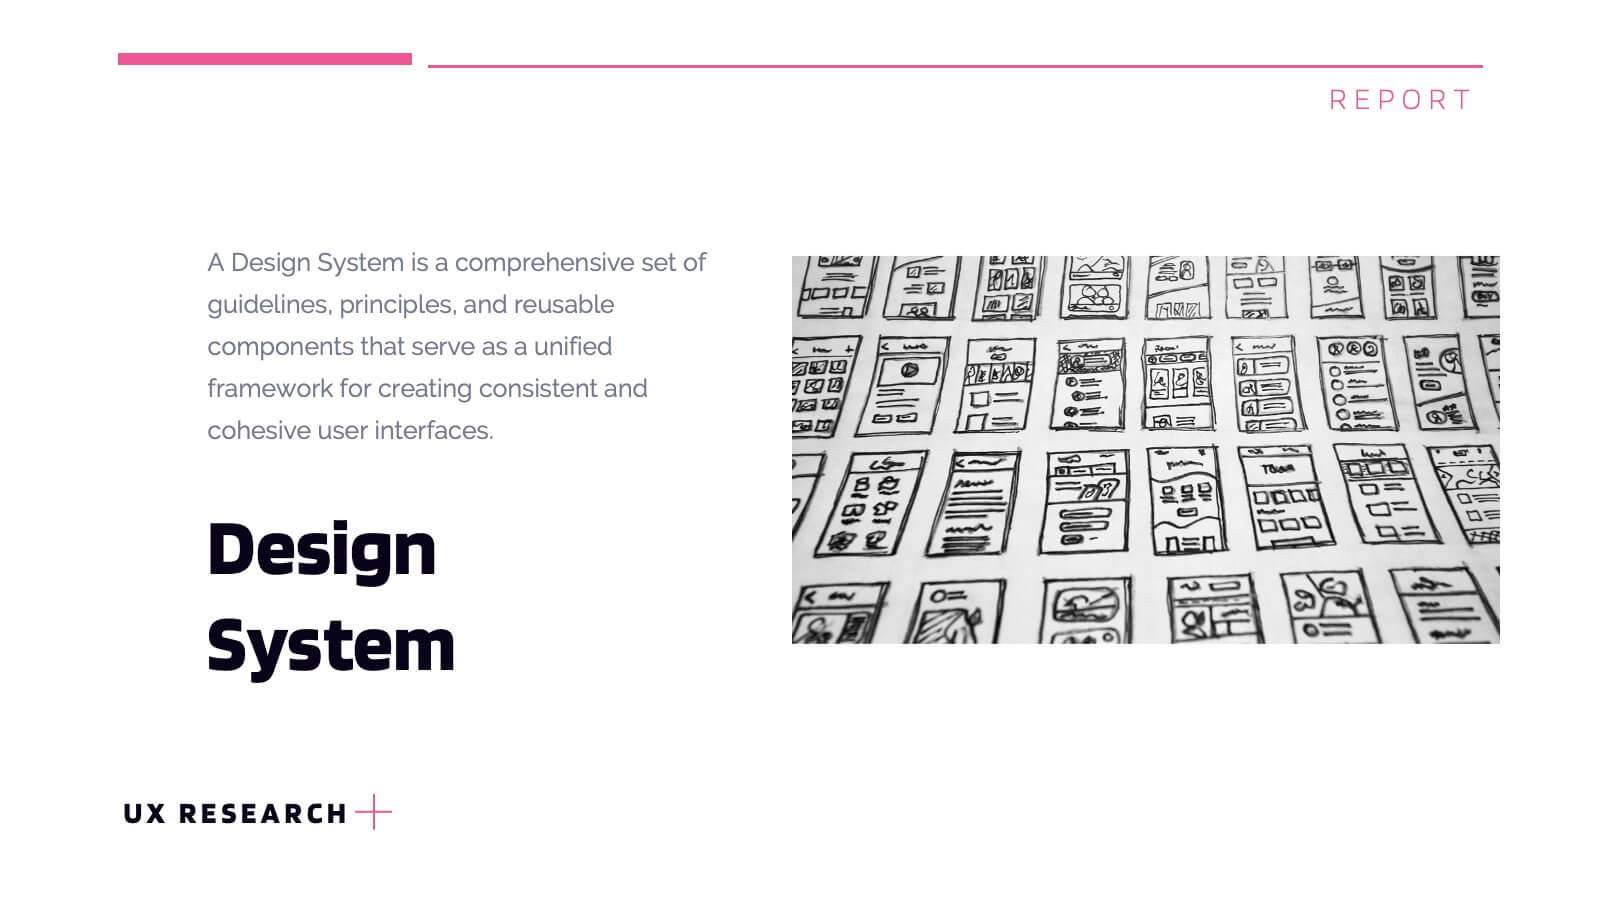
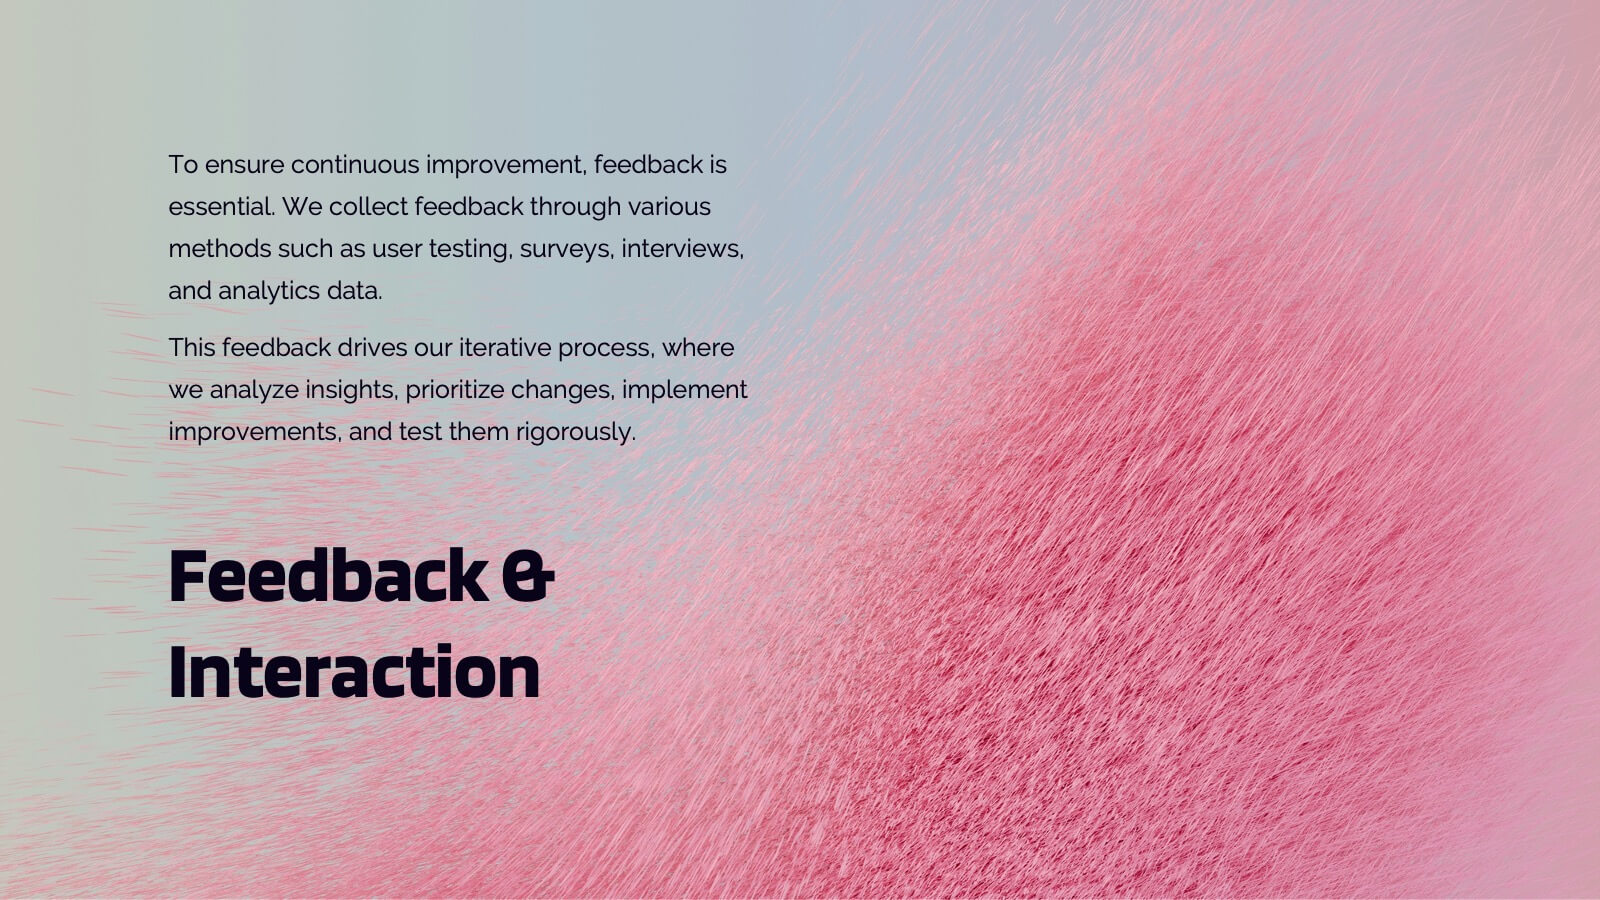
Lumascend UX Research Report Presentation
Present your UX research findings with clarity using this engaging and organized template! Covering key areas like user personas, wireframes, testing, and interaction design, it ensures all aspects of your design process are communicated effectively. Perfect for UX teams, stakeholders, or client presentations, this template works seamlessly with PowerPoint, Keynote, and Google Slides.


6 diapositivas
Organizational Structure Infographic
Organizational structure refers to the way in which an organization is structured and how its roles, responsibilities, and functions are defined and coordinated. This infographic template provides a framework for how individuals and teams work together to achieve the organization's goals. This infographic visually represents the hierarchy, roles, and relationships within an organization. This template allows you to provides a clear overview of how different departments, teams, and individuals are organized and how they interact with each other. Fully customizable and compatible with Powerpoint, Keynote, and Google Slides.