
Características


¿Tienes alguna pregunta?
Recomendar


4 diapositivas
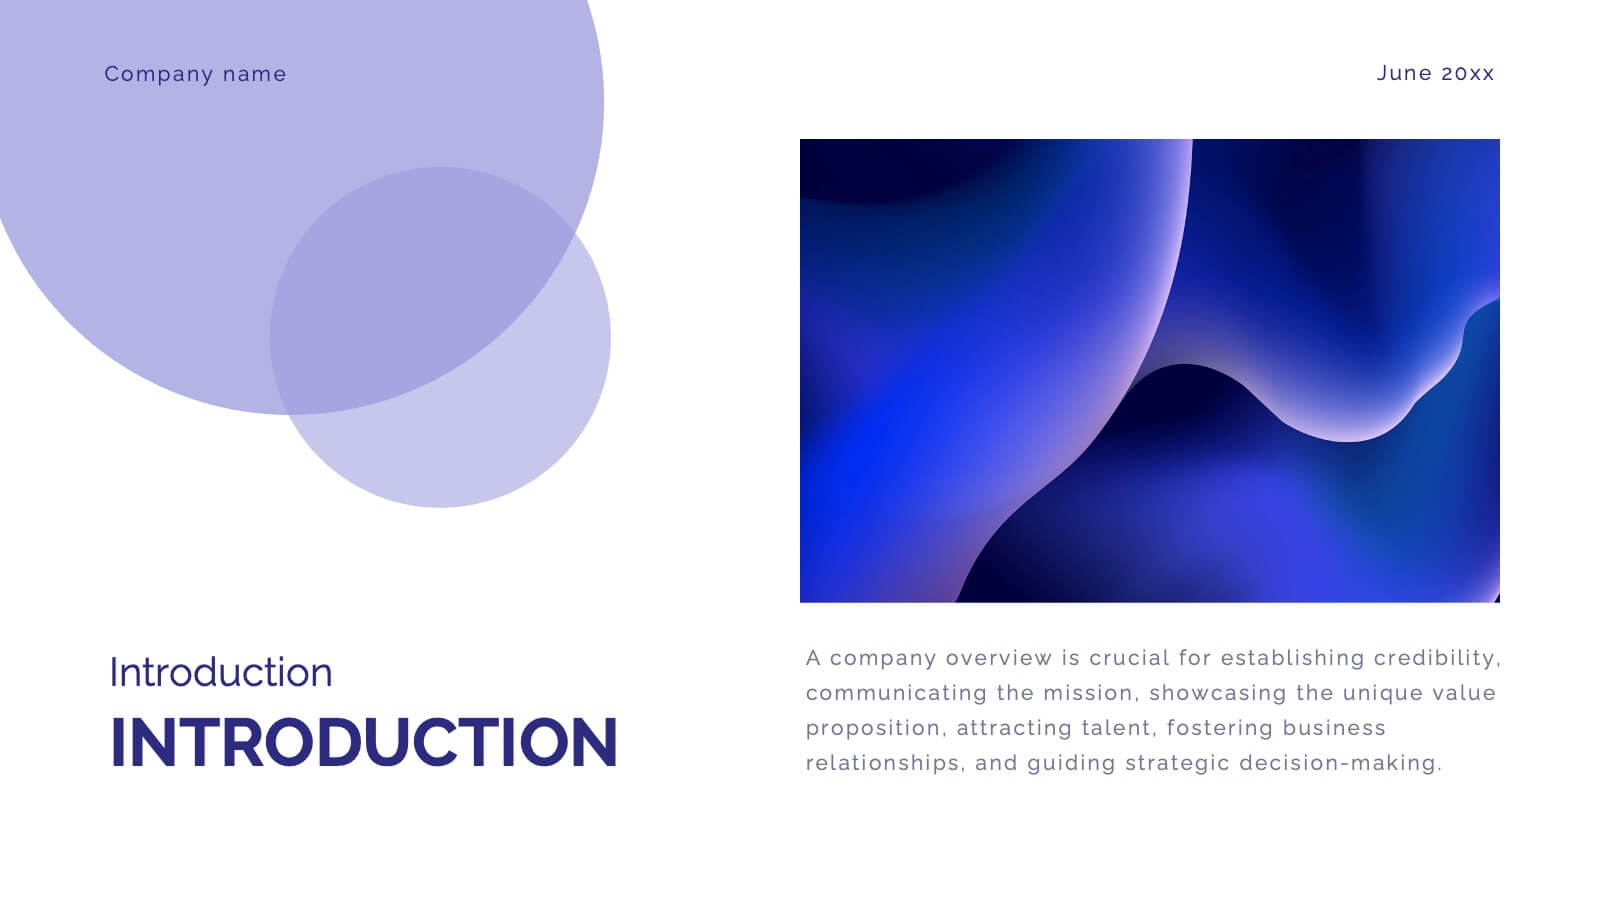
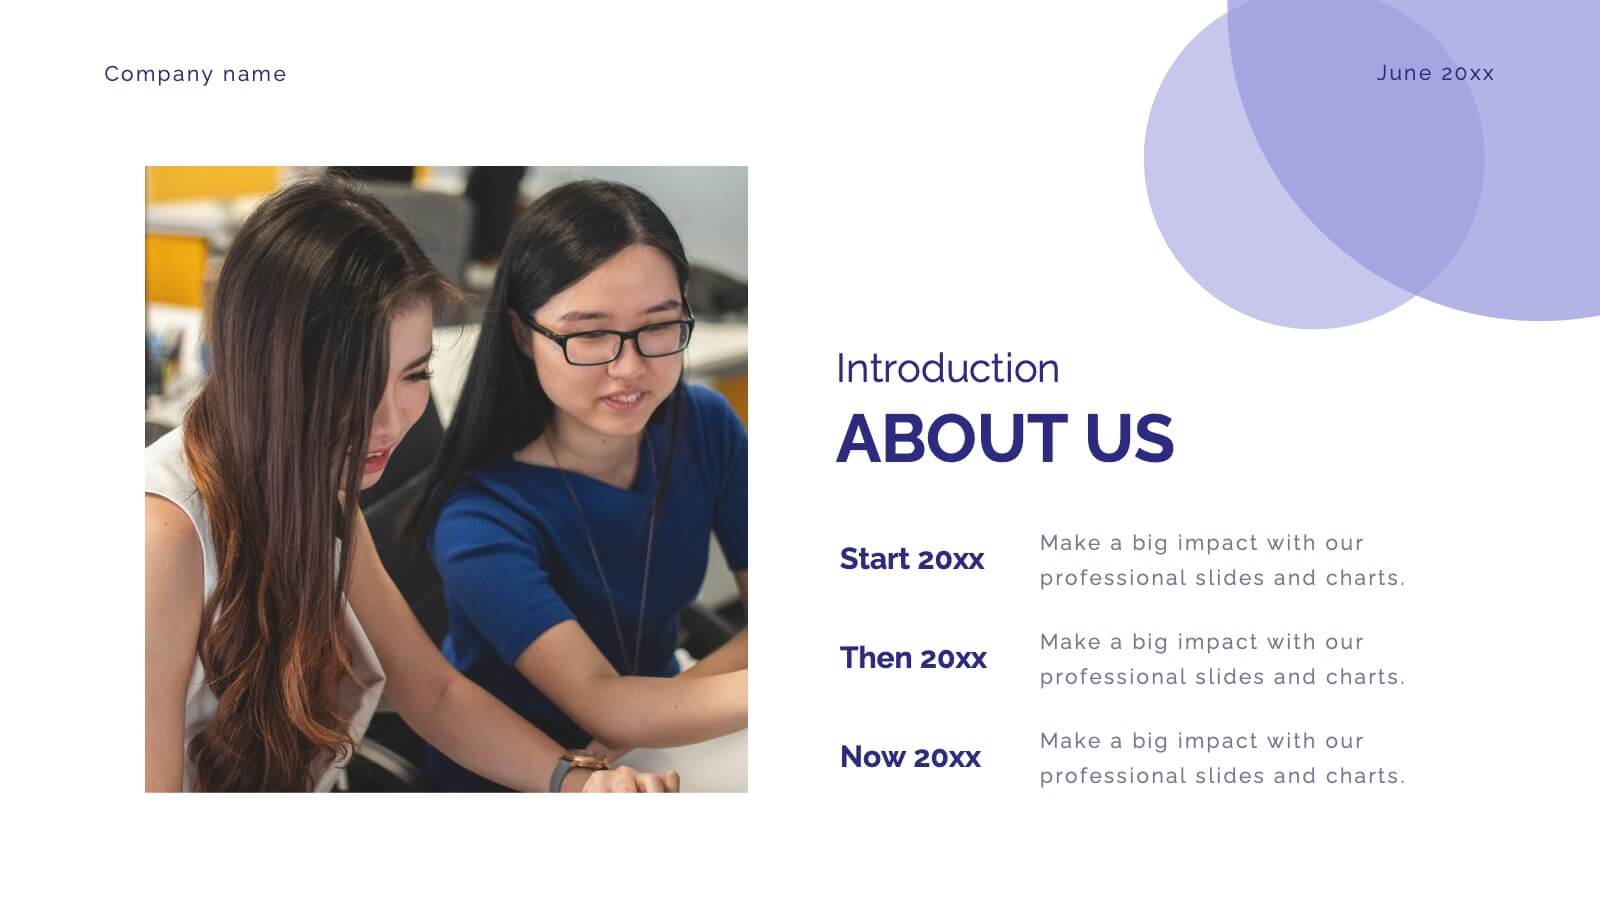
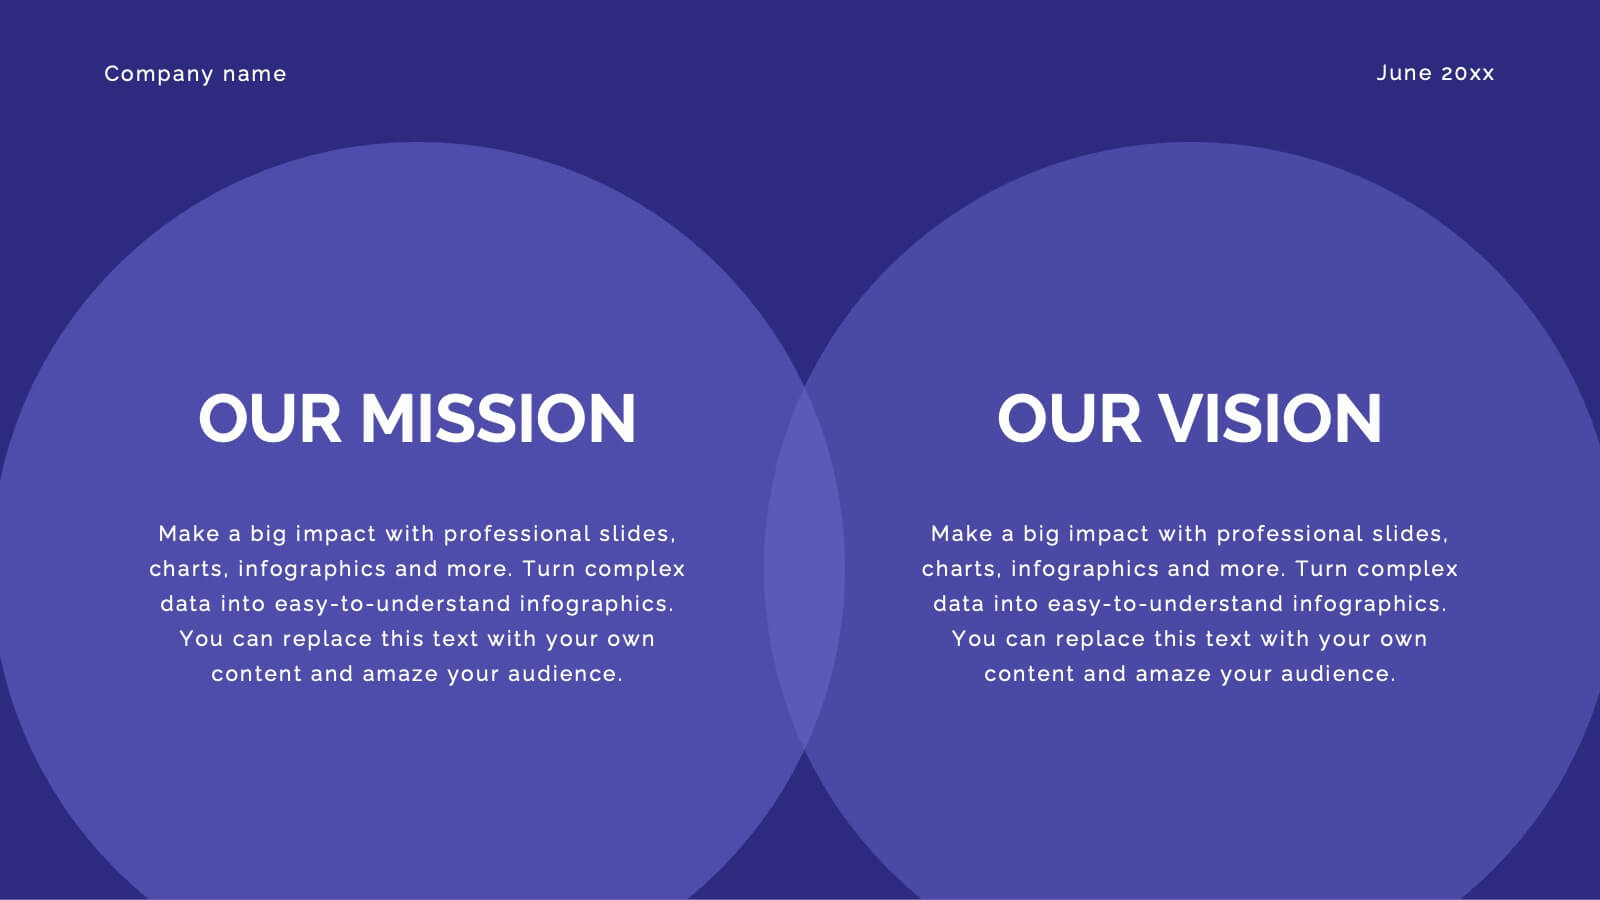
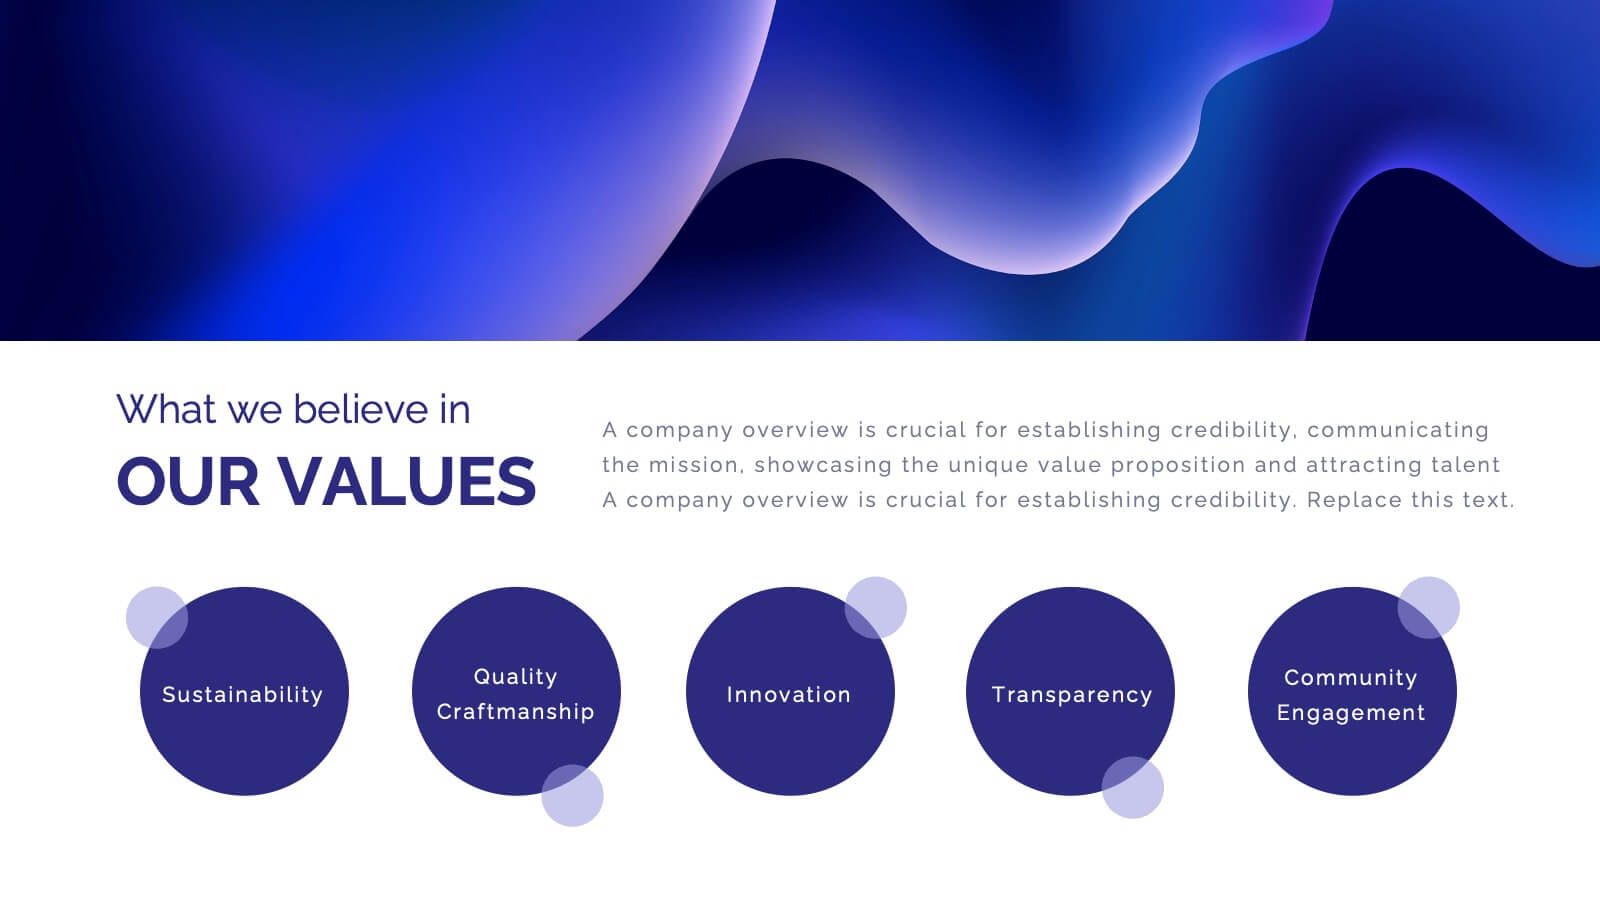
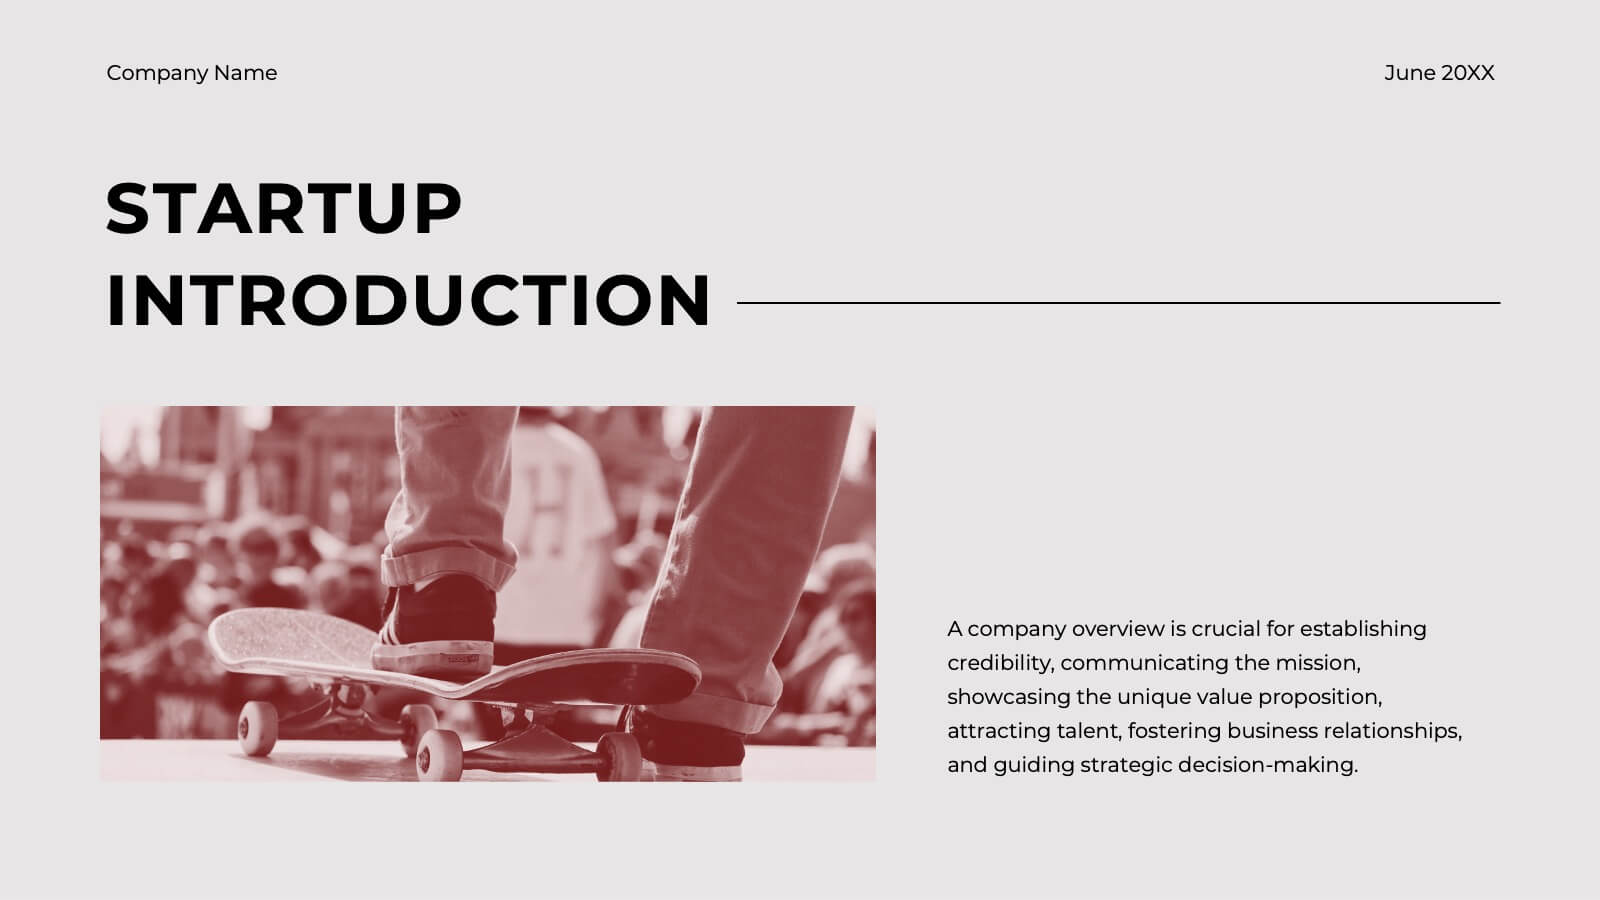
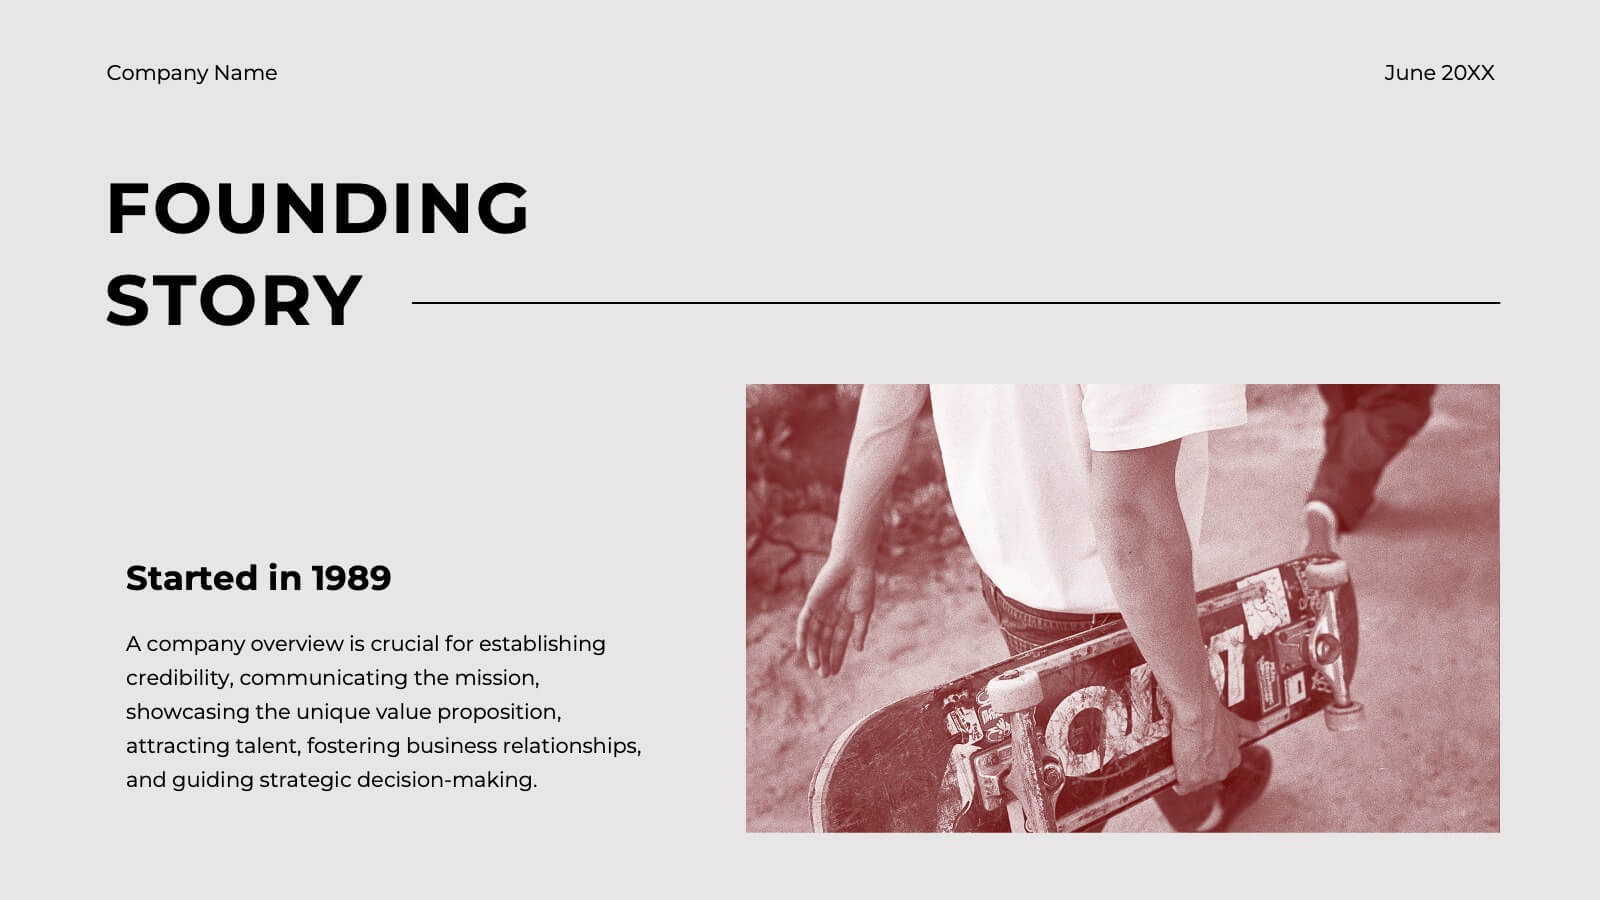
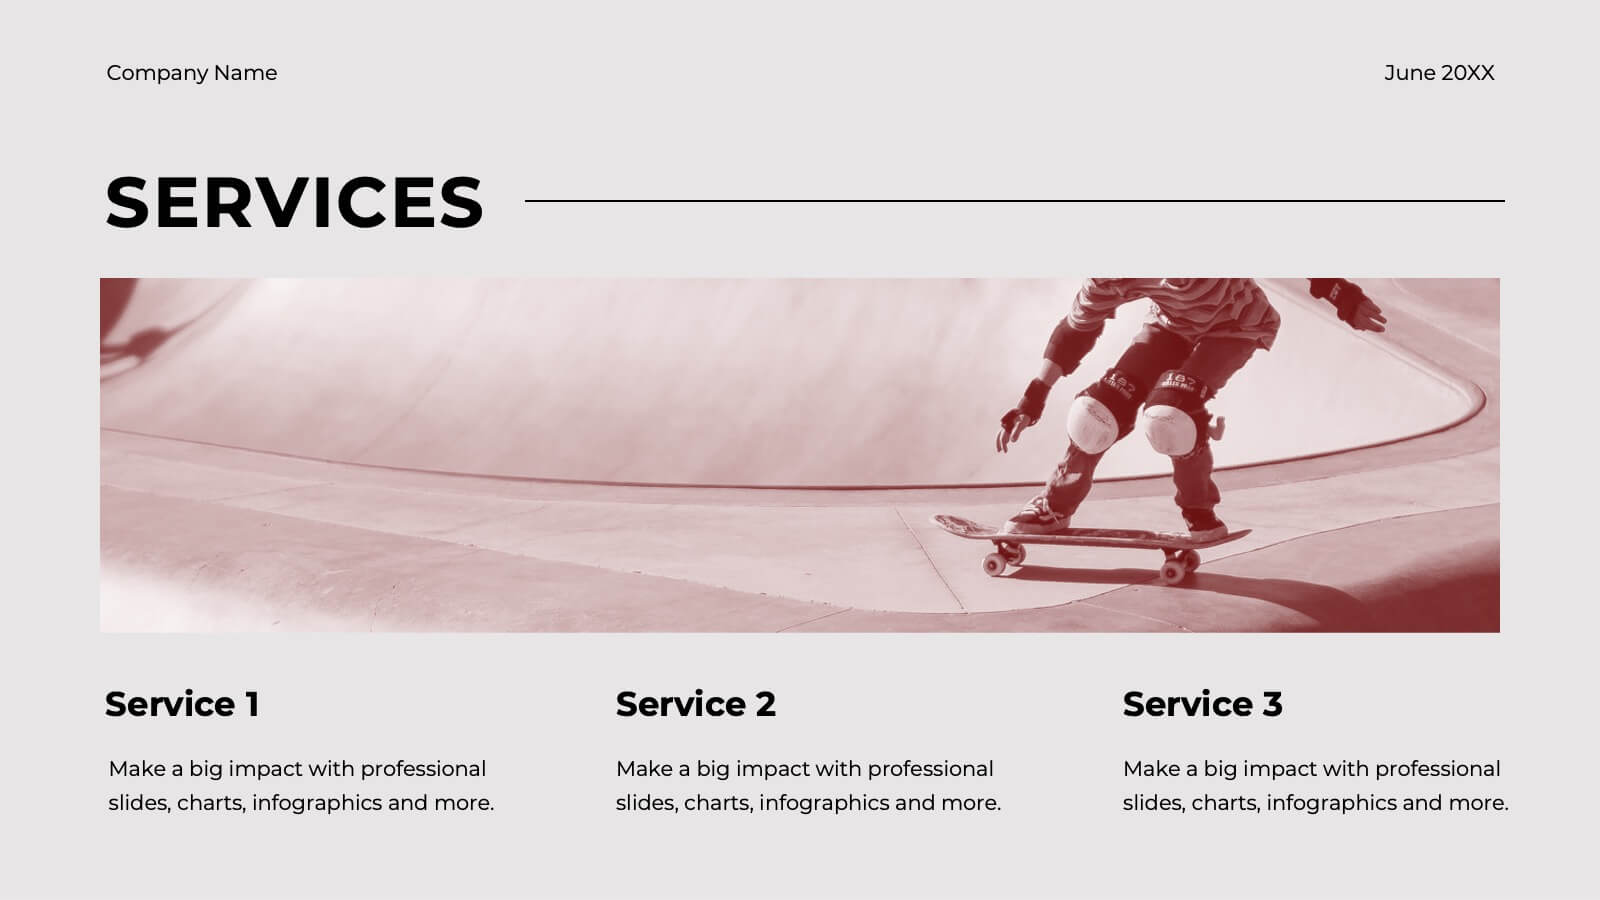
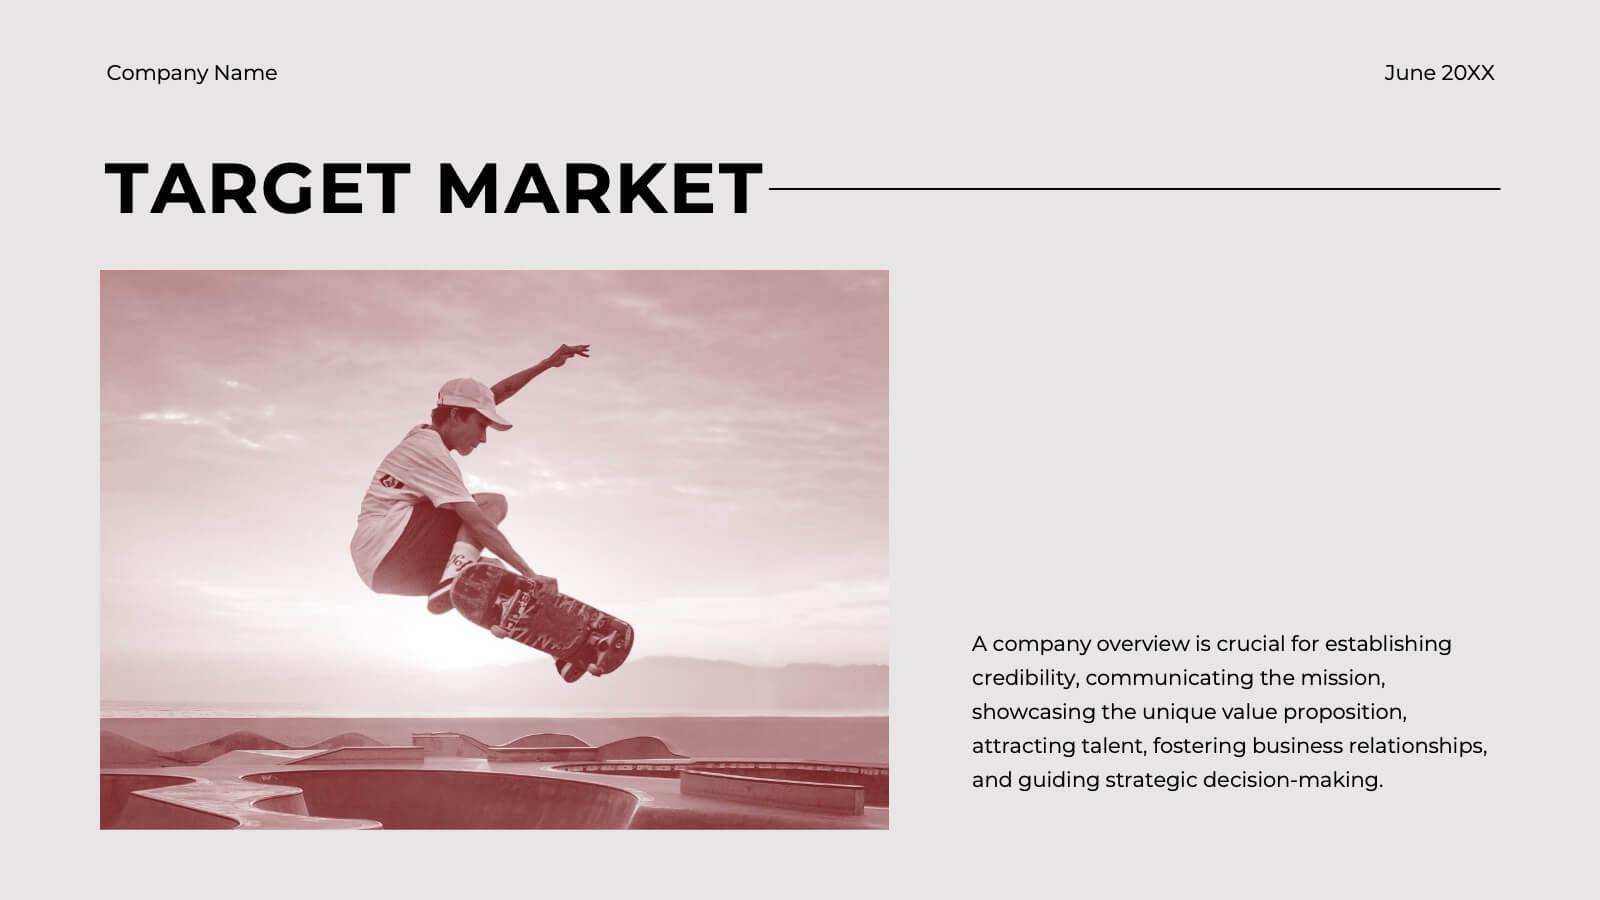
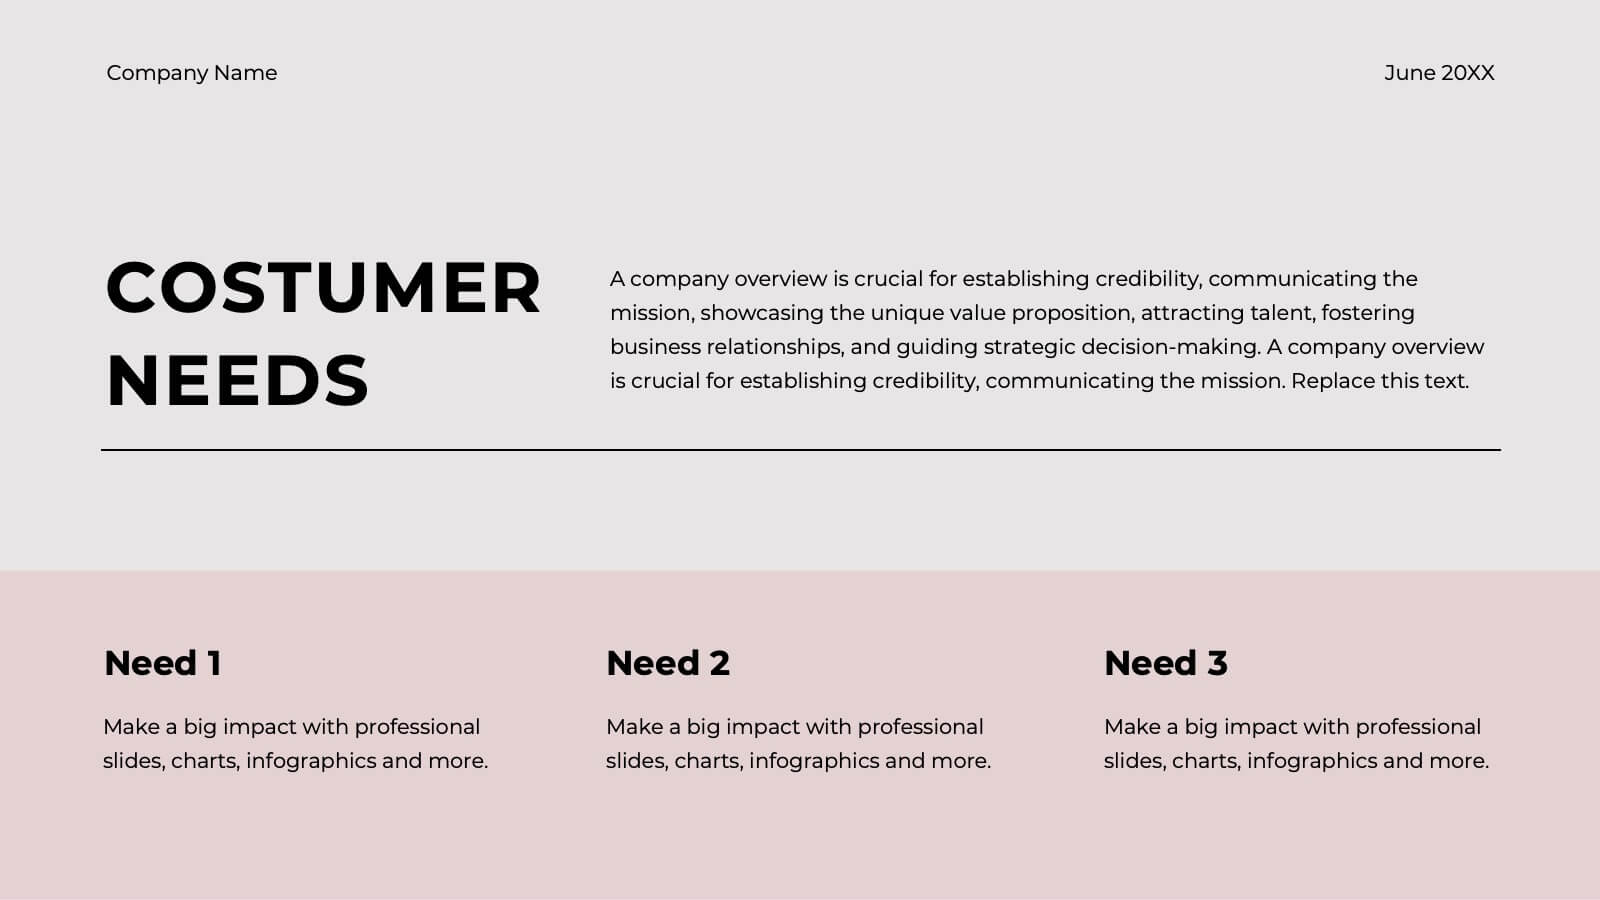
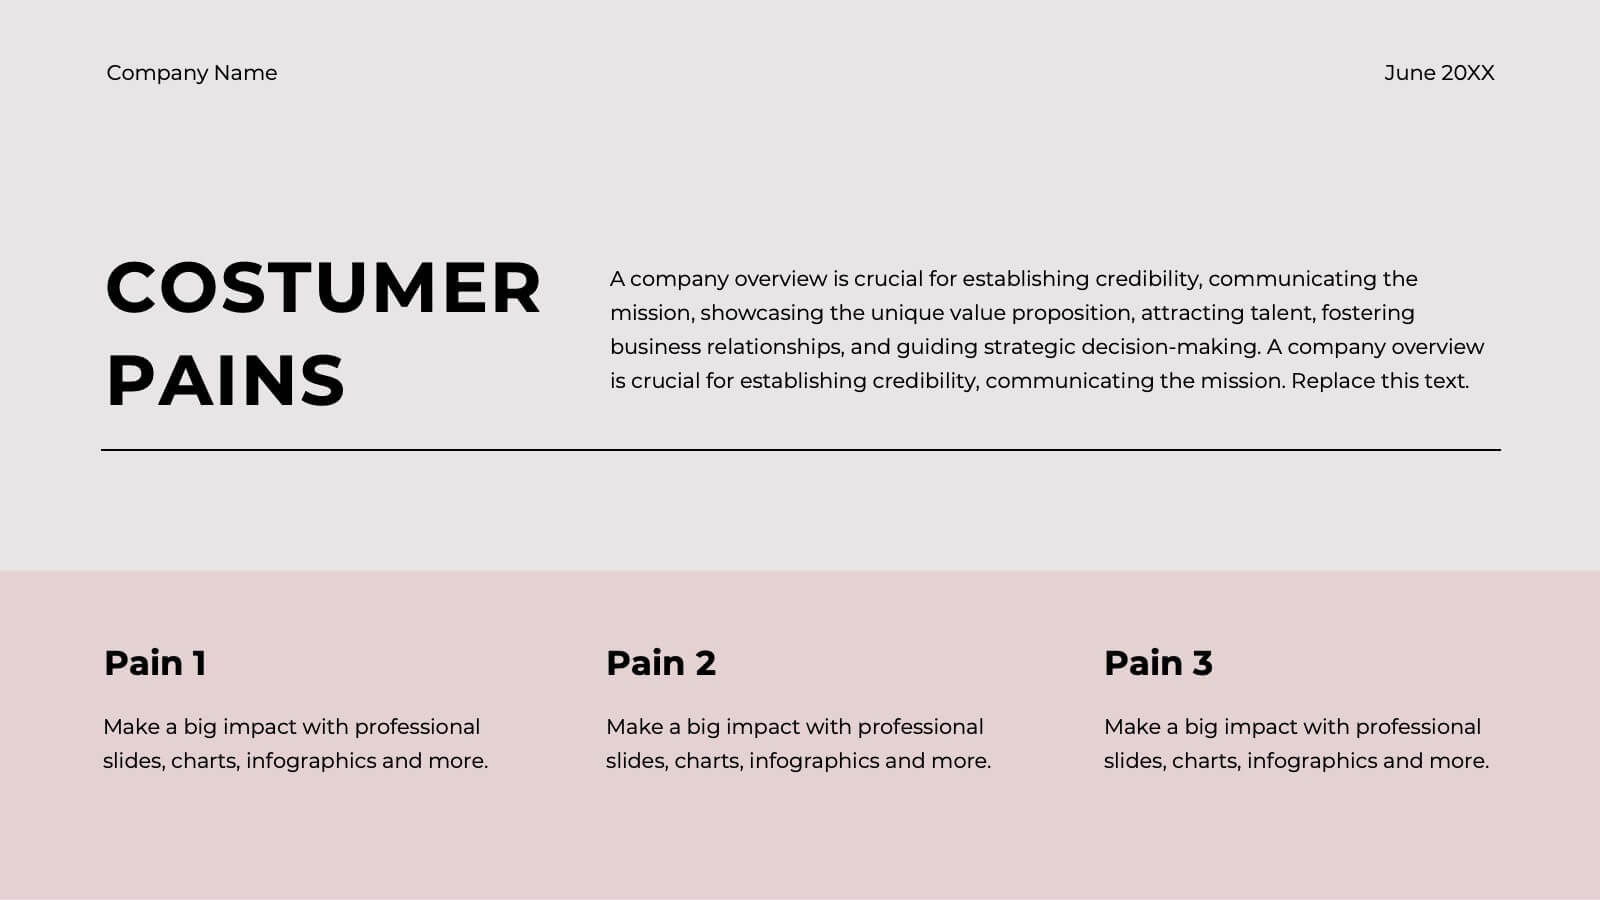
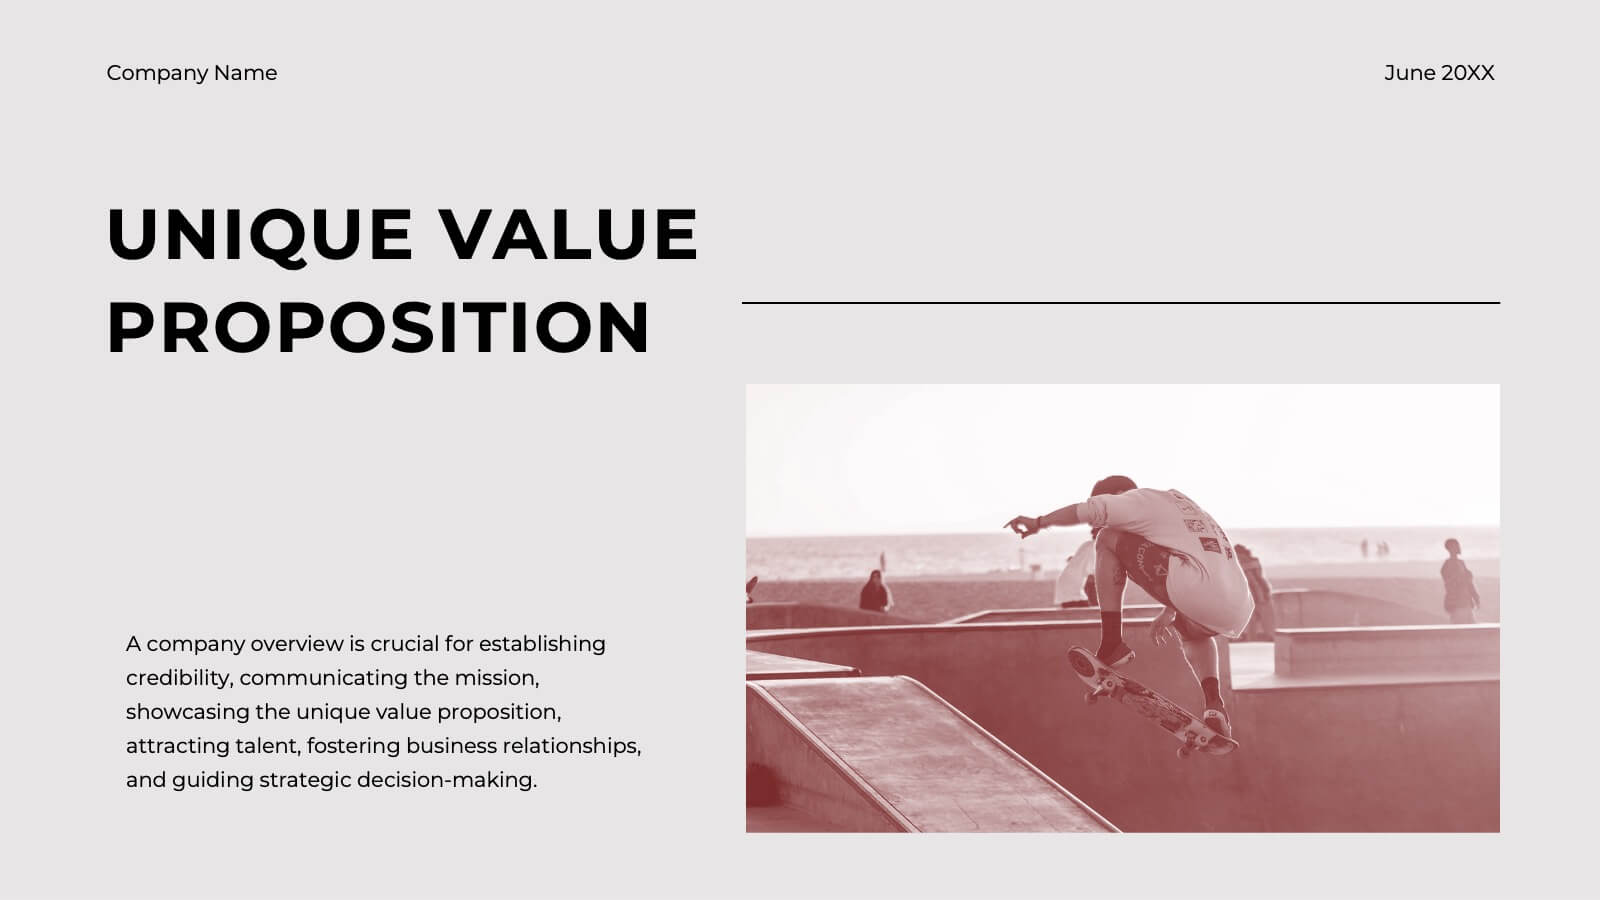
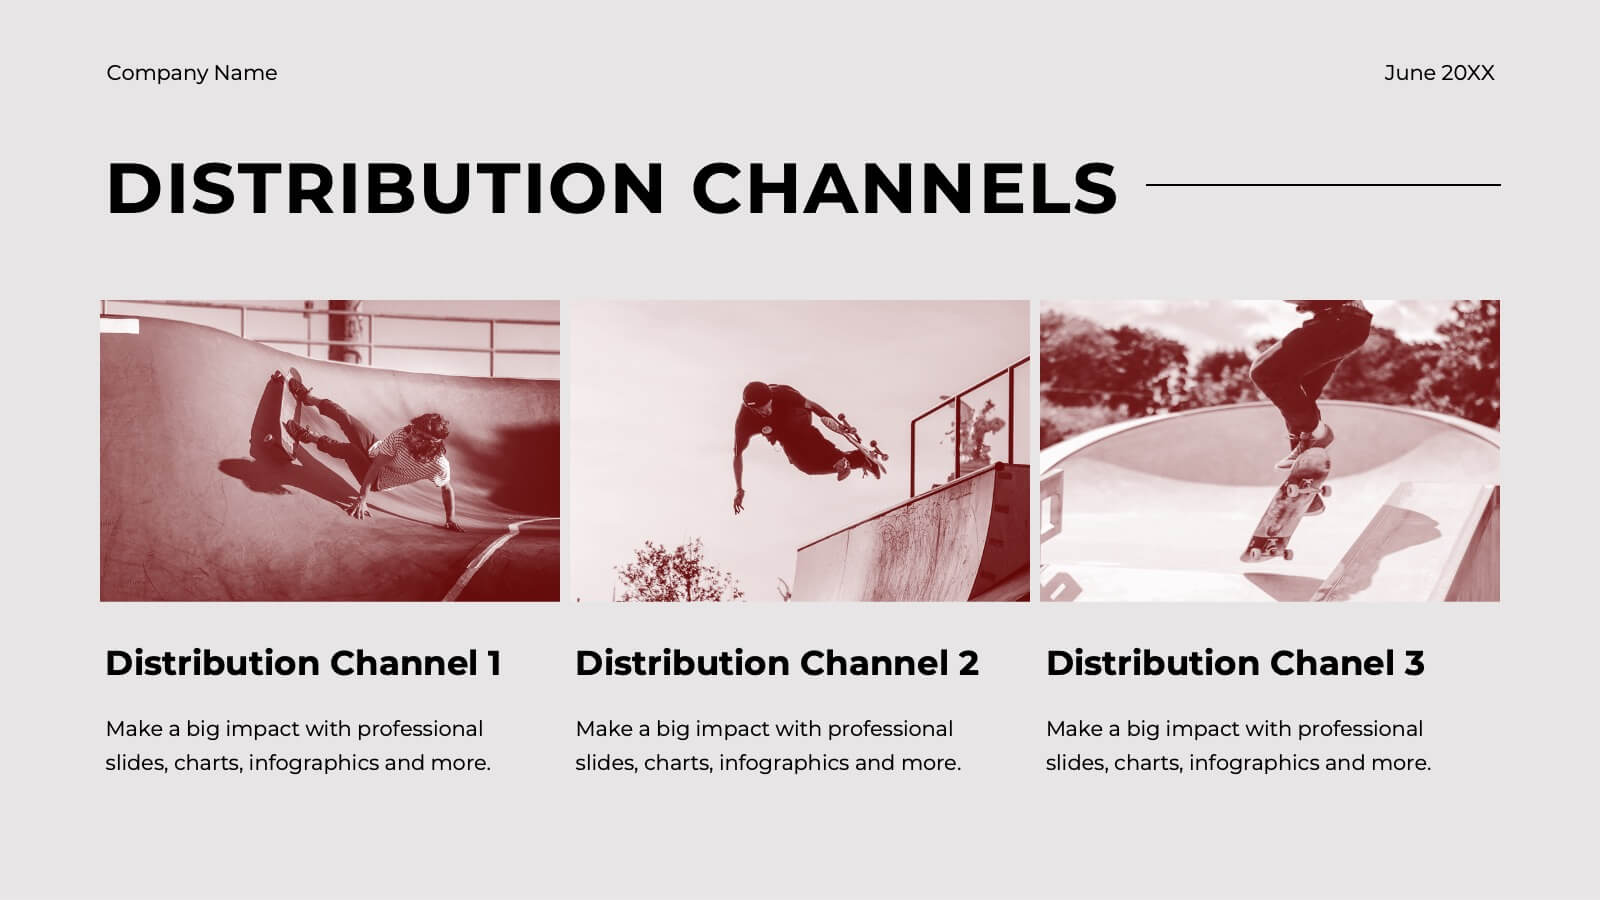
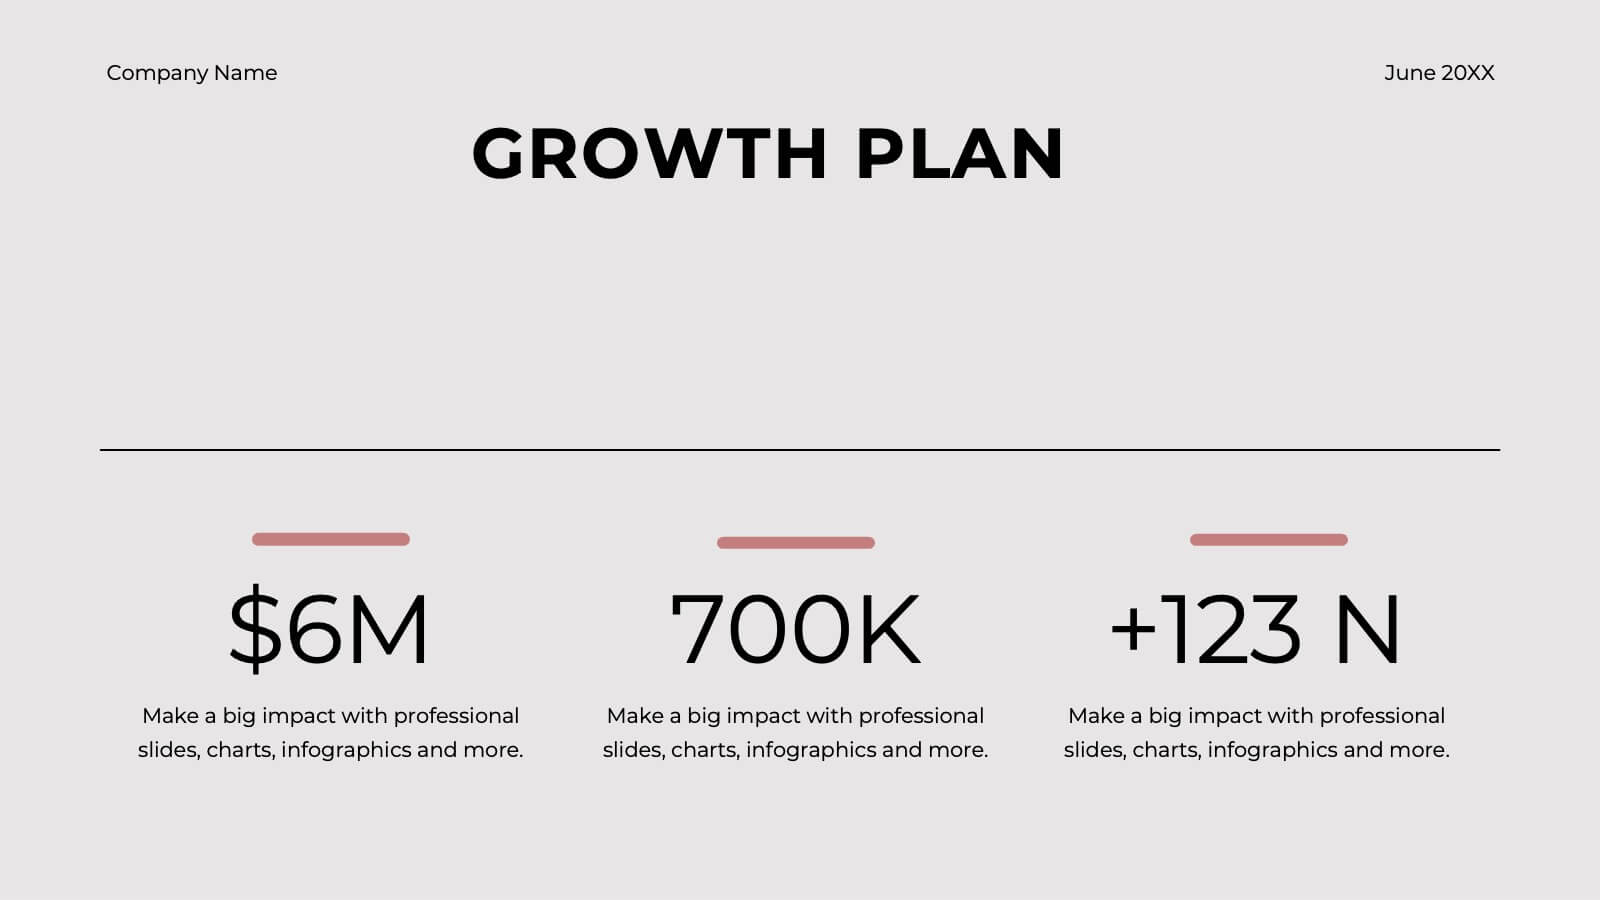
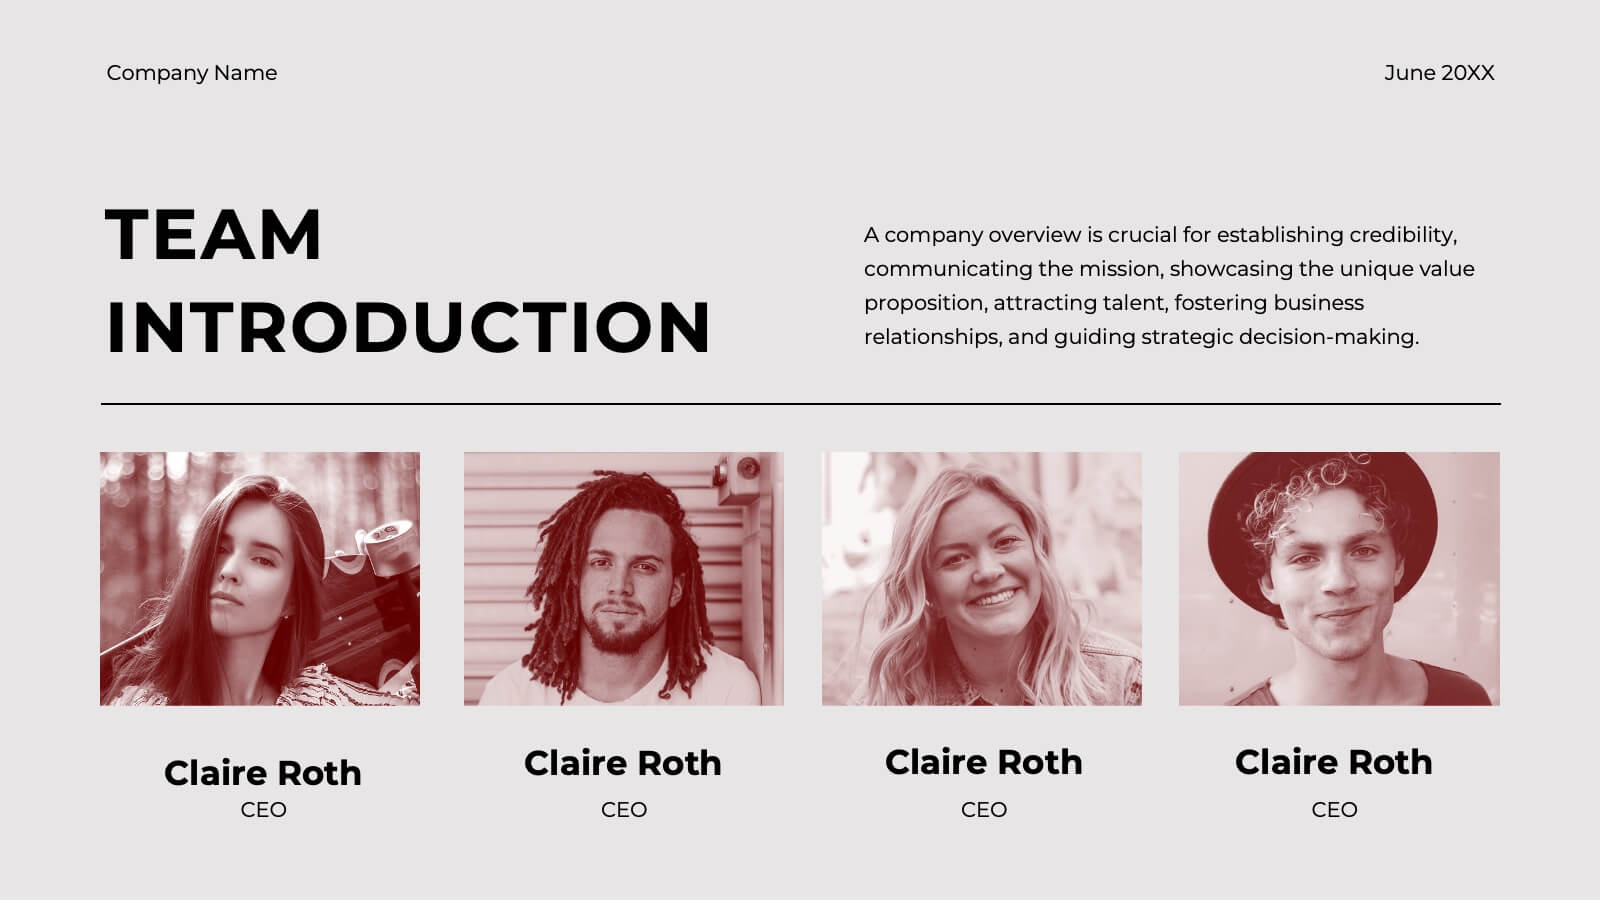
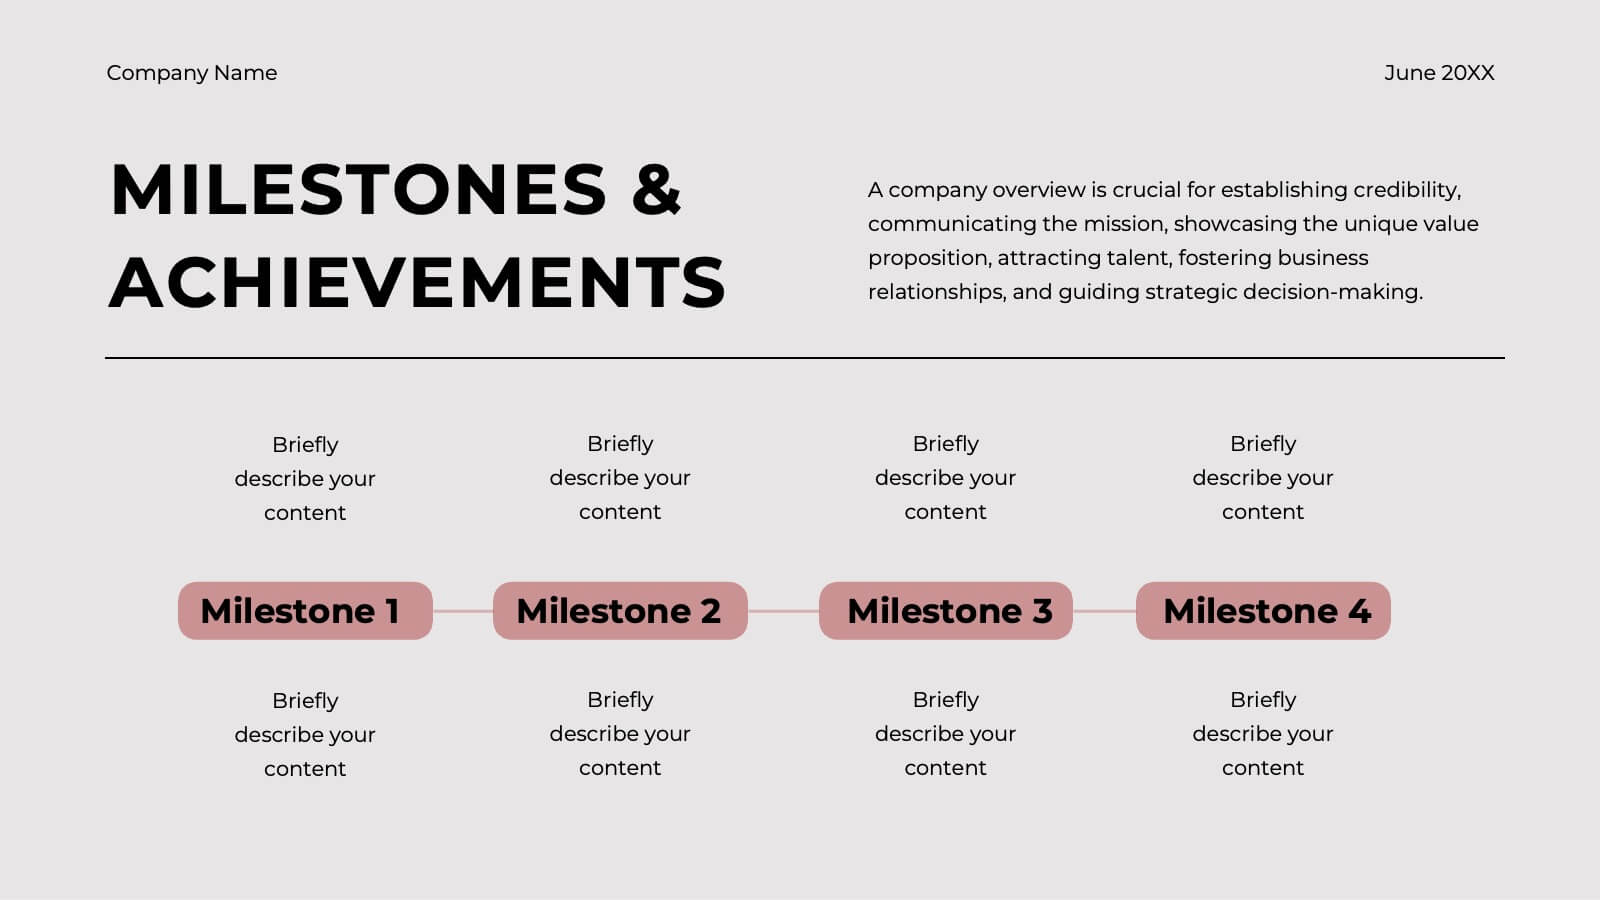
Minimal Company Profile Deck Presentation
Make a bold first impression with this sleek, minimal layout designed to showcase your company’s vision, services, and team with clarity and style. Perfect for startups or established brands, it balances professionalism and creativity effortlessly. Fully editable and compatible with PowerPoint, Keynote, and Google Slides for seamless customization.


12 diapositivas
Personal Portfolio Presentation
Our Personal Portfolio Presentation template is designed for professionals looking to make a strong impression with a sleek and engaging portfolio. This comprehensive template provides an excellent framework to showcase your personal brand, professional journey, and achievements. The opening slide, with your name boldly presented, acts as your introduction. It's followed by a 'Get to know me' section that offers a glimpse into your personality and work ethic. The 'Skills' slide is a visually impactful way to present your competencies, while the 'Experience' slide chronologically outlines your professional milestones. Featuring sections for detailed case studies, showcased projects, and educational background, this template helps you tell your story in a cohesive and captivating manner. The 'Recognitions' slide allows you to highlight awards and honors, adding credibility to your profile. Ending with a compelling 'Let's work together!' call-to-action, this template is adaptable to PowerPoint, Keynote, and Google Slides, perfect for anyone looking to stand out in their field.

20 diapositivas
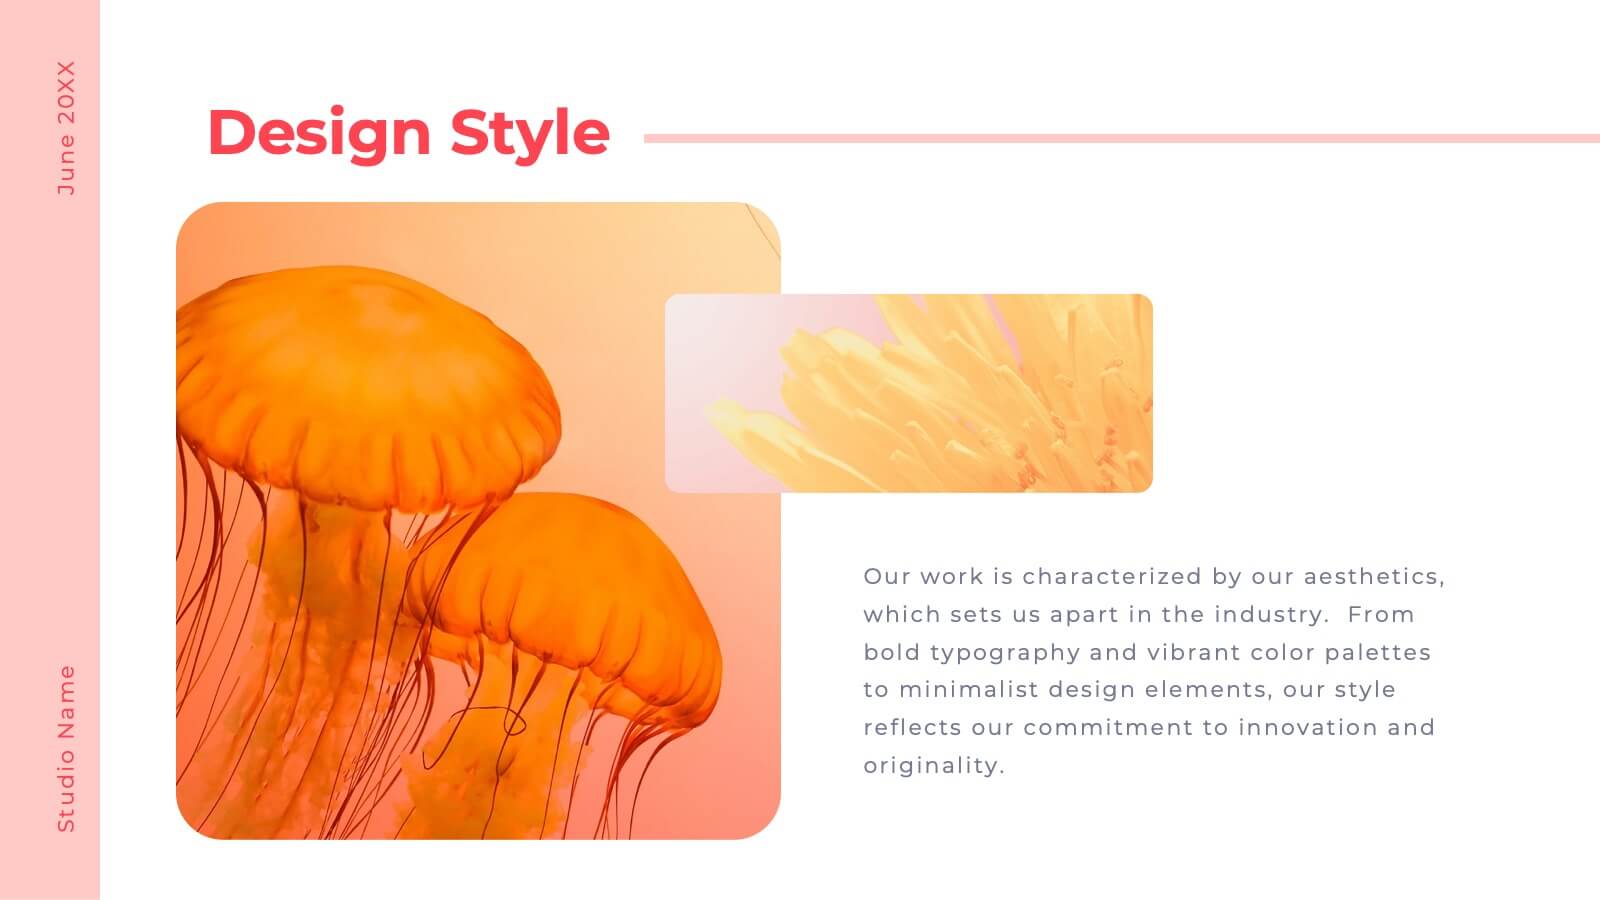
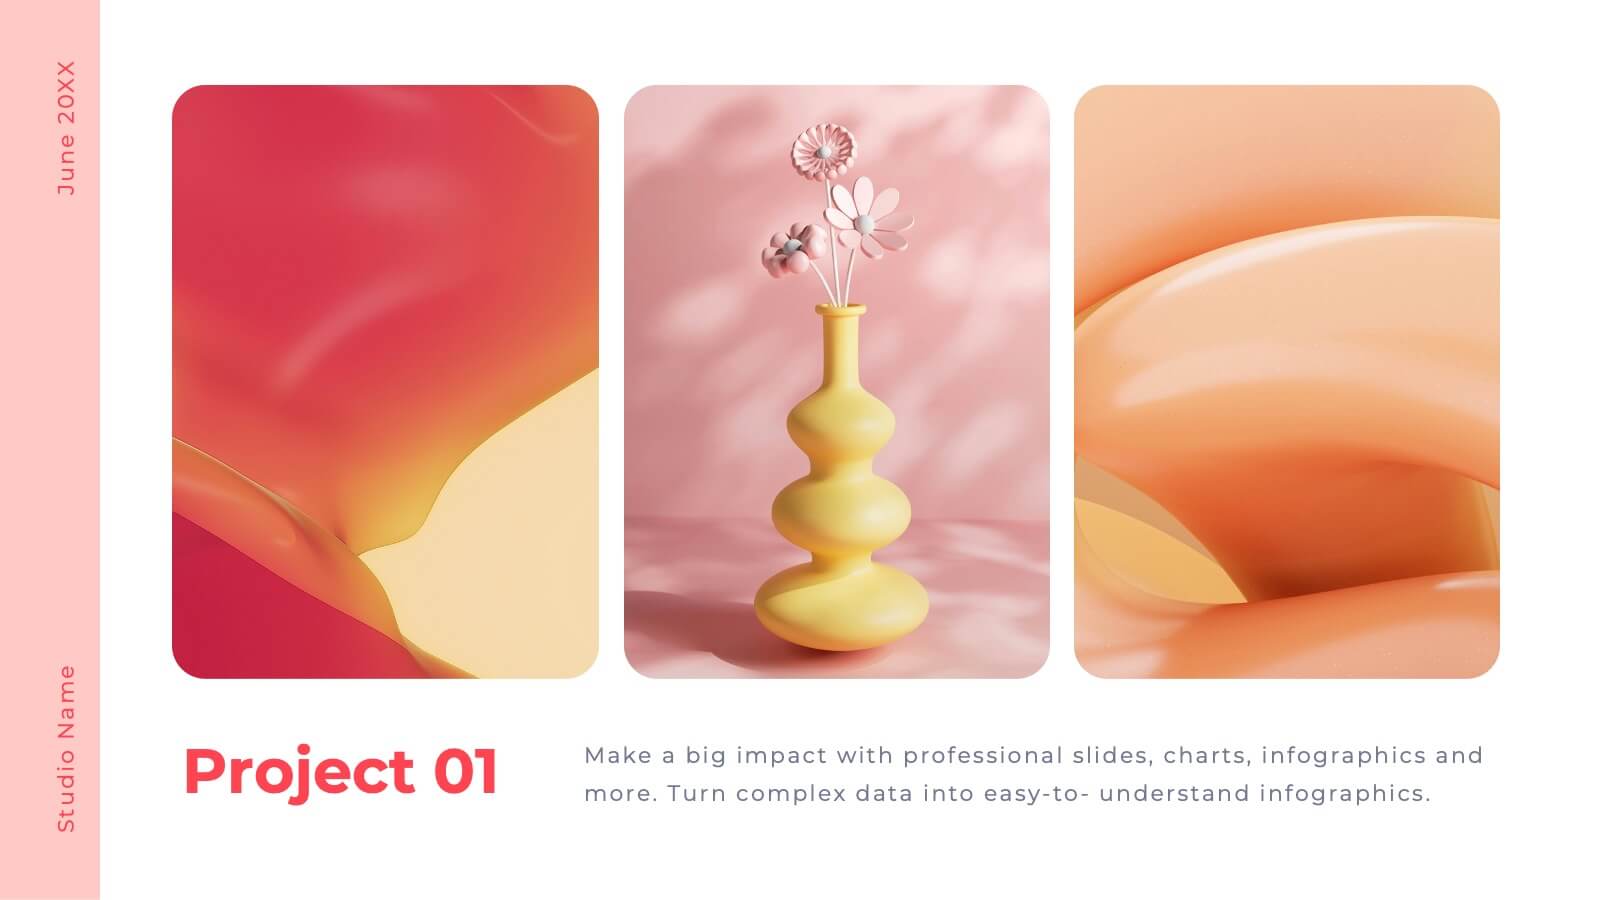
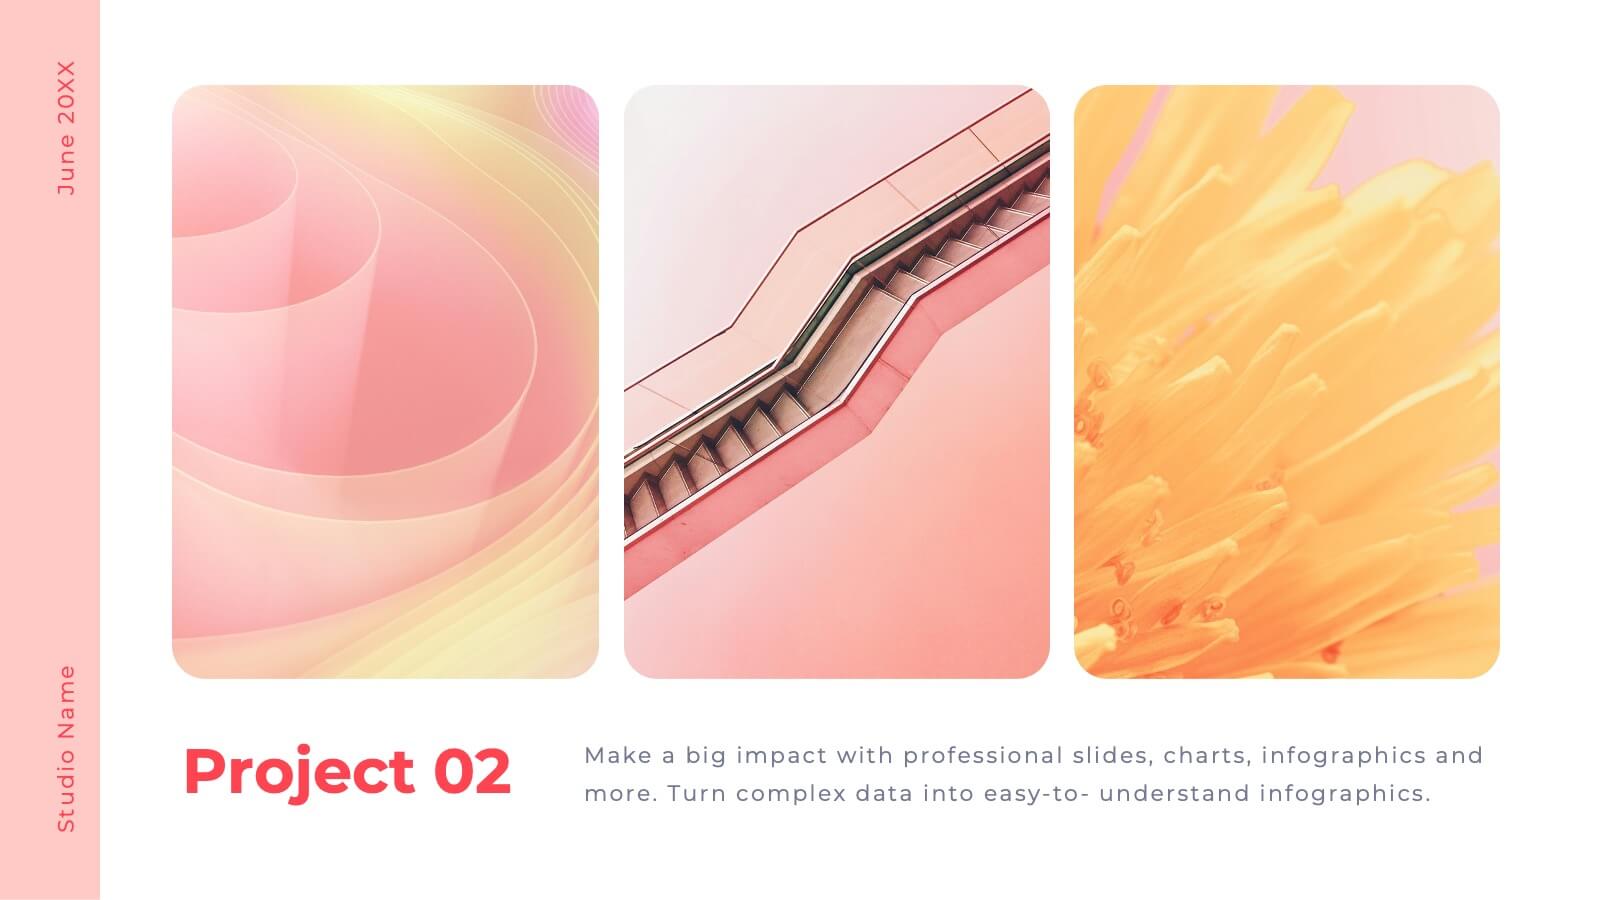
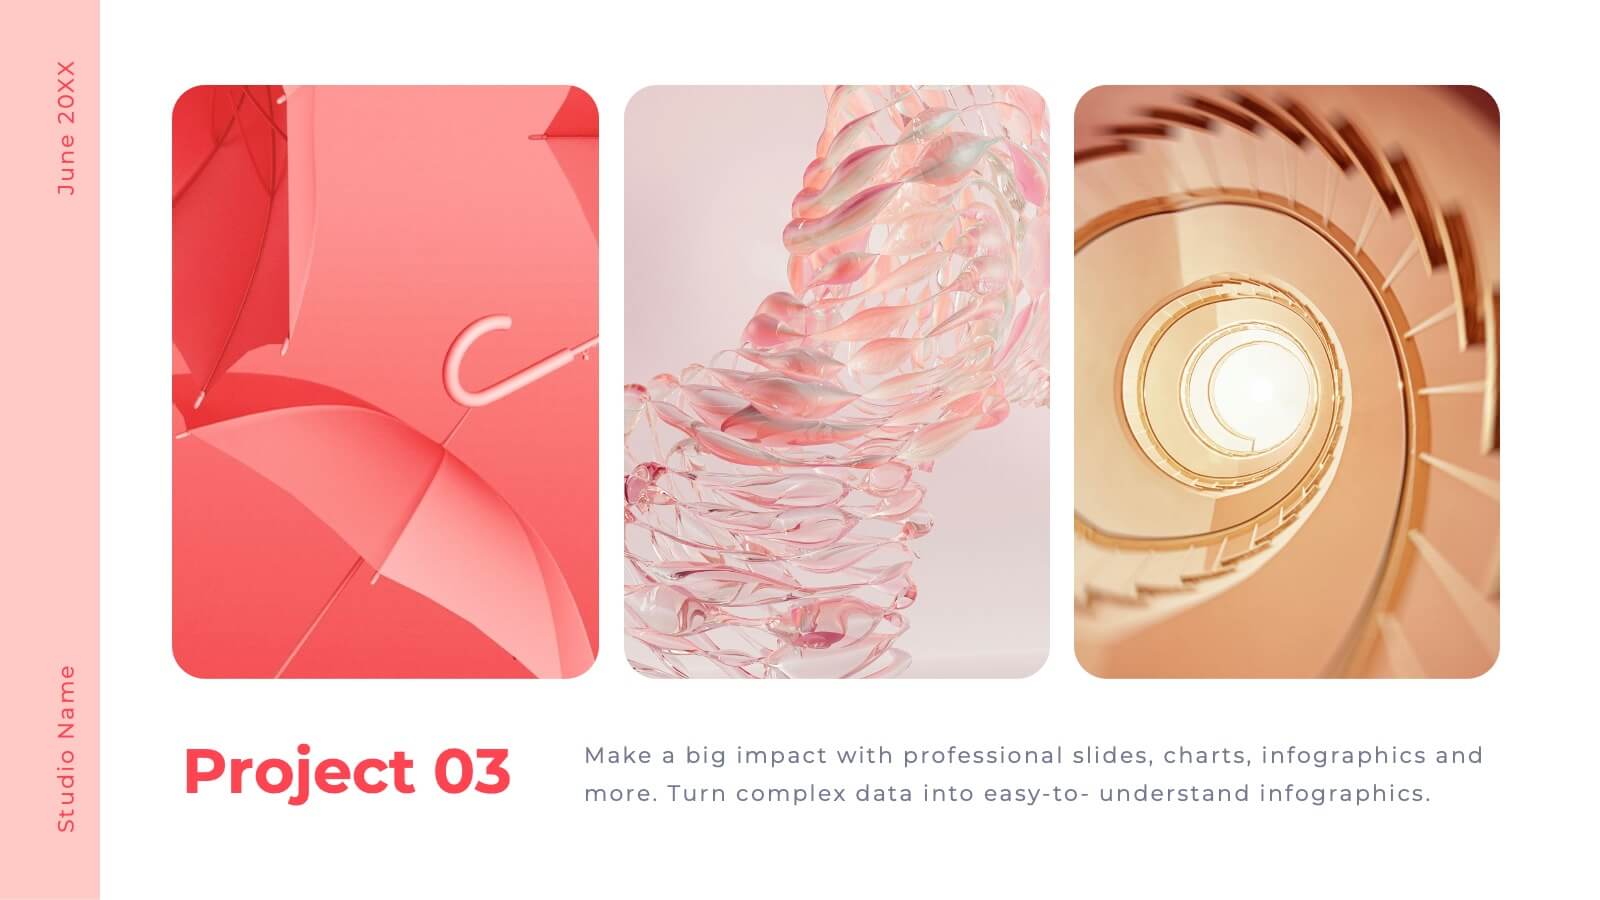
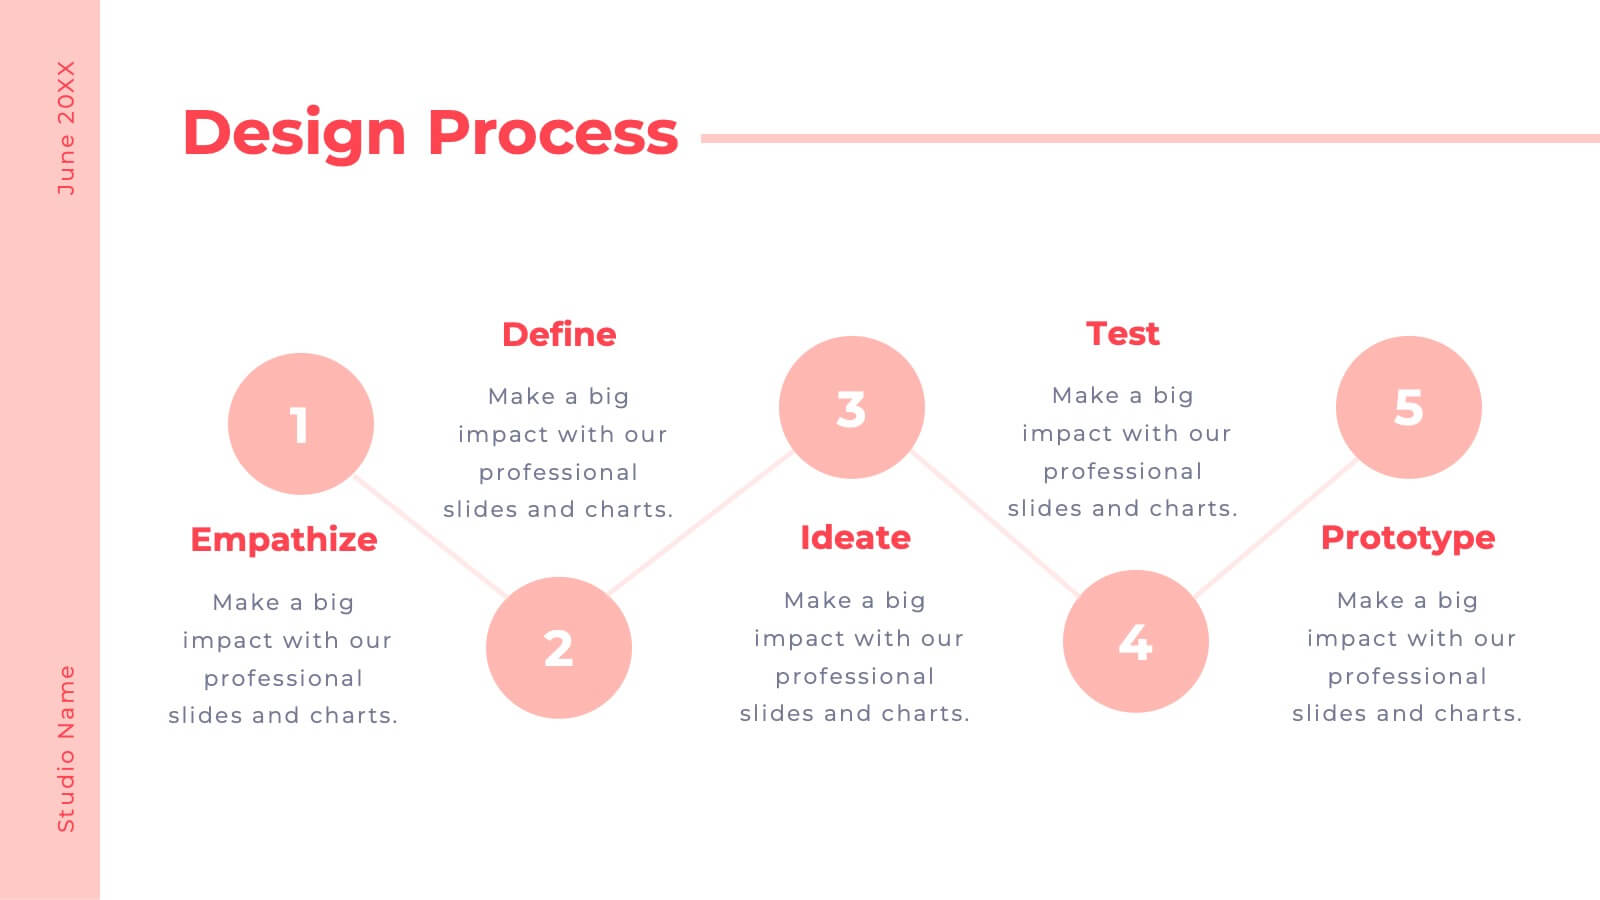
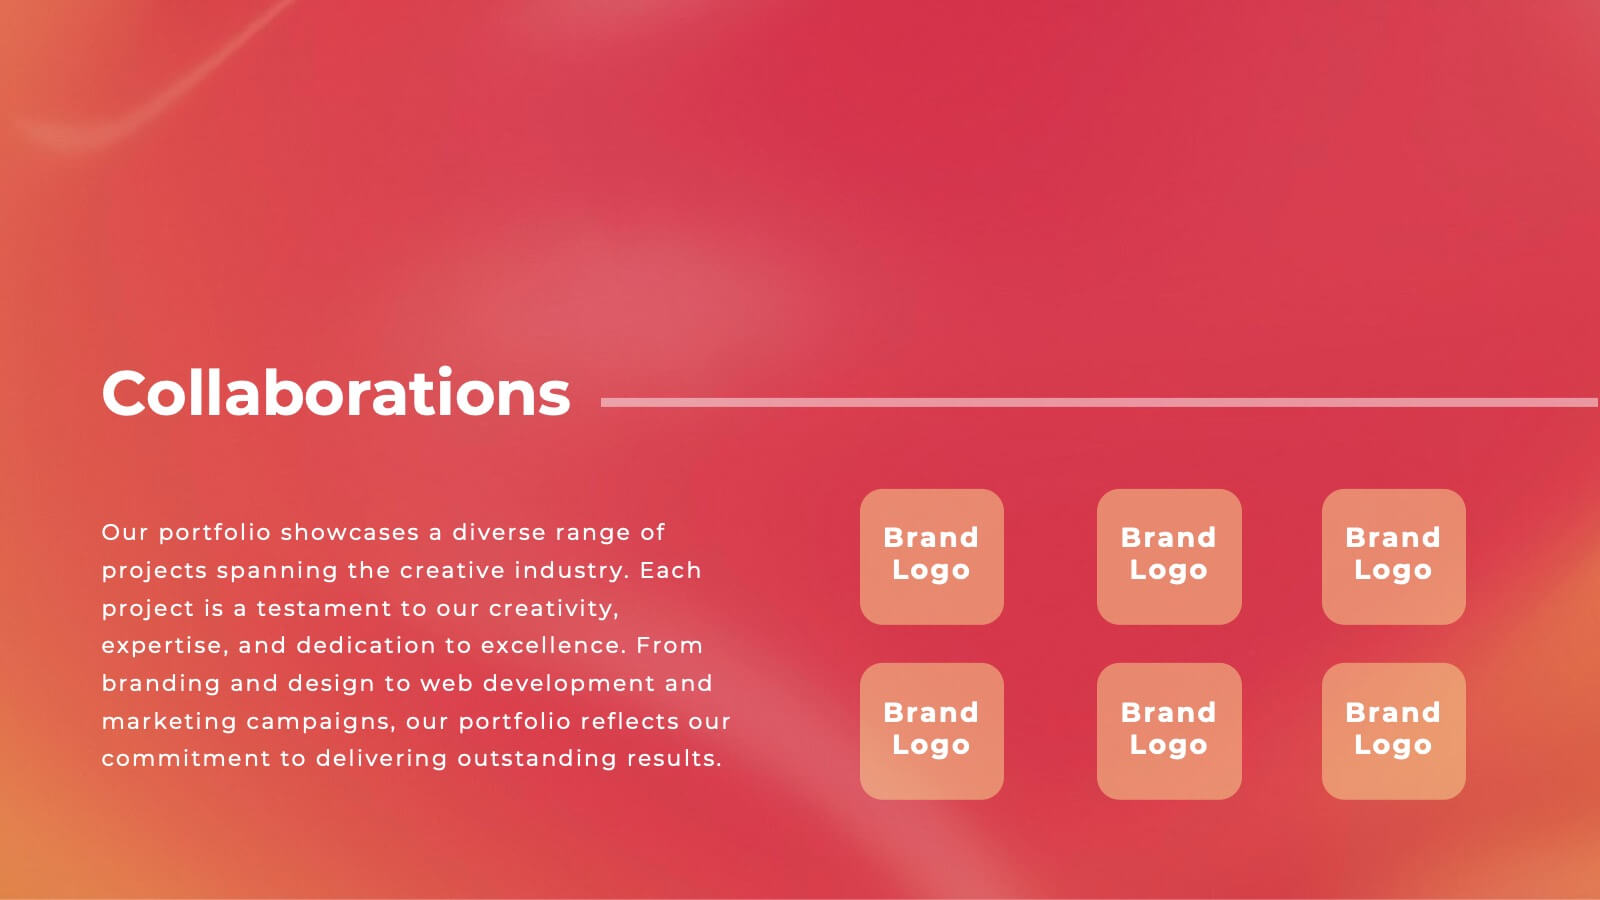
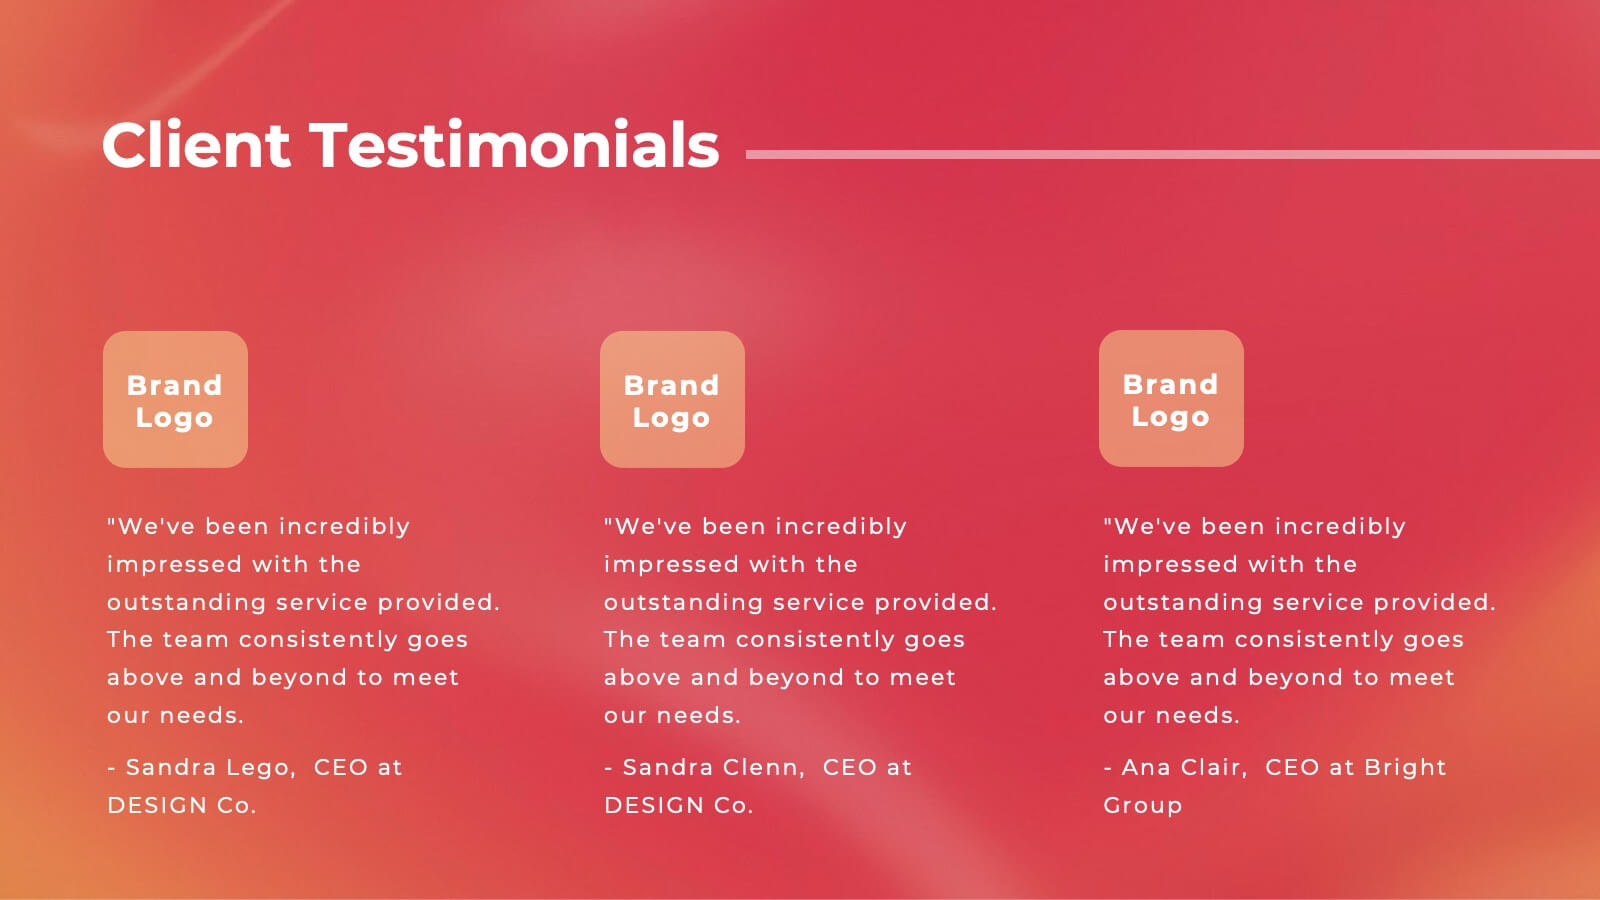
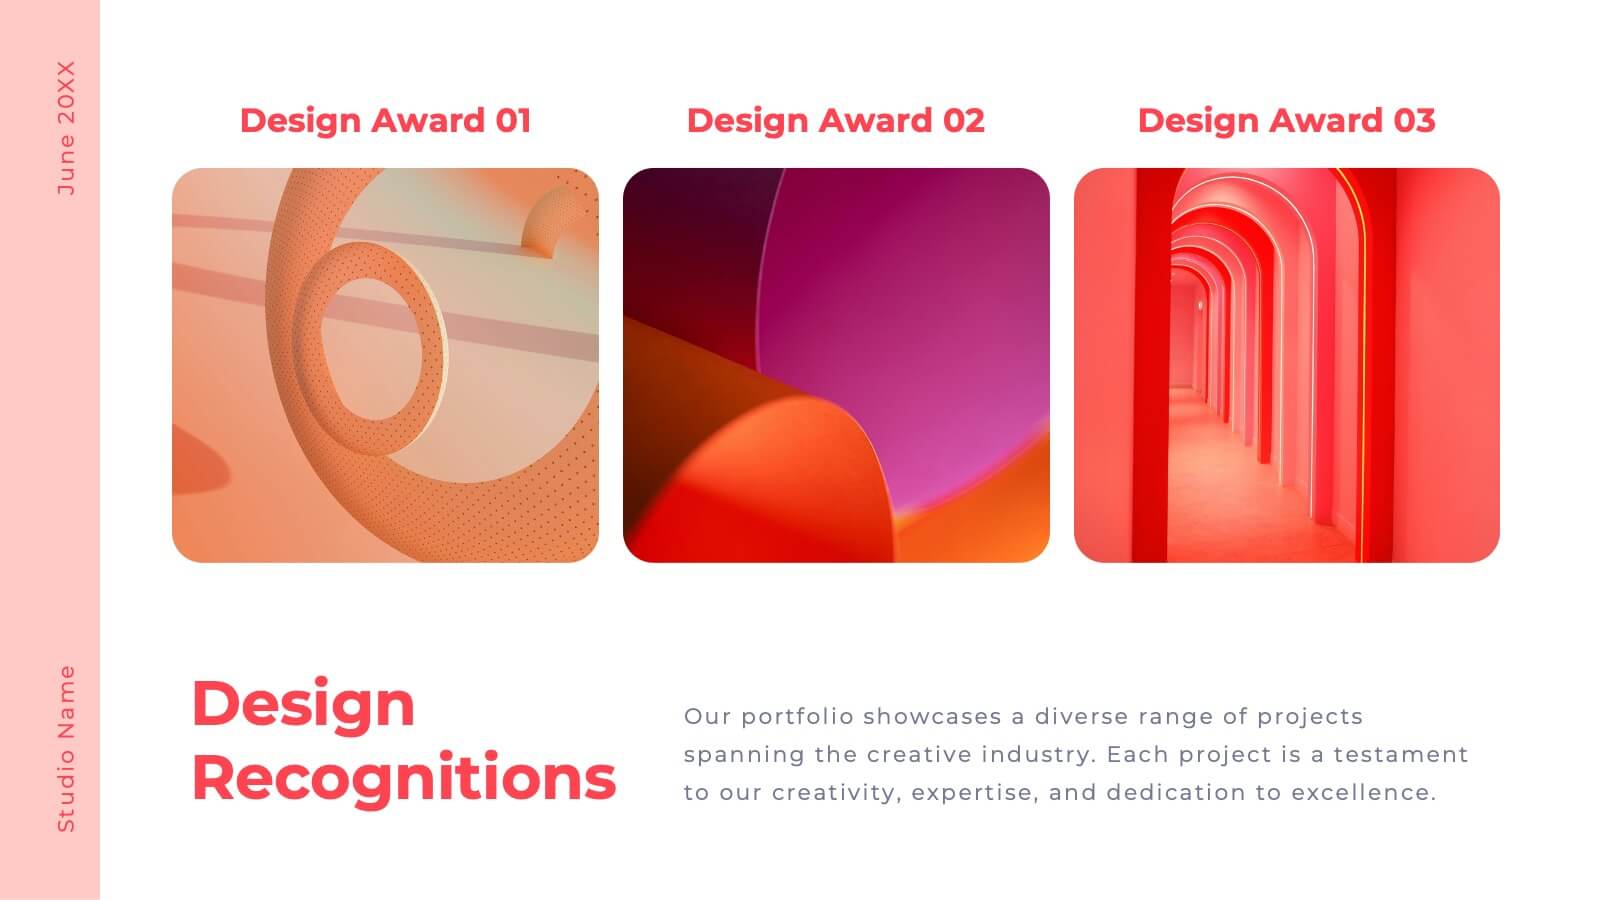
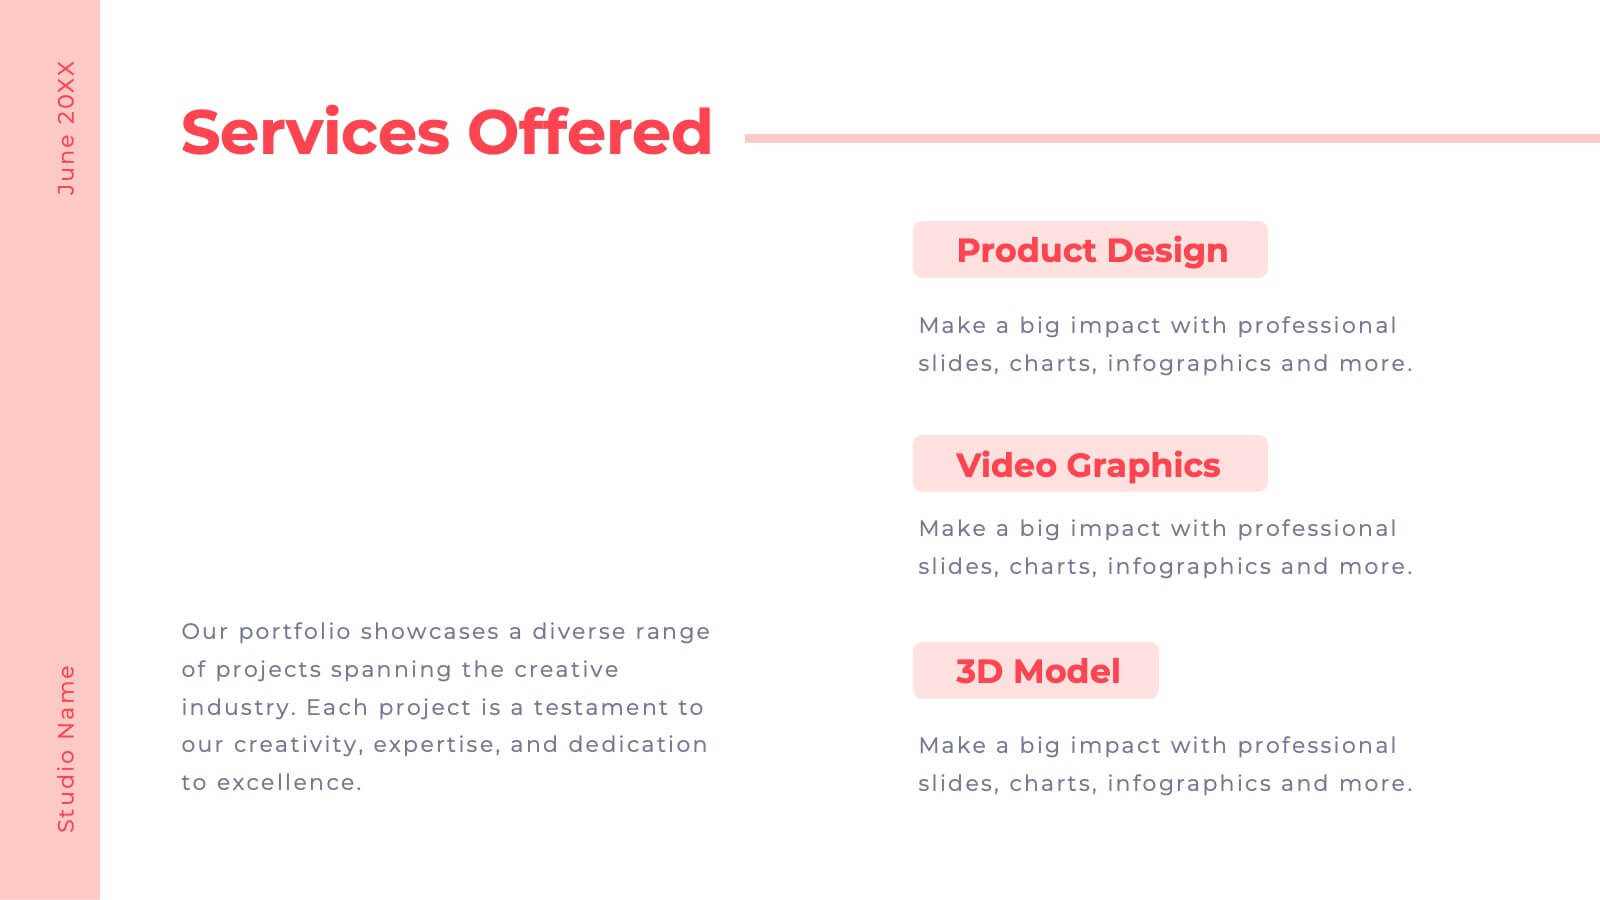
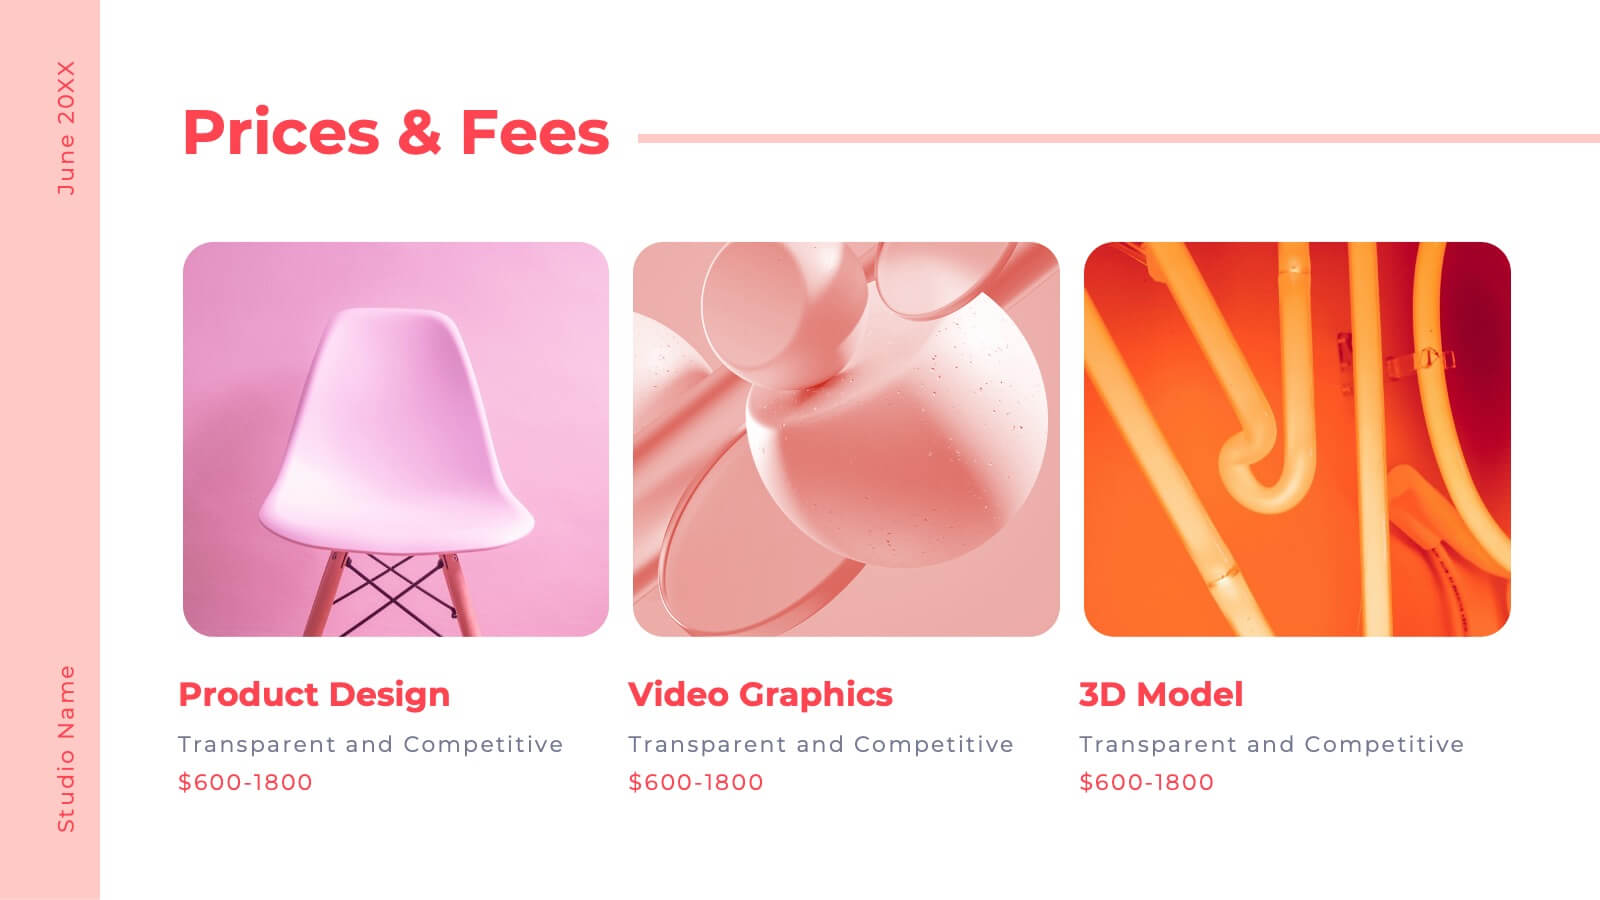
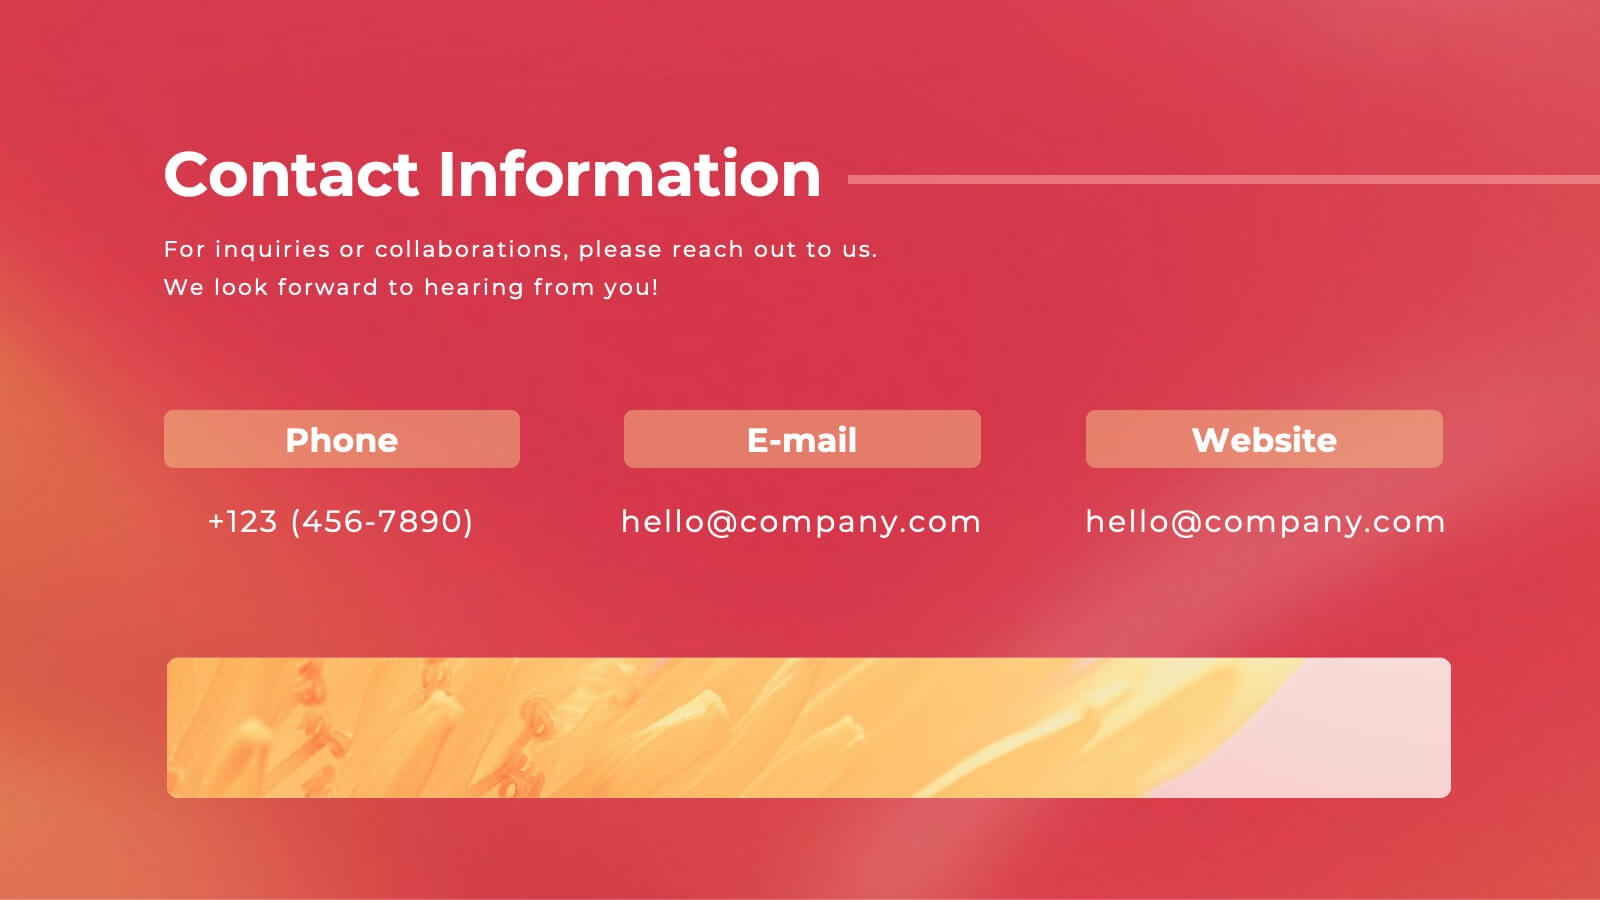
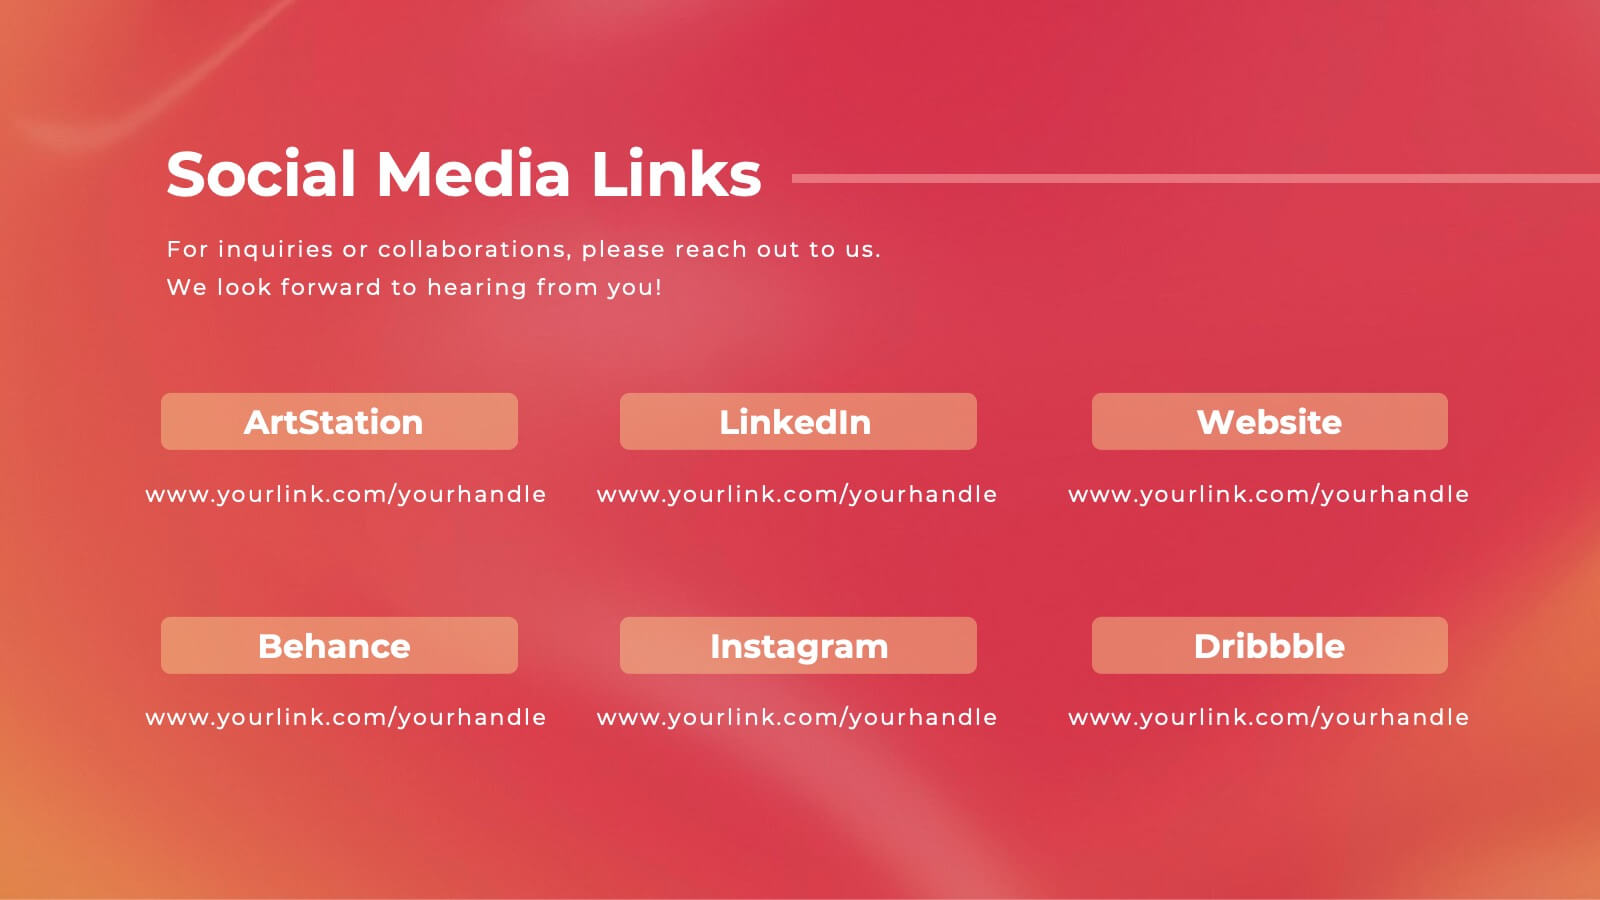
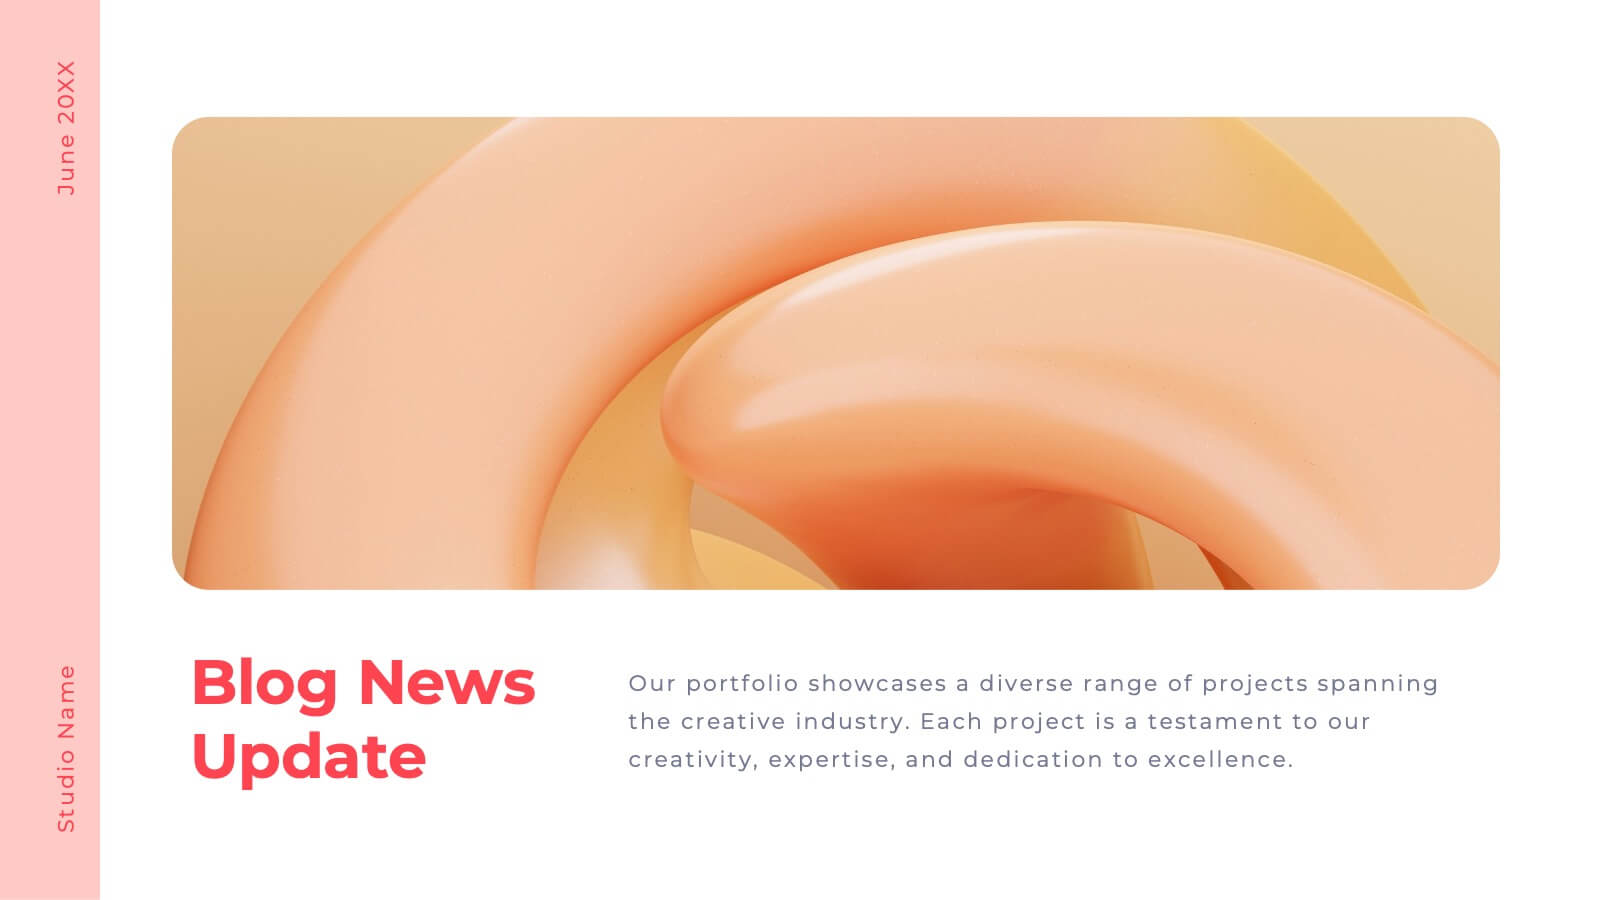
Valor Creative Portfolio Presentation
Step into creativity with this stunning portfolio template! Showcase your projects, design philosophy, and client testimonials with style and flair. Ideal for designers, artists, and creatives wanting to impress. Compatible with PowerPoint, Keynote, and Google Slides, this template elevates every portfolio to new heights. Perfect for making a lasting impact.


26 diapositivas
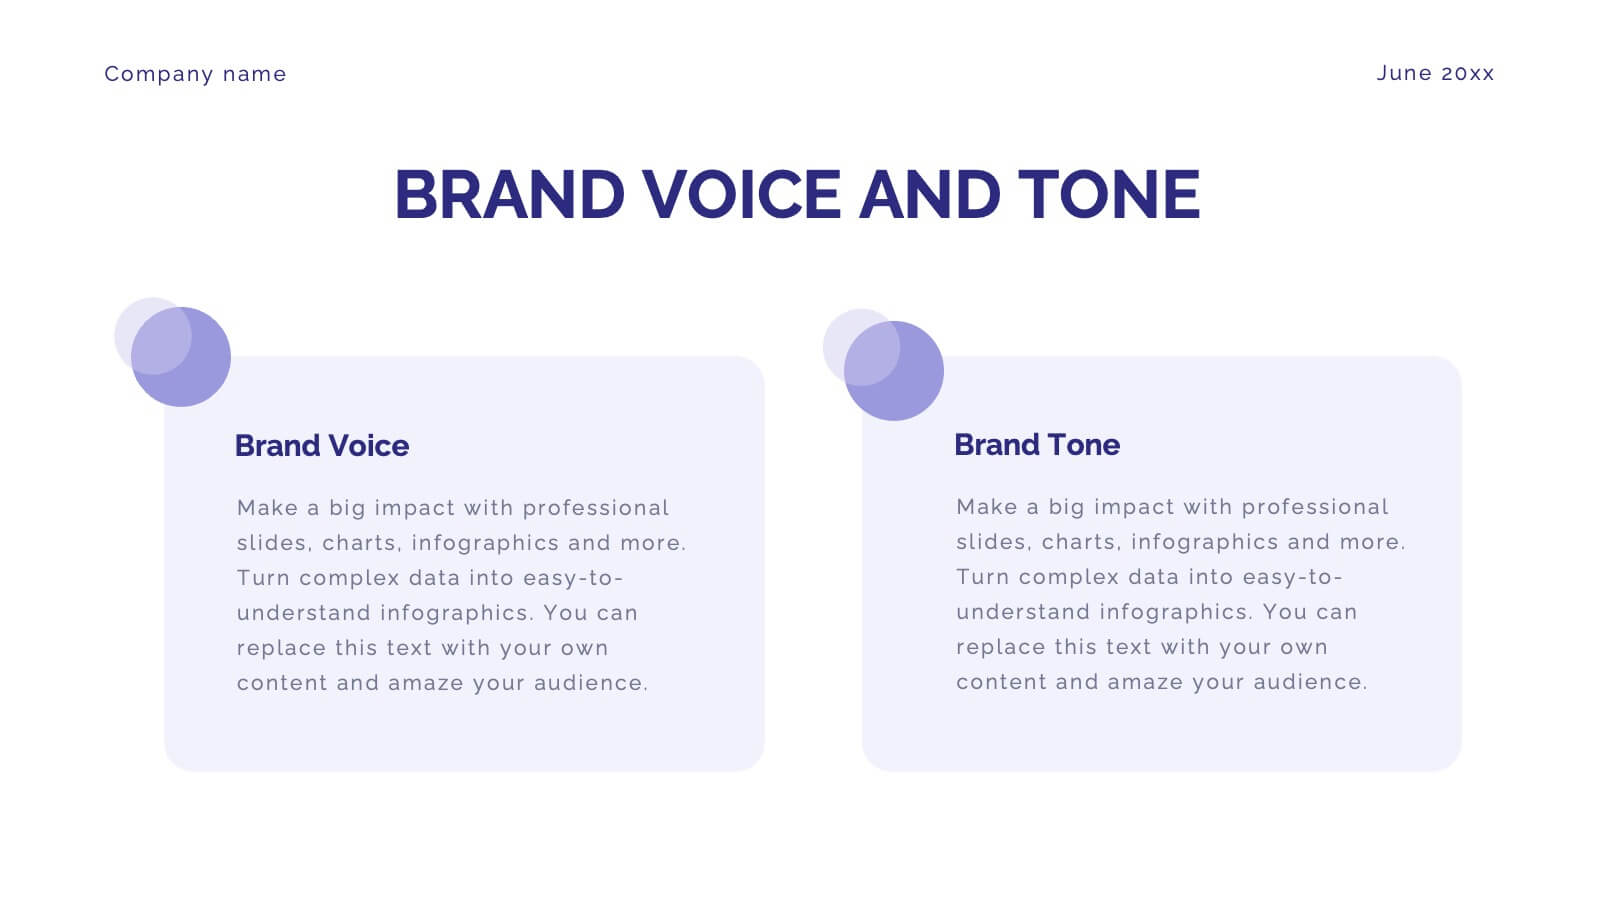
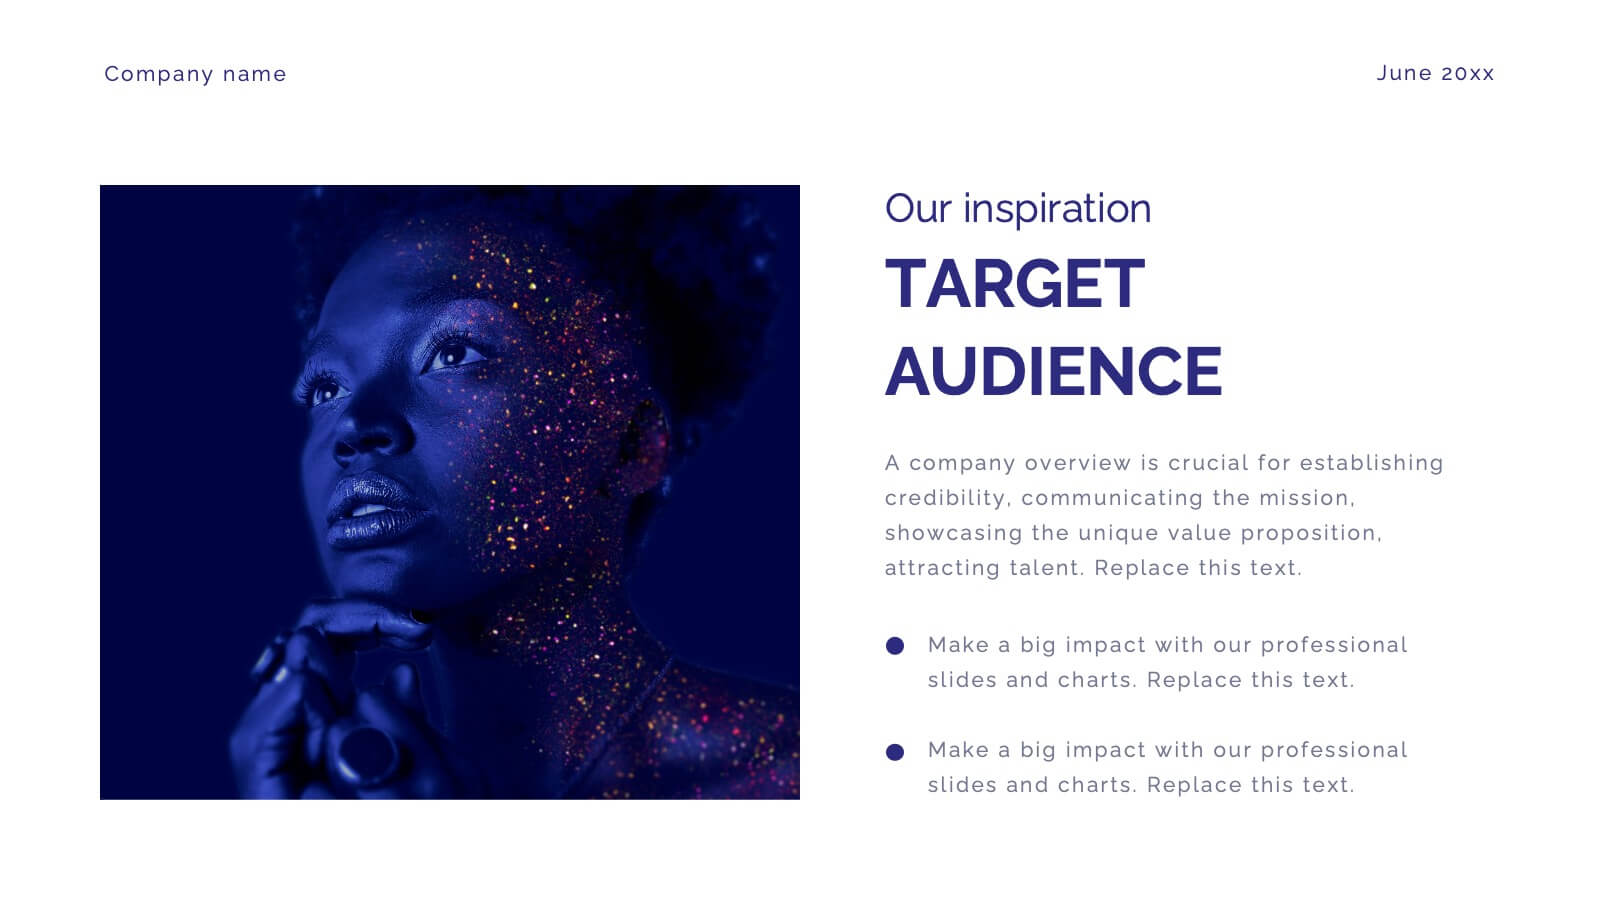
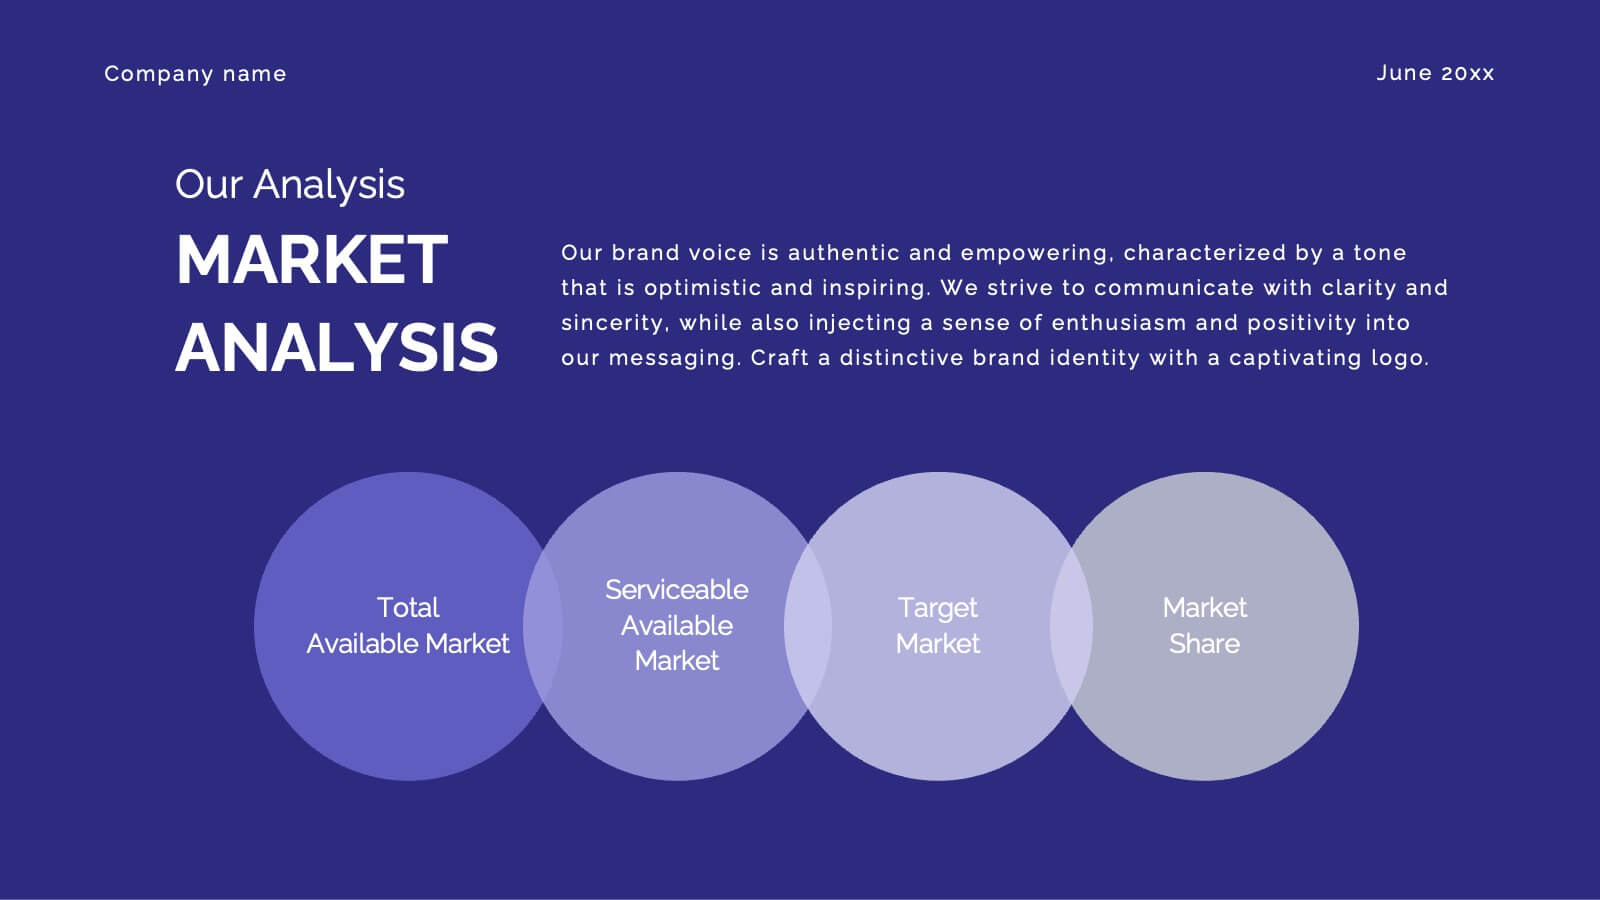
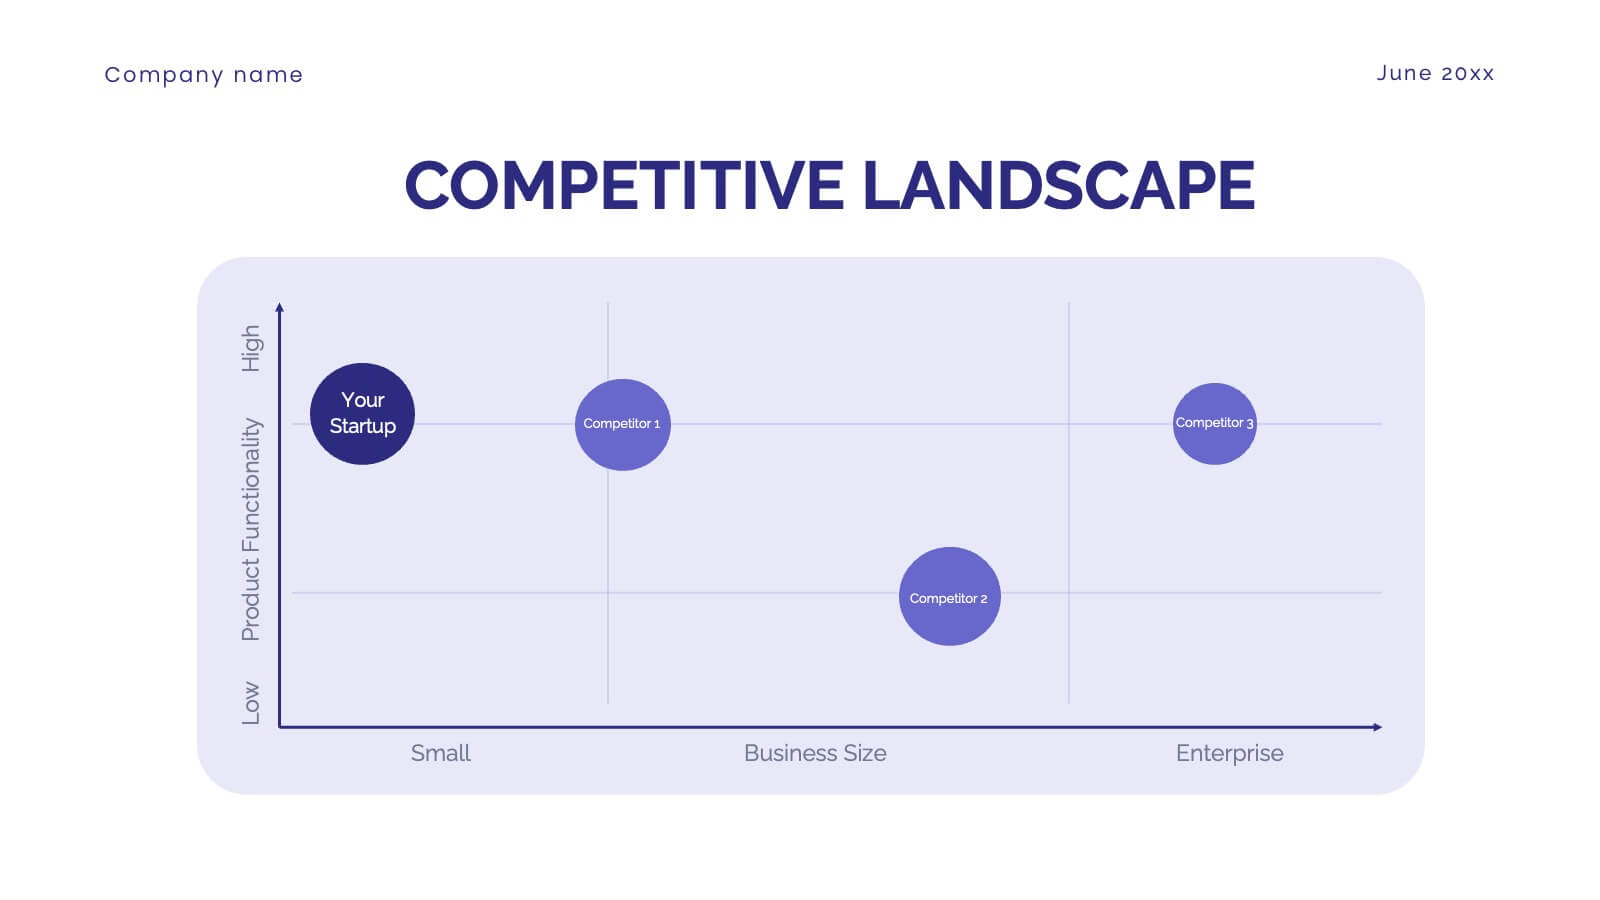
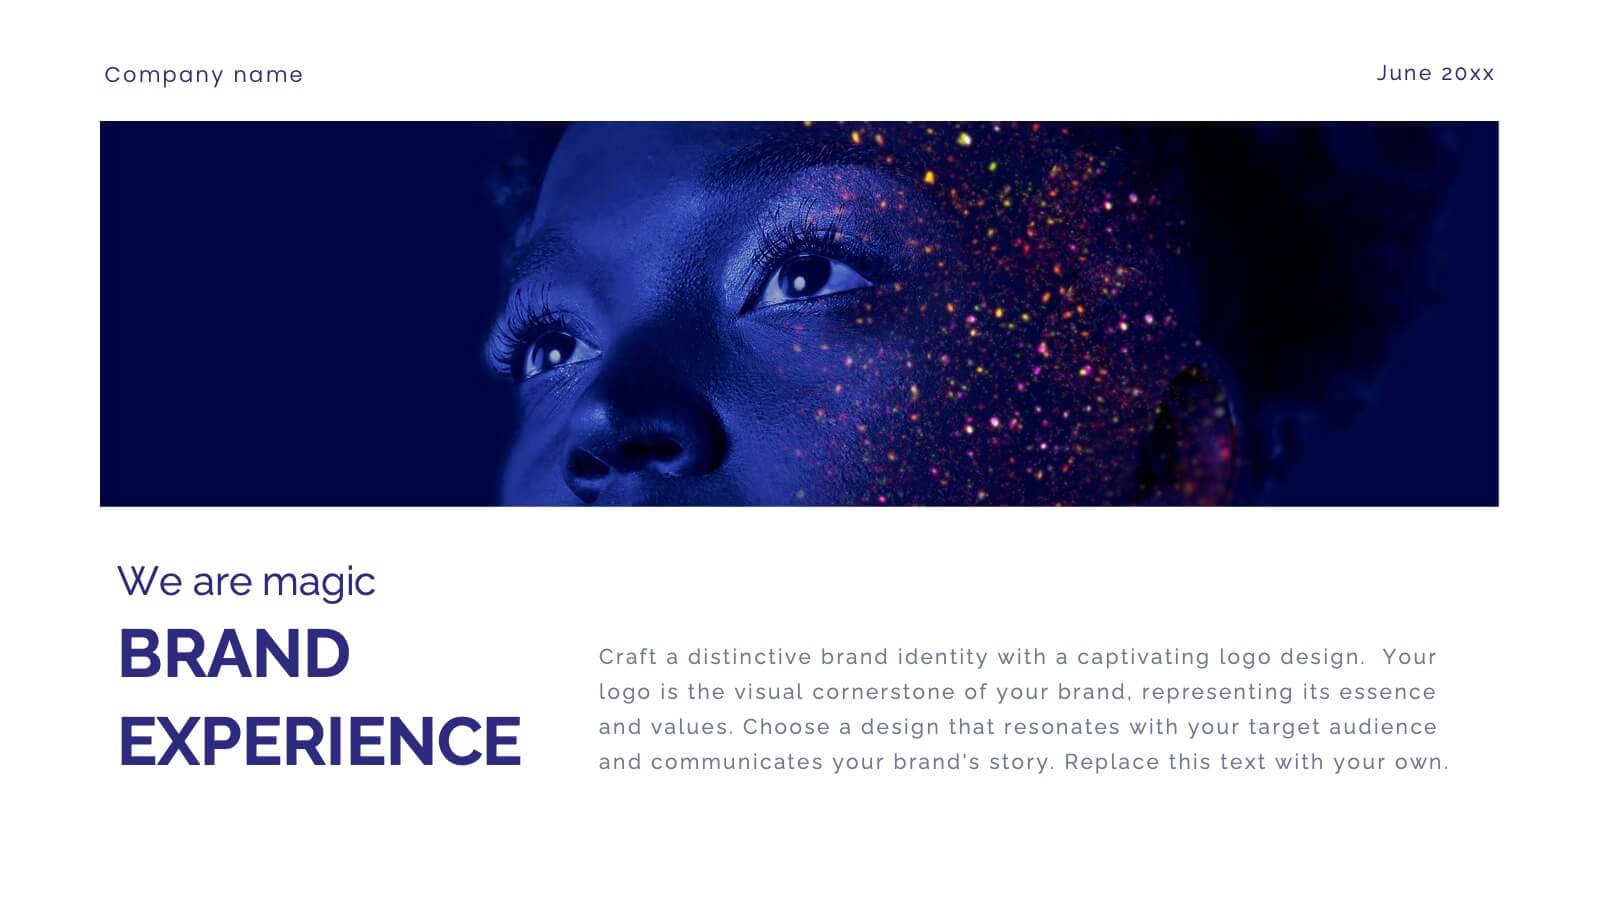
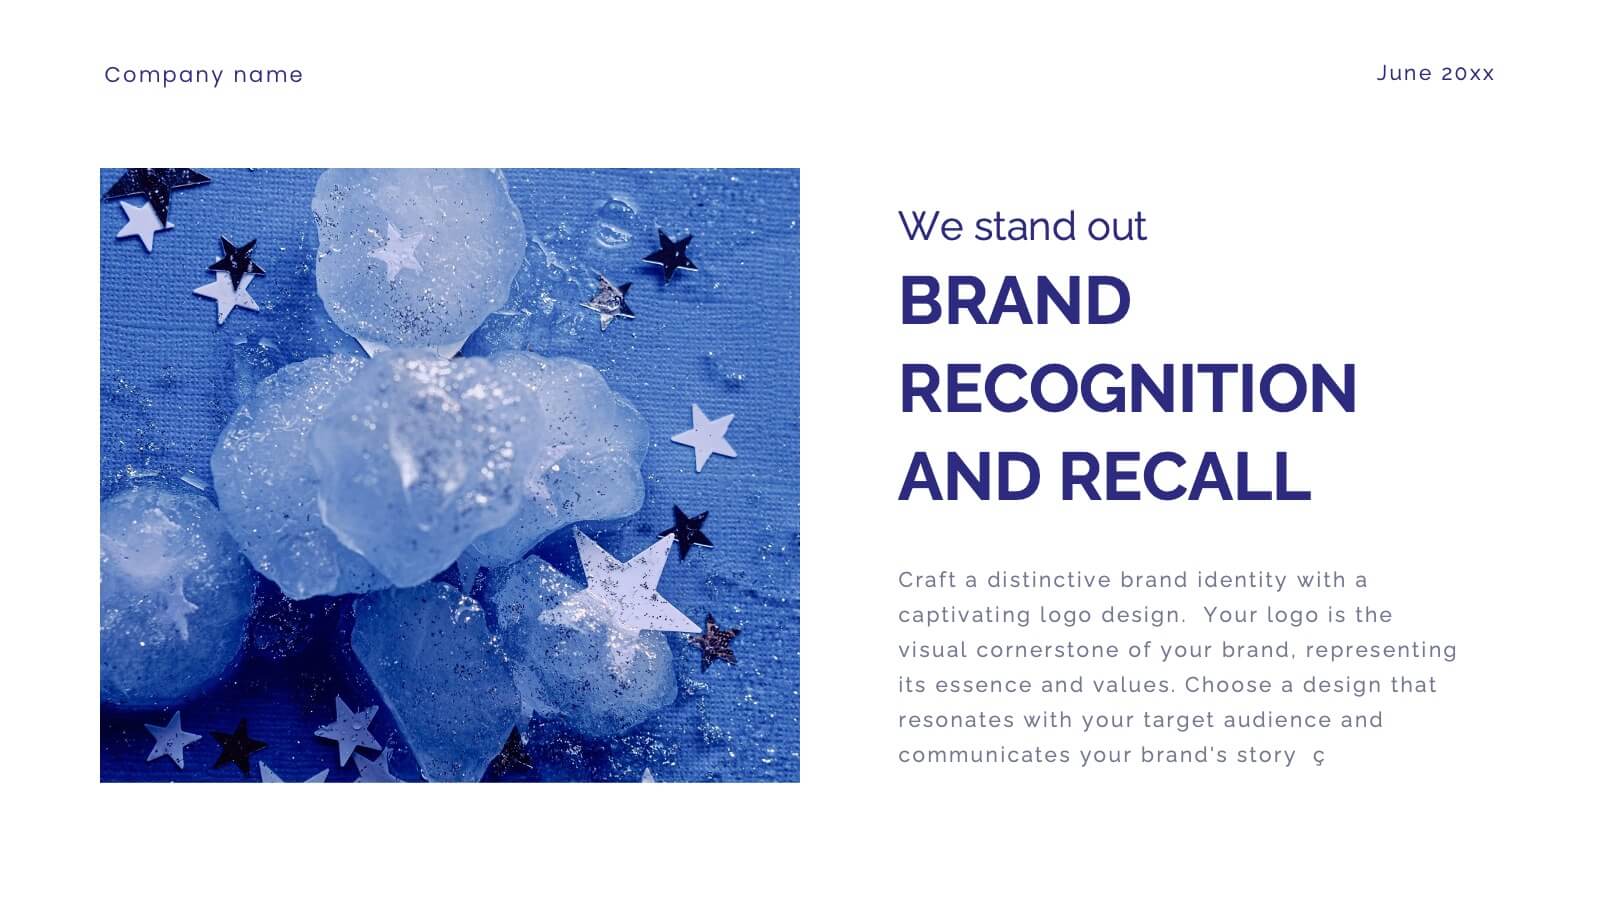
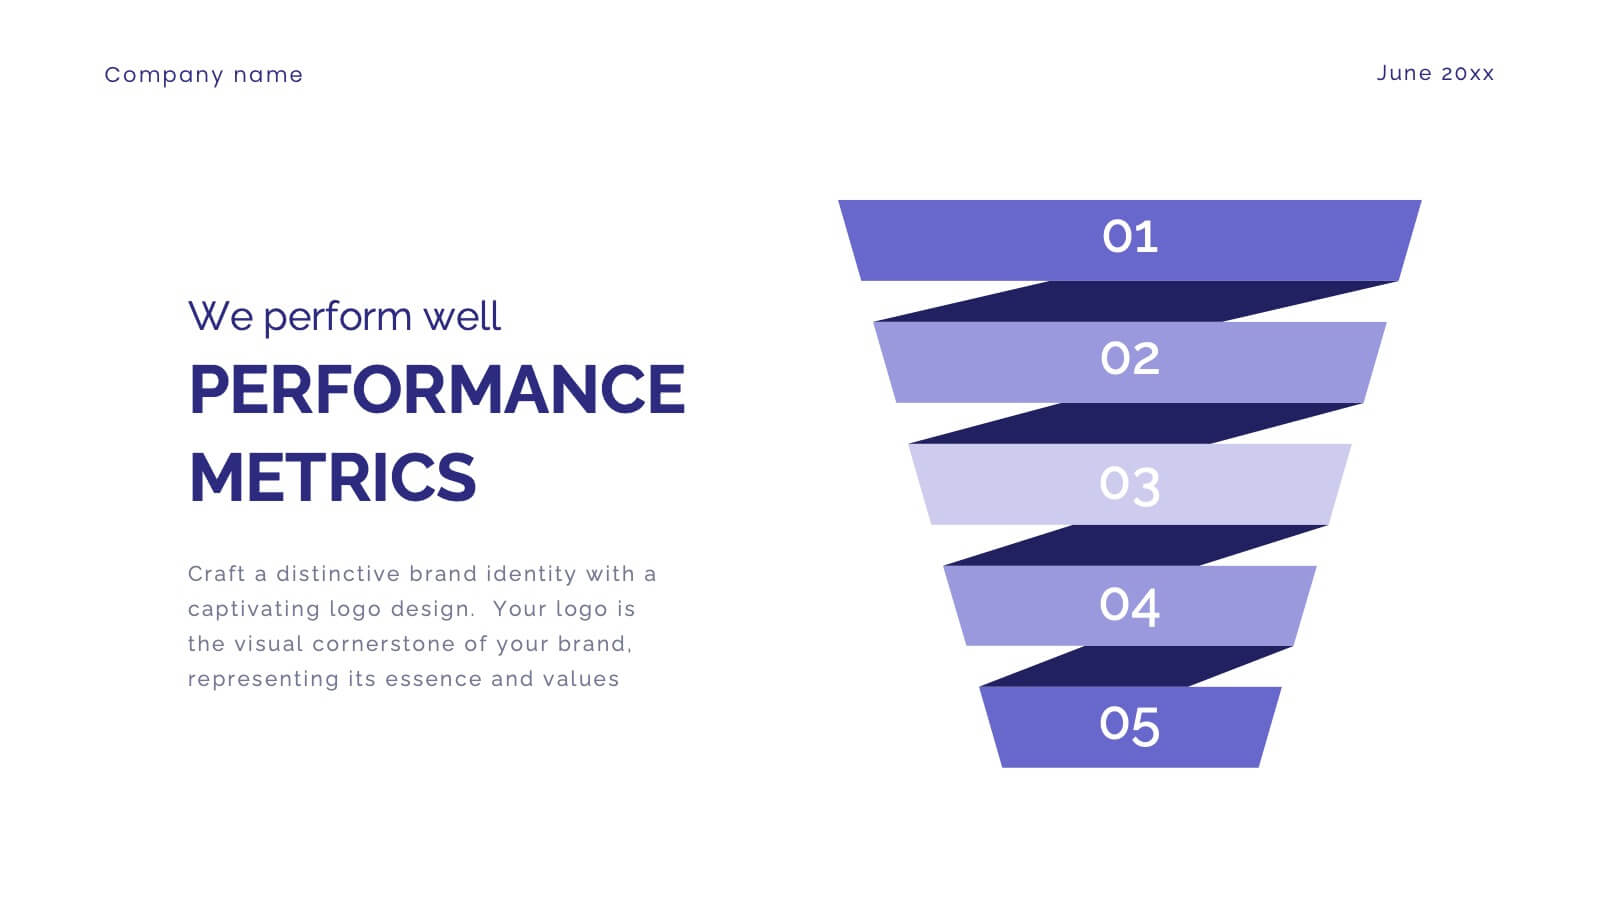
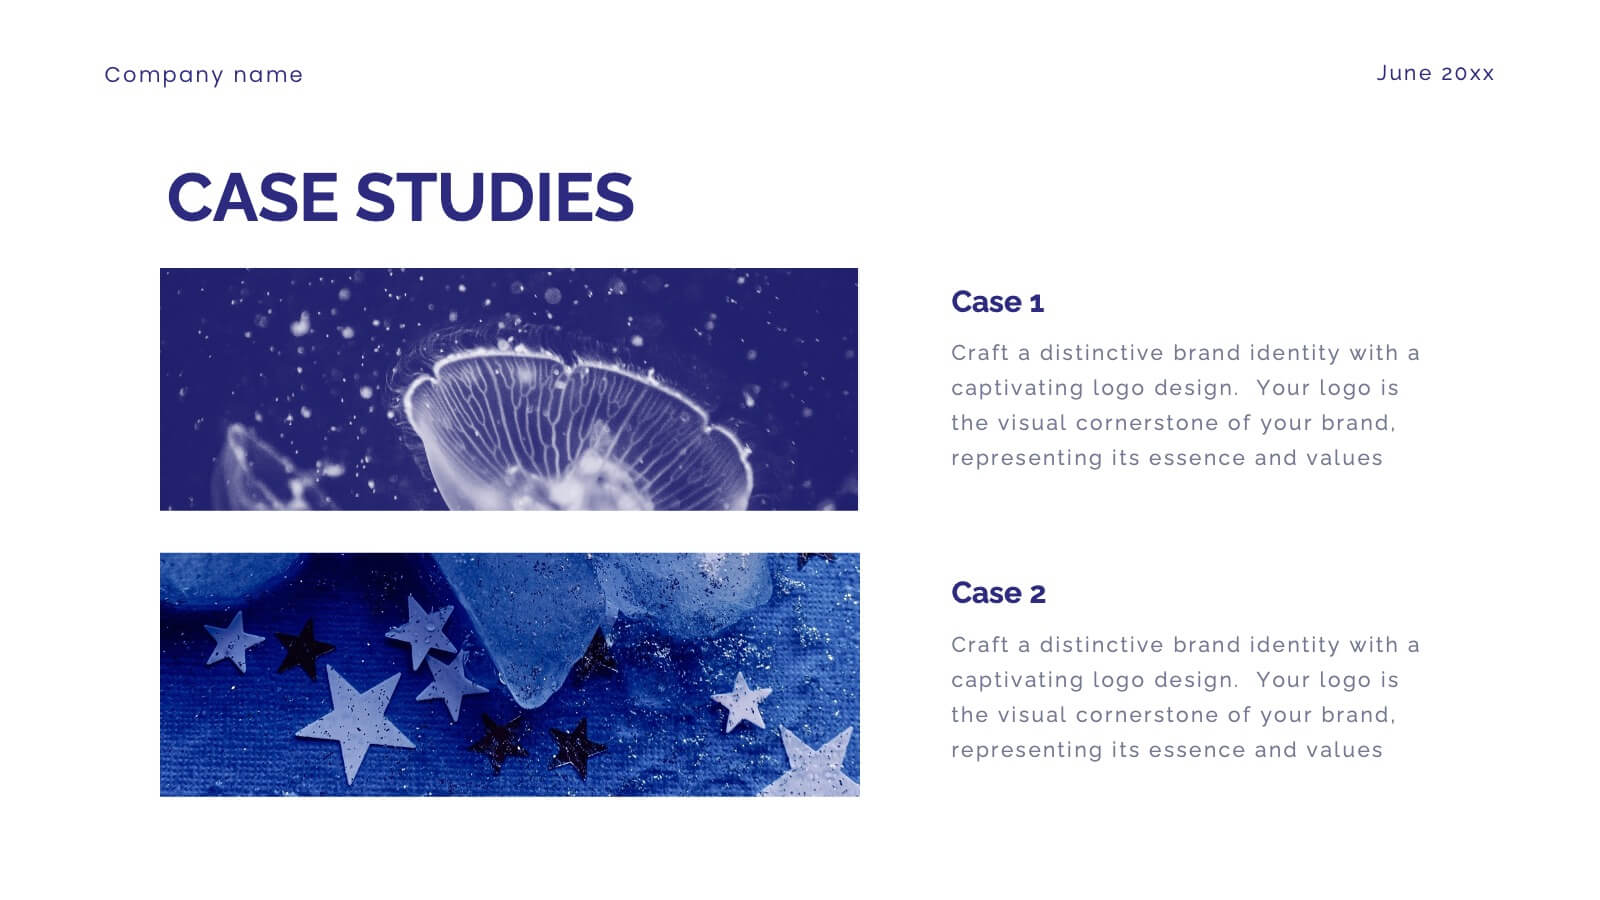
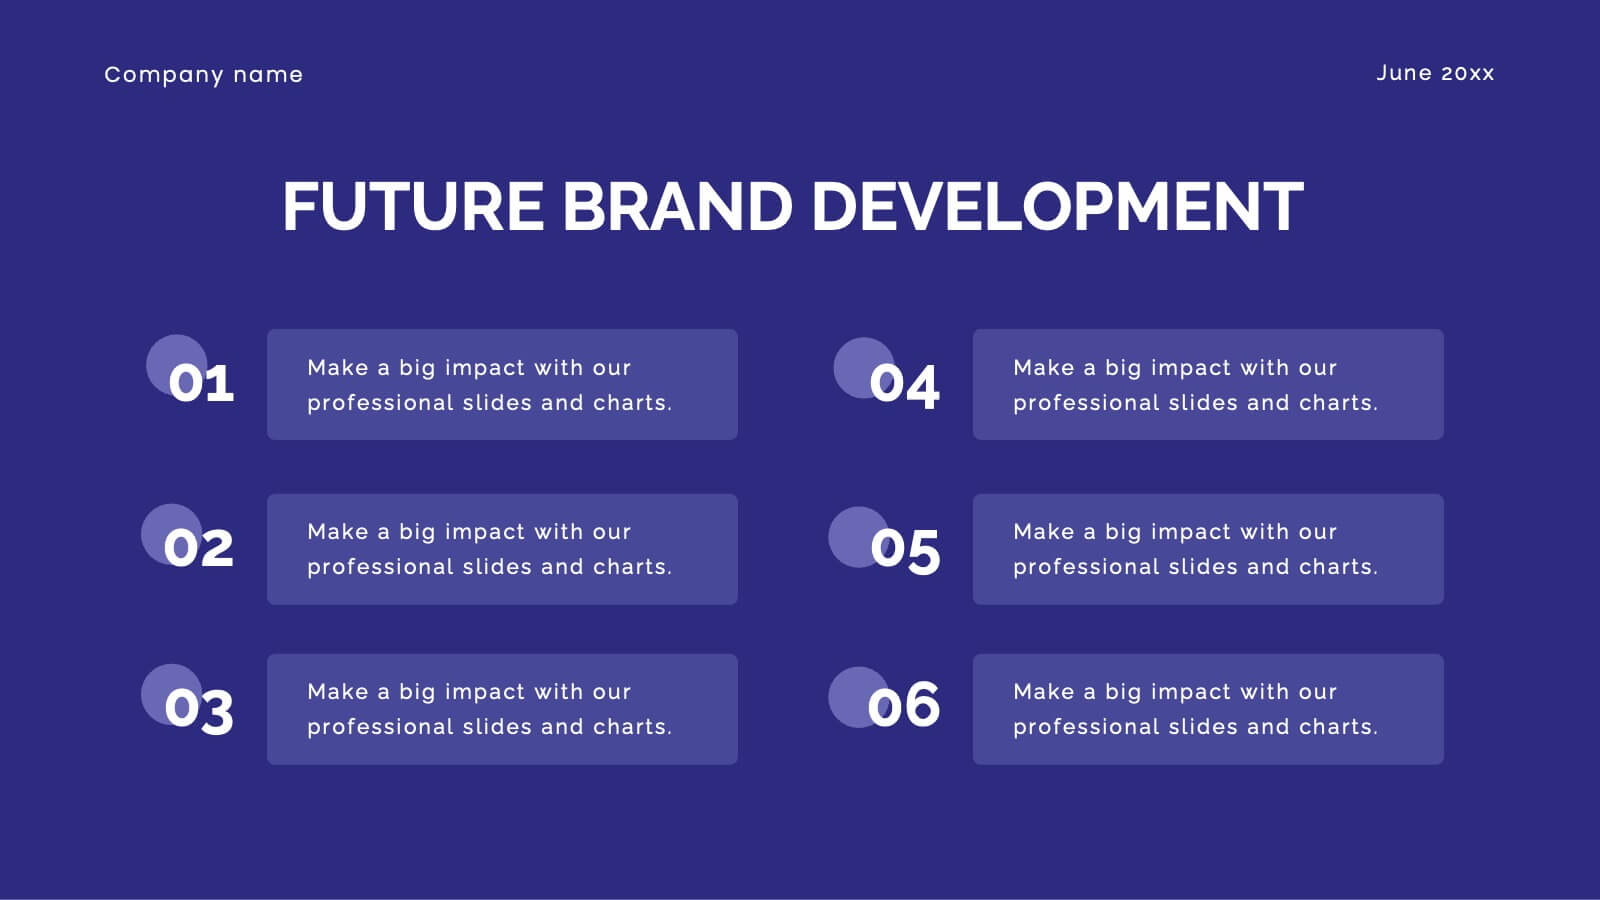
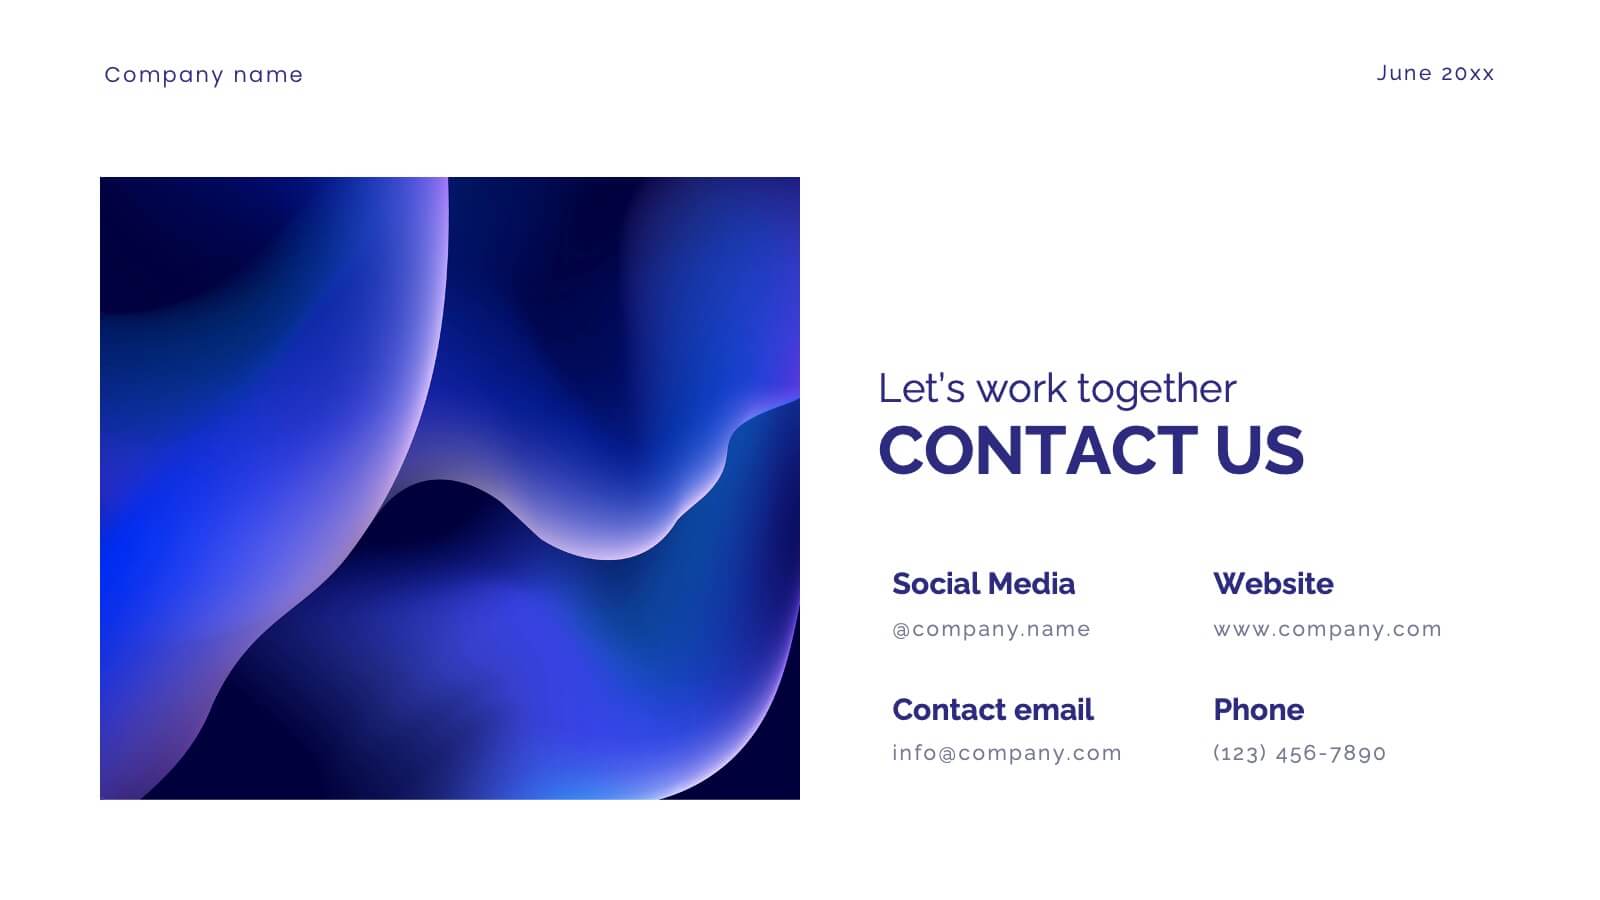
Glimmer Brand Development Pitch Deck Presentation
Elevate your brand with this comprehensive rebranding presentation template! Perfect for detailing your logo, color scheme, and market analysis, it includes slides for brand positioning, competitive landscape, and performance metrics. Engage your audience with clear visuals and structured content. Compatible with PowerPoint, Keynote, and Google Slides for seamless presentations on any platform.


24 diapositivas
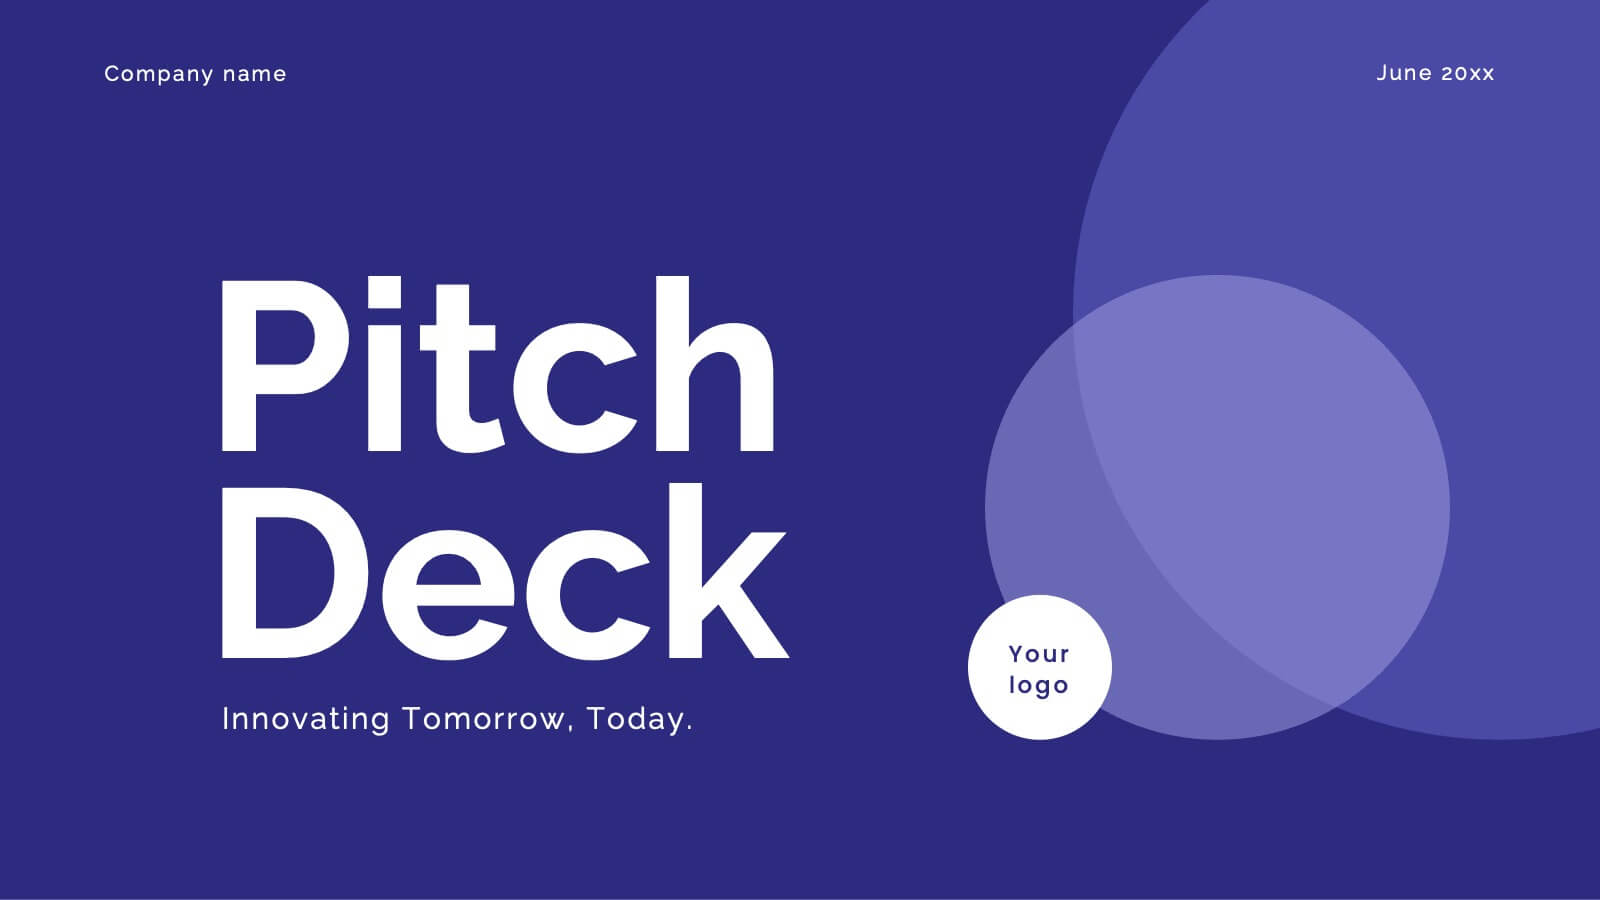
Zenith Investor Pitch Presentation
Impress your investors with this sleek, modern pitch deck presentation template. Perfect for detailing problem statements, solutions, business models, and revenue projections, it features a professional design with a cohesive color scheme. Highlight key elements like market opportunities, competitive landscapes, and financials to captivate your audience. Compatible with PowerPoint, Keynote, and Google Slides, it ensures seamless presentations on any platform.


6 diapositivas
IT Operations Workflow Strategy Presentation
Optimize your IT strategy with the IT Operations Workflow Strategy Presentation. This vertically aligned timeline slide illustrates six sequential steps, each paired with a bold icon and title placeholder—perfect for outlining operational procedures, tech stack implementation, or process audits. Color-coded markers help distinguish each stage clearly. Fully editable in PowerPoint, Keynote, and Google Slides.


6 diapositivas
Workforce Skills Gap Assessment Presentation
Identify, visualize, and address talent gaps with the Workforce Skills Gap Assessment Presentation. This template helps you clearly communicate current capabilities versus future needs across departments or teams. Perfect for HR leaders, L&D strategists, and organizational planners. Fully customizable in PowerPoint, Keynote, Canva, and Google Slides.


4 diapositivas
Customers Journey Map Presentation
Take your audience on a smooth, visual adventure that clearly outlines each stage of the customer experience. This presentation helps you map behaviors, highlight key interactions, and explain decision points with clarity and style. Designed for easy customization and fully compatible with PowerPoint, Keynote, and Google Slides.


8 diapositivas
Three Phase 30-60-90 Strategy Presentation
Give your roadmap a dynamic, flowing rhythm with a clean three-phase layout that makes each milestone feel clear, actionable, and easy to present. This presentation helps you outline priorities, track progress, and communicate strategic goals with confidence and simplicity. Fully editable and compatible with PowerPoint, Keynote, and Google Slides.


7 diapositivas
Gap Analysis Skills Infographic
Gap analysis in a skills context is a process of evaluating the difference or "gap" between the current skills and competencies of an individual or a team and the desired or required skills for a particular role, project, or goal. This infographic template is a crucial tool for personal and professional development, talent management, and strategic planning within organizations. This captivating visual is designed to help individuals and organizations bridge the skills gap effectively. This infographic serves as a compass, guiding you through the essential steps needed to identify, analyze, and close the skills gaps within your organization.


7 diapositivas
Problem Solution Infographic
The Problem Solution Infographic is a versatile template designed to clearly articulate challenges and corresponding strategies. It guides viewers through a sequence of problem identification to the implementation of solutions, offering a structured approach to problem-solving. This template is perfect for professionals who aim to present issues and their solutions in a logical, step-by-step manner. With its compatibility across PowerPoint, Google Slides, and Keynote, this tool is ideal for workshops, business meetings, academic environments, or any scenario where clear communication of problem-solving is required.


2 diapositivas
Introduction Slide for Professional Decks Presentation
Make a strong first impression with this clean and modern introduction slide. Designed to kick off your presentation with clarity, this template is ideal for professional decks, pitch presentations, and business briefings. Customize the layout with your visuals and text to align with your message. Fully compatible with PowerPoint, Keynote, and Google Slides.


6 diapositivas
Investment Property Infographics
Step into the world of real estate with enthusiasm! This infographic opens doors to a wealth of opportunities. From the allure of rental income to the tax advantages that can boost your financial gains, we unveil the secrets that make investment properties a wise choice. Becoming a successful investor requires knowing the terrain. Dive into the nuances of property location, type, and market conditions. Gain insights into financing options, from traditional mortgages to innovative strategies. Uncover the art of property valuation, where location, condition, and appreciation potential hold the keys to your success. With this engaging infographic compatible with PowerPoint, Keynote, and Google Slides, sharing your real estate wisdom has never been easier. Empower yourself with the knowledge to unlock the potential of investment properties and set sail on a journey towards financial freedom.


5 diapositivas
Circular Wheel for Process Flow Presentation
Visualize your workflow with clarity using this 5-step circular process diagram. Perfect for illustrating continuous improvement, feedback loops, or operational stages. Each segment is color-coded and numbered for easy navigation and understanding. Fully editable in PowerPoint, Keynote, and Google Slides—customize icons, colors, and text to suit your message.


5 diapositivas
Business KPI Performance Presentation
Bring your business results to life with a clear, modern layout designed to showcase key metrics and performance goals. Perfect for tracking growth, progress, and success indicators, this visual design helps make data easy to understand and engaging. Fully editable in PowerPoint, Keynote, and Google Slides.


26 diapositivas
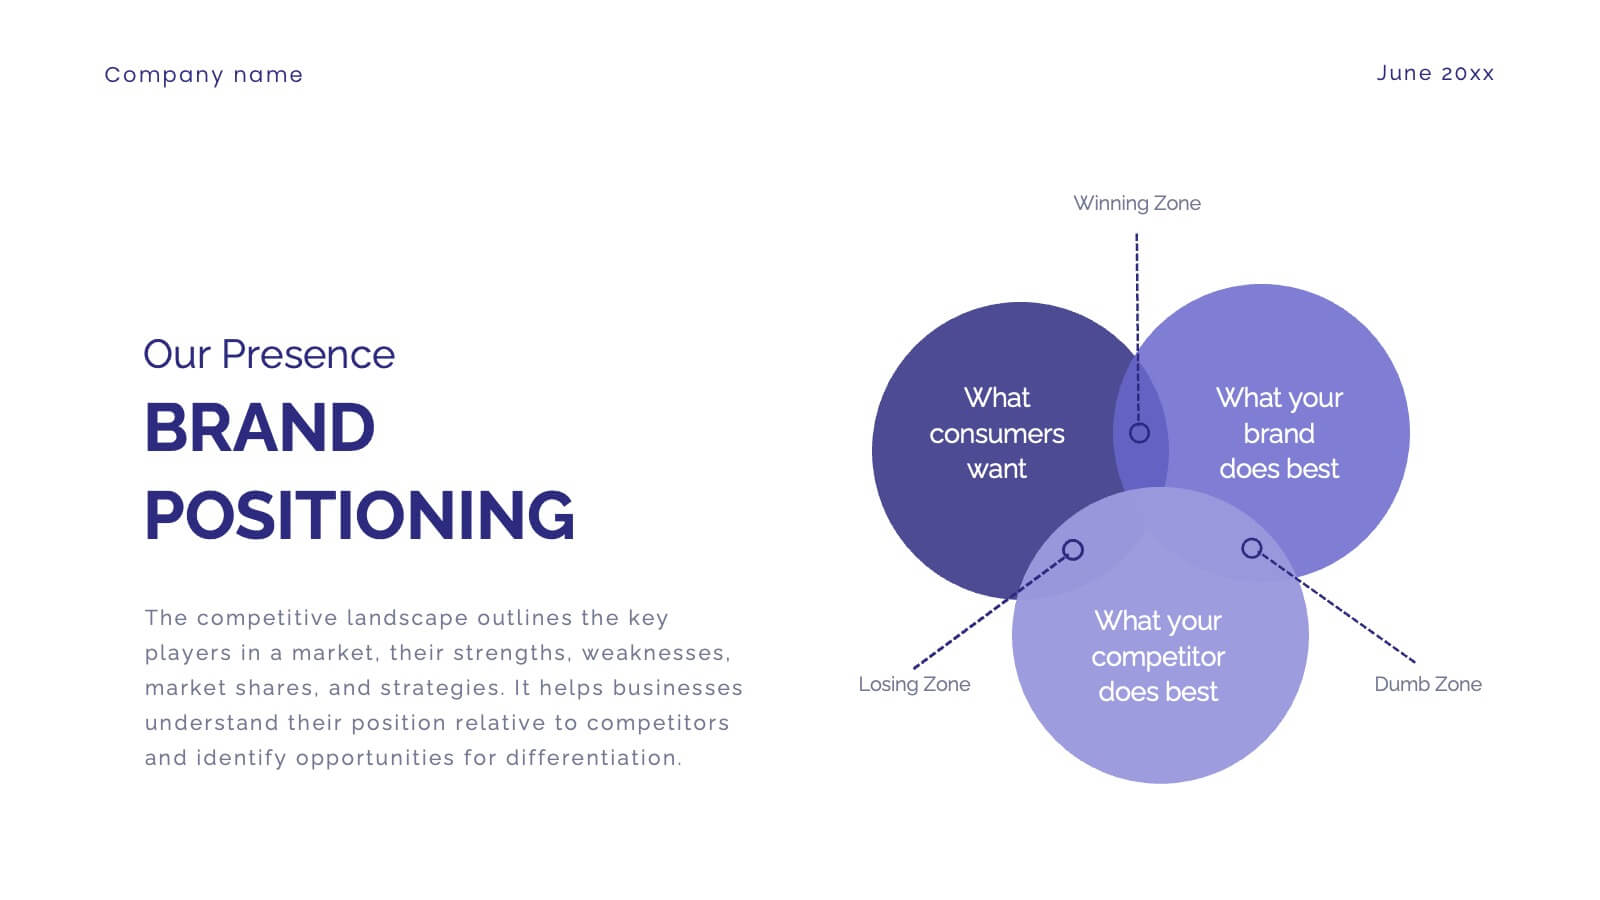
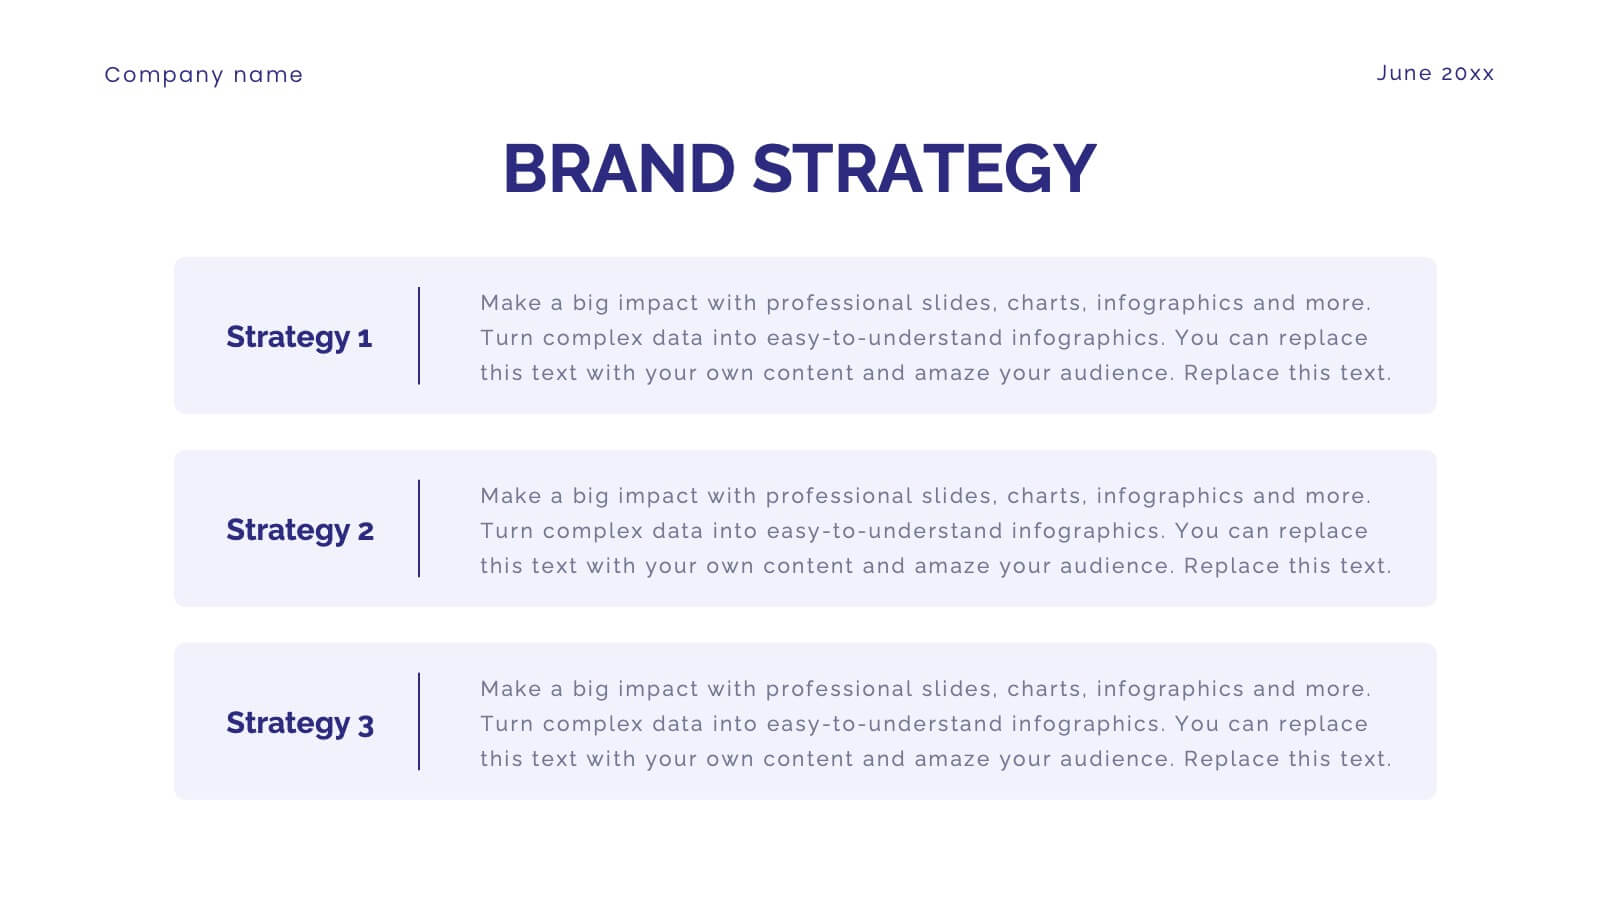
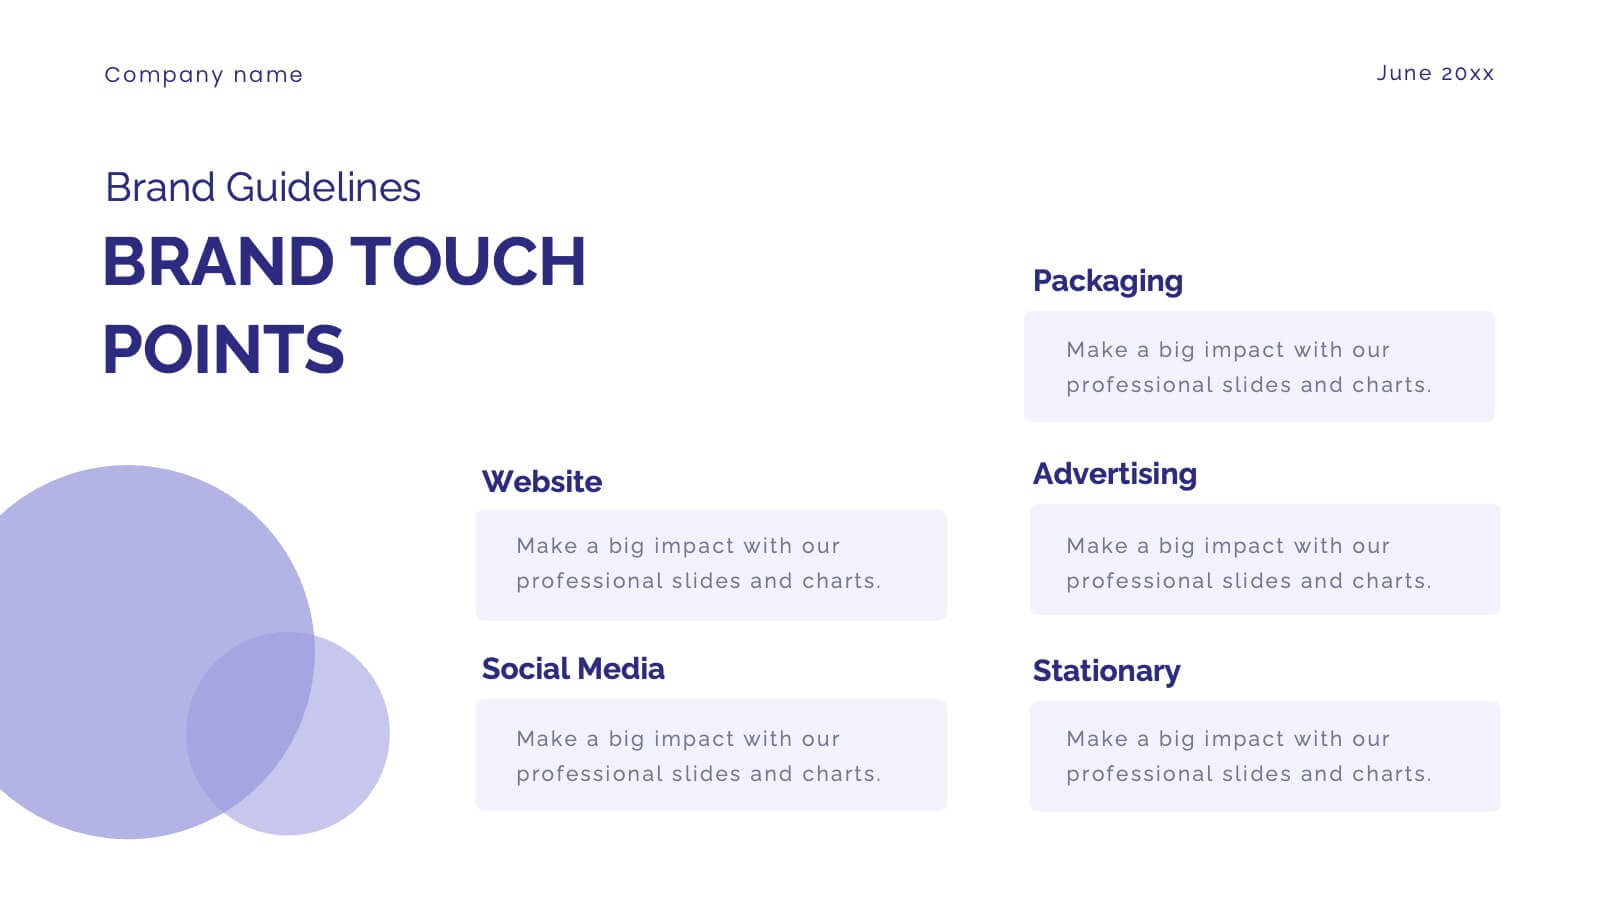
Briarfall Rebranding Project Plan Presentation
This Brand Presentation Template offers a modern and structured approach to showcasing your brand identity, values, and strategic direction. Covering essential elements like audience personas, brand positioning, touchpoints, and performance metrics, it's fully customizable and perfect for businesses looking to strengthen their brand presence. Compatible with PowerPoint, Keynote, and Google Slides.
21 diapositivas
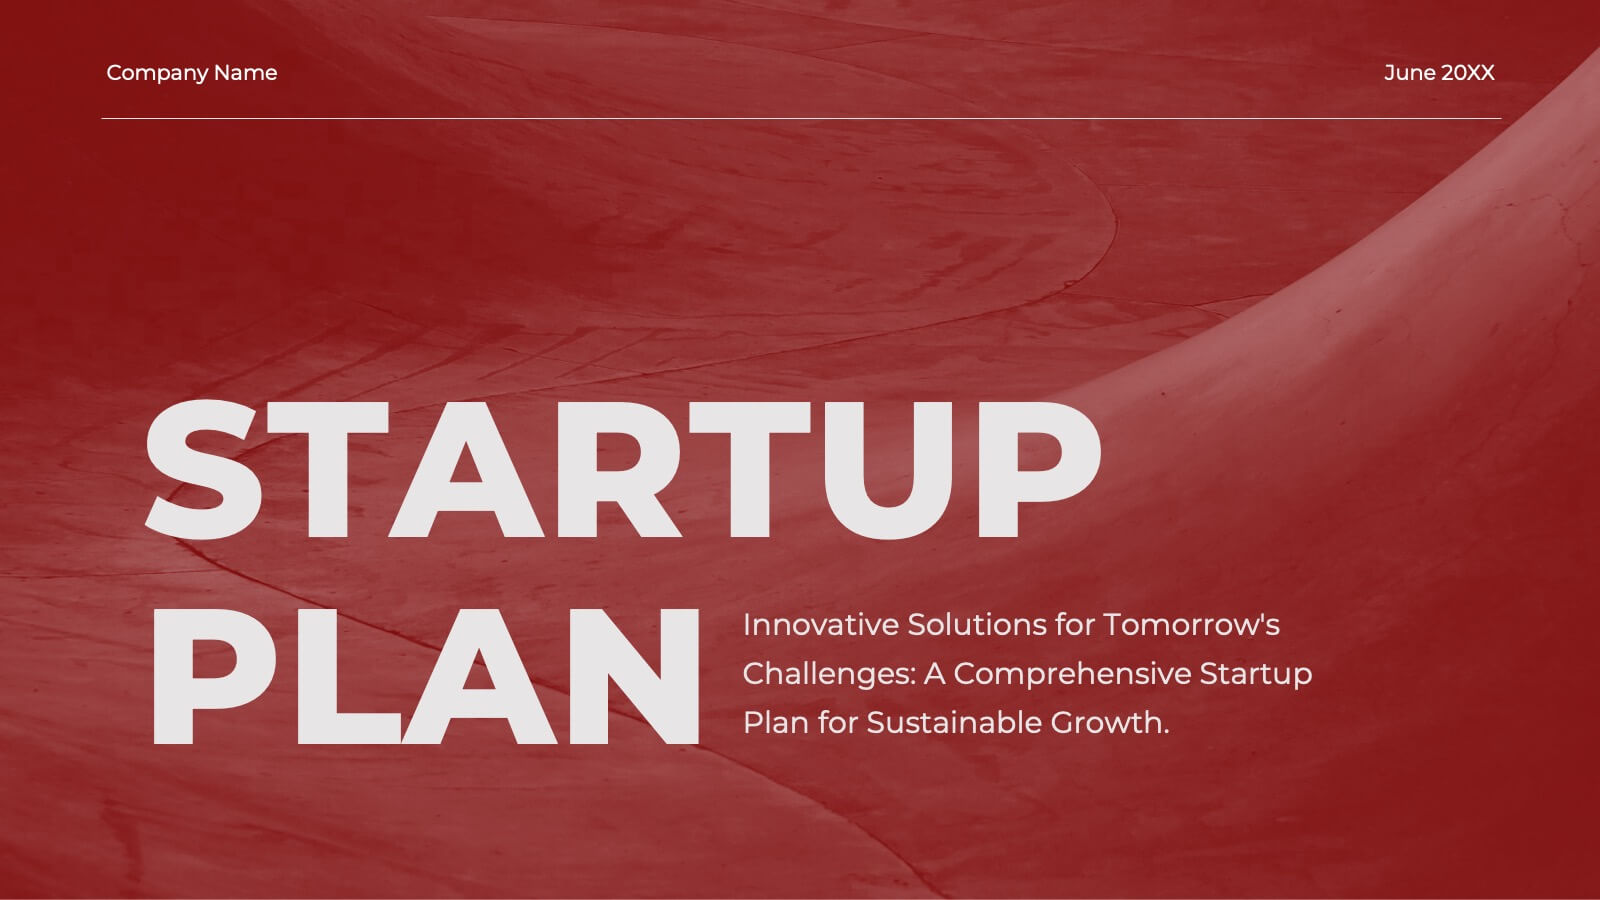
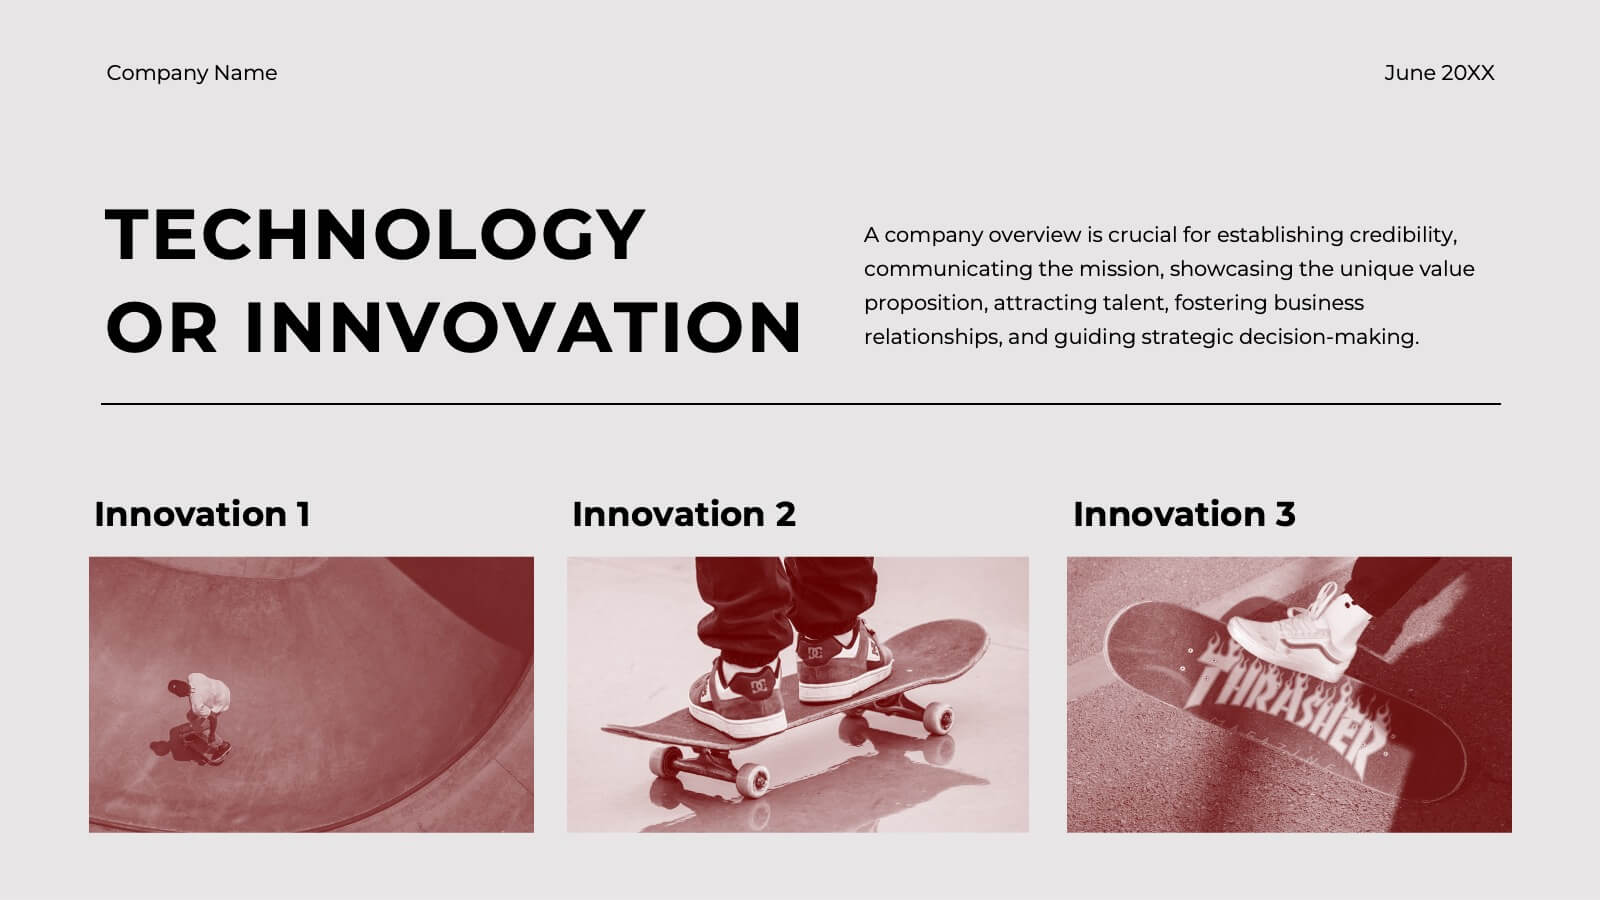
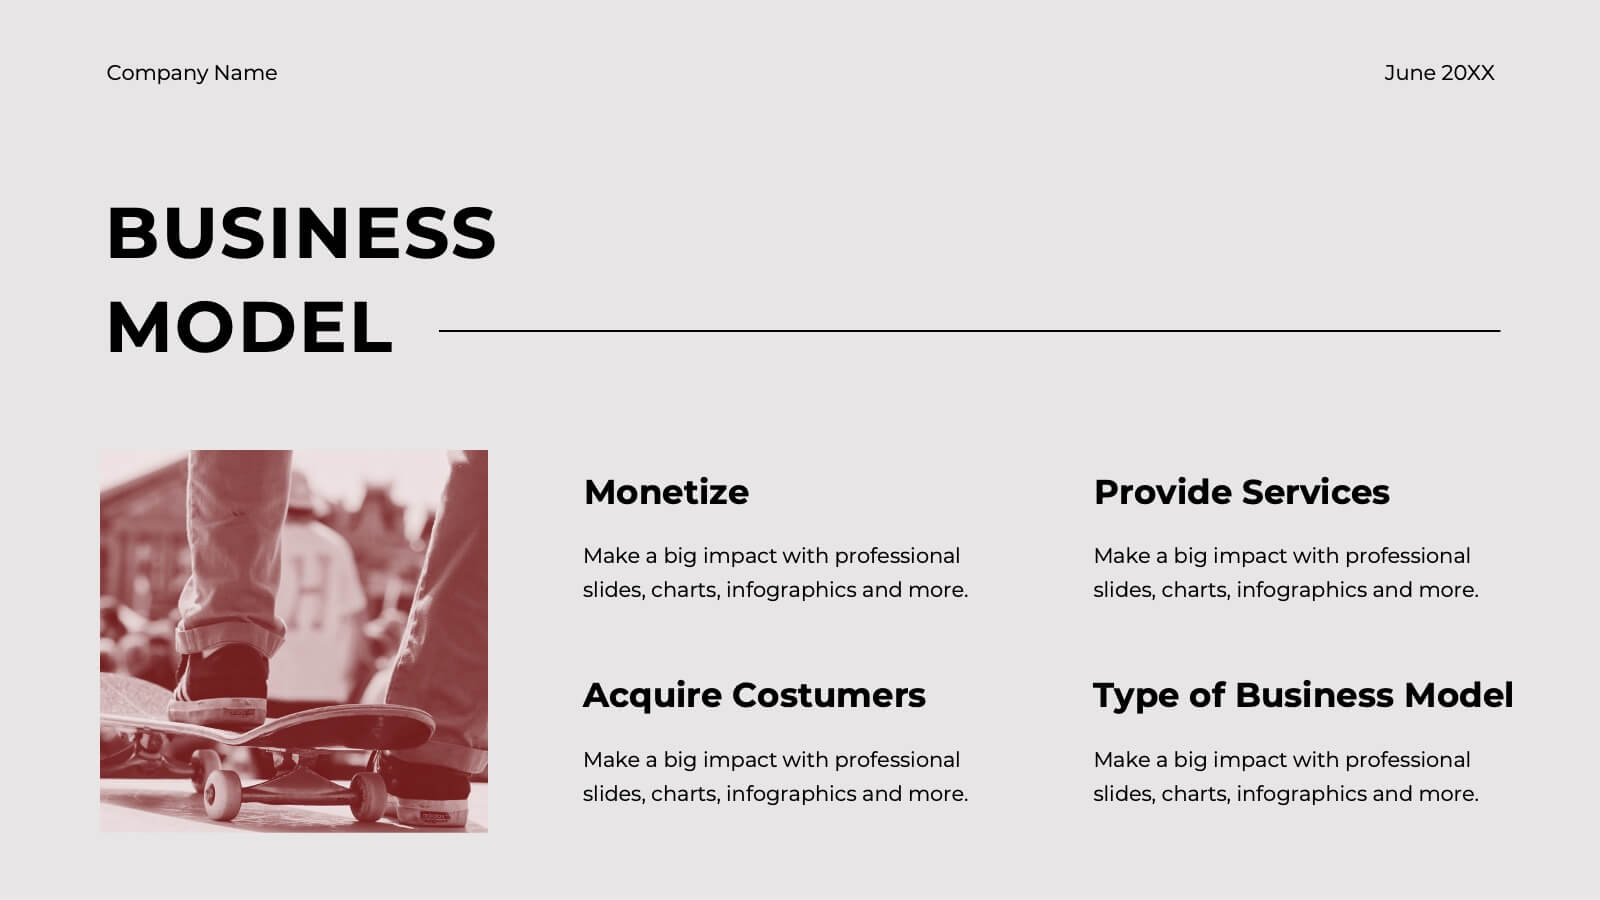
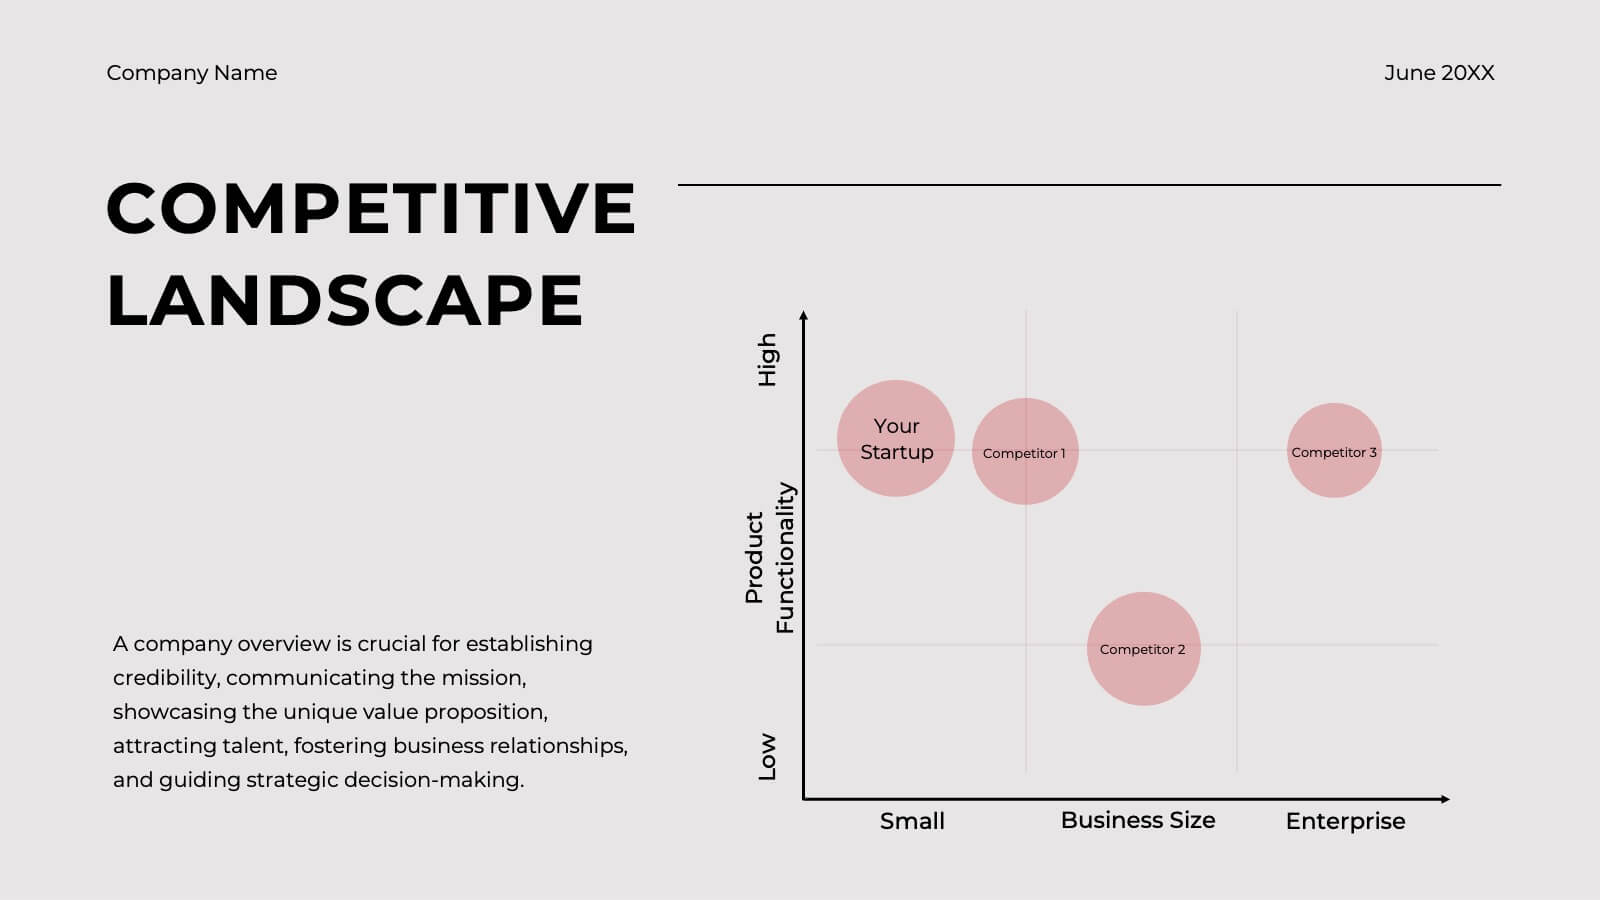
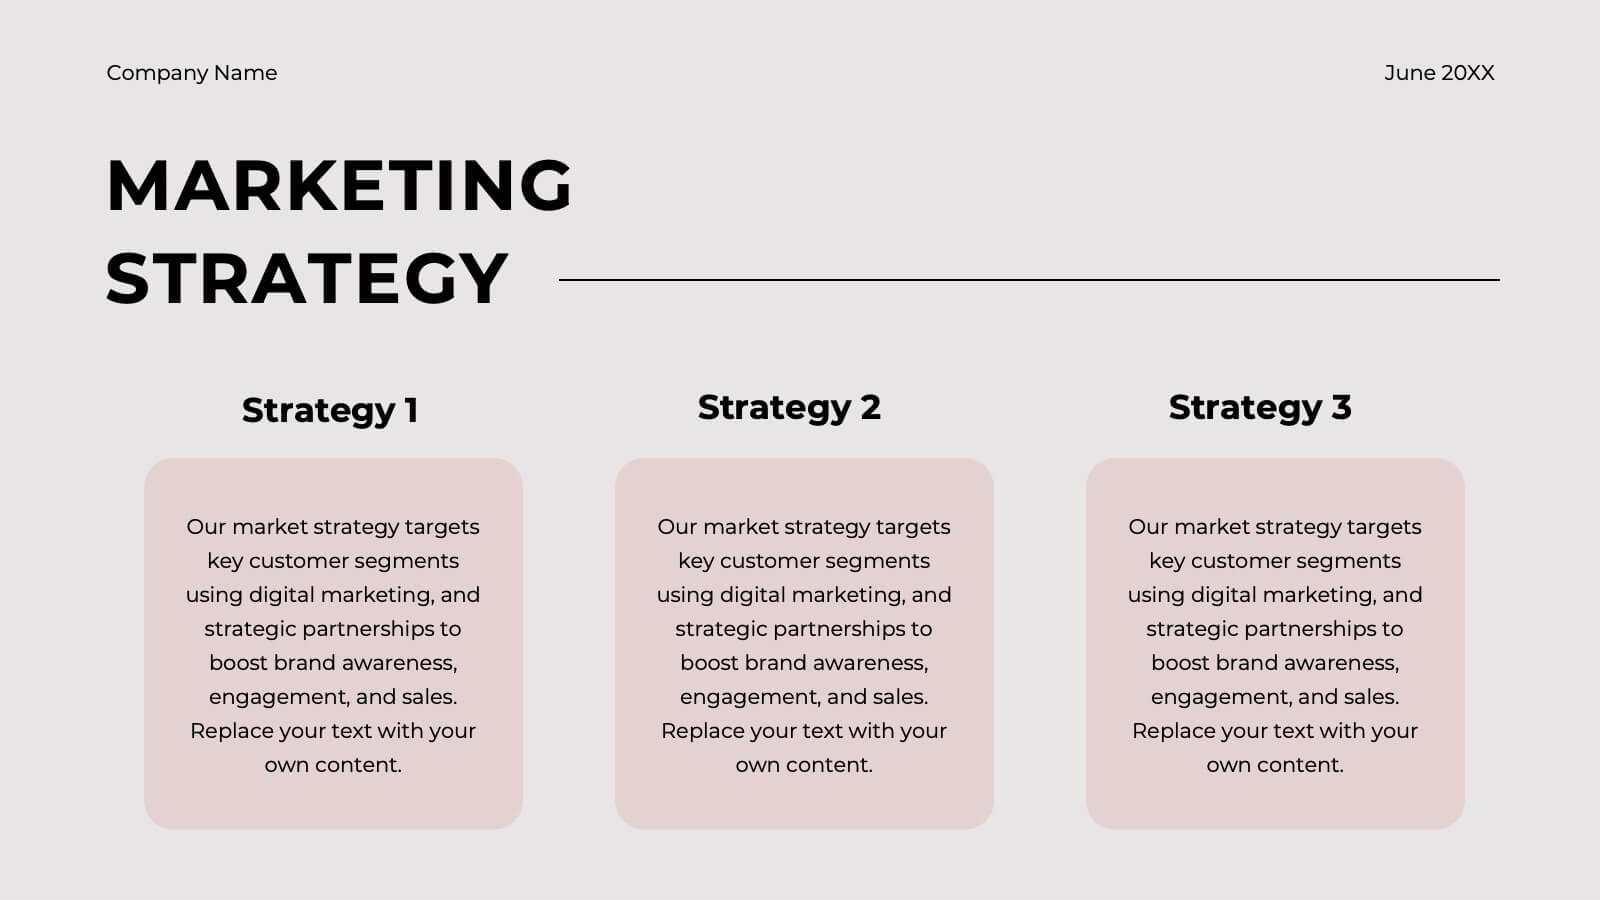
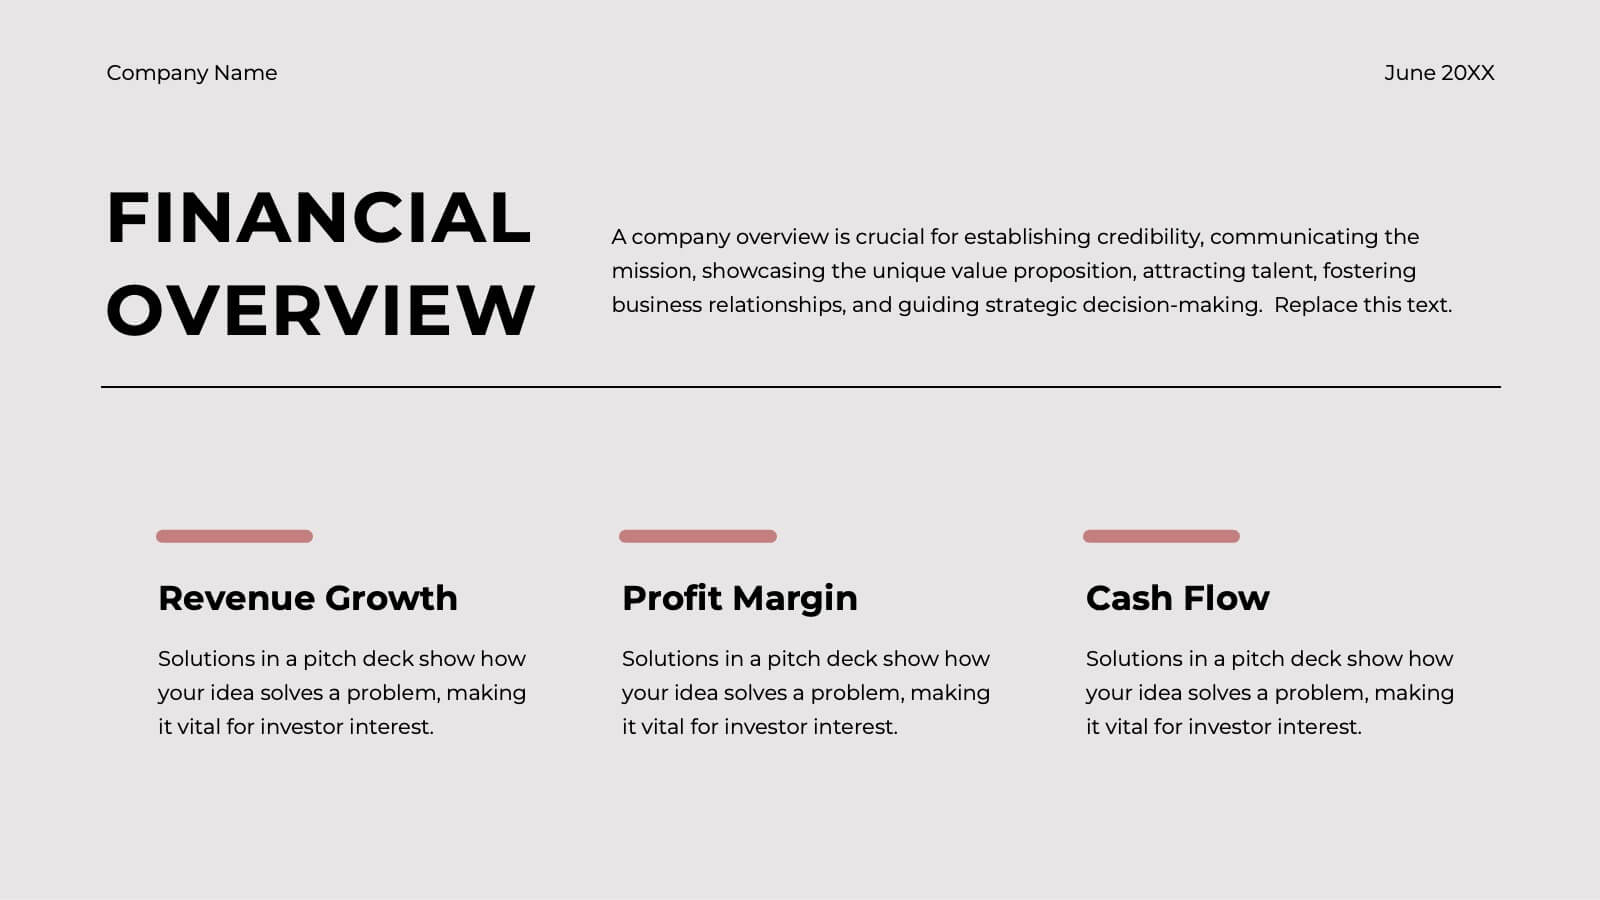
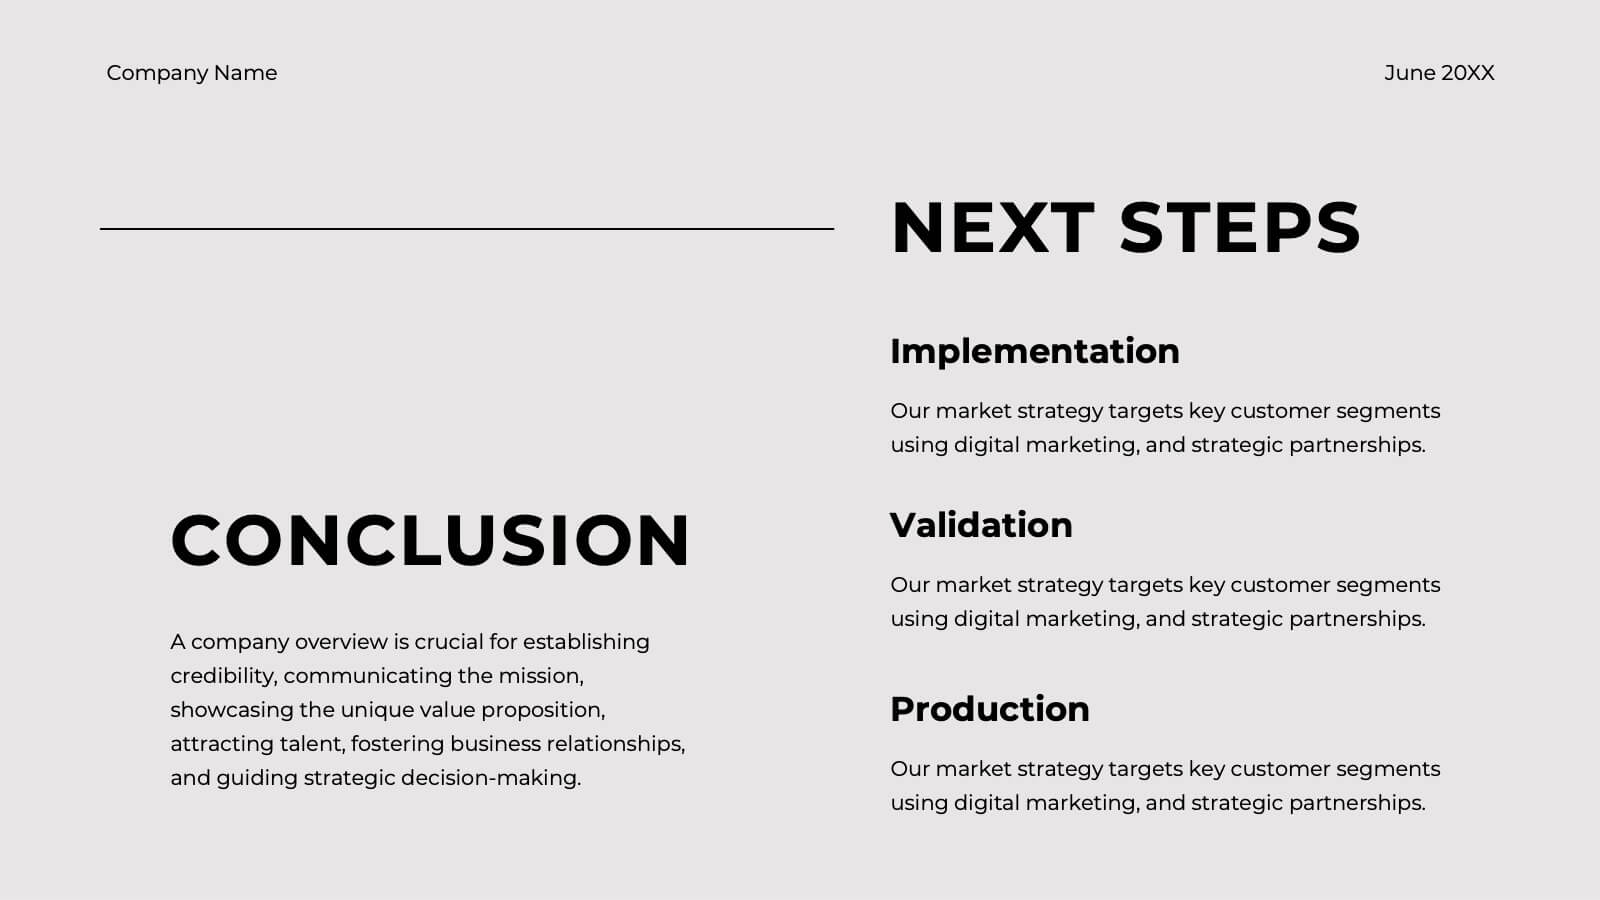
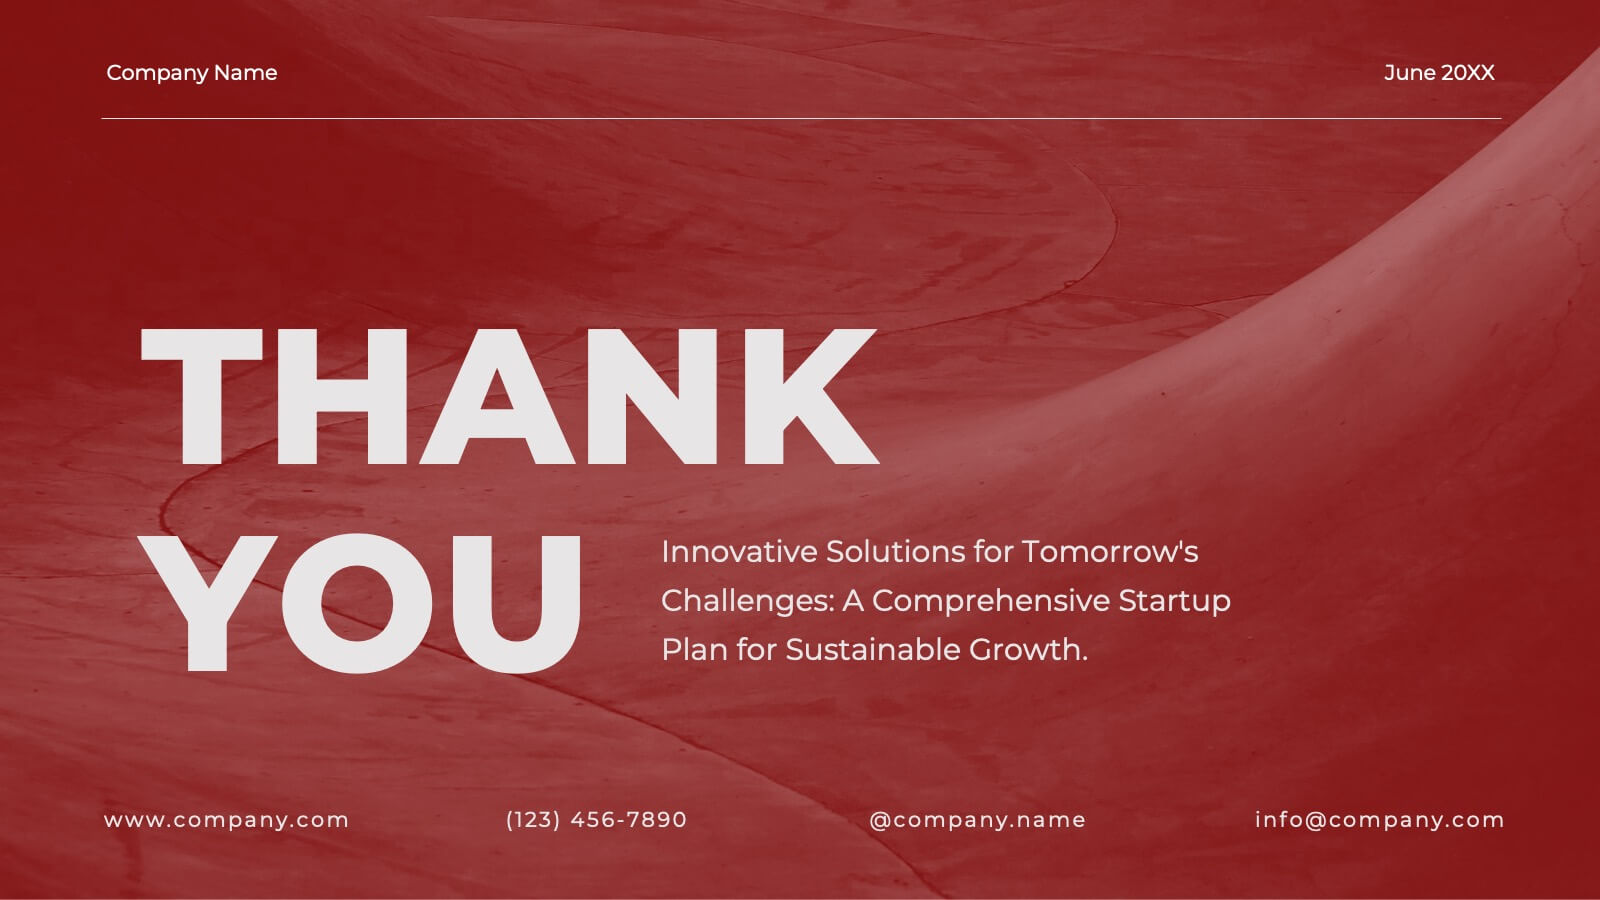
Ember Startup Growth Plan Presentation
Launch your entrepreneurial journey with this dynamic startup plan template! Perfect for detailing your mission, market strategy, and unique value proposition, it features professional slides for customer analysis, business models, and financial projections. Present your innovative ideas clearly and convincingly. Compatible with PowerPoint, Keynote, and Google Slides for seamless presentations on any platform.