


Características


¿Tienes alguna pregunta?
Recomendar


4 diapositivas
E-Learning Module Structure Presentation
Turn your lesson flow into a visual journey your audience can actually follow. This presentation template maps out the structure of an e-learning module with step-by-step clarity—ideal for course creators, instructional designers, or trainers. Easily customize each stage. Fully editable in PowerPoint, Keynote, and Google Slides for flexible use.


21 diapositivas
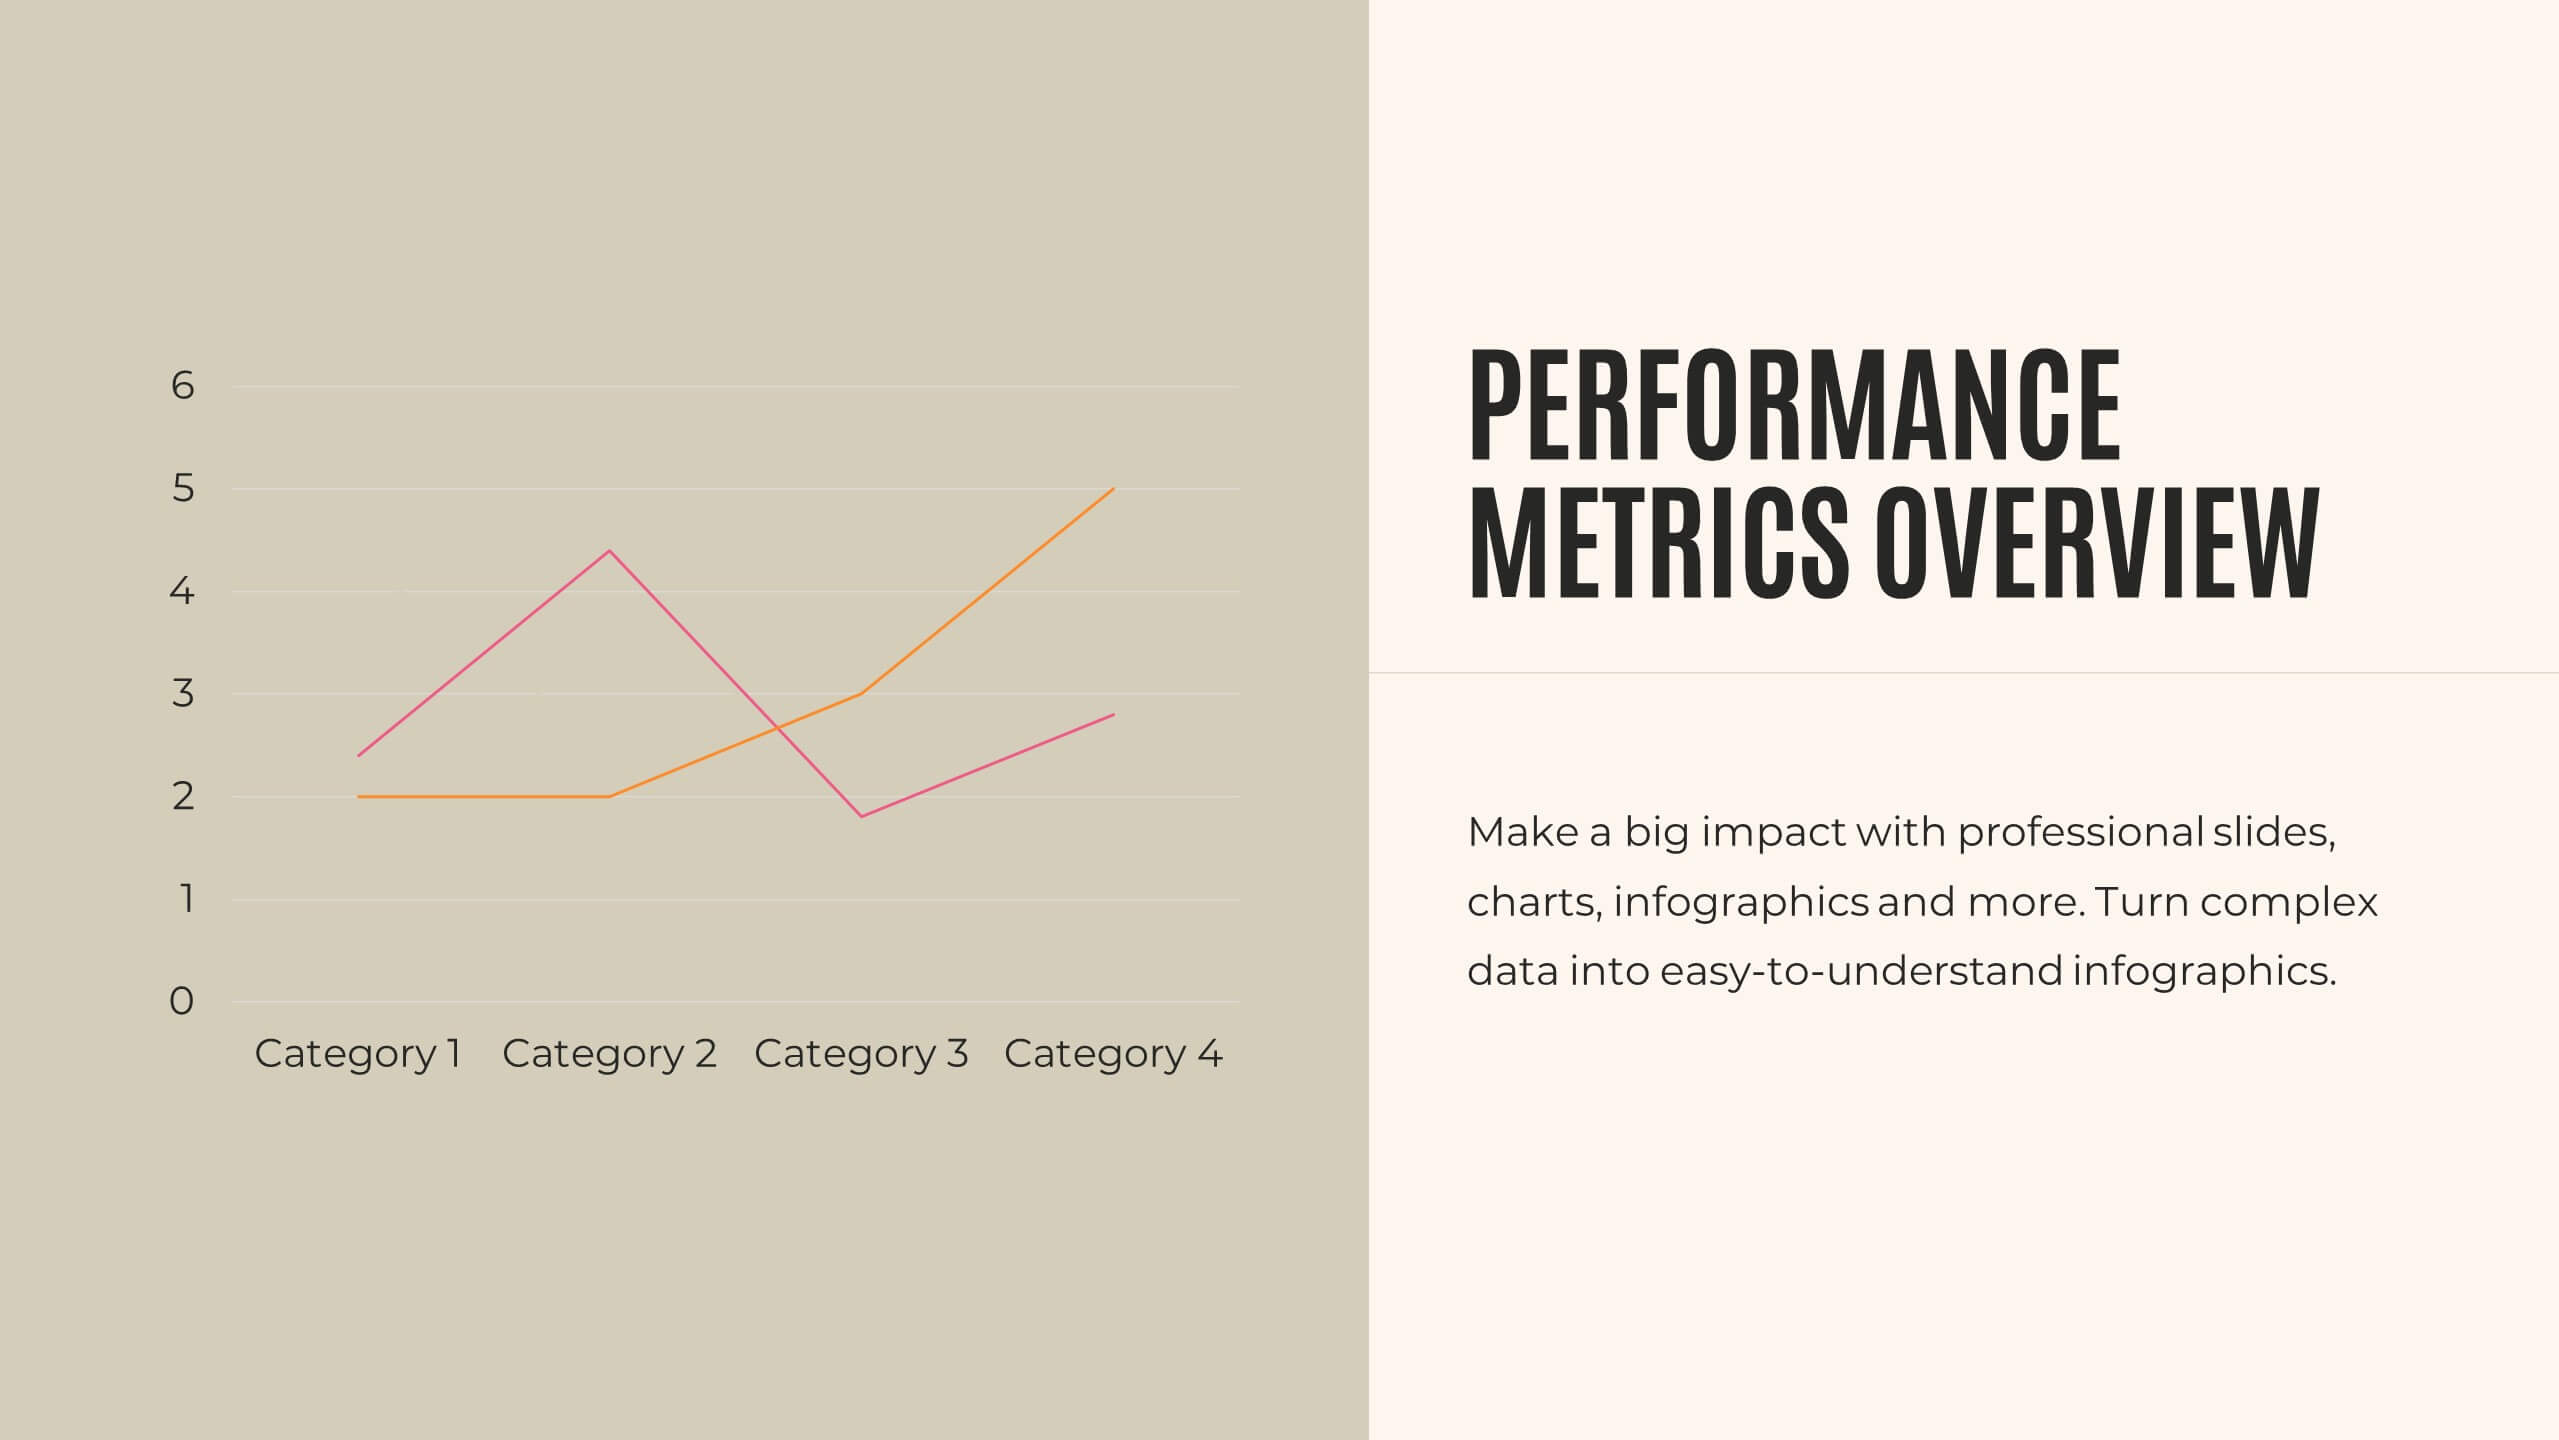
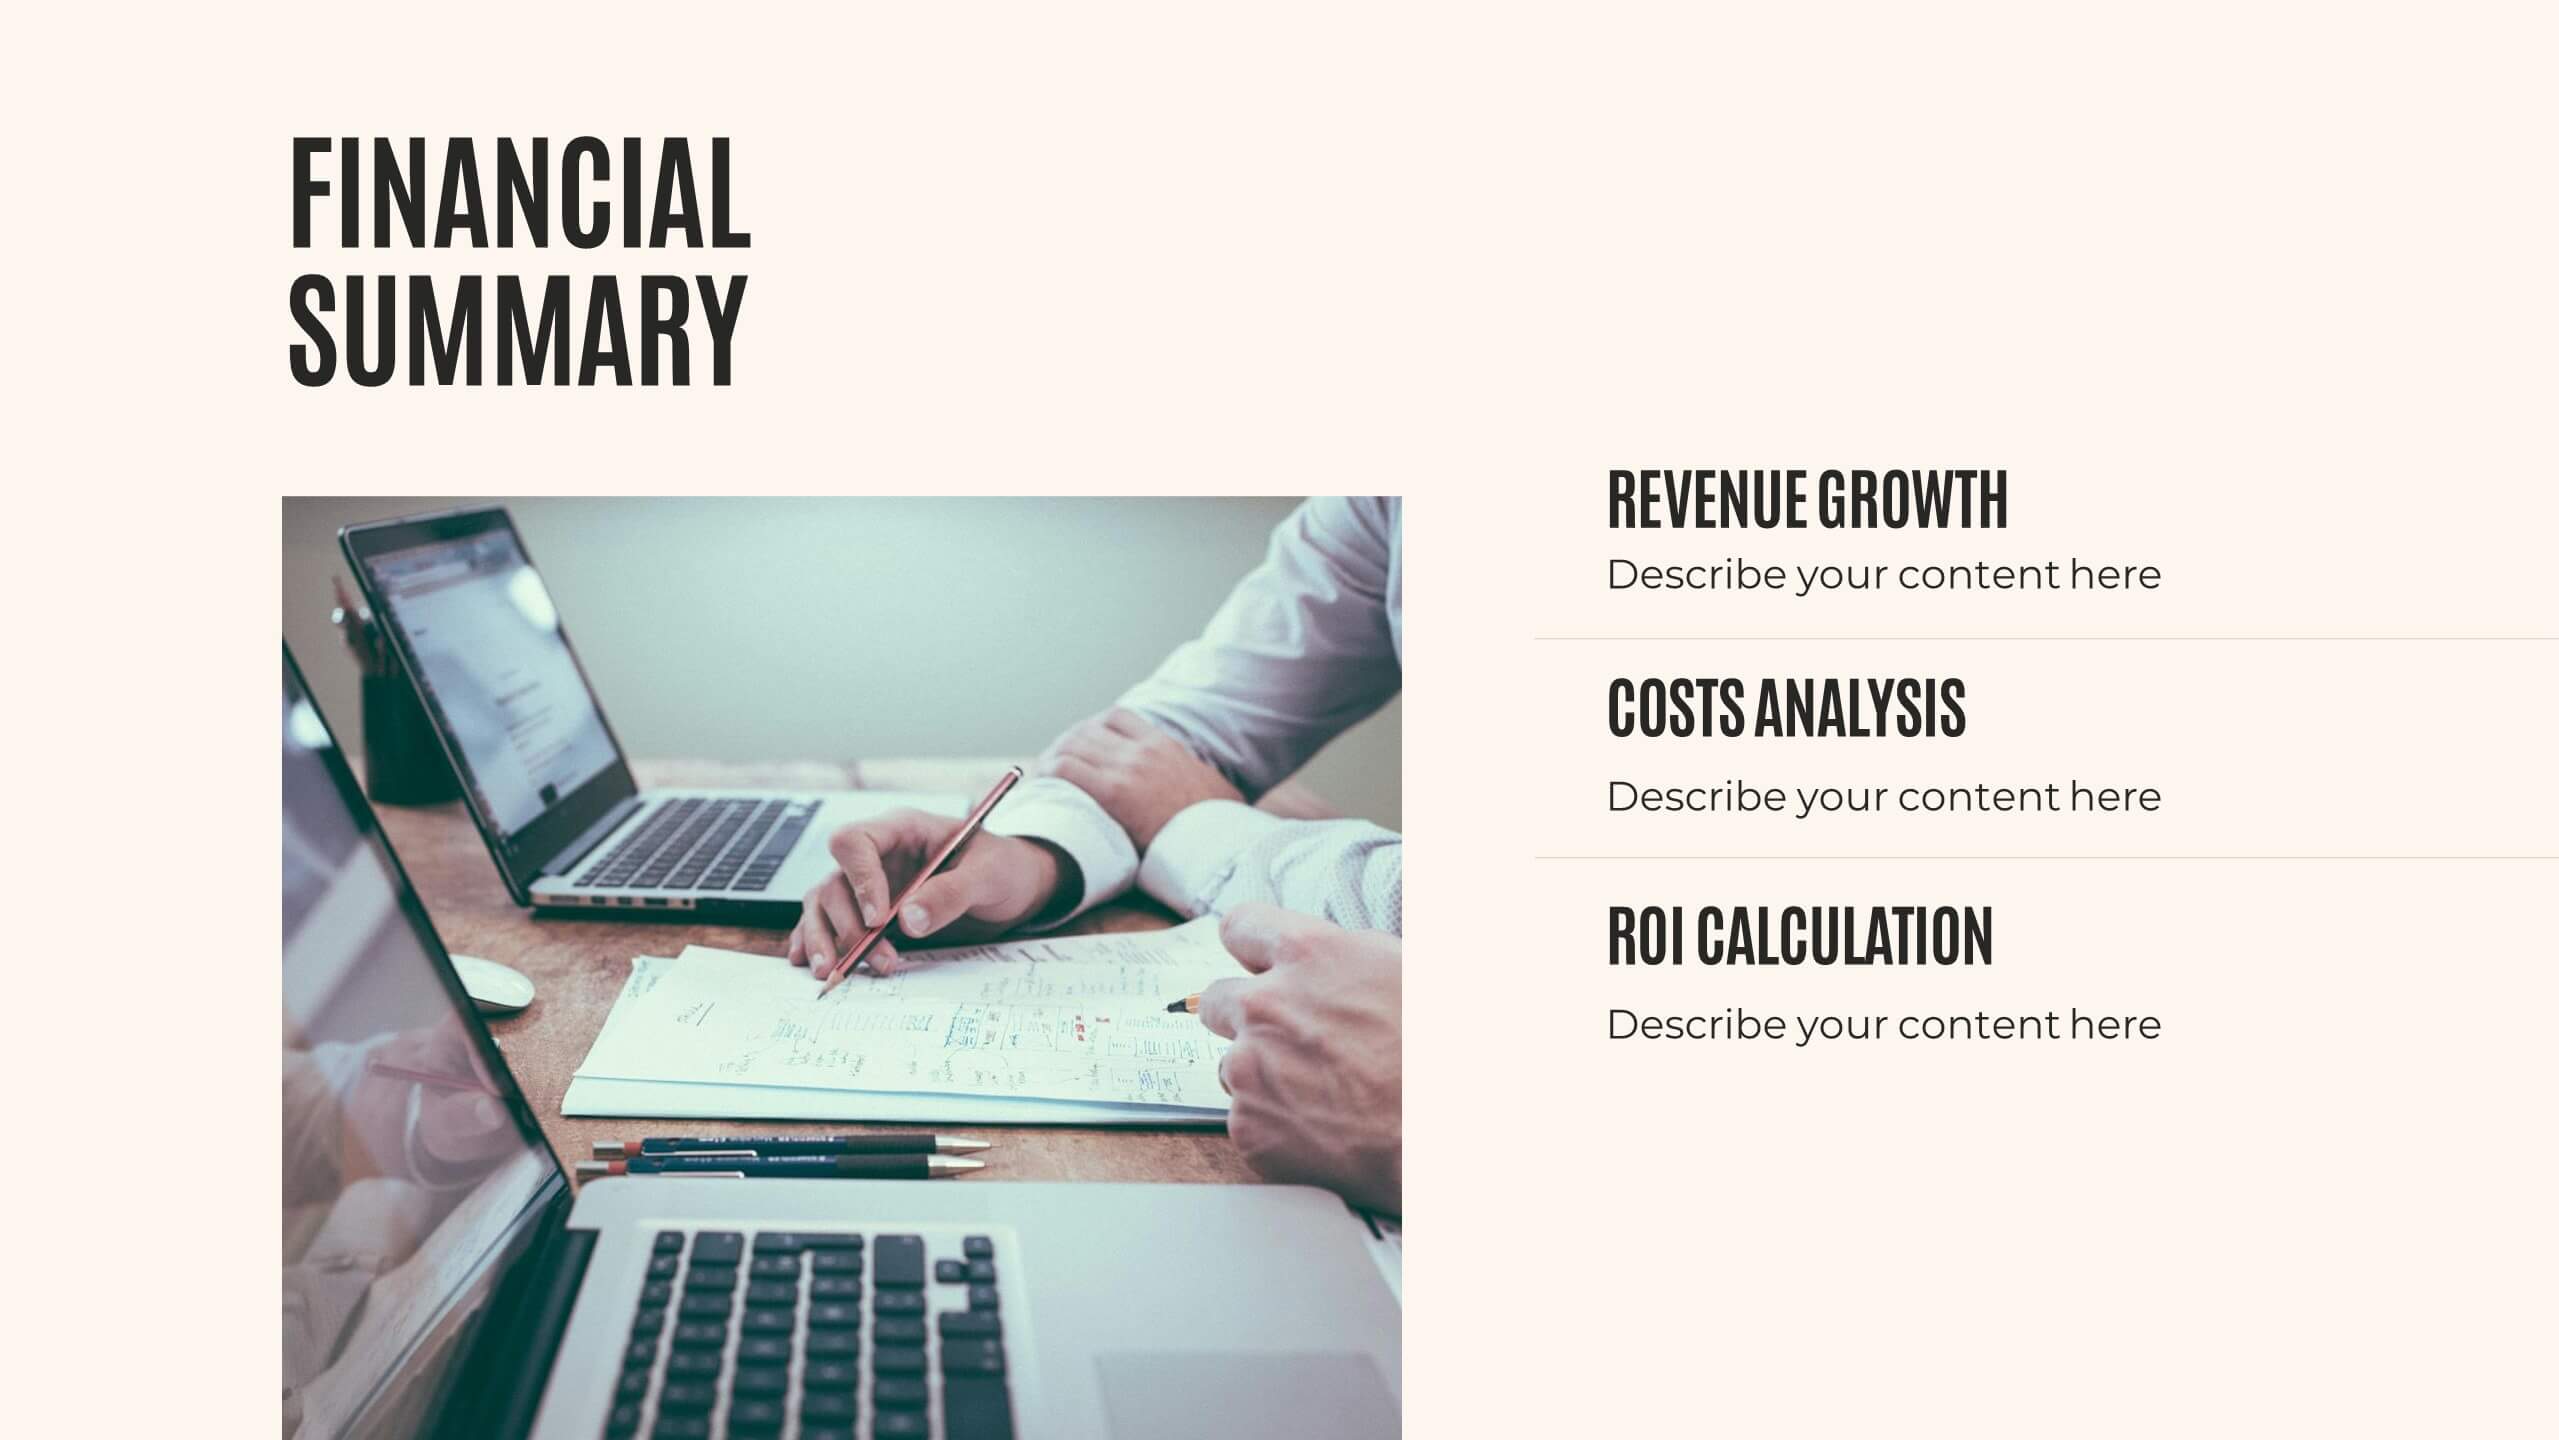
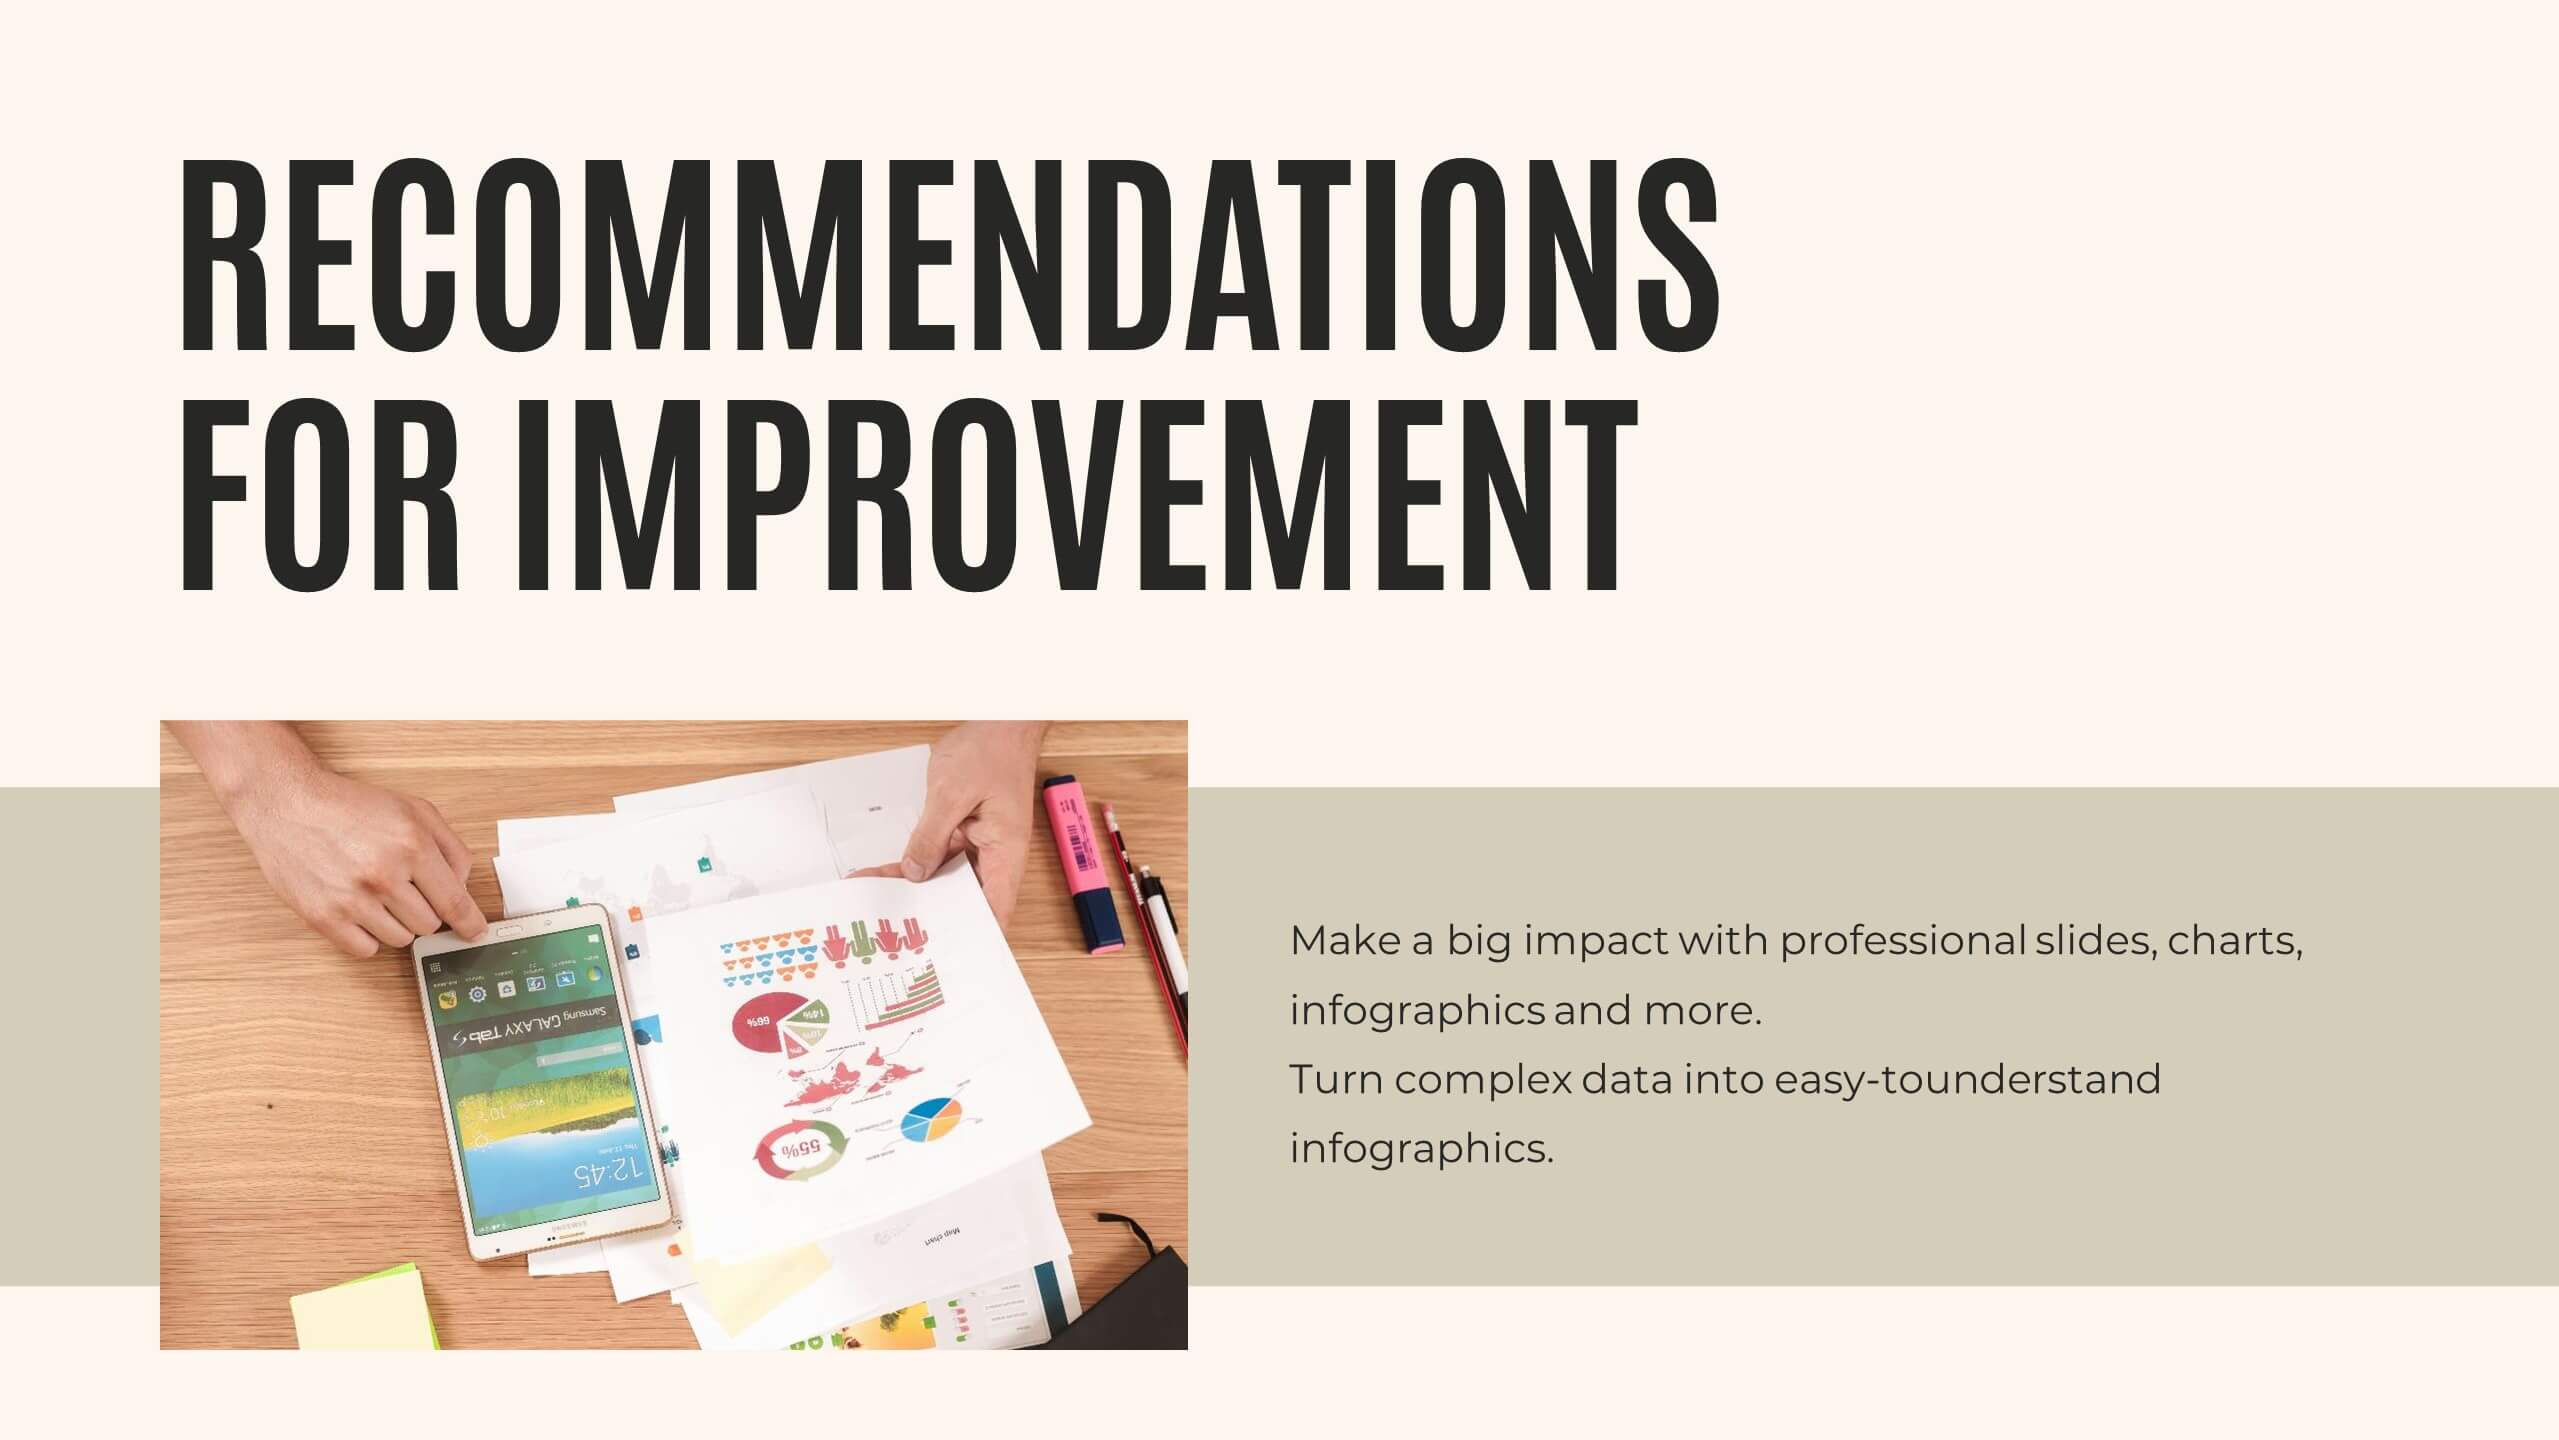
Journey Annual Report Presentation
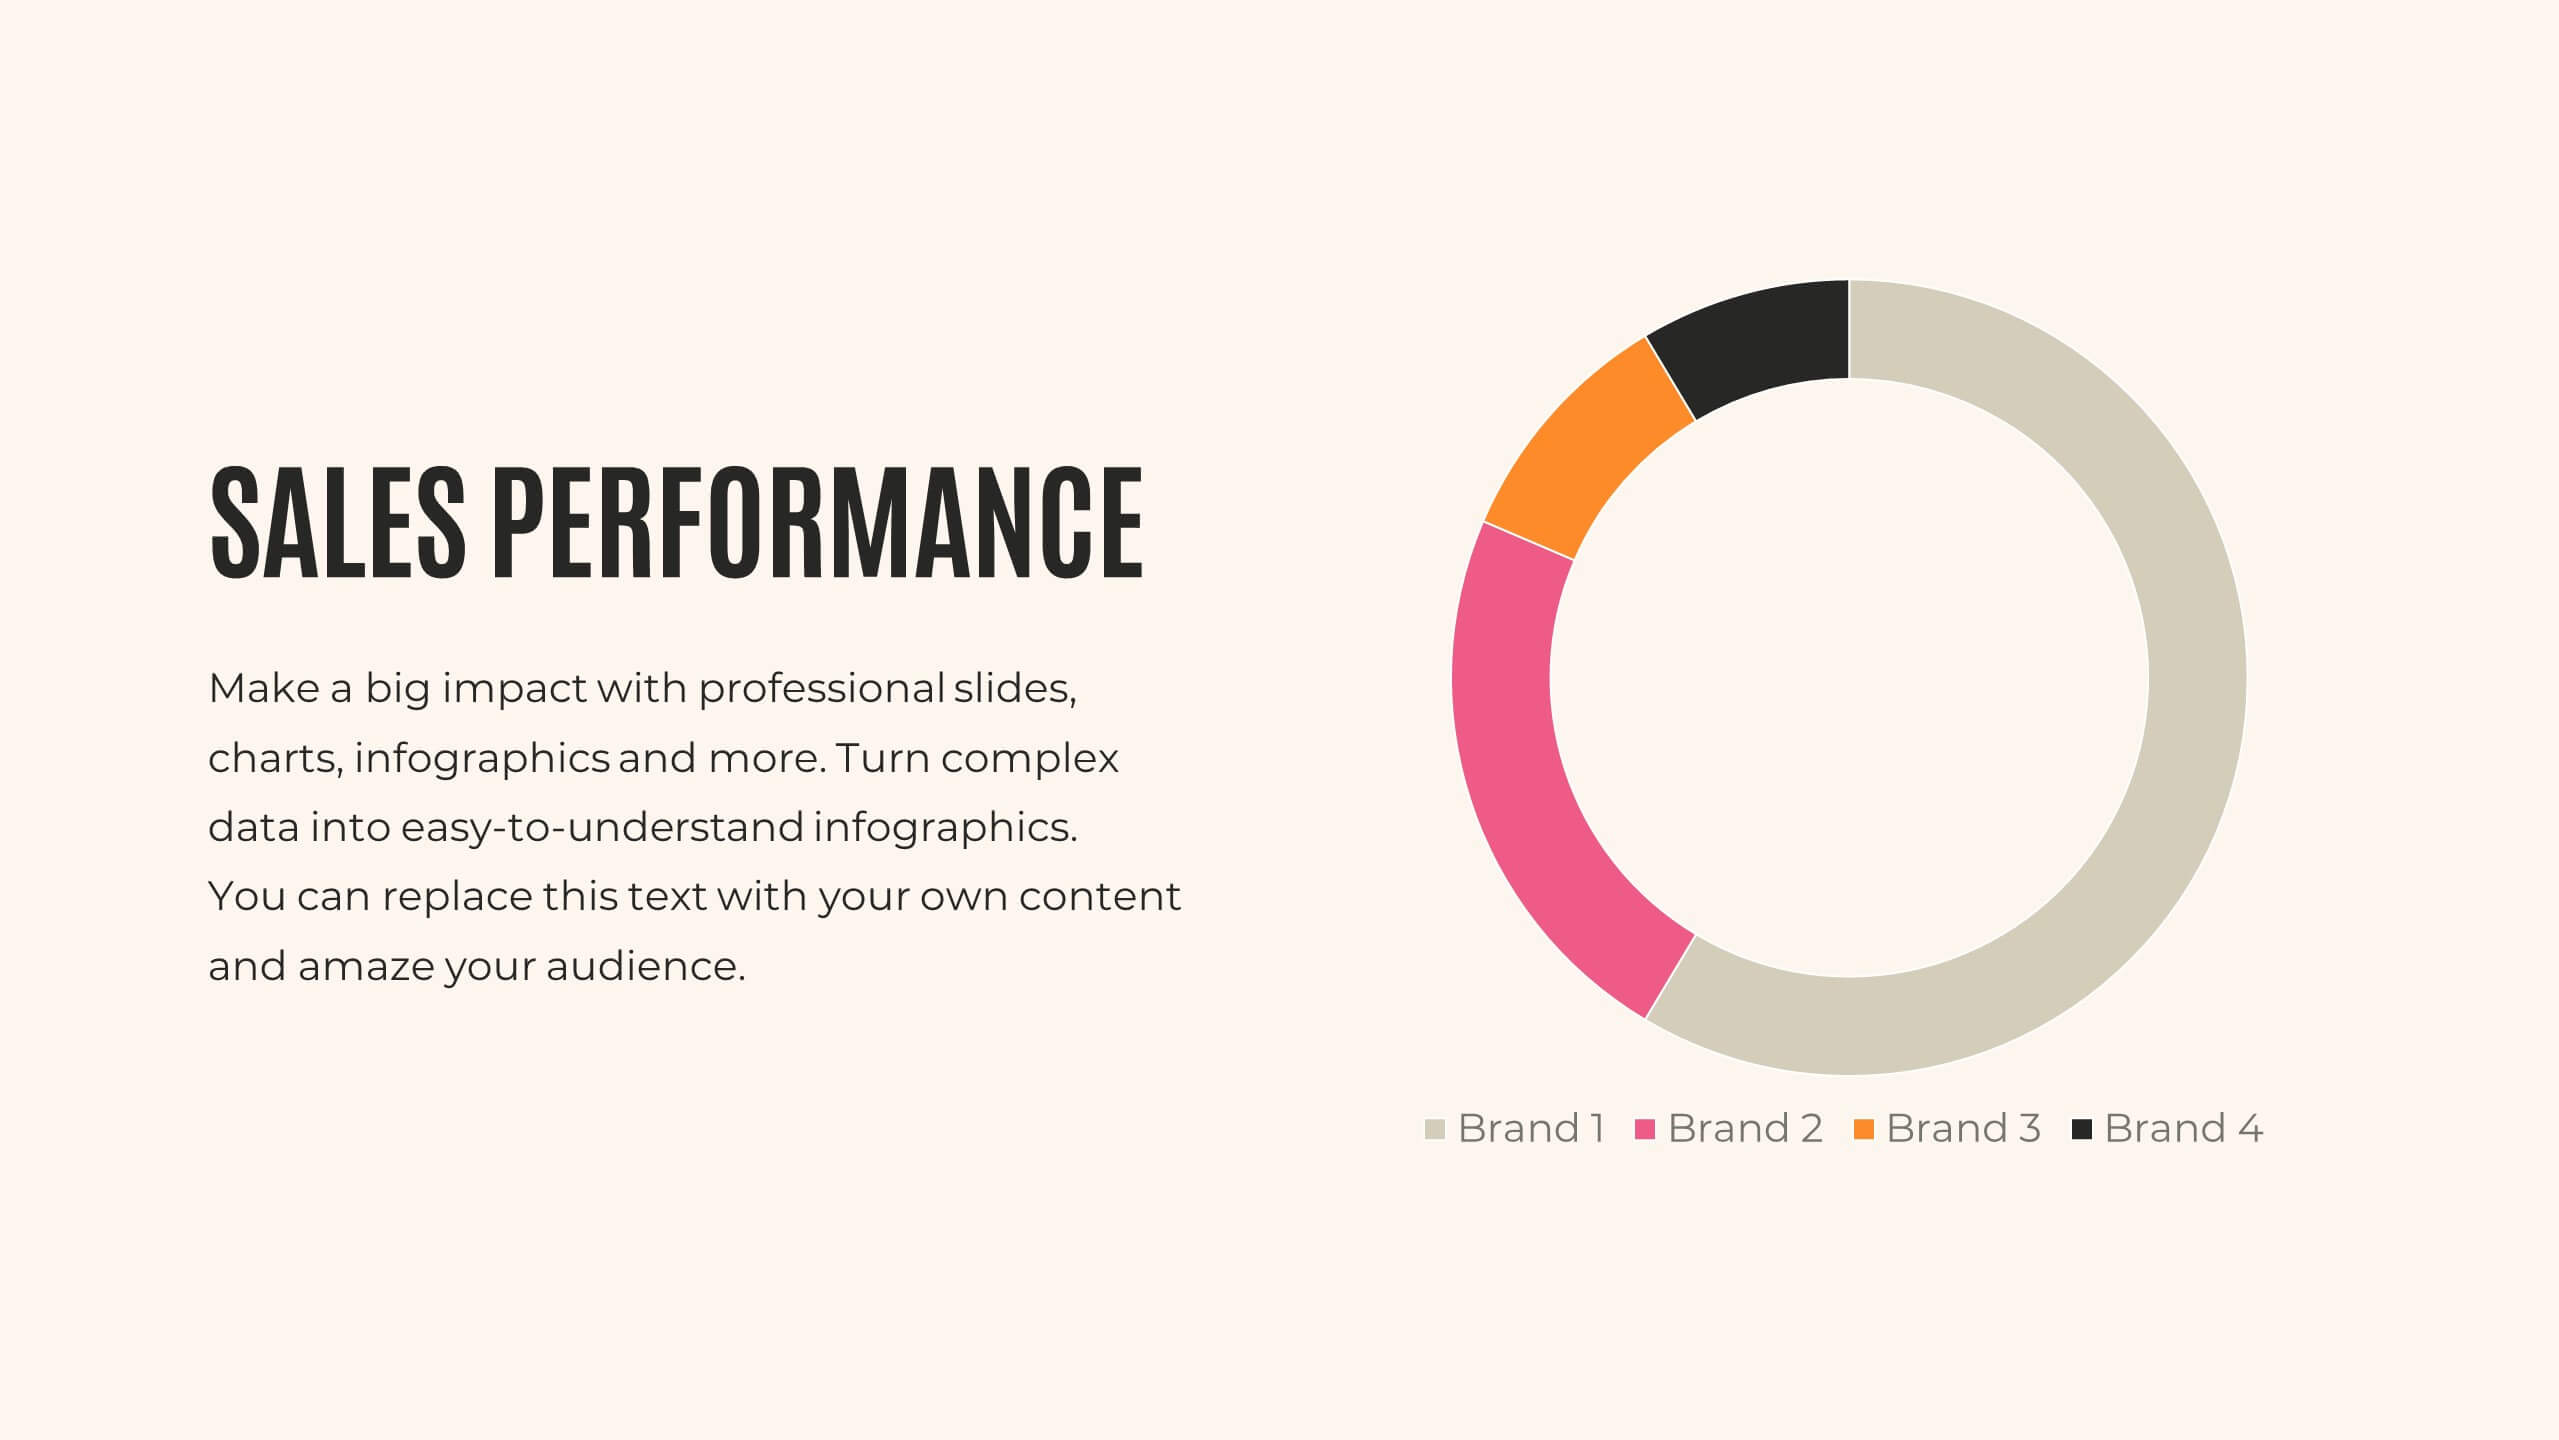
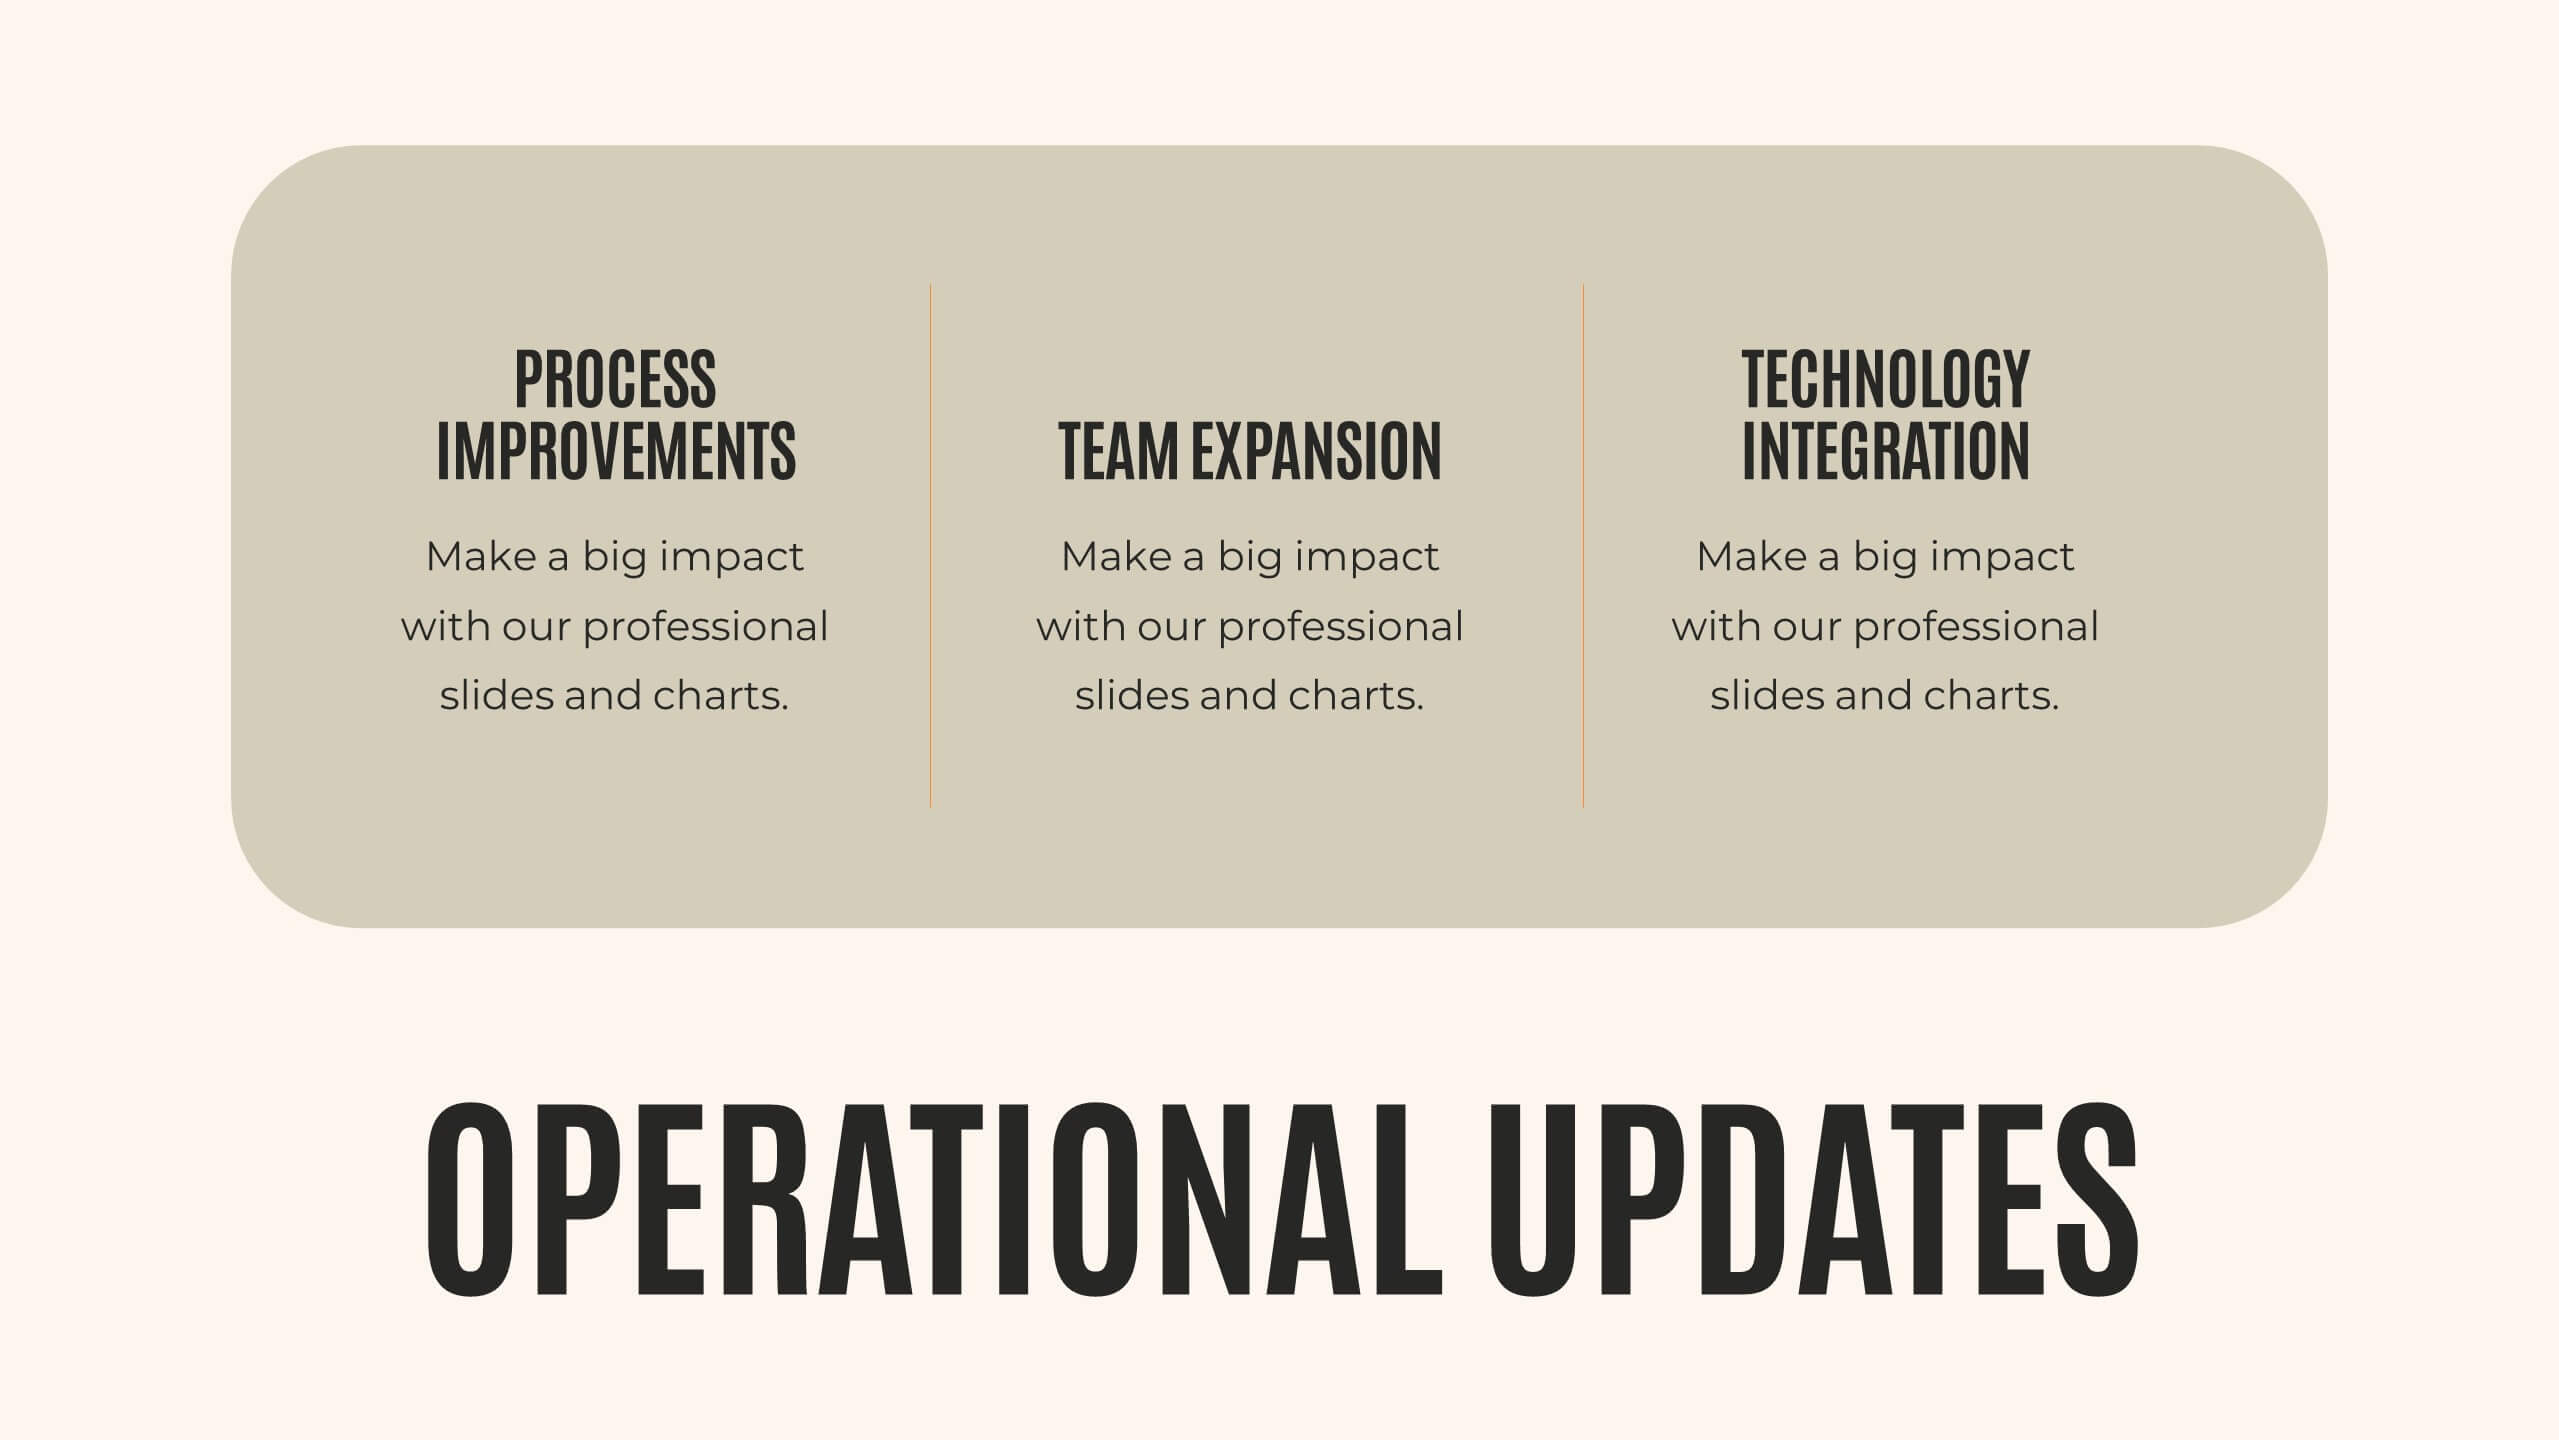
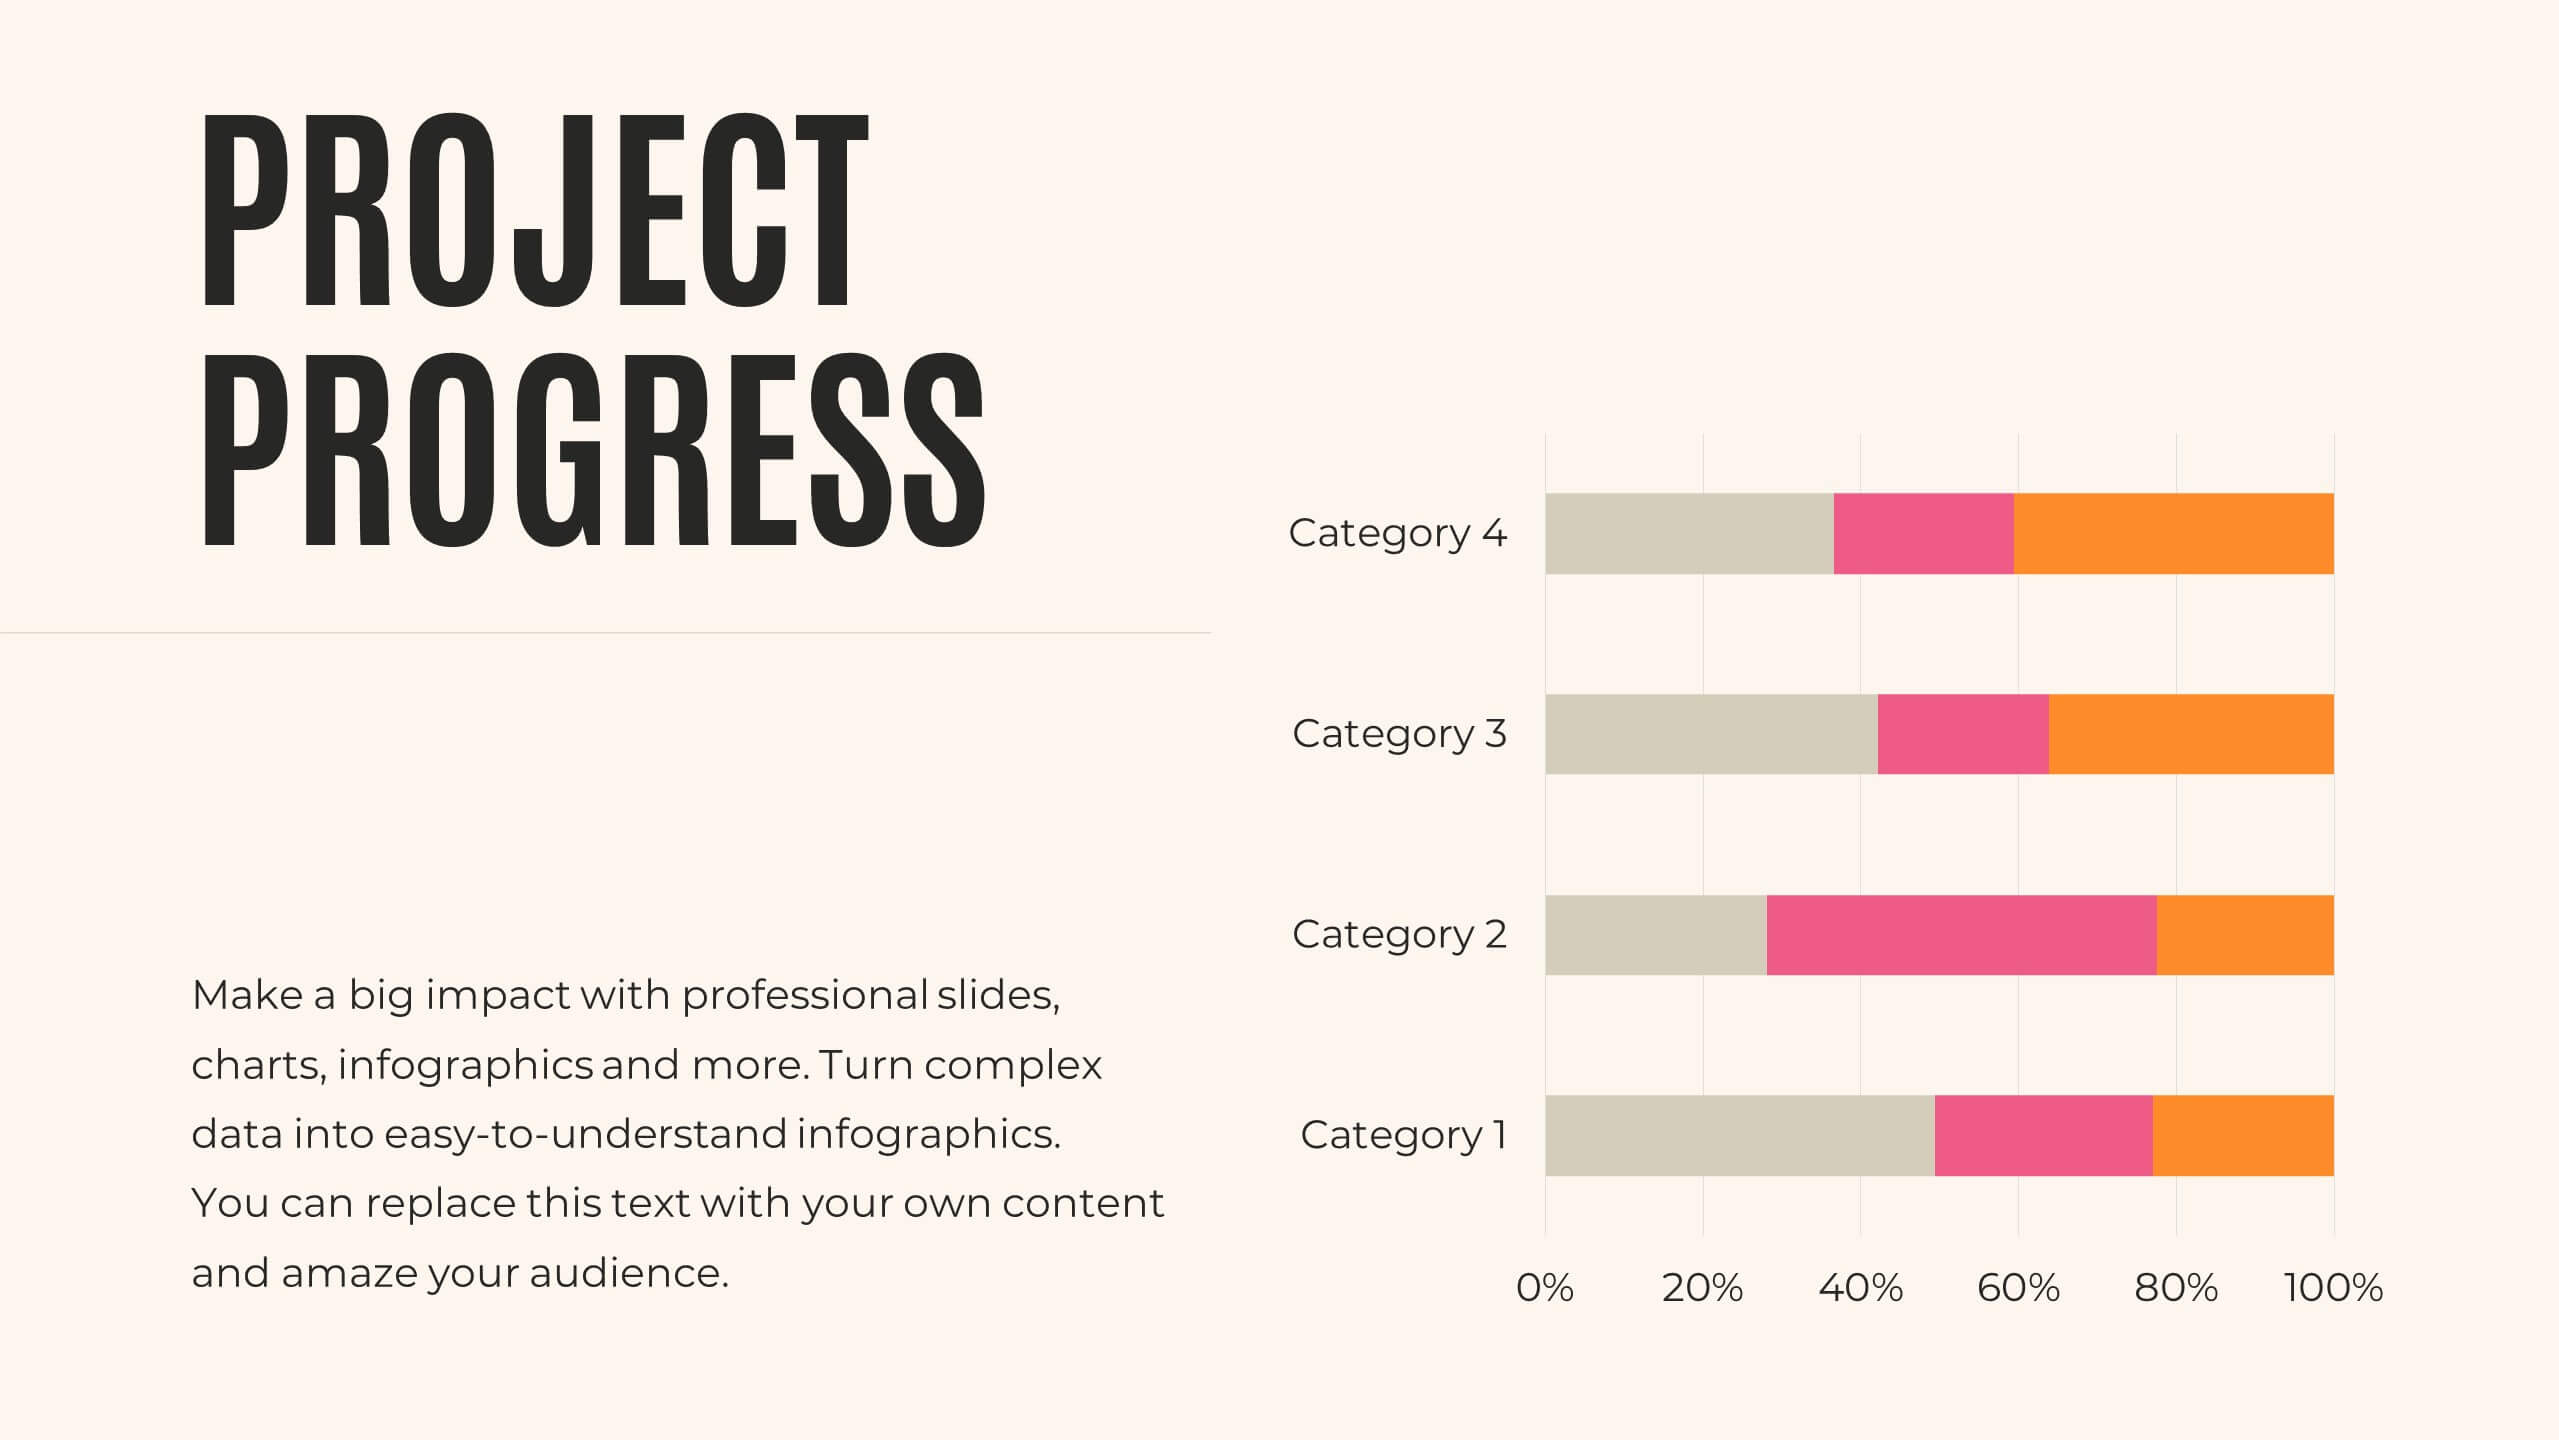
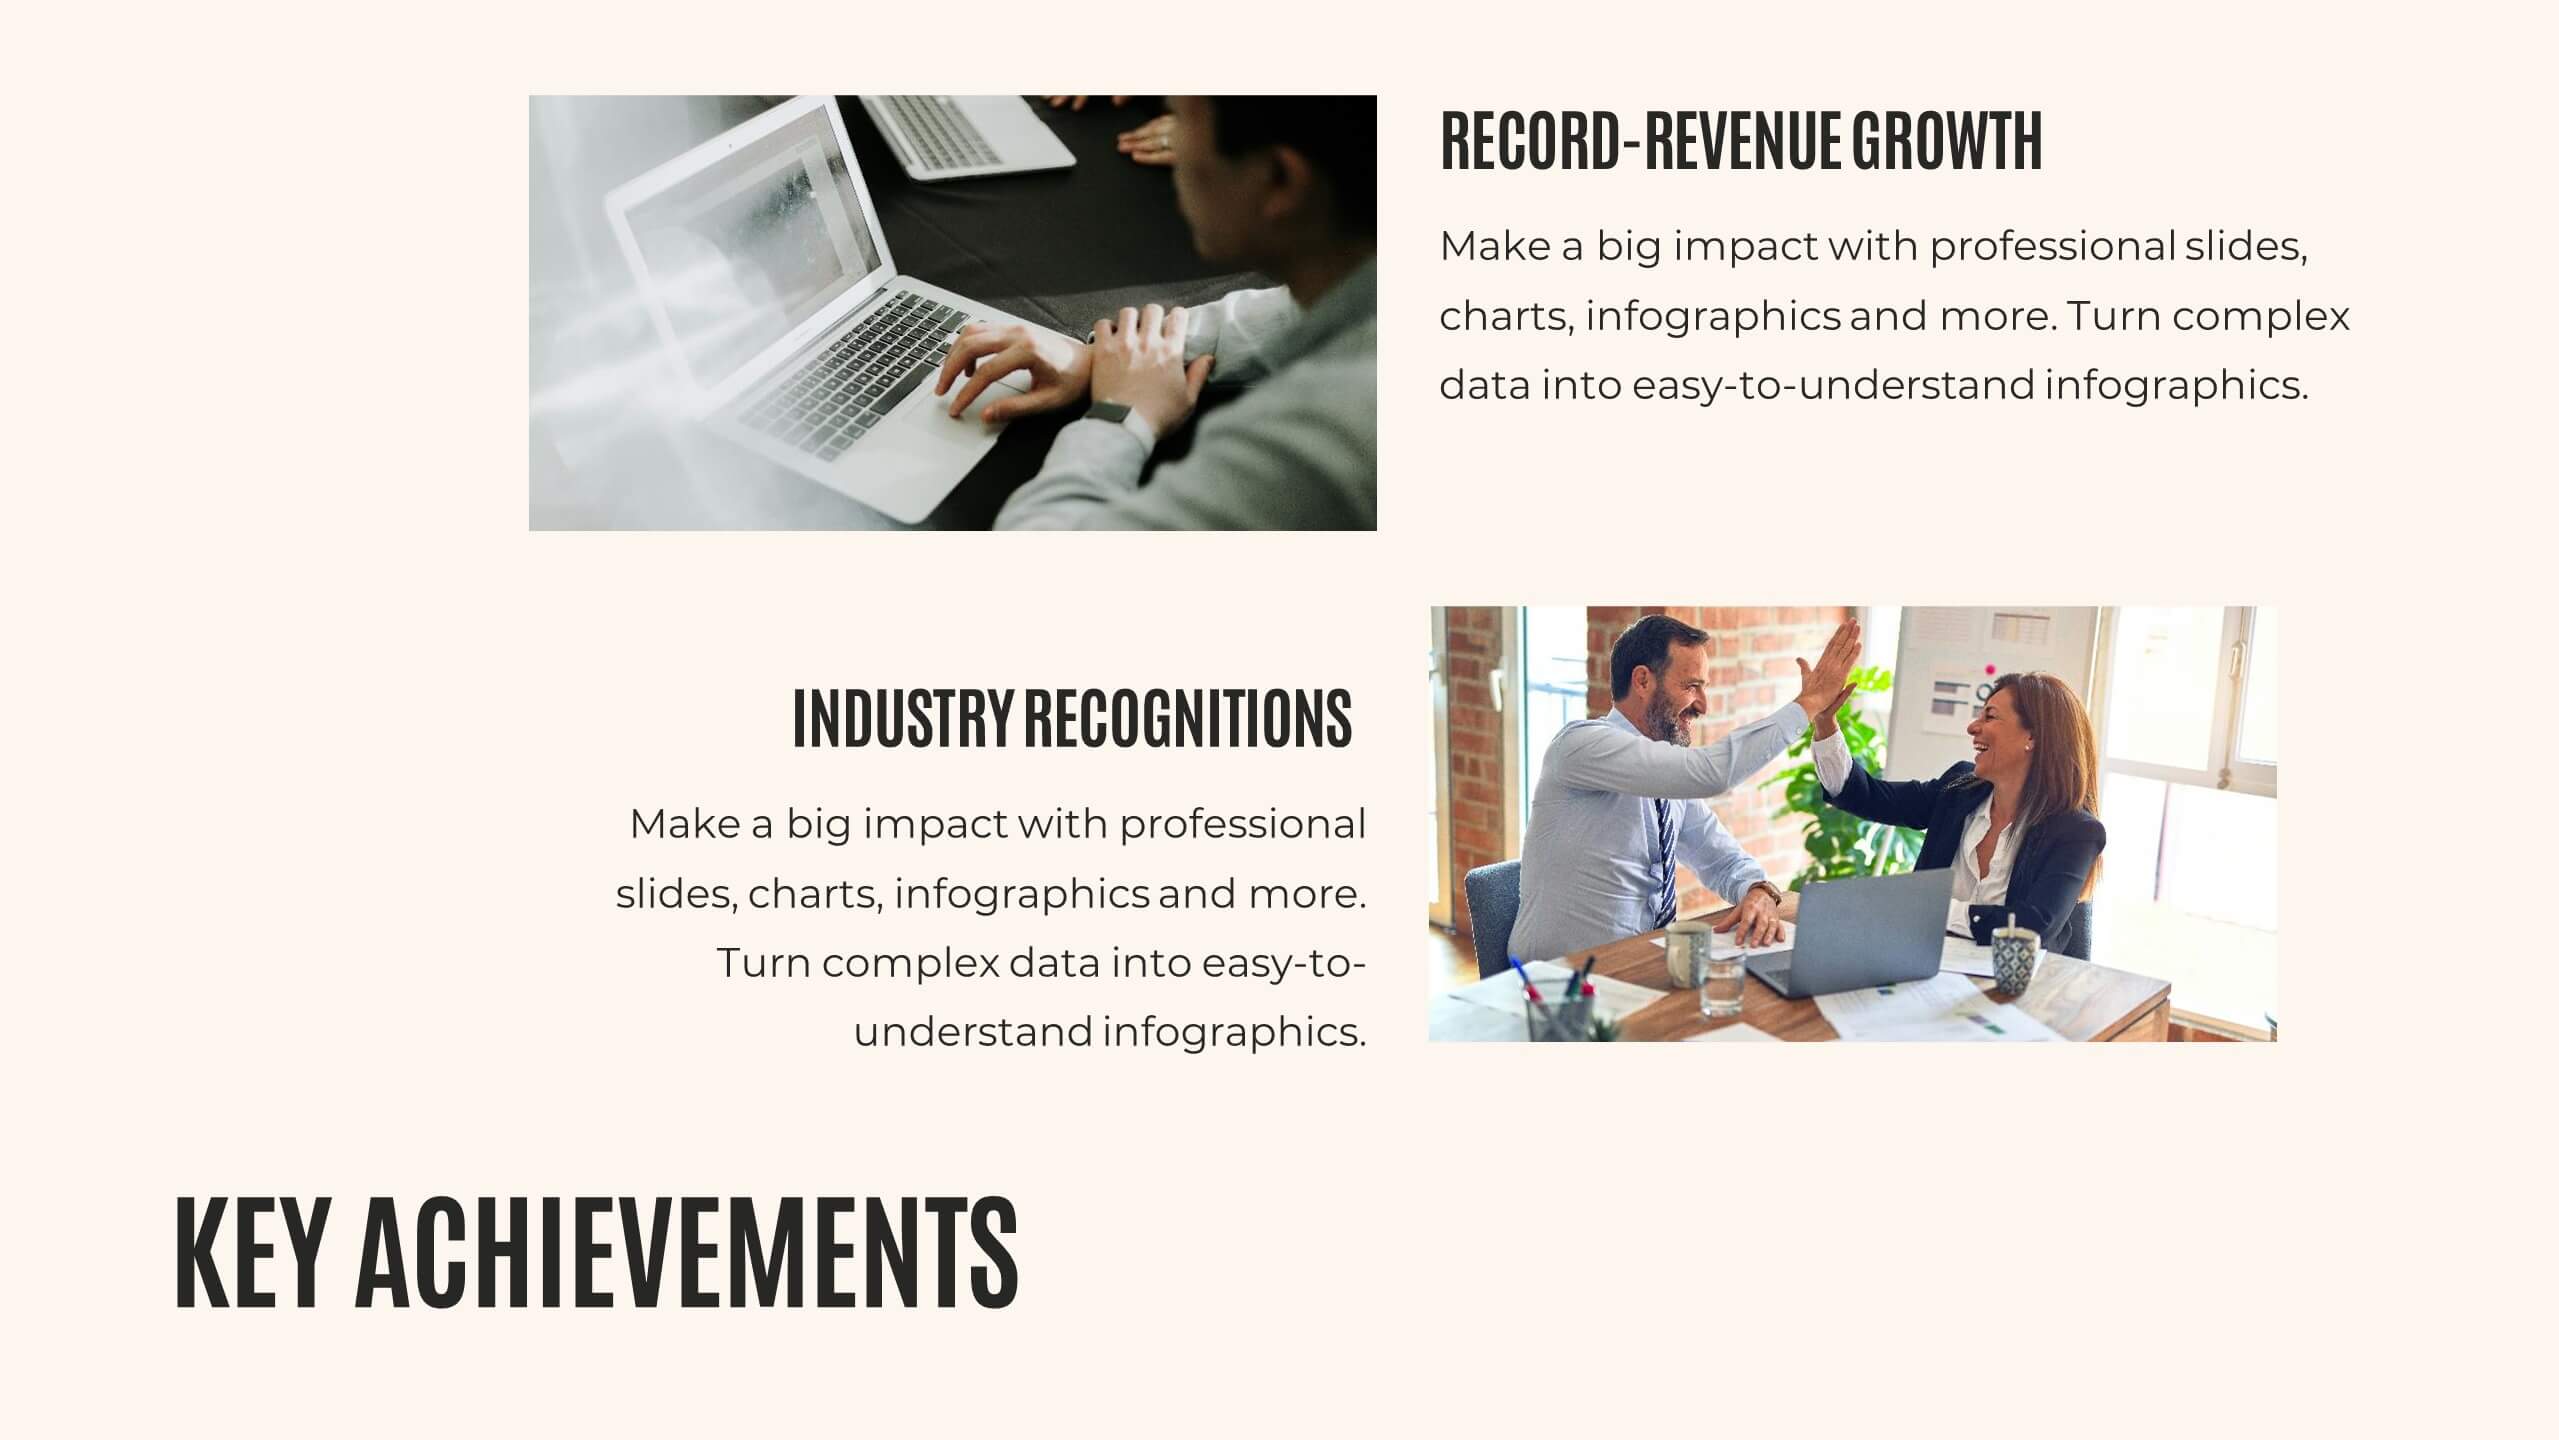
Present your annual report with clarity and impact! This template covers agenda, key highlights, financial summary, sales performance, and project progress. Ideal for detailing achievements, insights, and future priorities. Compatible with PowerPoint, Keynote, and Google Slides, it ensures your data is visually compelling and easy to understand. Showcase your success effortlessly!


5 diapositivas
Long-Term Business Strategy Framework
Outline your roadmap to sustainable growth with the Long-Term Business Strategy Framework Presentation. This slide features a bold, horizontal arrow layout divided into four segments—each representing a core phase of your strategic plan. It includes icons and space for key insights under each step, making it perfect for visualizing vision alignment, operational planning, or organizational milestones. Fully customizable in PowerPoint, Keynote, and Google Slides.


6 diapositivas
Geometric Patterns Infographics
Step into the fascinating realm of geometric patterns! This infographic invites you to explore the captivating world of shapes and symmetries. From the mesmerizing allure of intricate designs to the mathematical precision behind each pattern, we'll reveal the secrets that make geometric patterns a timeless art form. Delve into the core principles of geometric patterns. Gain insights into the geometry behind these intricate designs, from basic shapes like circles and squares to more complex constructions. Uncover the history and cultural significance of these patterns, from ancient civilizations to contemporary art and design. With this captivating infographic, compatible with PowerPoint, Keynote, and Google Slides, sharing your enthusiasm for geometric patterns has never been easier. Empower yourself with the knowledge to appreciate and create these mesmerizing designs. Dive into the world of geometric patterns and embark on a journey of artistic exploration and appreciation.


5 diapositivas
Eco-Friendly Practices Summary Presentation
Bring your green initiatives to life with a vibrant, city-inspired visual that makes sustainability easy to explain and engaging to explore. This presentation helps you outline key eco-friendly efforts, goals, and results in a clean, modern layout. Fully customizable and compatible with PowerPoint, Keynote, and Google Slides.


7 diapositivas
Sports Infographic Presentation Template
A sports infographic is a visual representation of information or knowledge related to a sport or sporting event. This template allows you to include statistics, performance metrics, records, and other relevant data that helps to explain and showcase the sport. Our sports infographic also include images, illustrations, and other graphic elements that can help to tell a story. They can be used in a variety of settings. The goal of this sports infographic is to present your information in a clear and engaging way, and to help your audience understand and appreciate the sport more deeply.


7 diapositivas
Project Summary Infographic
This collection of project summary slides is designed to streamline the presentation of project outcomes and statuses effectively. The slides feature a variety of layouts tailored to emphasize critical data and conclusions, making them an ideal choice for project managers and teams who need to report on progress and results. Each slide is crafted with a clear focus on visual hierarchy, which helps in directing the viewer's attention to the most important information. Use of bullet points, charts, and infographics enhances the viewer's understanding by breaking down complex data into easy-to-digest visuals. Color coding is effectively utilized to differentiate between themes or topics, which aids in quick comprehension. These slides are versatile enough to be used in various scenarios, such as end-of-project presentations, stakeholder updates, or team meetings. They provide a professional and polished way to showcase project achievements, timelines, and future steps. Overall, these summary slides are a valuable tool for anyone looking to present project information clearly and concisely, ensuring that key points are communicated effectively and are memorable.


6 diapositivas
Business Process Checklist Overview Presentation
Simplify your workflow presentations with the Business Process Checklist Overview Presentation. This circular layout is ideal for outlining five sequential or cyclical steps in a business process, featuring icon-labeled checkpoints and editable titles. Each step is visually marked with subtle checkmarks, making it perfect for status tracking, task progression, or implementation plans. Clean, professional, and fully customizable in PowerPoint, Keynote, and Google Slides.


7 diapositivas
Target Market Identification Strategy
Spot your ideal customers with precision using this lightbulb-centered layout designed to highlight key market segments and decision-making factors. Whether you're building buyer personas or refining your strategy, this slide presents your insights in a smart, structured way. Fully compatible with PowerPoint, Keynote, and Google Slides.


4 diapositivas
Stakeholder Analysis and Engagement Presentation
Enhance your strategic planning with our Stakeholder Analysis and Engagement Presentation template. Designed to map influence and interest effectively, this tool aids in identifying key stakeholders and tailoring engagement strategies. It’s compatible with PowerPoint, Keynote, and Google Slides, perfect for impactful presentations and workshops.


5 diapositivas
AIDA Model Marketing Infographics
The AIDA model is a marketing and advertising framework that outlines the stages a consumer goes through during the decision-making process.This AIDA model is a widely used marketing framework that outlines the stages a customer goes through in the buying process: Attention, Interest, Desire, and Action. These infographic templates are effective tools for explaining and illustrating the AIDA model in marketing presentations, training sessions, or educational materials. These infographics will enable your audience to apply the AIDA model in their marketing strategies, campaigns, and customer engagement efforts.


10 diapositivas
Overcoming Market Challenges Presentation
Overcome business obstacles with confidence using this Overcoming Market Challenges template. Designed with a dynamic step-by-step growth visual, this slide helps illustrate challenges, solutions, and progress in an engaging way. Ideal for strategy meetings, financial forecasts, and competitive analysis, this template makes complex information easy to understand. Fully editable for PowerPoint, Keynote, and Google Slides.


7 diapositivas
Market Research Data Insights
Present insights with impact using this Market Research Data Insights slide. Featuring six circular data points with icons and space for strategic commentary, it's ideal for showcasing key findings, trends, or survey results. Fully editable in PowerPoint, Keynote, and Google Slides for versatile use.


21 diapositivas
Moonshade Strategic Planning Report Presentation
This strategic planning template provides a comprehensive framework to align your business objectives with actionable plans. With sections for SWOT analysis, resource allocation, key metrics, and growth opportunities, it ensures that every element is covered for successful execution. Customizable in PowerPoint, Keynote, and Google Slides, it's perfect for building focused, strategic initiatives.


6 diapositivas
Porter's Five Forces Competitive Rivalry Infographics
Analyze competitive rivalry effectively with our Porter's Five Forces Competitive Rivalry infographic template. This template is fully compatible with popular presentation software like PowerPoint, Keynote, and Google Slides, allowing you to easily customize it to illustrate and communicate the factors influencing competitive rivalry within an industry. The Porter's Five Forces Competitive Rivalry infographic template offers a visually engaging platform to outline Michael Porter's framework for analyzing competitive dynamics, with a focus on the competitive rivalry component. Whether you're a business strategist, analyst, or anyone interested in understanding industry competition, this template provides a user-friendly canvas to create informative presentations and educational materials. Deepen your understanding of Competitive Rivalry with this SEO-optimized infographic template, thoughtfully designed for clarity and ease of use. Customize it to showcase the factors affecting rivalry, such as the number of competitors, industry growth, differentiation, and exit barriers, ensuring that your audience gains valuable insights into competitive forces at play. Start crafting your personalized infographic today to analyze and strategize for competitive advantage effectively.


4 diapositivas
Idea Validation and Business Feasibility Presentation
Clarify your strategy with the Idea Validation and Business Feasibility Presentation. This layout uses a sleek, linear flow anchored by a central lightbulb icon to guide your audience through three key checkpoints—validation, feasibility, and readiness. Each step is color-coded and icon-marked to enhance clarity. Fully editable in PowerPoint, Canva, Google Slides, and Keynote.


22 diapositivas
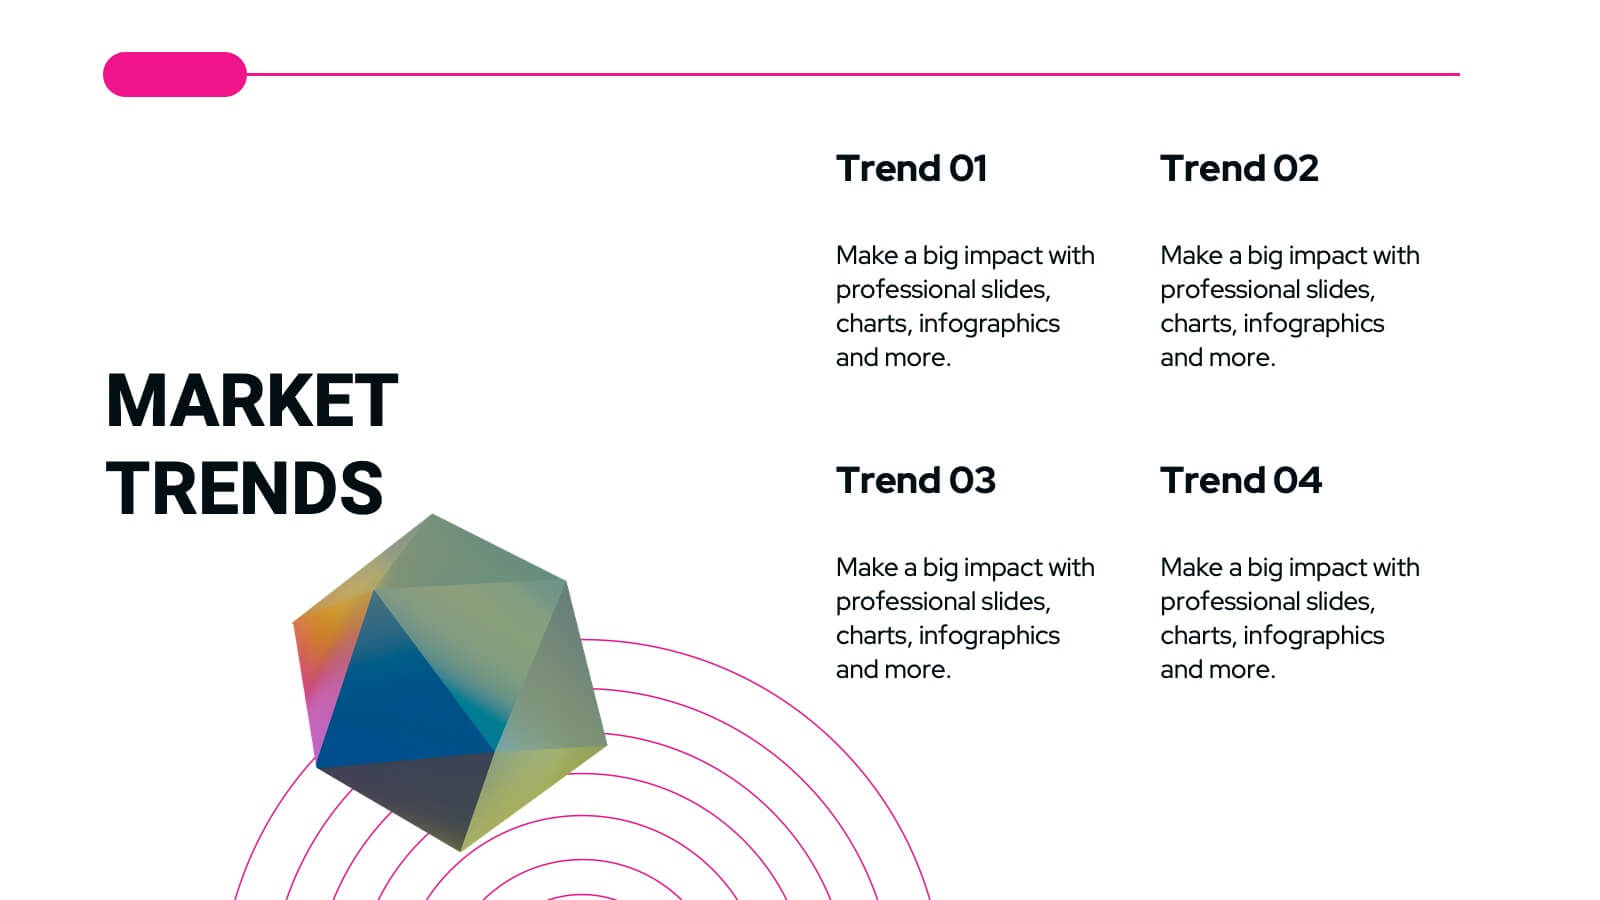
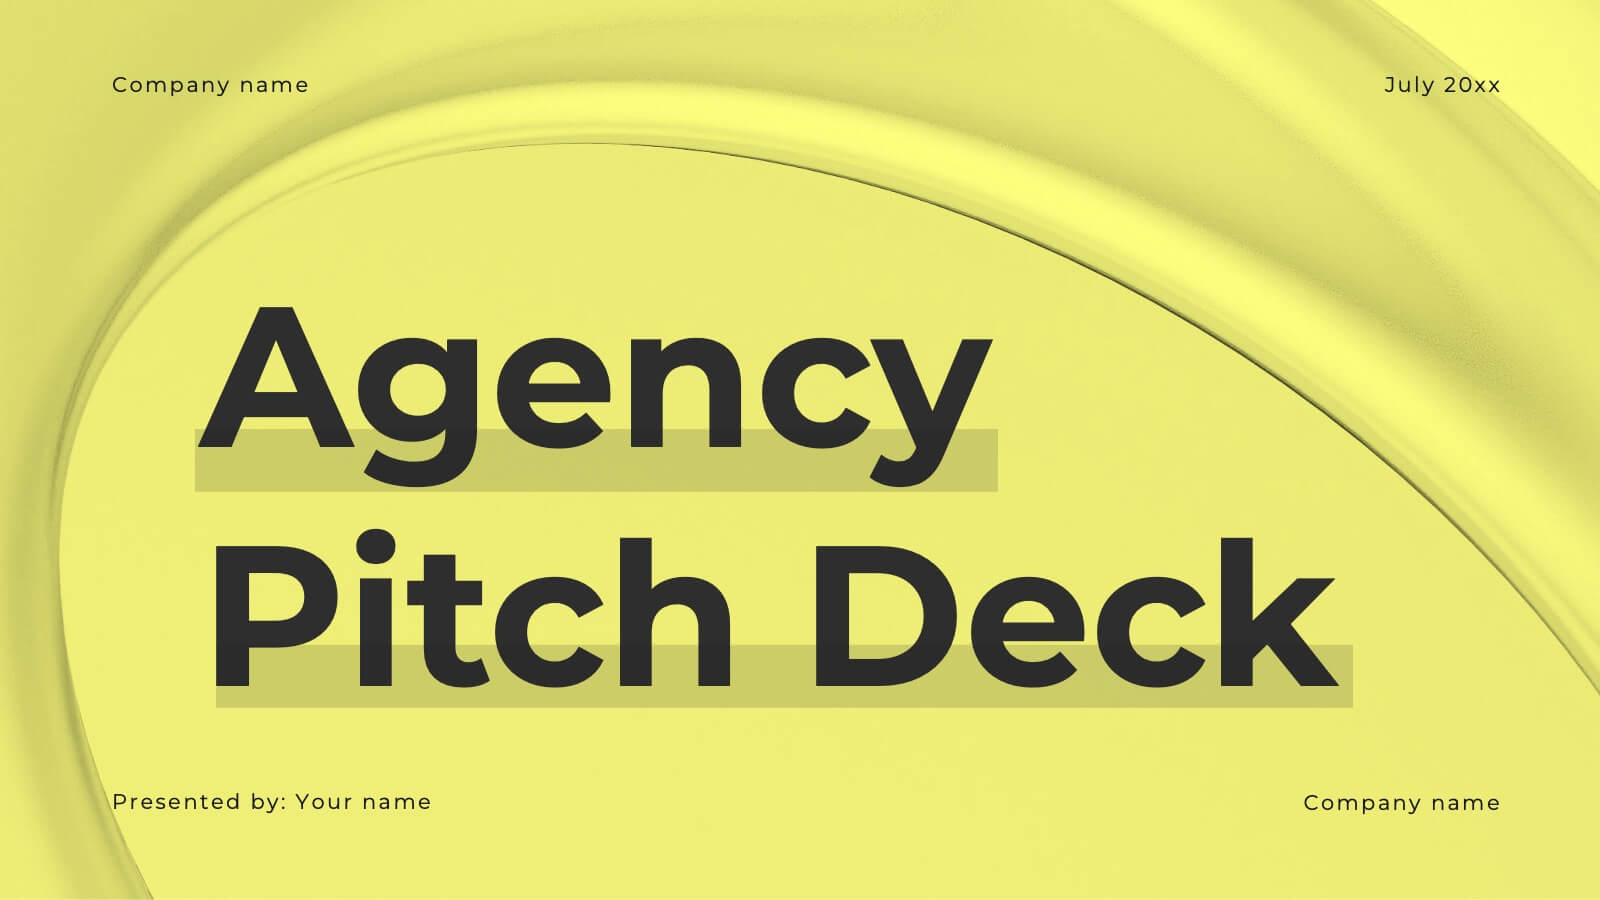
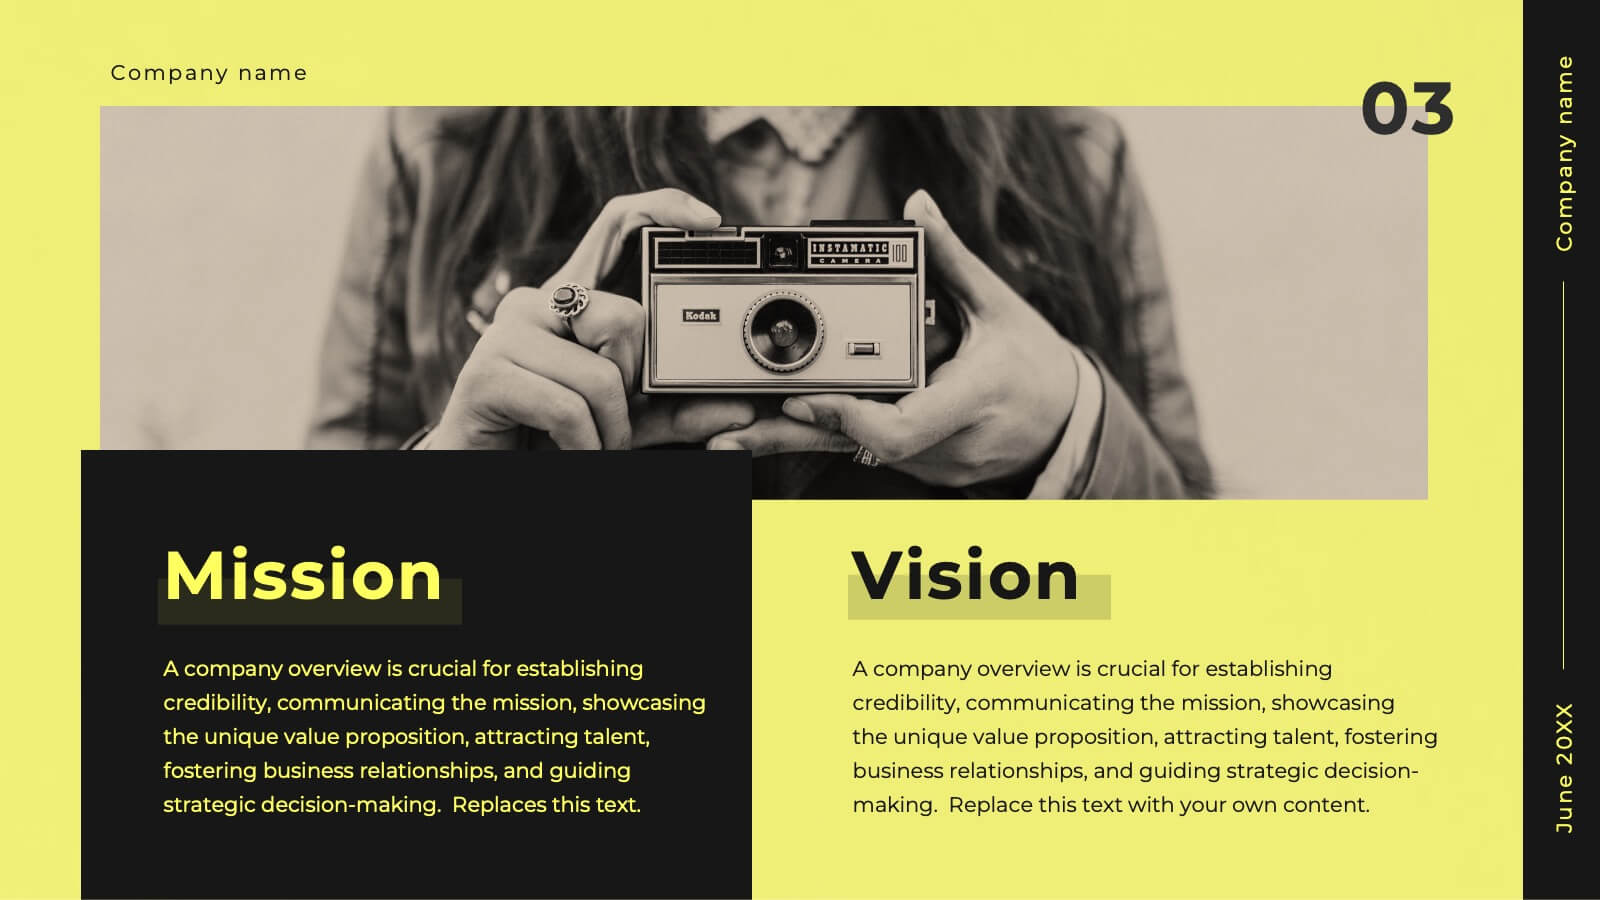
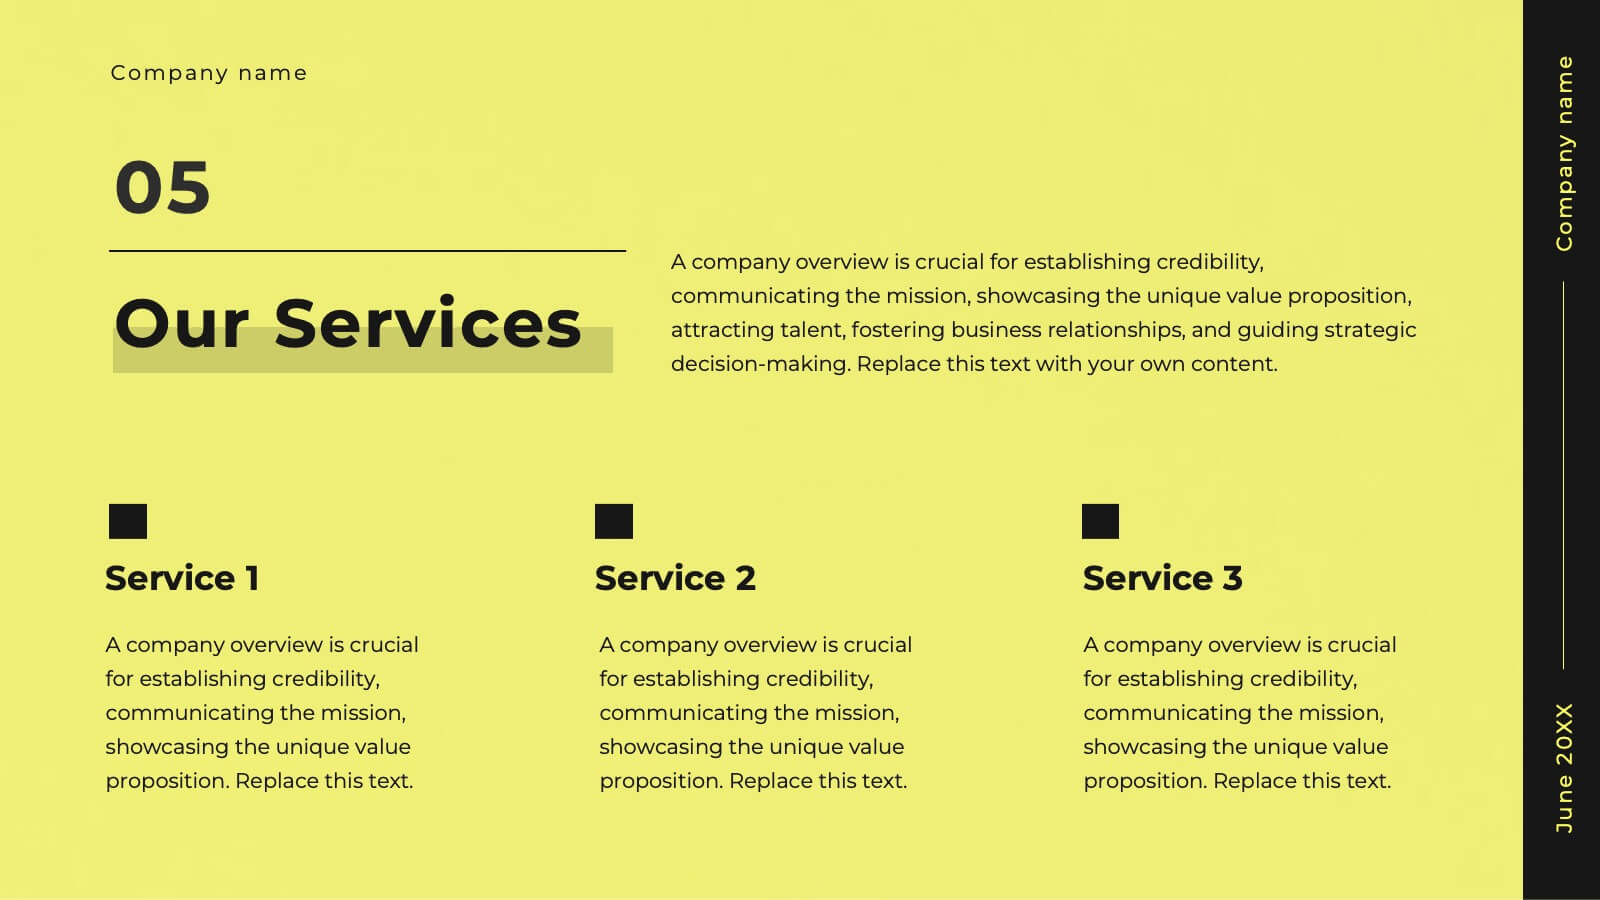
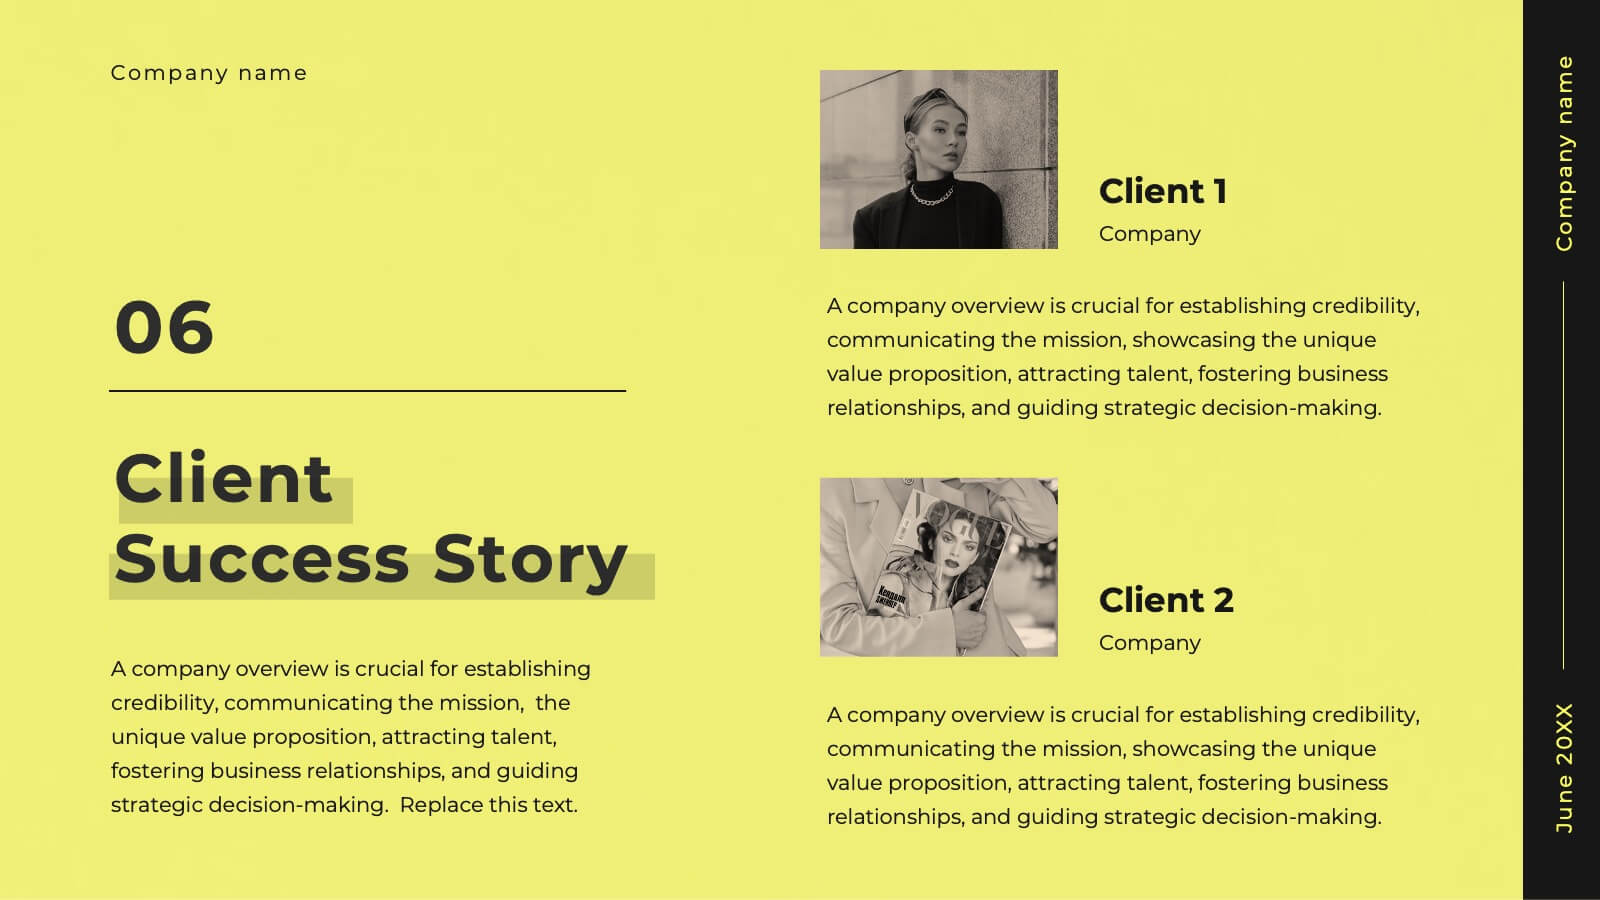
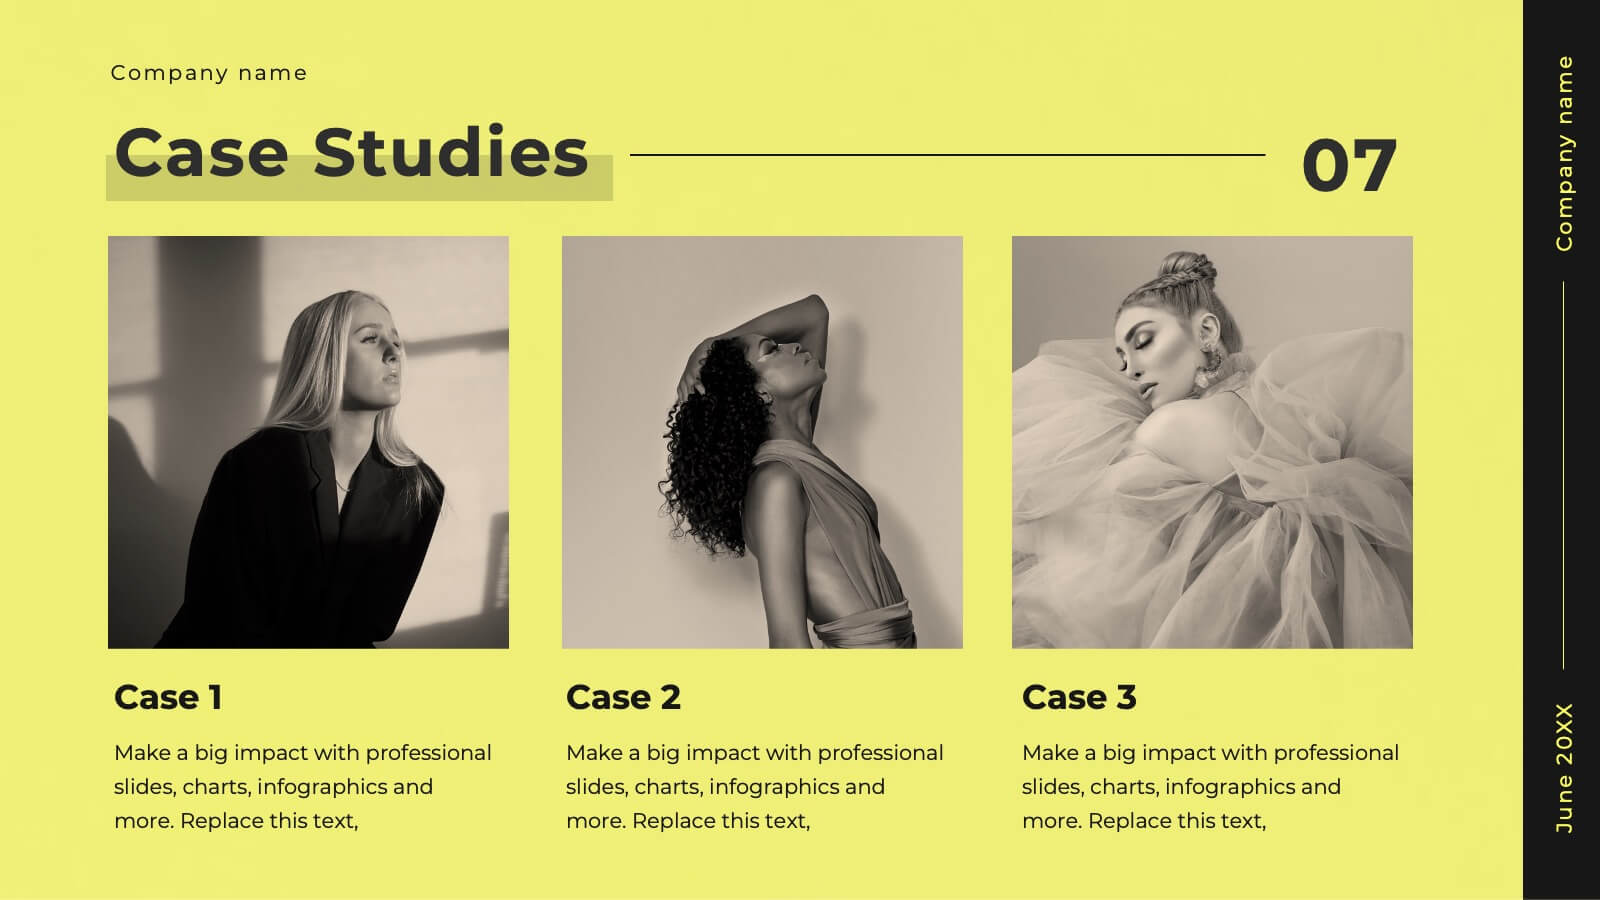
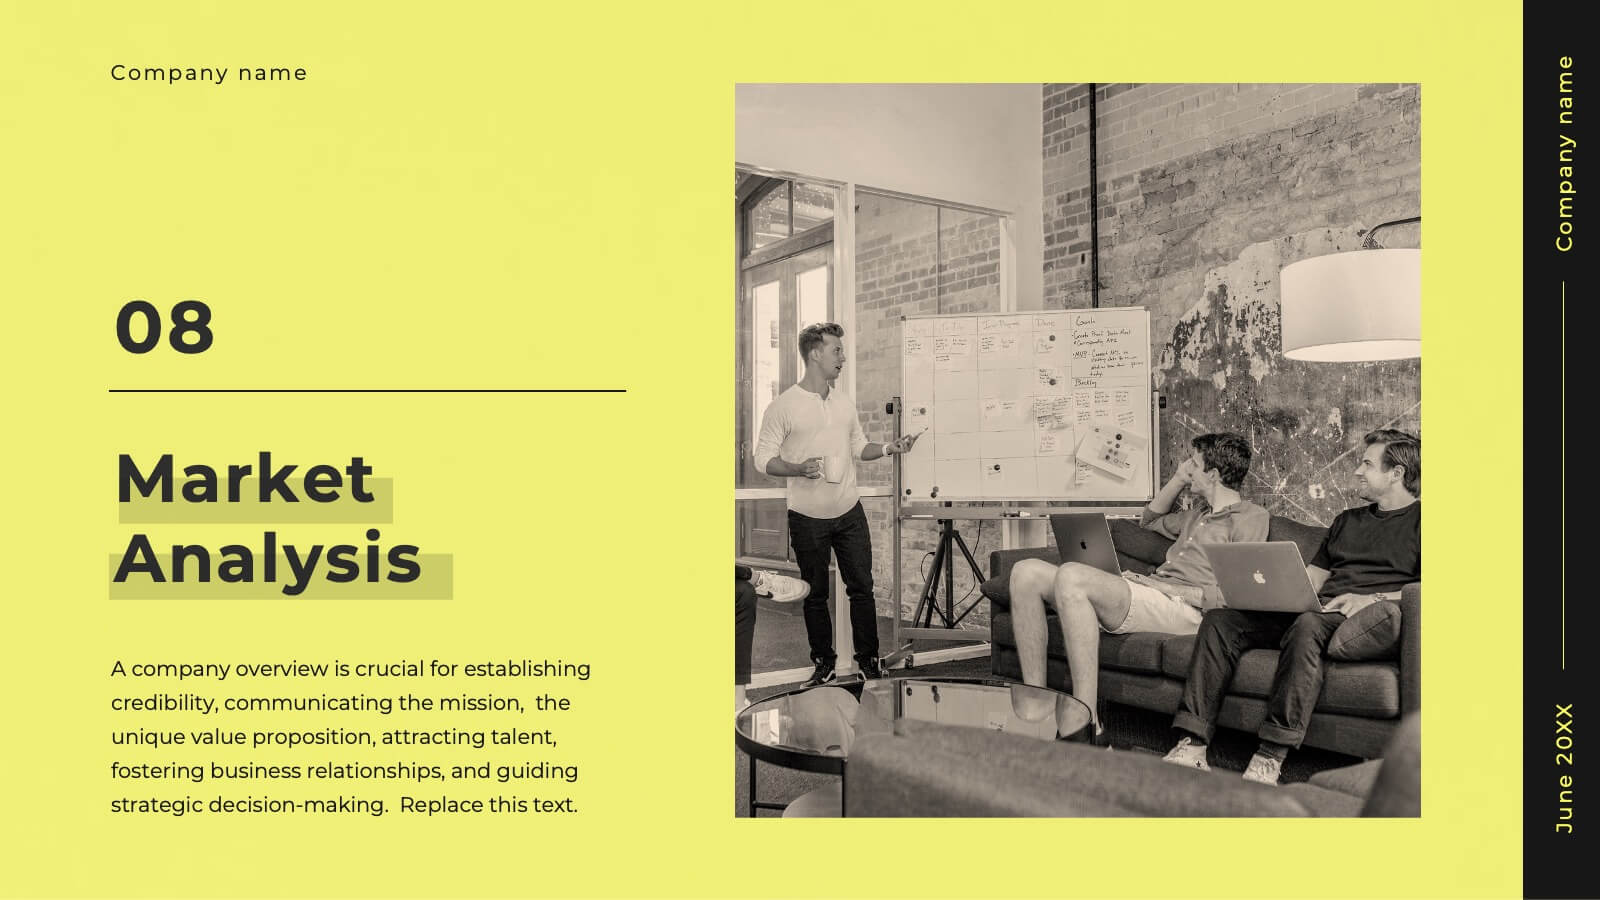
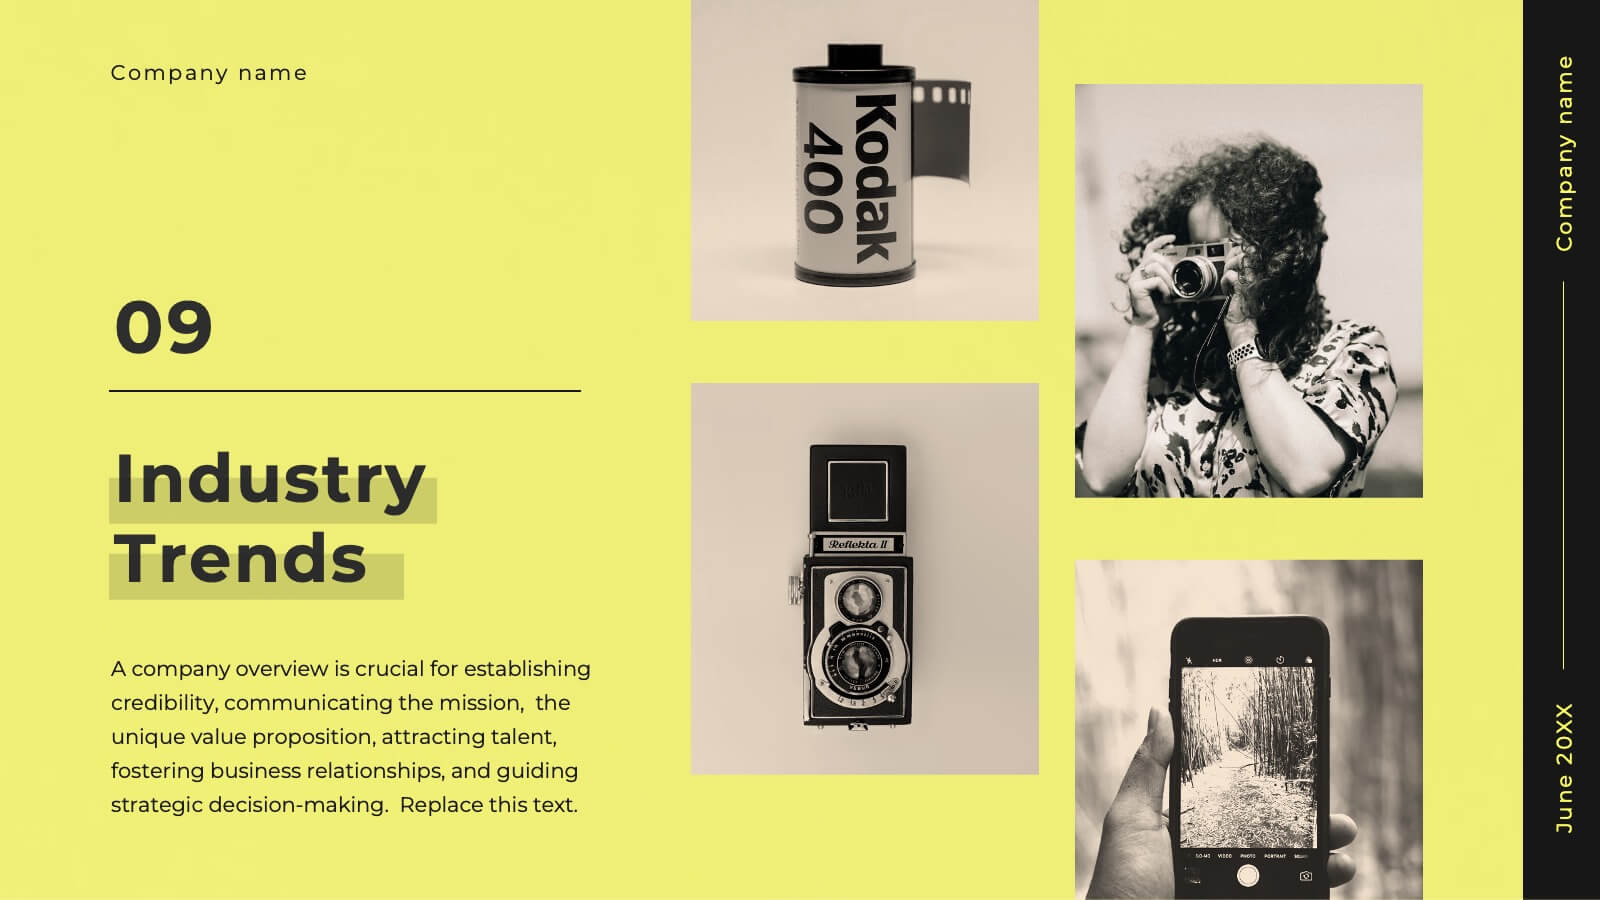
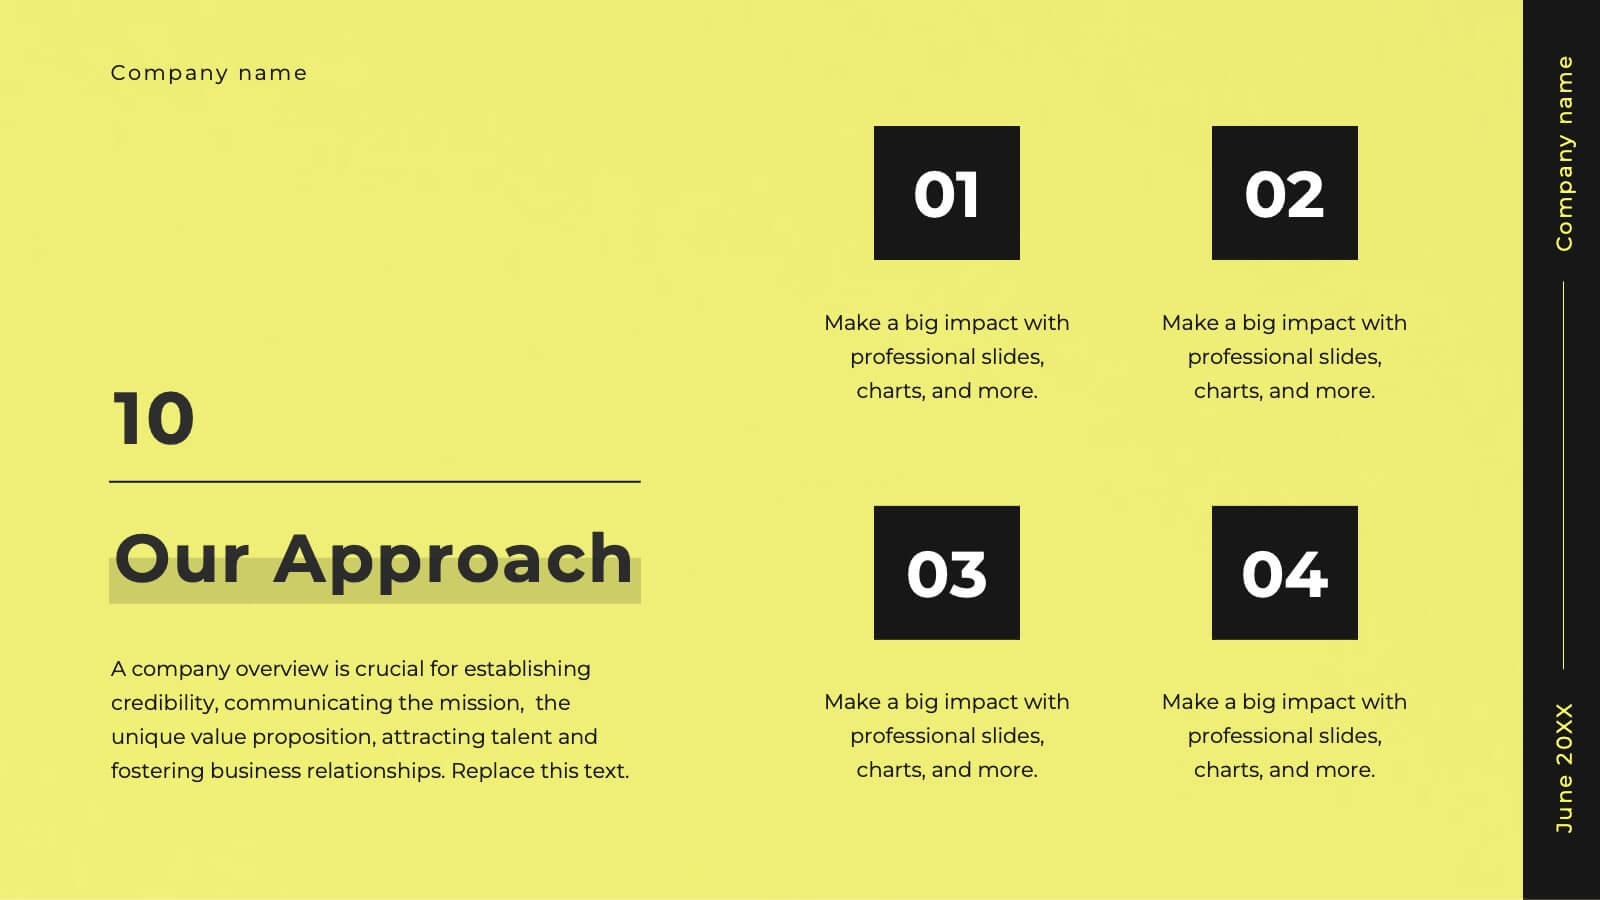
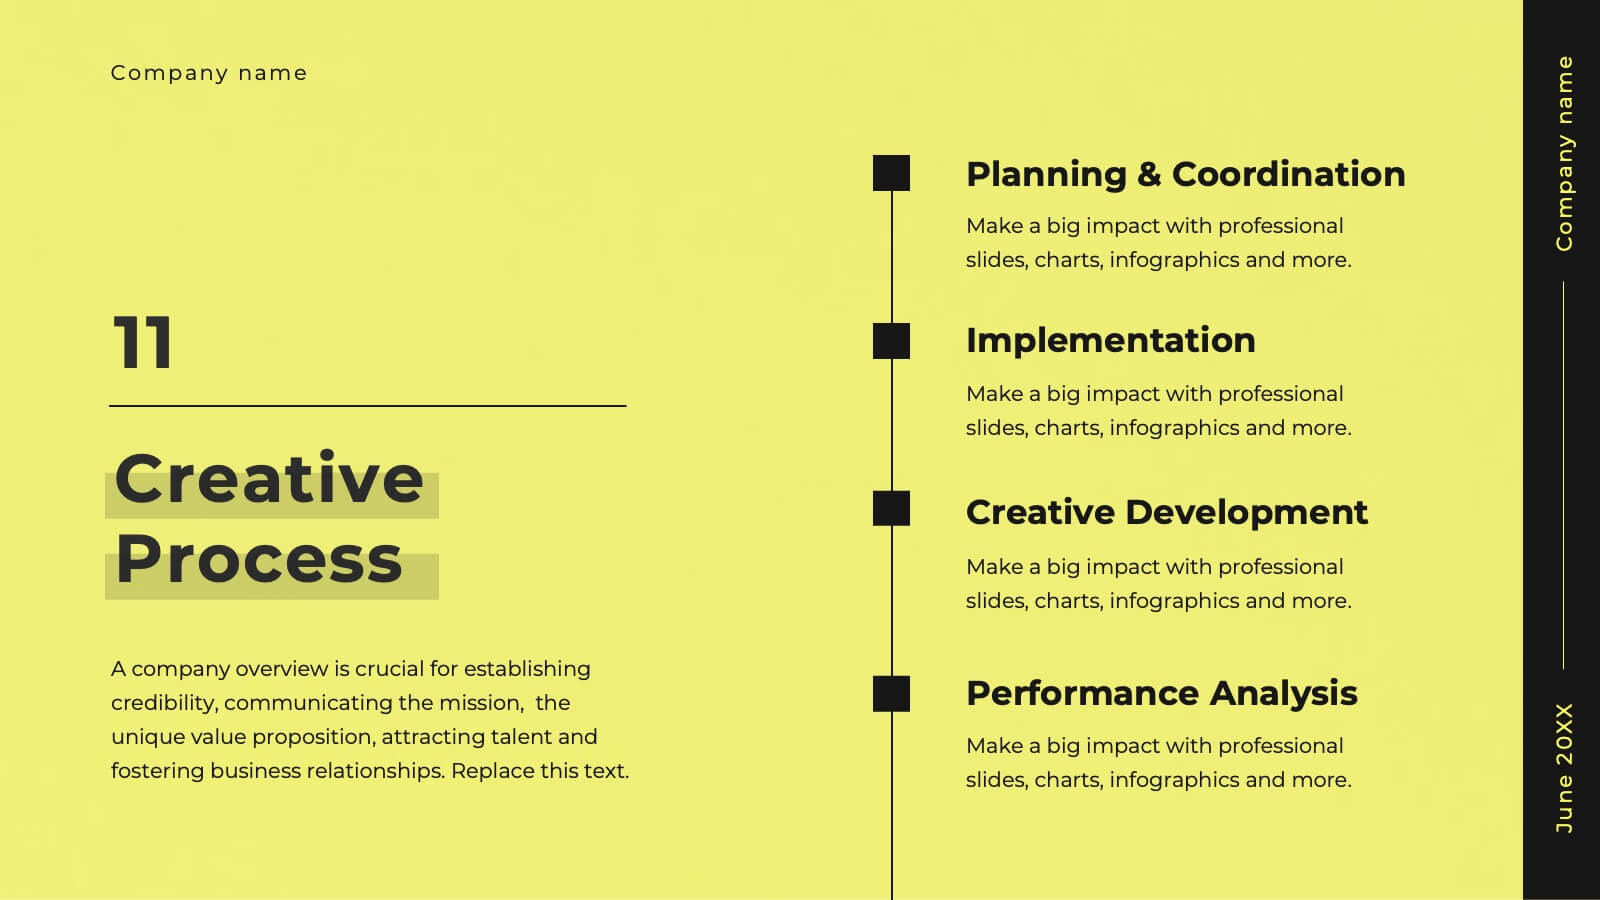
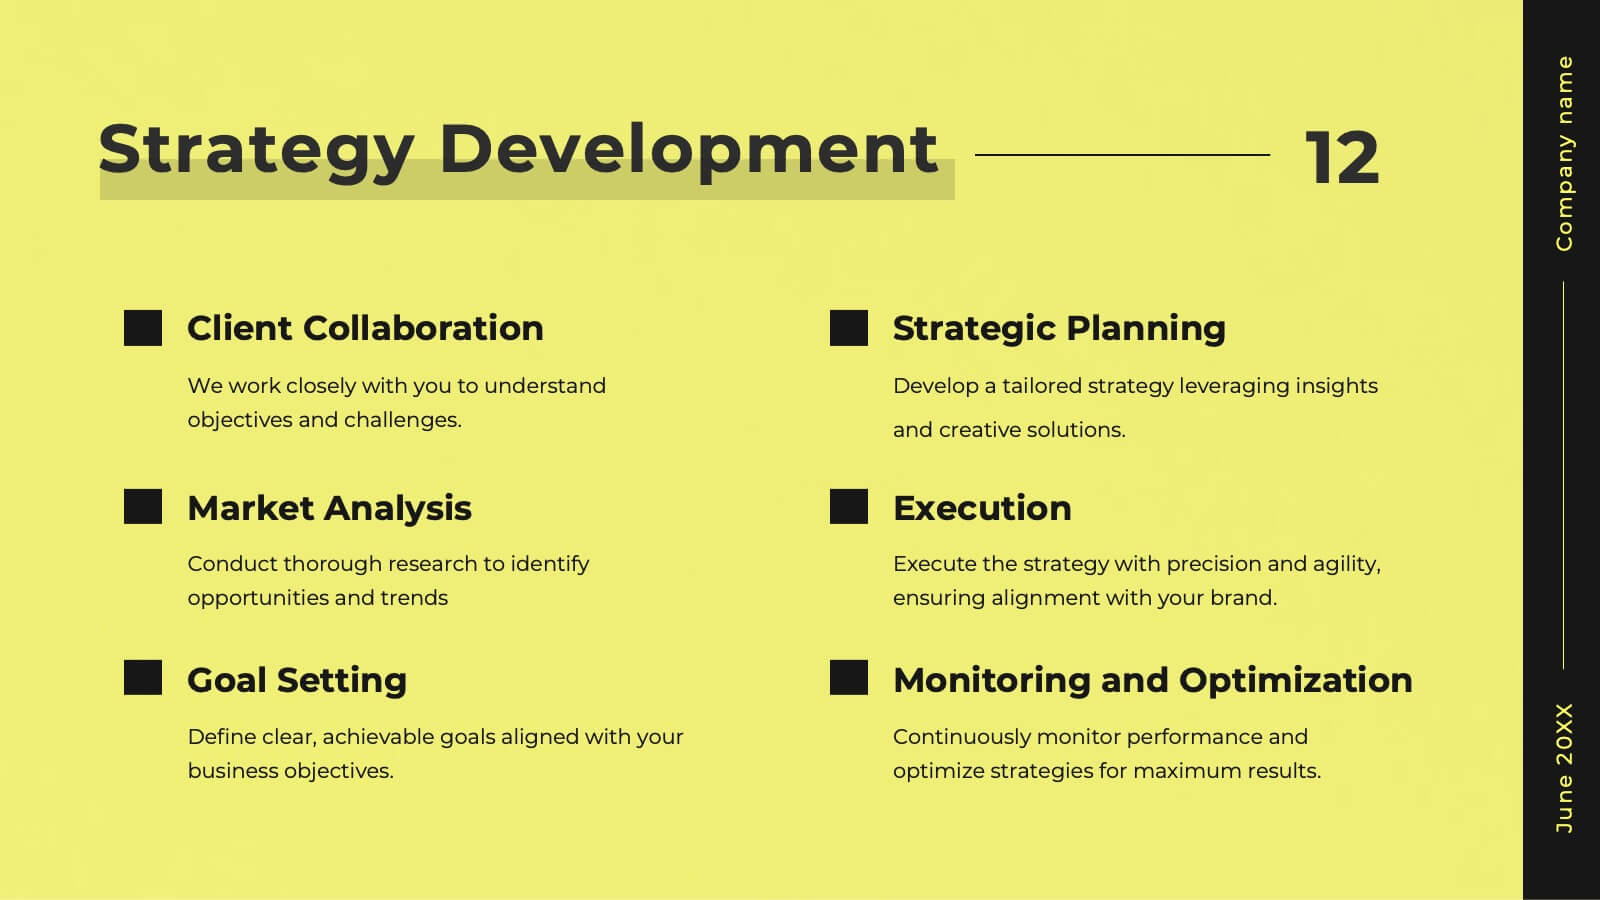
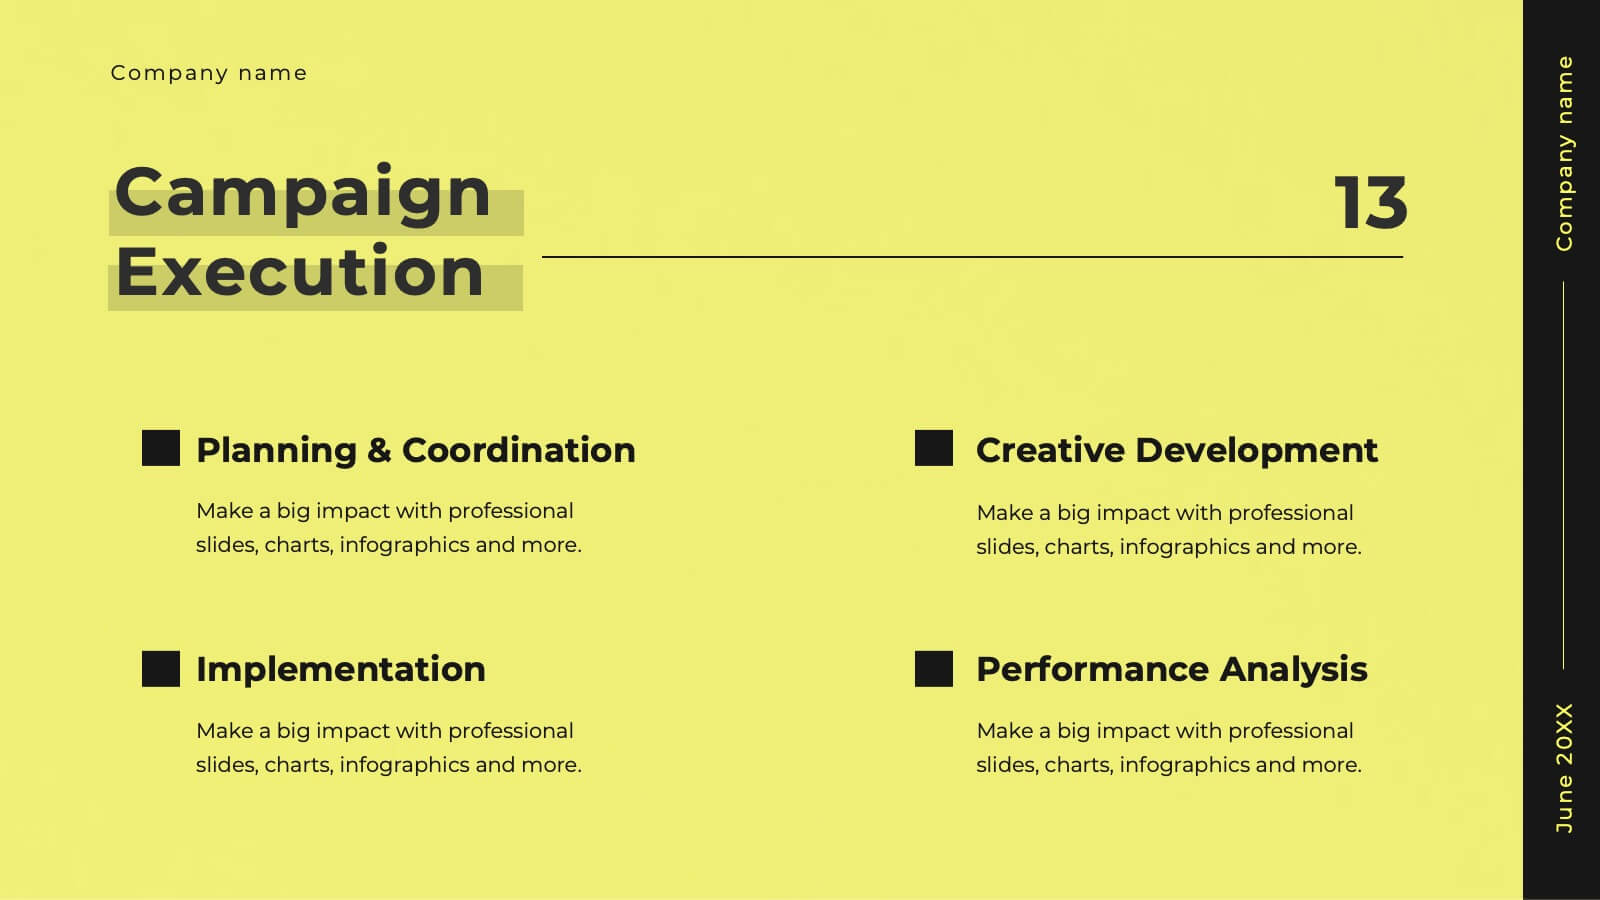
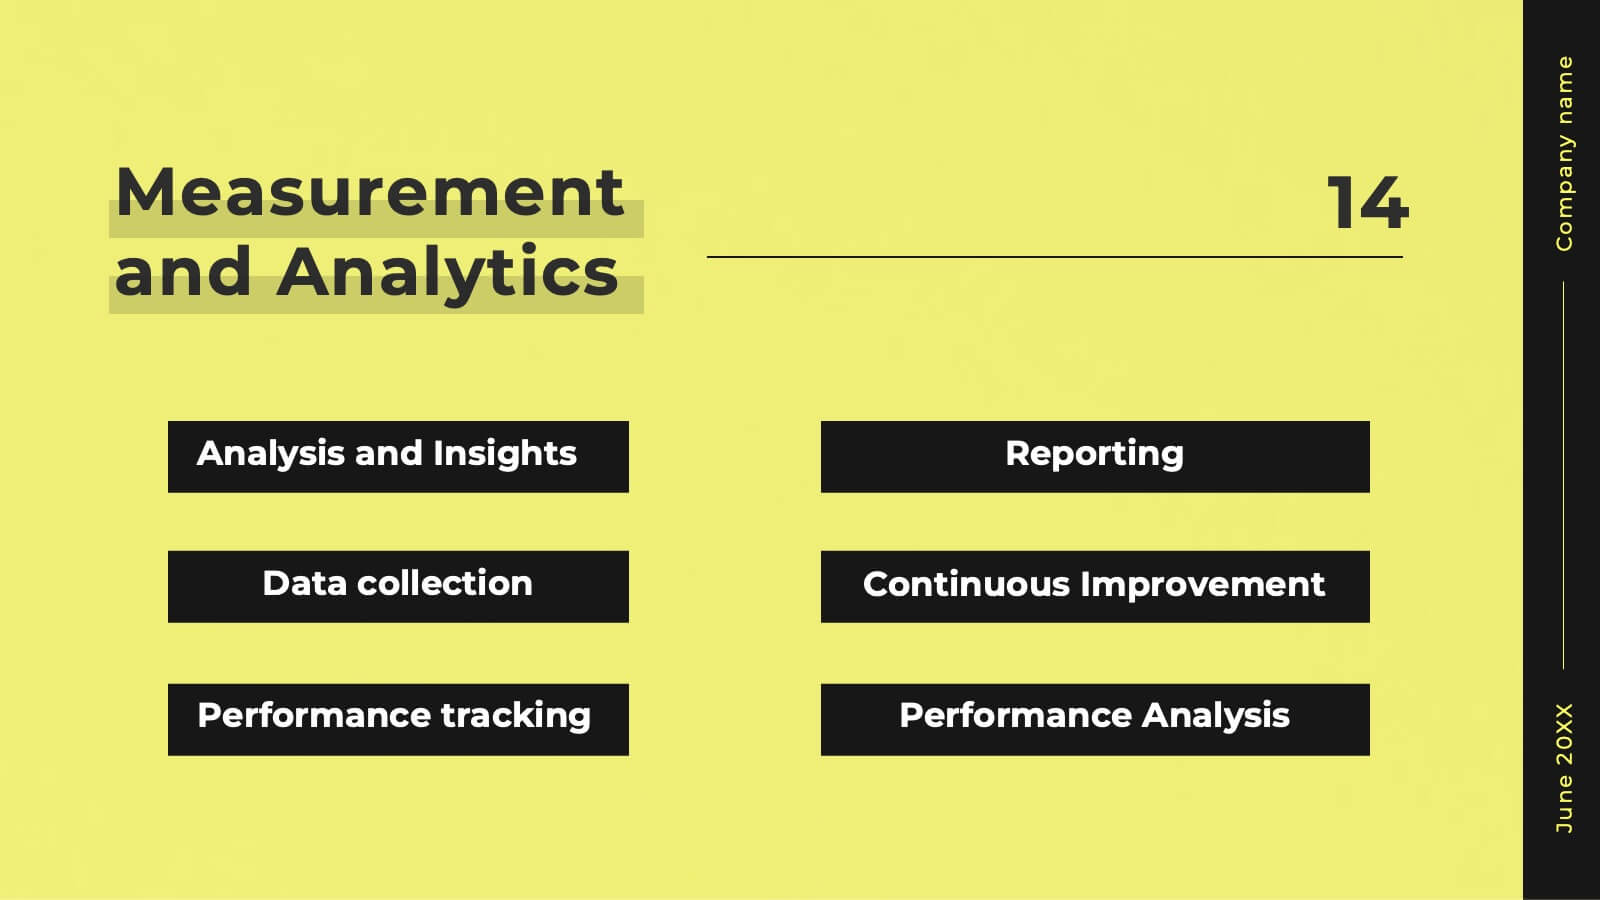
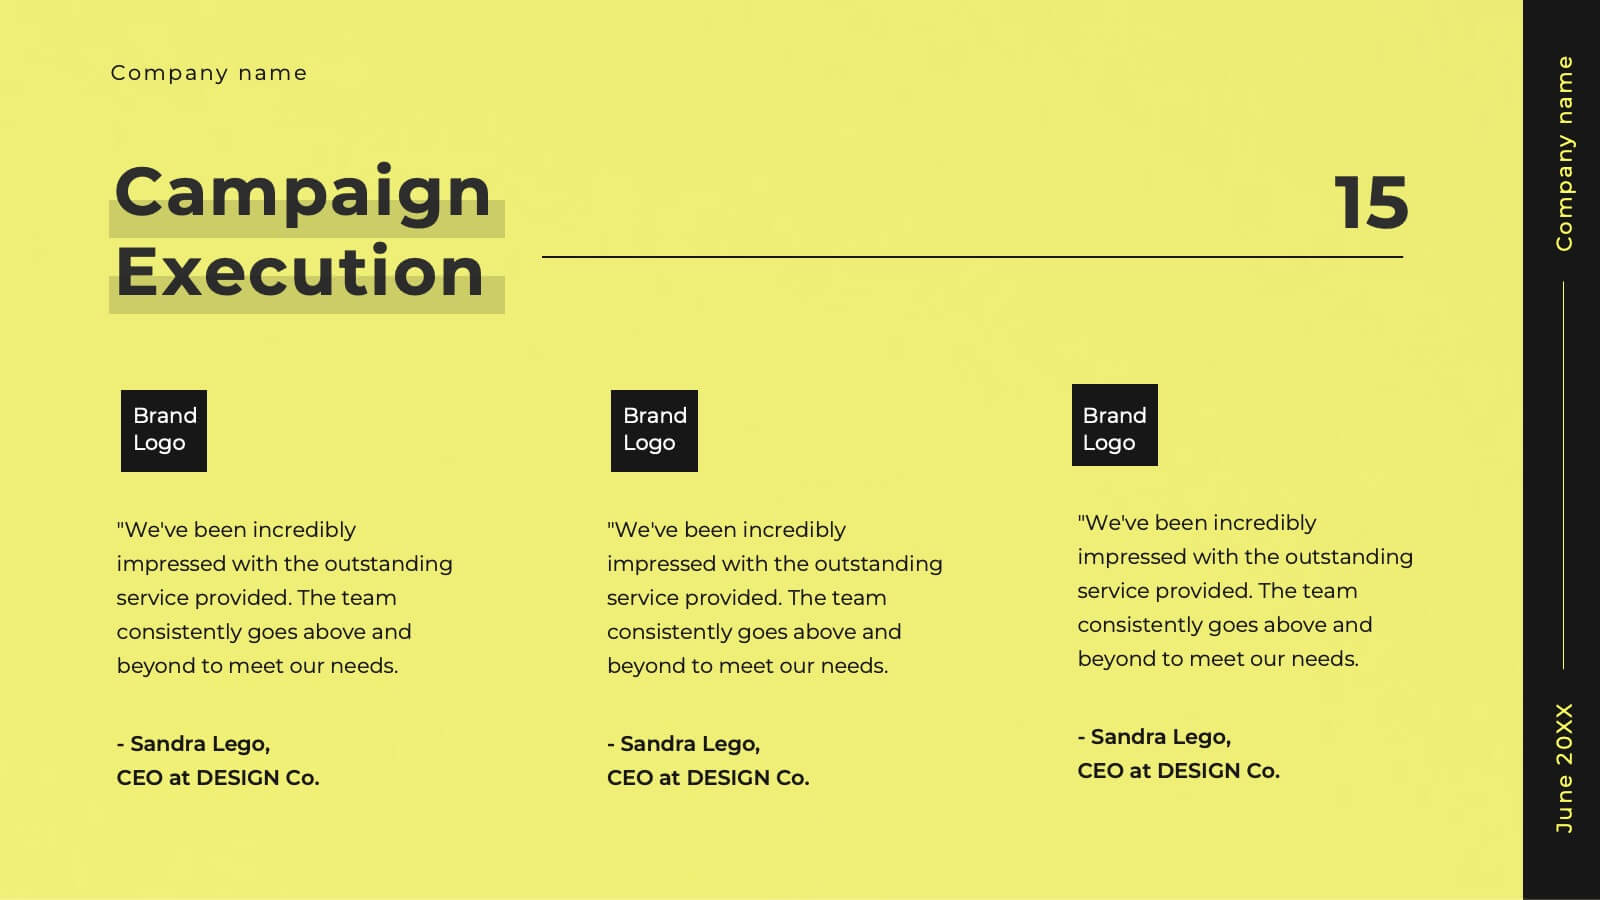
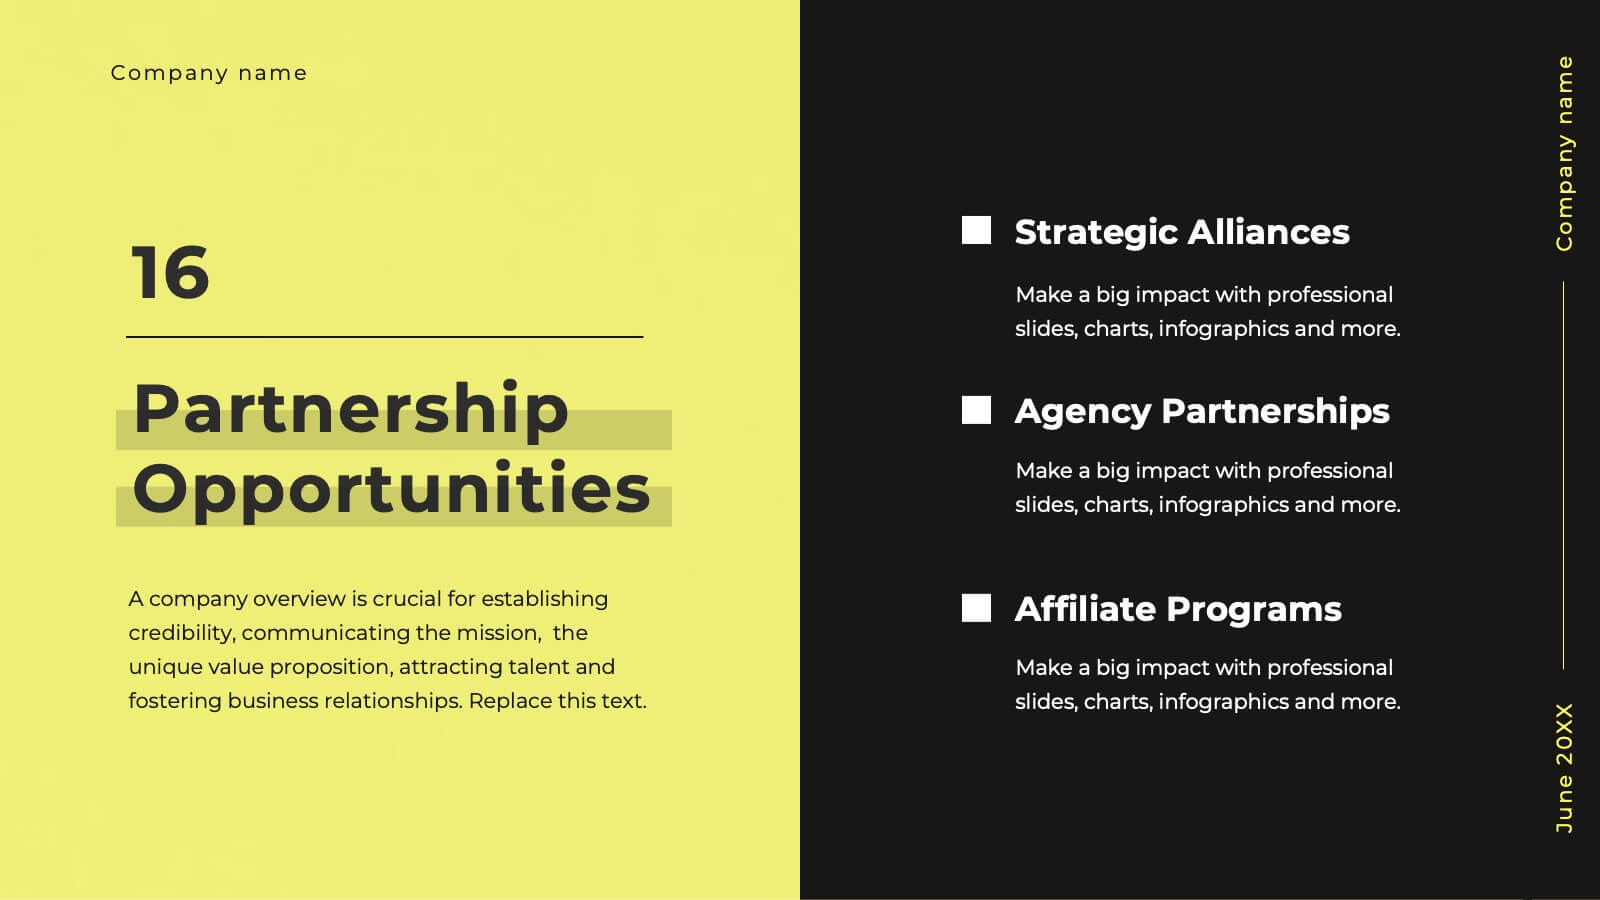
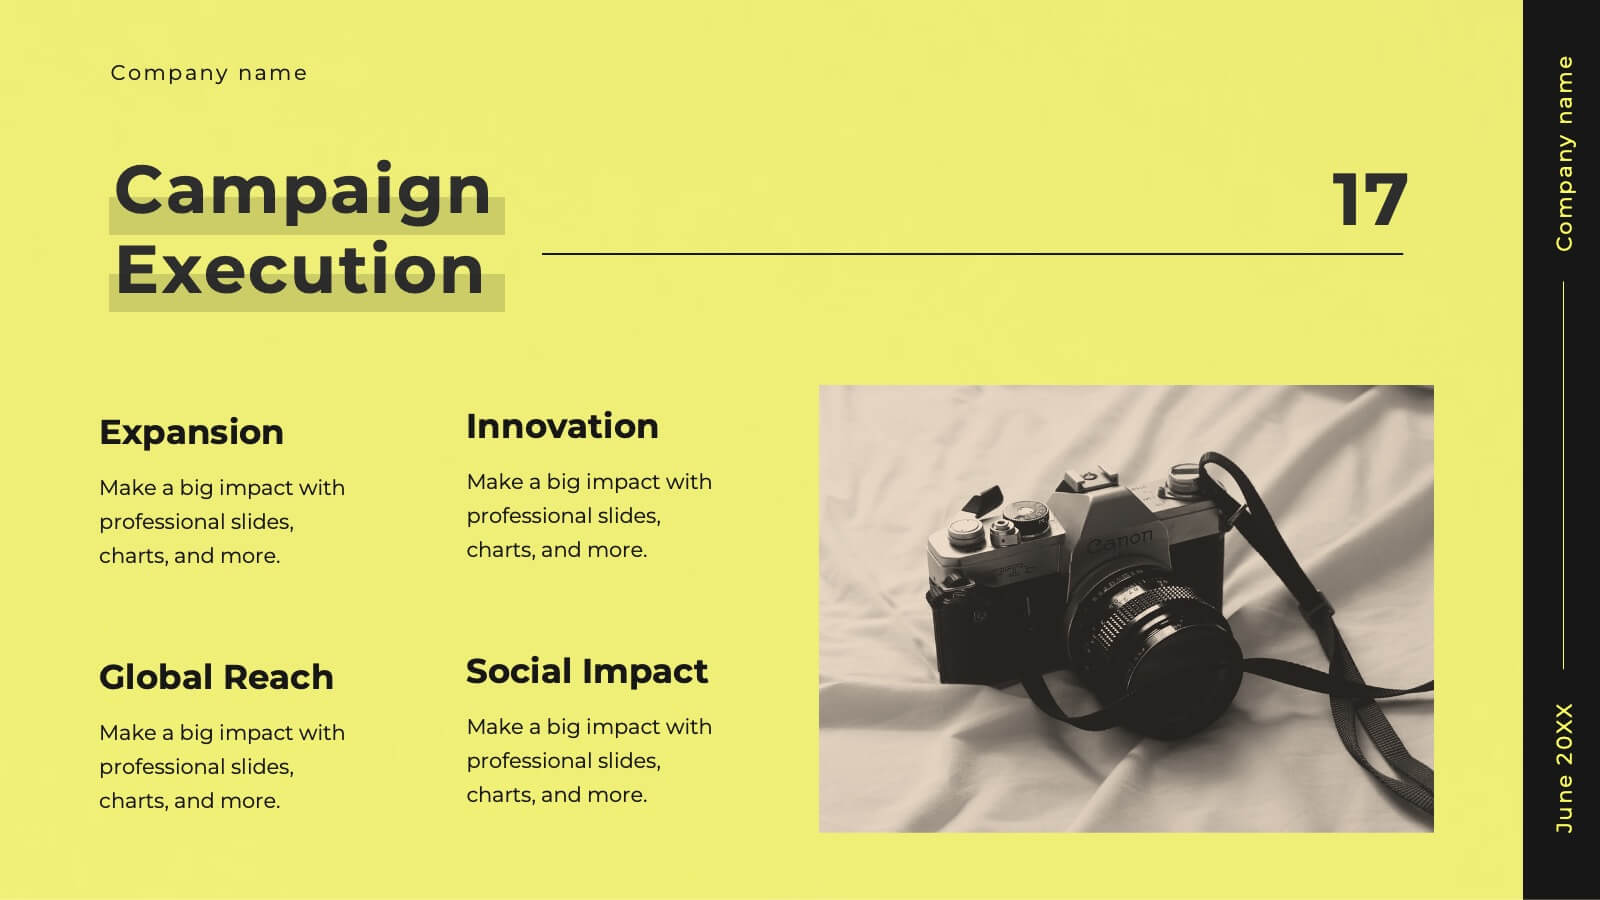
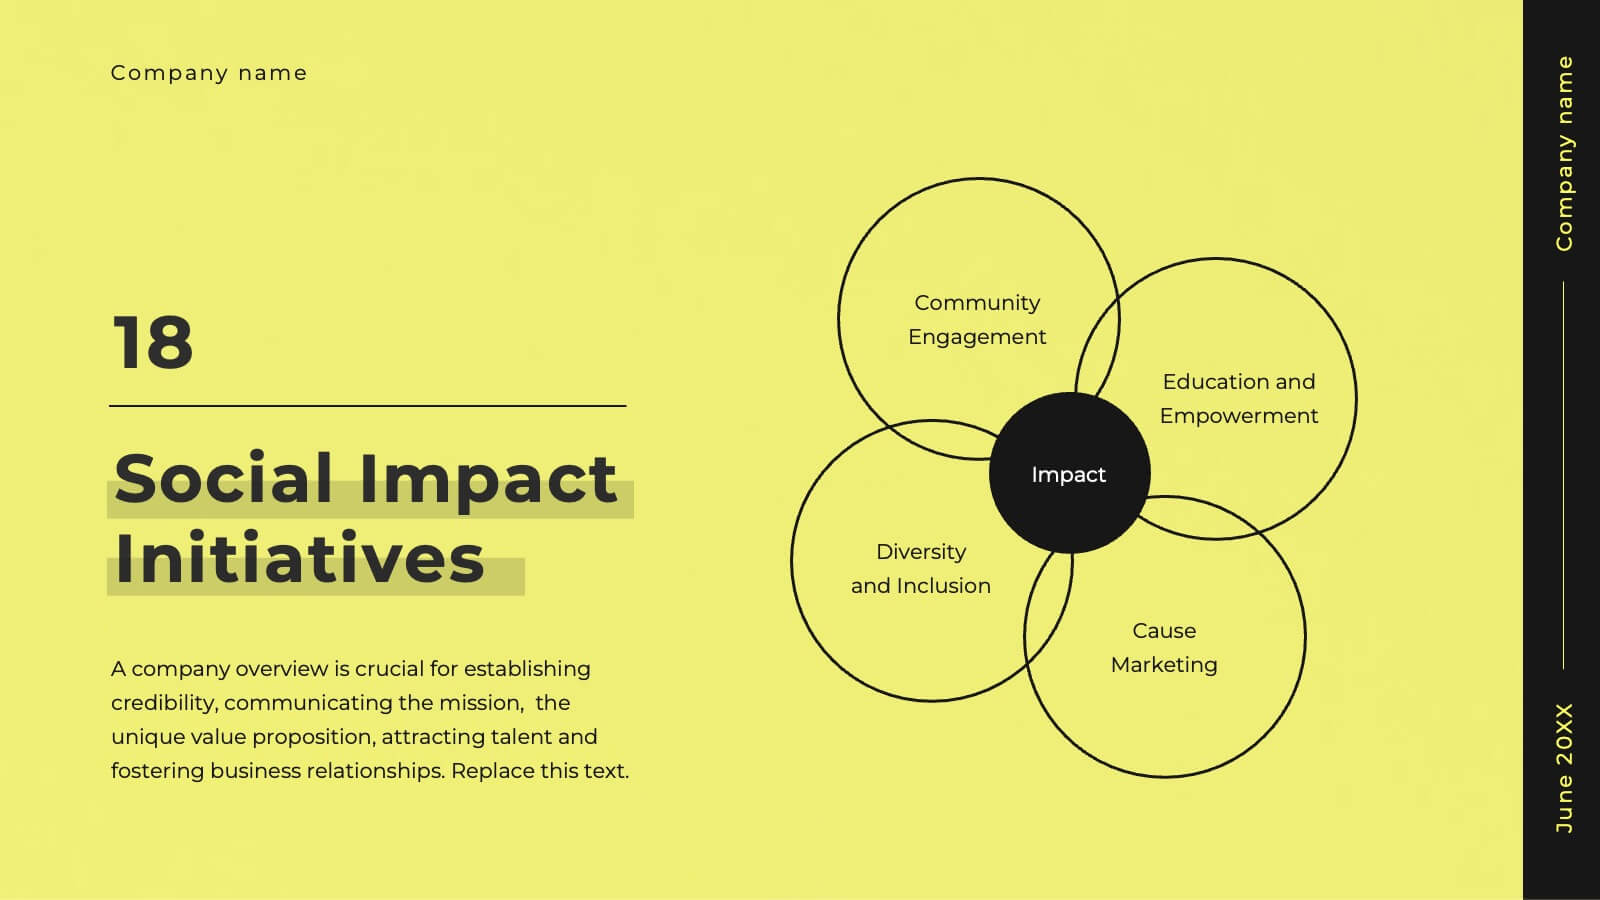
Glimmer Creative Agency Pitch Deck Presentation
Step up your game with this vibrant agency pitch deck template! Ideal for showcasing your services, client success stories, and strategic approach, it includes dynamic slides for market analysis and campaign execution. Engage potential clients with compelling visuals and well-organized content. Compatible with PowerPoint, Keynote, and Google Slides for a smooth presentation experience on any platform.